Embed Size (px)
Citation preview

The Drive for Energy DiversityThe Drive for Energy Diversityand Sustainability:and Sustainability:
The Impact on Transportation FuelsThe Impact on Transportation Fuelsand Propulsion System Portfoliosand Propulsion System Portfolios
Dr. J. Gary SmythDr. J. Gary SmythDirector, Powertrain Systems Research Lab,Director, Powertrain Systems Research Lab,General Motors R&D and Strategic Planning,General Motors R&D and Strategic Planning,Warren, MI, USAWarren, MI, USA
13th Diesel Engine-Efficiency and Emissions Research (DEER) Conference, August 2007

2
SULEV Requirement!
HC: 99.8% NOx: 99.5%
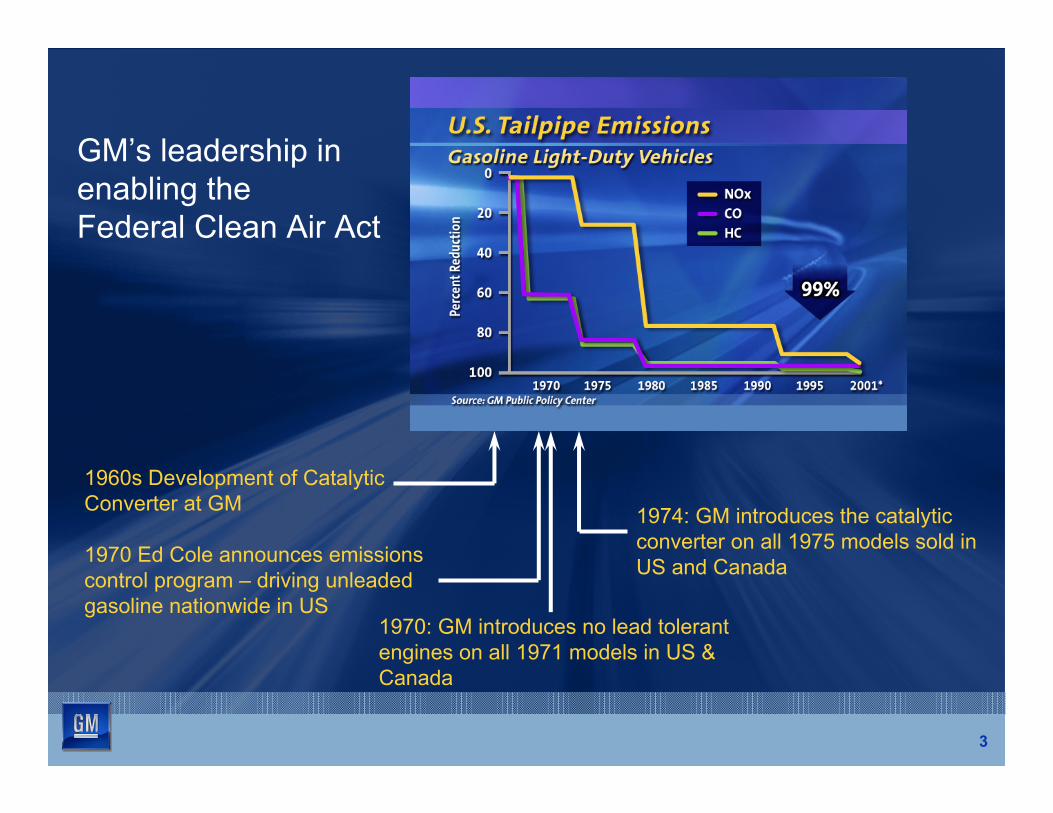
GM’s leadership in enabling the Federal Clean Air Act
1960s Development of Catalytic Converter at GM 1974: GM introduces the catalytic
converter on all 1975 models sold in 1970 Ed Cole announces emissions US and Canadacontrol program – driving unleaded gasoline nationwide in US
1970: GM introduces no lead tolerant engines on all 1971 models in US & Canada
3
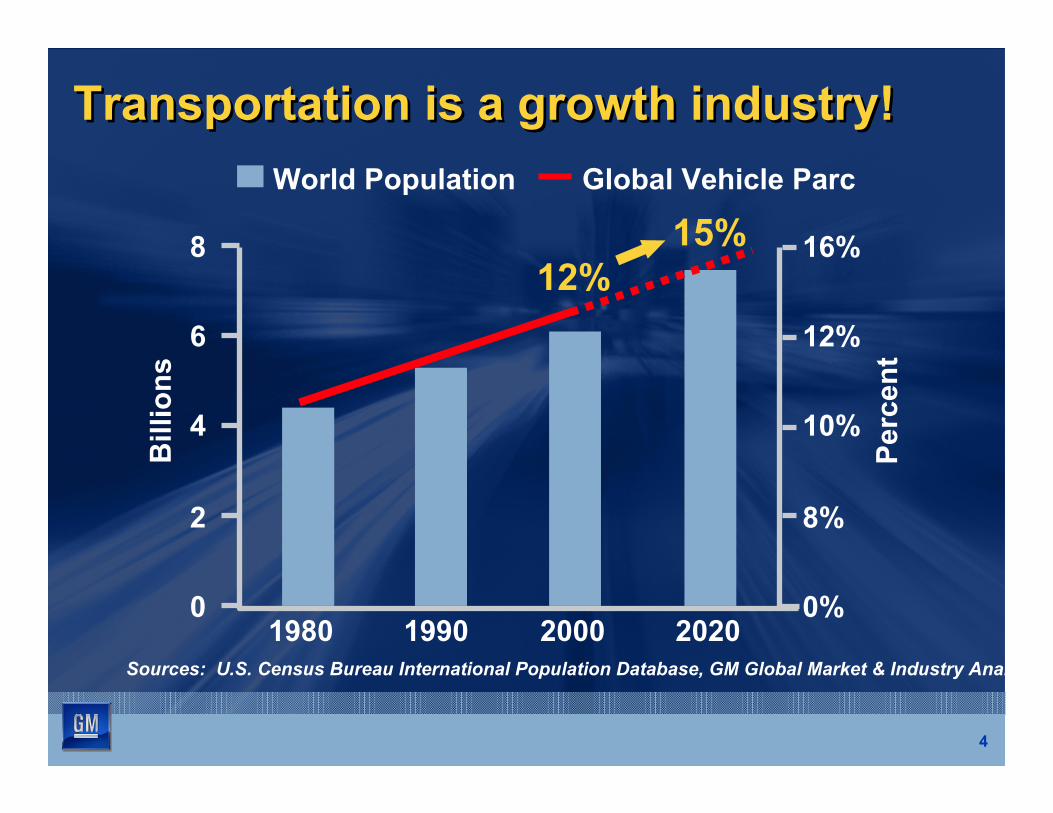
Transportation is a growth industry!Transportation is a growth industry!World Population Global Vehicle Parc
15%8 16% 12%
6
1980 1990 2000 2020
12%
Bill
ions
4
2
0
10%
8%
0%
Perc
ent
Sources: U.S. Census Bureau International Population Database, GM Global Market & Industry Anal
4
5
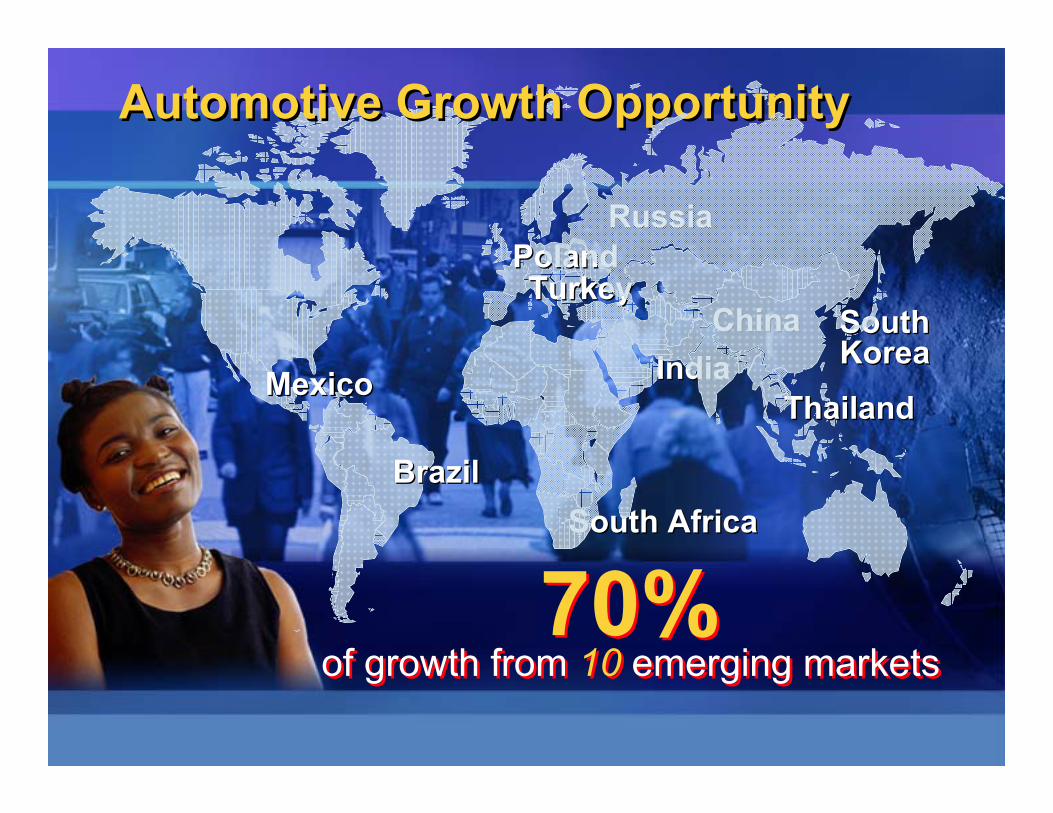
70% of growth from 10 emerging markets
70%of growth from 10 emerging markets
ChinaChina SouthSouth KoreaKoreaIndiaIndiaMexicoMexico
BrazilBrazil
PolandPolandRussiaRussia
South AfricaSouth Africa
ThailandThailand
Automotive Growth OpportunityAutomotive Growth Opportunity
TurkeyTurkey
6
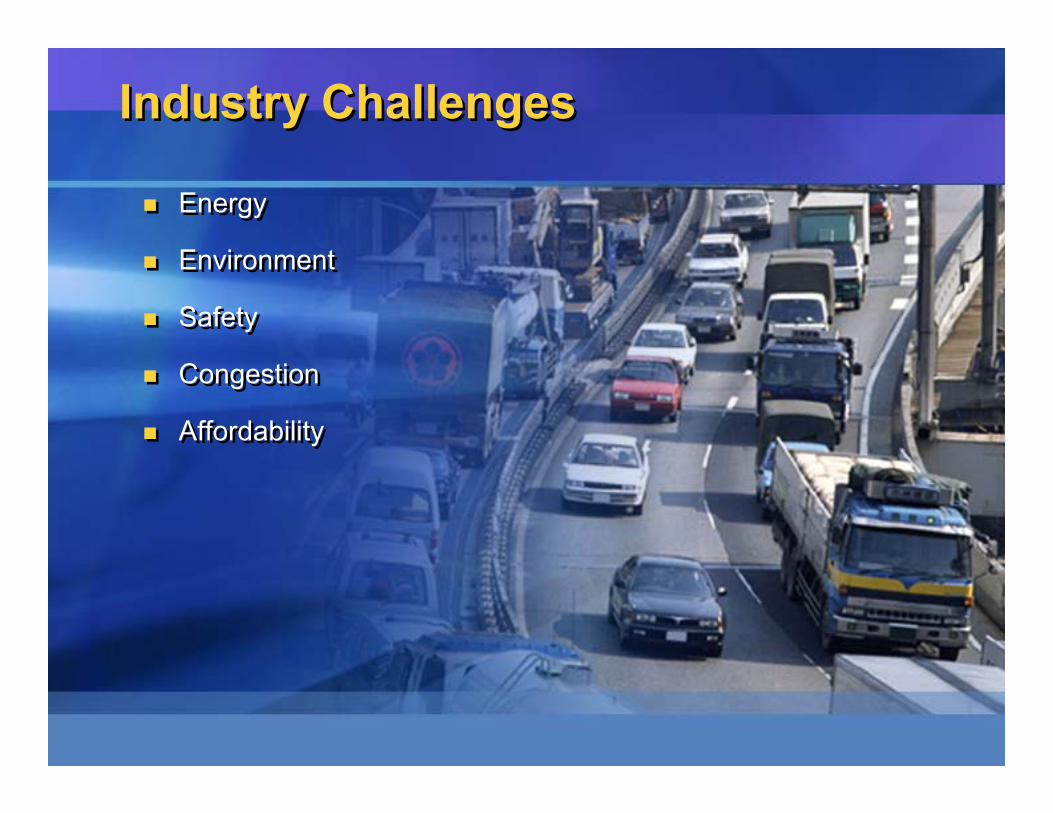
Industry ChallengesIndustry Challenges
� Energy
� Environment
� Safety
� Congestion
� Affordability
� Energy
� Environment
� Safety
� Congestion
� Affordability
7
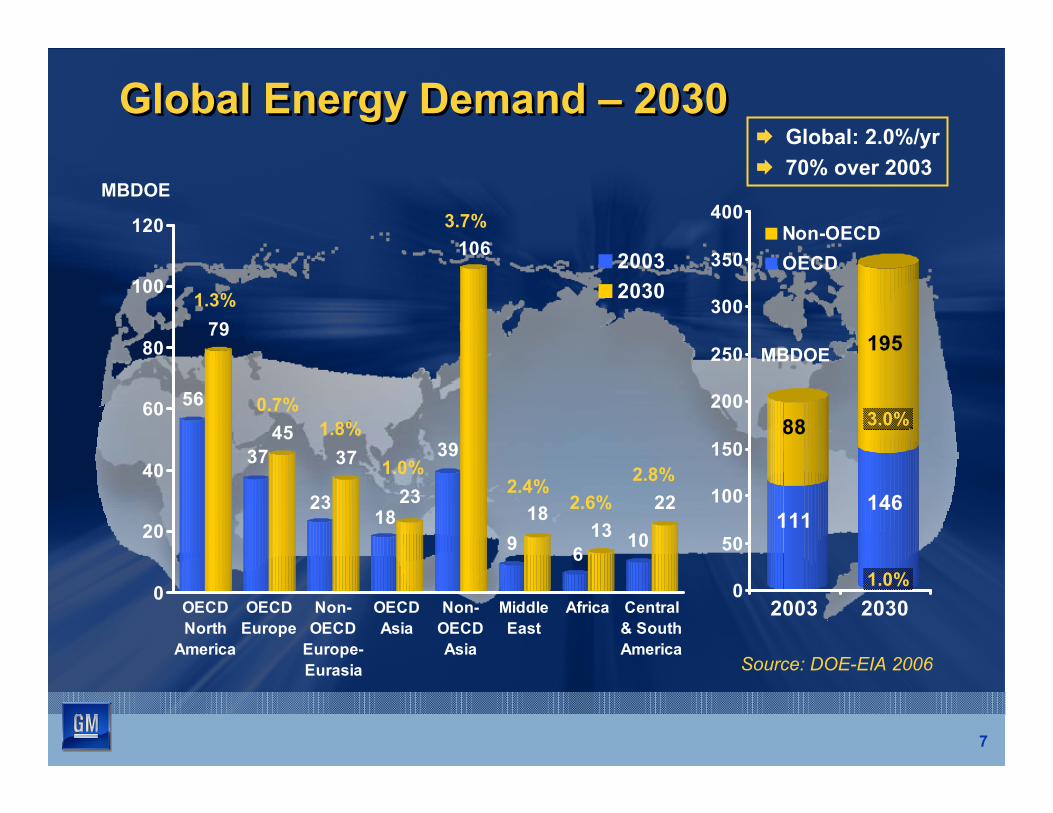
111
88
146
195
0
50
100
150
200
250
300
350
400
2003 2030
Non-OECD OECD
56
79
37 45
23
37
18 23
39
106
9 18
6 13 10
22
0
20
40
60
80
100
120
OECD North
America
OECD Europe
Non-OECD
Europe-Eurasia
OECD Asia
Non-OECD Asia
Middle East
Africa Central & South America
2003 2030
Global Energy Demand – 2030Global Energy Demand – 2030
1.3%
0.7% 1.8%
1.0%
3.7%
2.4% 2.6%
2.8%
3.0%
1.0%
¨ Global: 2.0%/yr ¨ 70% over 2003
MBDOE
MBDOE
Source: DOE-EIA 2006
8
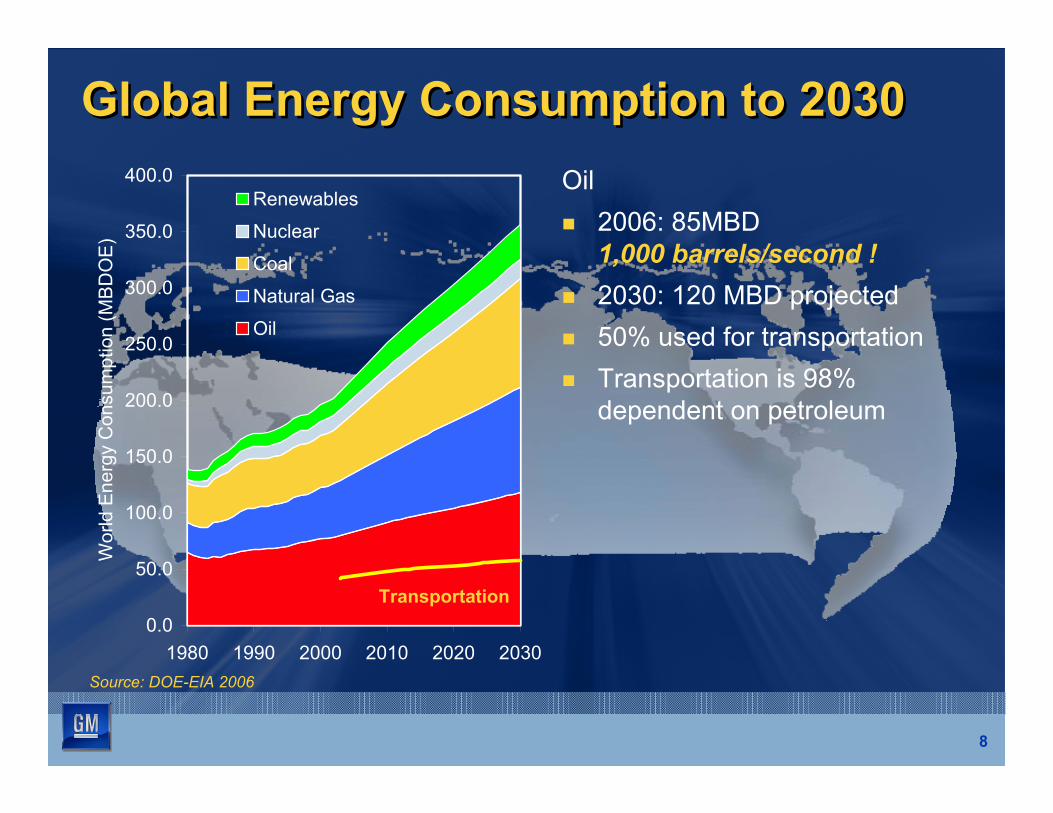
Global Energy Consumption to 2030Global Energy Consumption to 2030Oil � 2006: 85MBD
1,000 barrels/second ! � 2030: 120 MBD projected � 50% used for transportation � Transportation is 98%
dependent on petroleum
0.0
50.0
100.0
150.0
200.0
250.0
300.0
350.0
400.0
1980 1990 2000 2010 2020 2030
Wor
ld E
nerg
y C
onsu
mpt
ion
(MB
DO
E)
Renewables
Nuclear
Coal
Natural Gas
Oil
Transportation
Source: DOE-EIA 2006
9
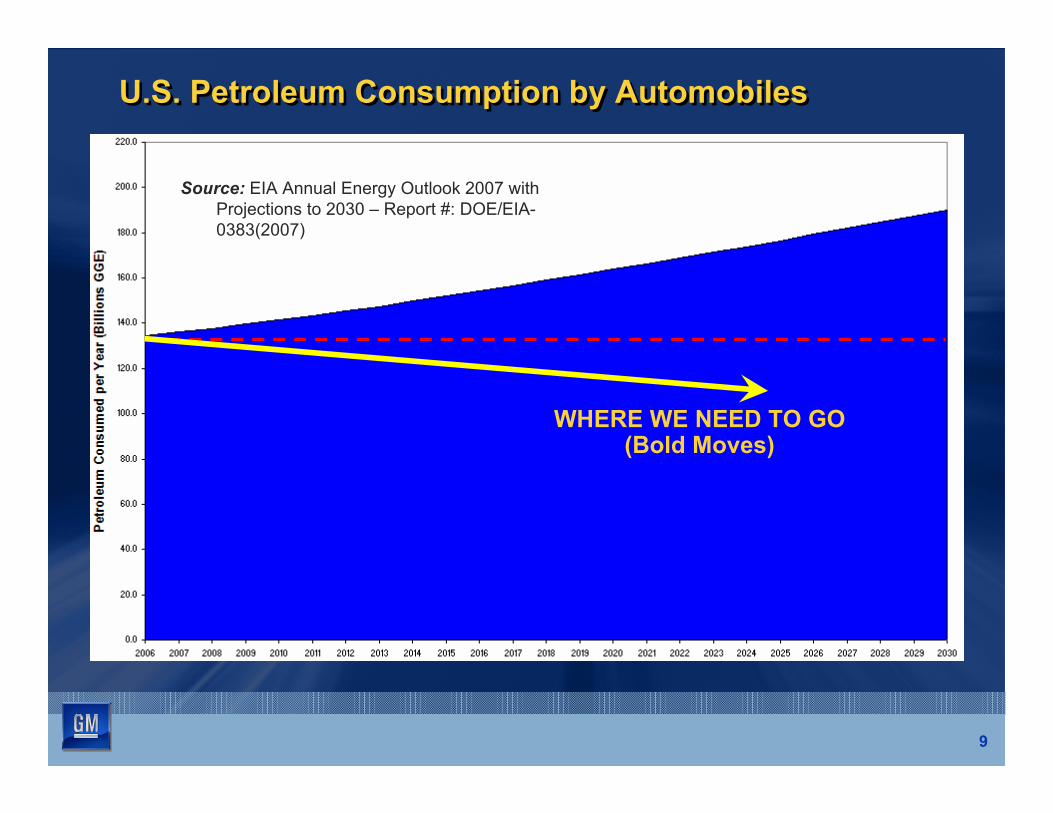
U.S. Petroleum Consumption by AutomobilesU.S. Petroleum Consumption by Automobiles
Source: EIA Annual Energy Outlook 2007 with Projections to 2030 – Report #: DOE/EIA-0383(2007)
WHERE WE NEED TO GO (Bold Moves)

10

11
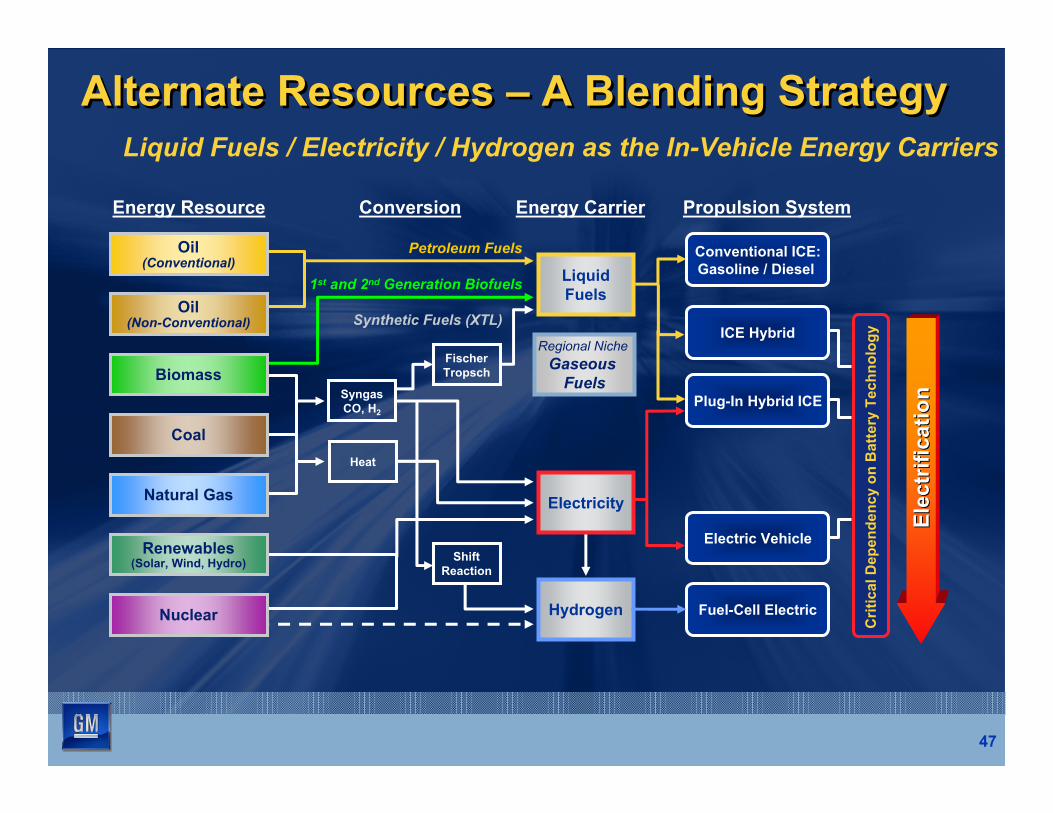
Fuel-Cell ElectricHydrogen
Shift Reaction
Electricity
Heat
Renewables (Solar, Wind, Hydro)
Nuclear
Energy Carrier Propulsion SystemConversion
Elec
trifi
catio
nEl
ectr
ifica
tion
Energy Resource
ICE Hybrid
Conventional ICE: Gasoline / DieselLiquid
Fuels
Petroleum FuelsOil (Conventional)
Oil (Non-Conventional) Synthetic Fuels (XTL)
Syngas CO, H2
Fischer Tropsch
Coal
Natural Gas
1st and 2nd Generation Biofuels
Biomass
Liquid Fuels / Electricity / Hydrogen as the In-Vehicle Energy Carriers
Regional Niche Gaseous
Fuels
Crit
ical
Dep
ende
ncy
on B
atte
ry T
echn
olog
y
Plug-In Hybrid ICE
Electric Vehicle
Alternate Resources – A Blending StrategyAlternate Resources – A Blending Strategy
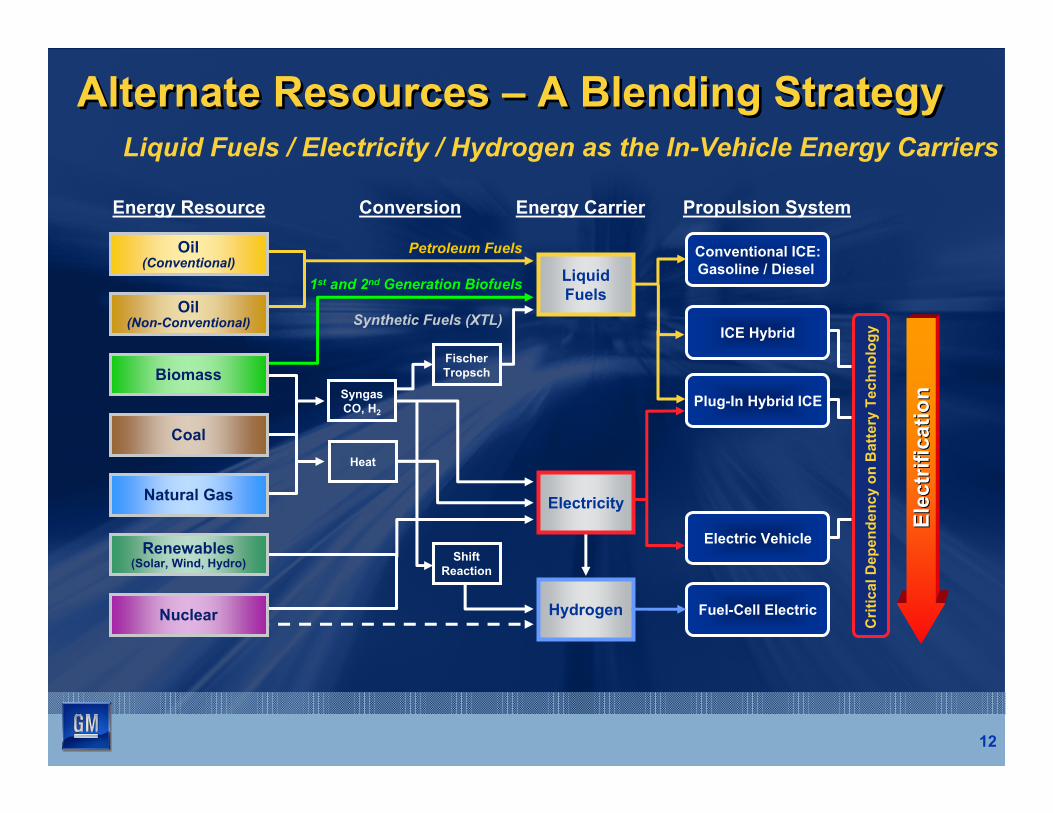
12
Alternate Resources – A Blending StrategyAlternate Resources – A Blending Strategy
Fuel-Cell ElectricHydrogen
Shift Reaction
Energy Carrier Propulsion SystemConversionEnergy Resource
Elec
trifi
catio
nEl
ectr
ifica
tion
ICE Hybrid
Conventional ICE: Gasoline / DieselLiquid
Fuels
Petroleum FuelsOil (Conventional)
Oil (Non-Conventional) Synthetic Fuels (XTL)
Syngas CO, H2
Fischer Tropsch
Coal
Natural Gas
1st and 2nd Generation Biofuels
Biomass
Liquid Fuels / Electricity / Hydrogen as the In-Vehicle Energy Carriers
Crit
ical
Dep
ende
ncy
on B
atte
ry T
echn
olog
y
Electricity
Heat
Renewables (Solar, Wind, Hydro)
Nuclear
Plug-In Hybrid ICE
Electric Vehicle
13
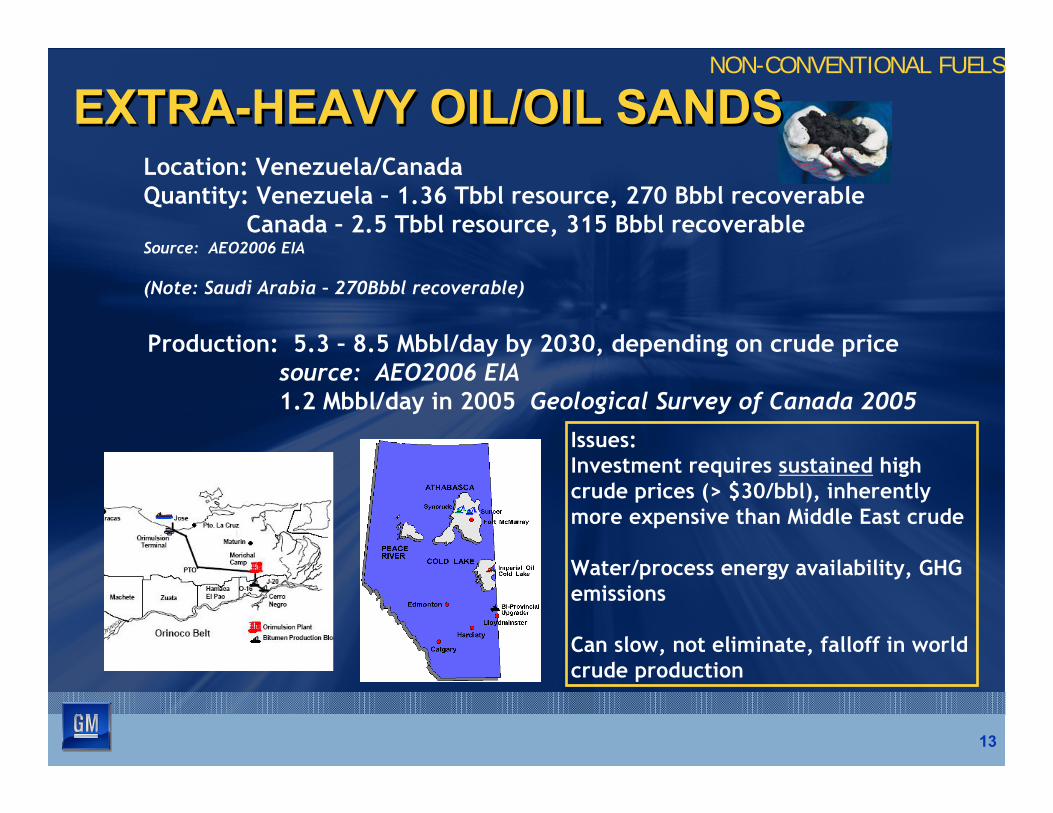
NON-CONVENTIONAL FUELS
Location: Venezuela/Canada Quantity: Venezuela – 1.36 Tbbl resource, 270 Bbbl recoverable
Canada – 2.5 Tbbl resource, 315 Bbbl recoverable Source: AEO2006 EIA
(Note: Saudi Arabia – 270Bbbl recoverable)
Production: 5.3 – 8.5 Mbbl/day by 2030, depending on crude price source: AEO2006 EIA 1.2 Mbbl/day in 2005 Geological Survey of Canada 2005
Issues: Investment requires sustained high crude prices (> $30/bbl), inherently more expensive than Middle East crude
Water/process energy availability, GHG emissions
Can slow, not eliminate, falloff in world crude production
EXTRA-HEAVY OIL/OIL SANDSEXTRA-HEAVY OIL/OIL SANDS
NON-CONVENTIONAL FUELS
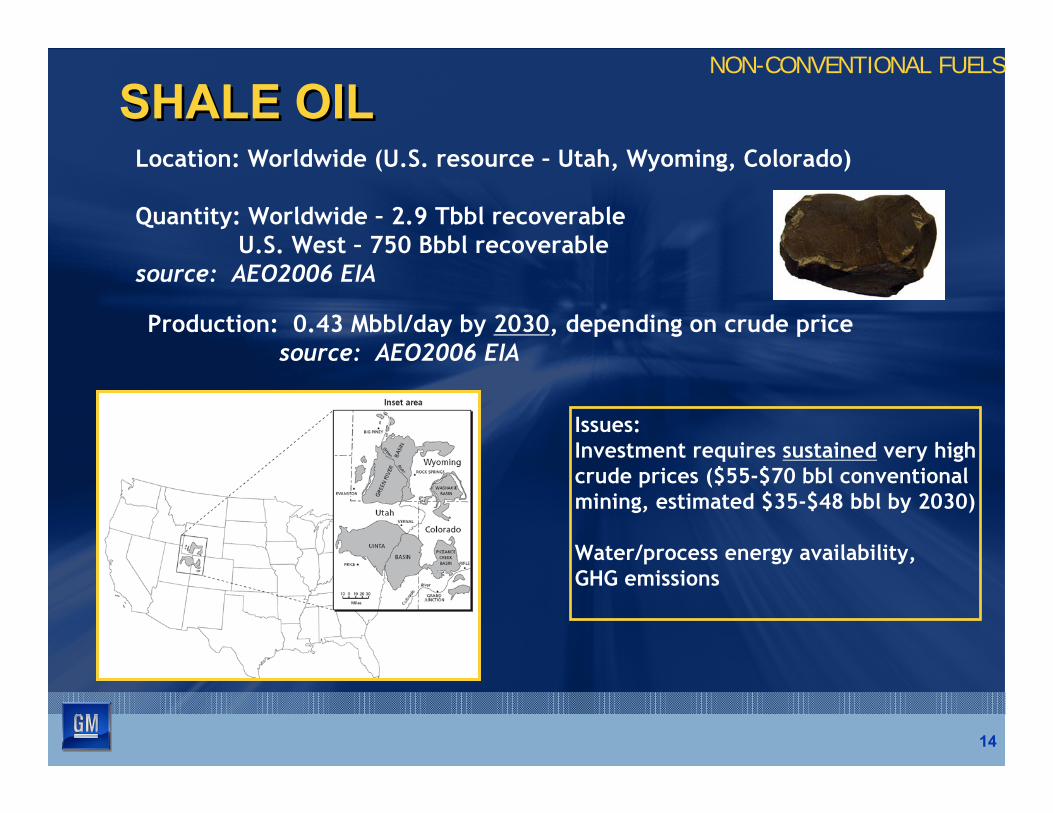
SHALE OILSHALE OILLocation: Worldwide (U.S. resource – Utah, Wyoming, Colorado)
Quantity: Worldwide – 2.9 Tbbl recoverable U.S. West – 750 Bbbl recoverable
source: AEO2006 EIA
Production: 0.43 Mbbl/day by 2030, depending on crude price source: AEO2006 EIA
Issues:Investment requires sustained very highcrude prices ($55-$70 bbl conventionalmining, estimated $35-$48 bbl by 2030)
Water/process energy availability,GHG emissions
14

15
World Fossil Energy ReservesWorld Fossil Energy Reserves
16
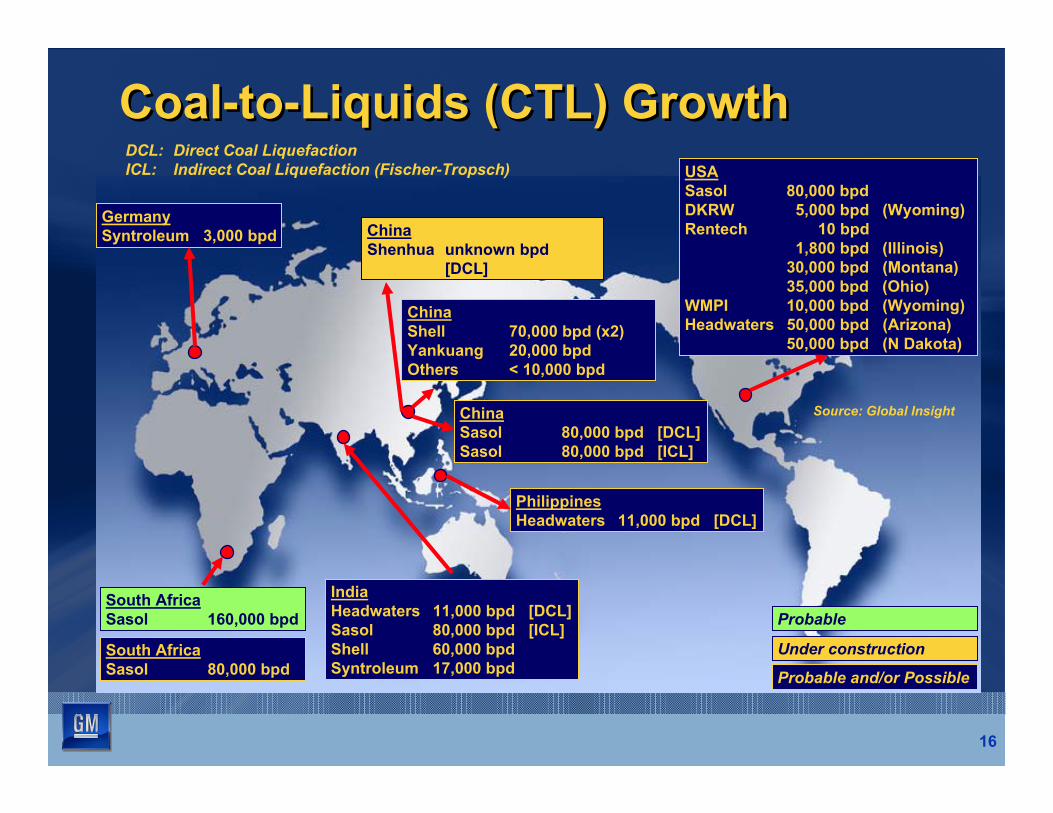
Coal-to-Liquids (CTL) GrowthCoal-to-Liquids (CTL) GrowthUSA Sasol 80,000 bpd DKRW 5,000 bpd (Wyoming) Rentech 10 bpd
1,800 bpd (Illinois) 30,000 bpd (Montana) 35,000 bpd (Ohio)
WMPI 10,000 bpd (Wyoming) Headwaters 50,000 bpd (Arizona)
50,000 bpd (N Dakota)
Germany Syntroleum 3,000 bpd
DCL: Direct Coal Liquefaction ICL: Indirect Coal Liquefaction (Fischer-Tropsch)
India Headwaters 11,000 bpd [DCL] Sasol 80,000 bpd [ICL] Shell 60,000 bpd Syntroleum 17,000 bpd
Philippines Headwaters 11,000 bpd [DCL]
China Sasol 80,000 bpd [DCL] Sasol 80,000 bpd [ICL]
South Africa Sasol 160,000 bpd
South Africa Sasol 80,000 bpd
China Shenhua unknown bpd
[DCL]
China Shell 70,000 bpd (x2) Yankuang 20,000 bpd Others < 10,000 bpd
Source: Global Insight
Probable
Under construction
Probable and/or Possible
17
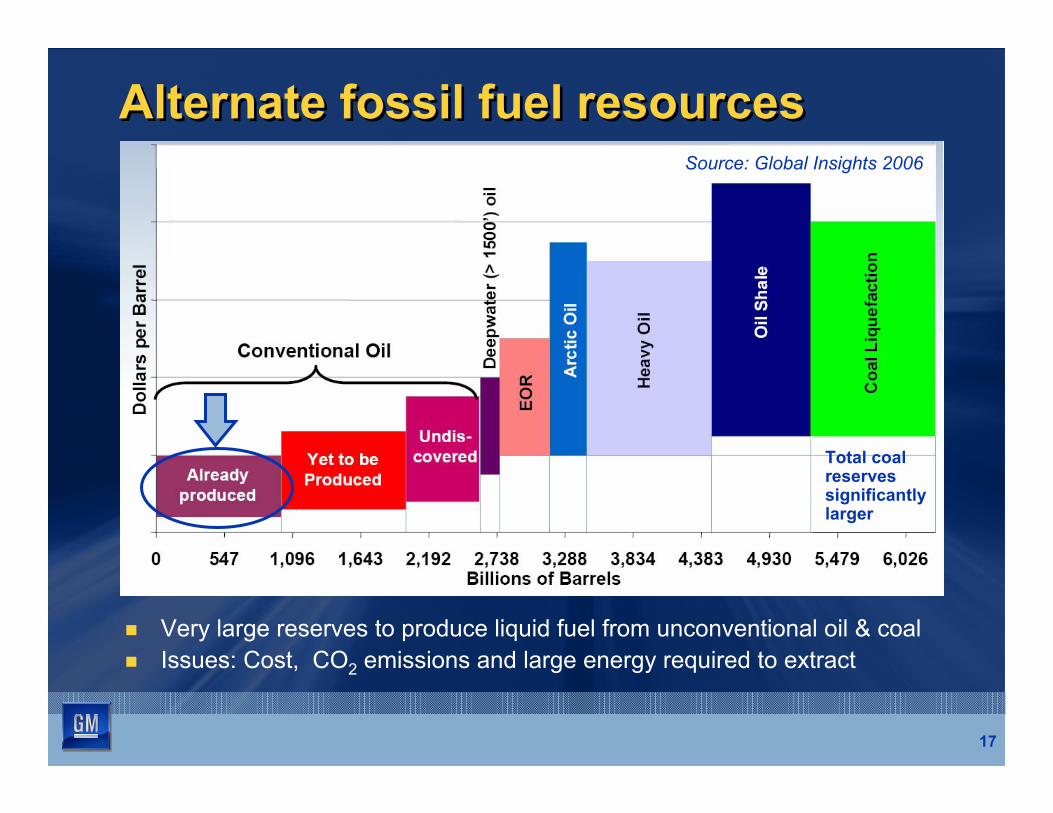
Alternate fossil fuel resourcesAlternate fossil fuel resources
� Very large reserves to produce liquid fuel from unconventional oil & coal � Issues: Cost, CO2 emissions and large energy required to extract
Source: Global Insights 2006
Total coal reserves significantlylarger
BIOFUELSBIOFUELS
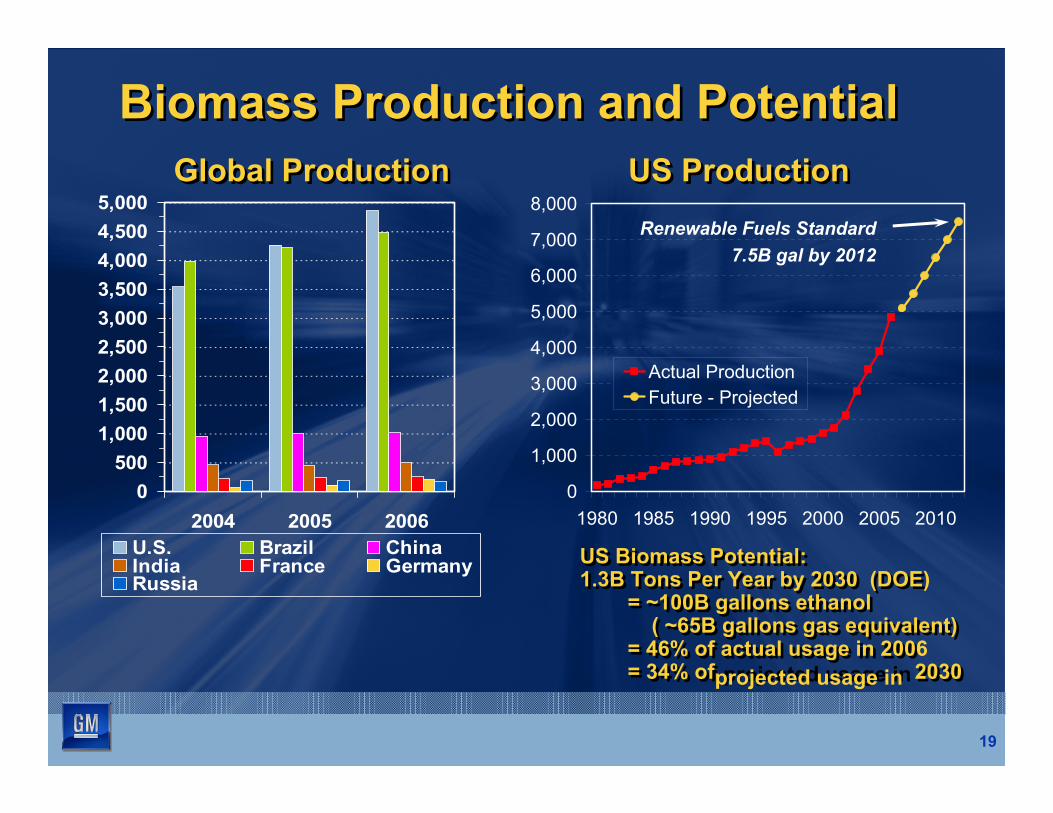
Biomass Production and PotentialBiomass Production and PotentialGlobal ProductionGlobal Production
5,000 4,500 4,000 3,500 3,000 2,500 2,000 1,500 1,000
500 0
2004 2005 2006 U.S. Brazil China India France GermanyRussia
US ProductionUS Production8,000
7,000
6,000
5,000
4,000
3,000
2,000
1,000
0 1980 1985 1990 1995 2000 2005 2010
Actual Production Future - Projected
Renewable Fuels Standard 7.5B gal by 2012
US Biomass Potential:US Biomass Potential:1.3B Tons Per Year by 2030 (DOE1.3B Tons Per Year by 2030 (DOE)
= ~100B gallons ethanol= ~100B gallons ethanol ( ~65B gallons gas equivalent)( ~65B gallons gas equivalent)
= 46% of actual usage in 200= 46% of actual usage in 2006= 34% of projected usage in= 34% of 2030projected usage in 2030
19
20
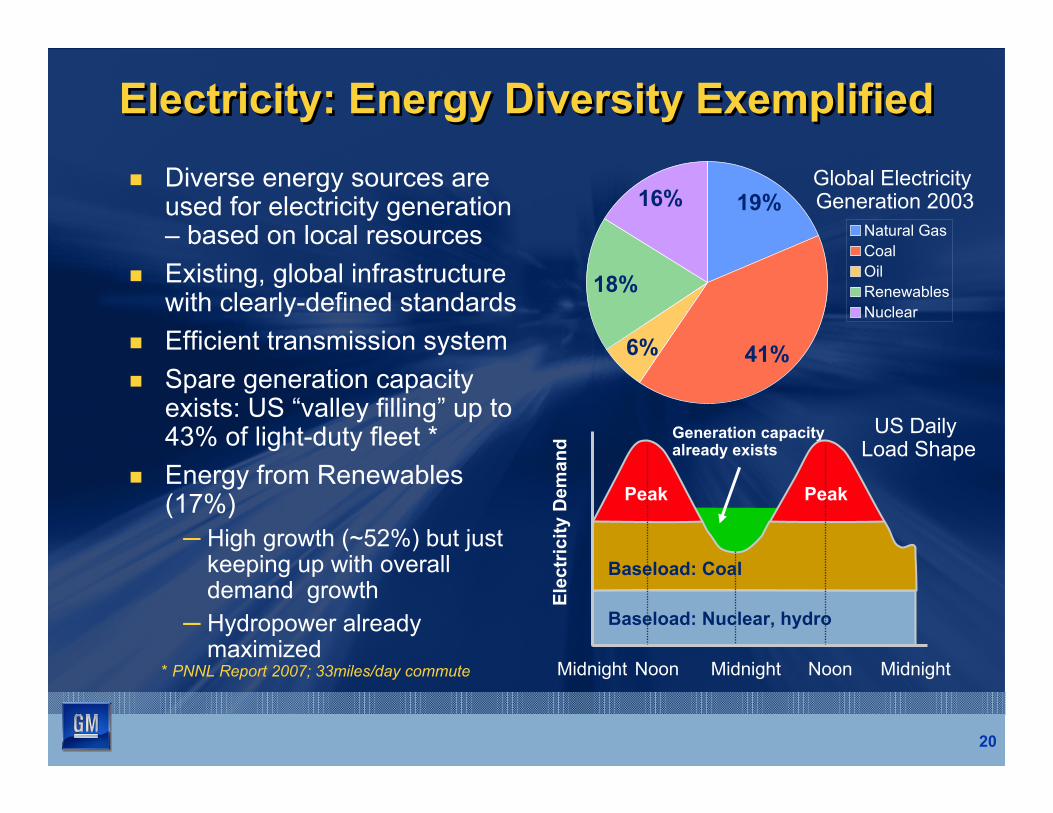
Electricity: Energy Diversity ExemplifiedElectricity: Energy Diversity Exemplified� Diverse energy sources are
used for electricity generation – based on local resources
� Existing, global infrastructure with clearly-defined standards
� Efficient transmission system � Spare generation capacity
exists: US “valley filling” up to43% of light-duty fleet *
� Energy from Renewables (17%) ─ High growth (~52%) but just
keeping up with overalldemand growth
─ Hydropower alreadymaximized
19%
41%6%
18%
16% Natural Gas Coal Oil Renewables Nuclear
Global Electricity Generation 2003
Generation capacityalready exists
Baseload: Nuclear, hydro
Baseload: Coal
MidnightNoonMidnight Noon Midnight
Elec
tric
ity D
eman
d
Peak Peak
US Daily Load Shape
* PNNL Report 2007; 33miles/day commute
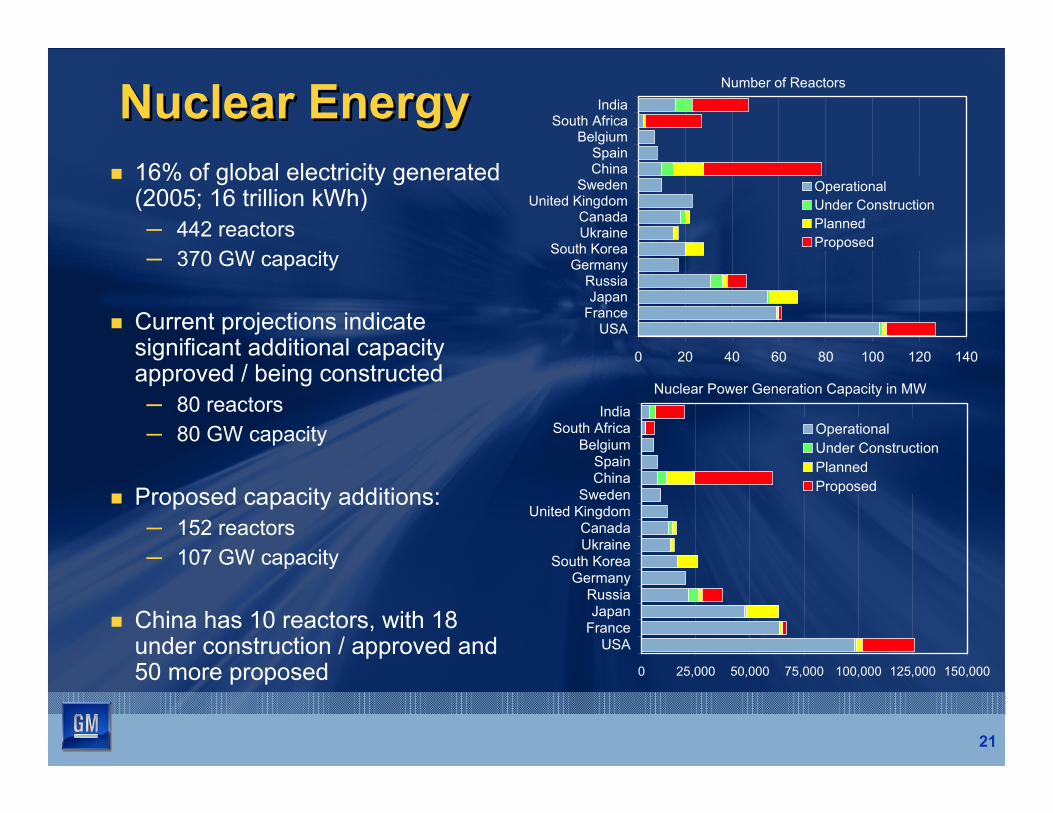
Nuclear EnergyNuclear Energy� 16% of global electricity generated
(2005; 16 trillion kWh) ─ 442 reactors─ 370 GW capacity
� Current projections indicate significant additional capacityapproved / being constructed ─ 80 reactors─ 80 GW capacity
� Proposed capacity additions: ─ 152 reactors ─ 107 GW capacity
� China has 10 reactors, with 18 under construction / approved and 50 more proposed
Number of Reactors India
South Africa Belgium
Spain China
Sweden United Kingdom
Canada Ukraine
South Korea Germany
Russia Japan
France USA
Operational Under Construction Planned Proposed
0 20 40 60 80 100 120 140
Nuclear Power Generation Capacity in MW India
South Africa Belgium
Spain China
Sweden United Kingdom
Canada Ukraine
South Korea Germany
Russia Japan
France USA
Operational Under Construction Planned Proposed
0 25,000 50,000 75,000 100,000 125,000 150,000
21

22
Alternate Resources – A Blending StrategyAlternate Resources – A Blending Strategy
Fuel-Cell ElectricHydrogen
Shift Reaction
Electricity
Heat
Renewables (Solar, Wind, Hydro)
Nuclear
Energy Carrier Propulsion SystemConversion
Elec
trifi
catio
nEl
ectr
ifica
tion
Energy Resource
ICE Hybrid
Conventional ICE: Gasoline / DieselLiquid
Fuels
Petroleum FuelsOil (Conventional)
Oil (Non-Conventional) Synthetic Fuels (XTL)
Syngas CO, H2
Fischer Tropsch
Coal
Natural Gas
1st and 2nd Generation Biofuels
Biomass
Liquid Fuels / Electricity / Hydrogen as the In-Vehicle Energy Carriers
Regional Niche Gaseous
Fuels
Crit
ical
Dep
ende
ncy
on B
atte
ry T
echn
olog
y
Plug-In Hybrid ICE
Electric Vehicle

23
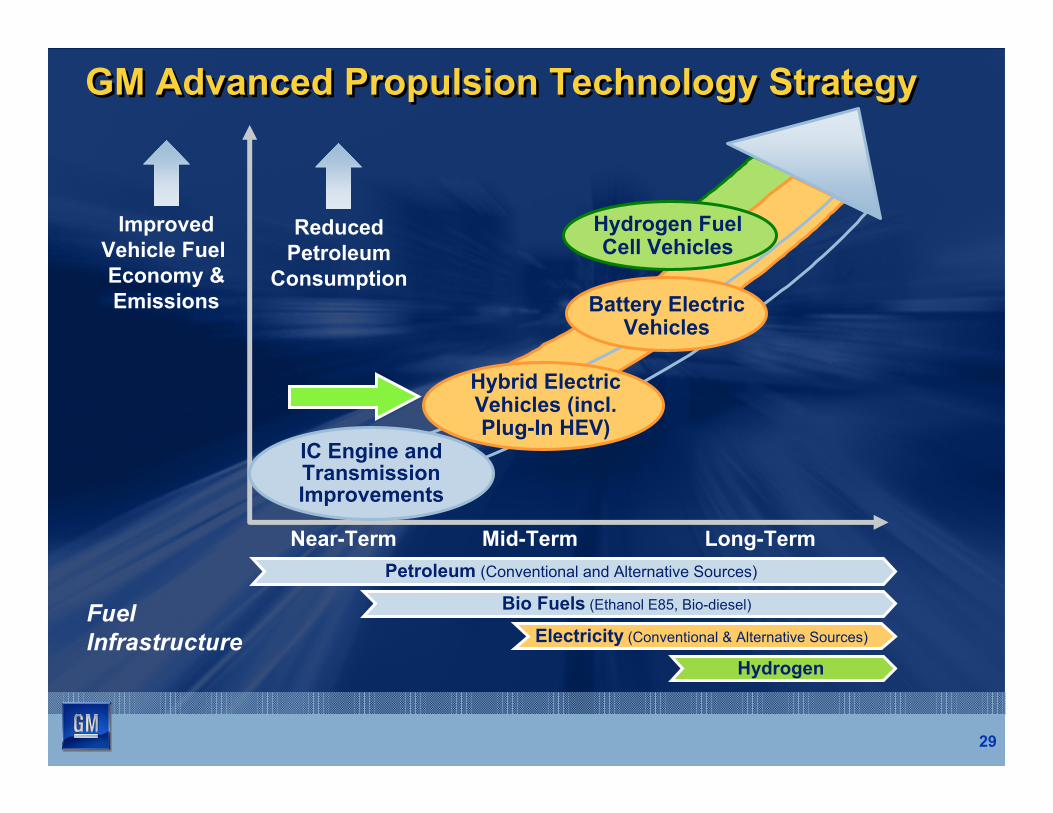
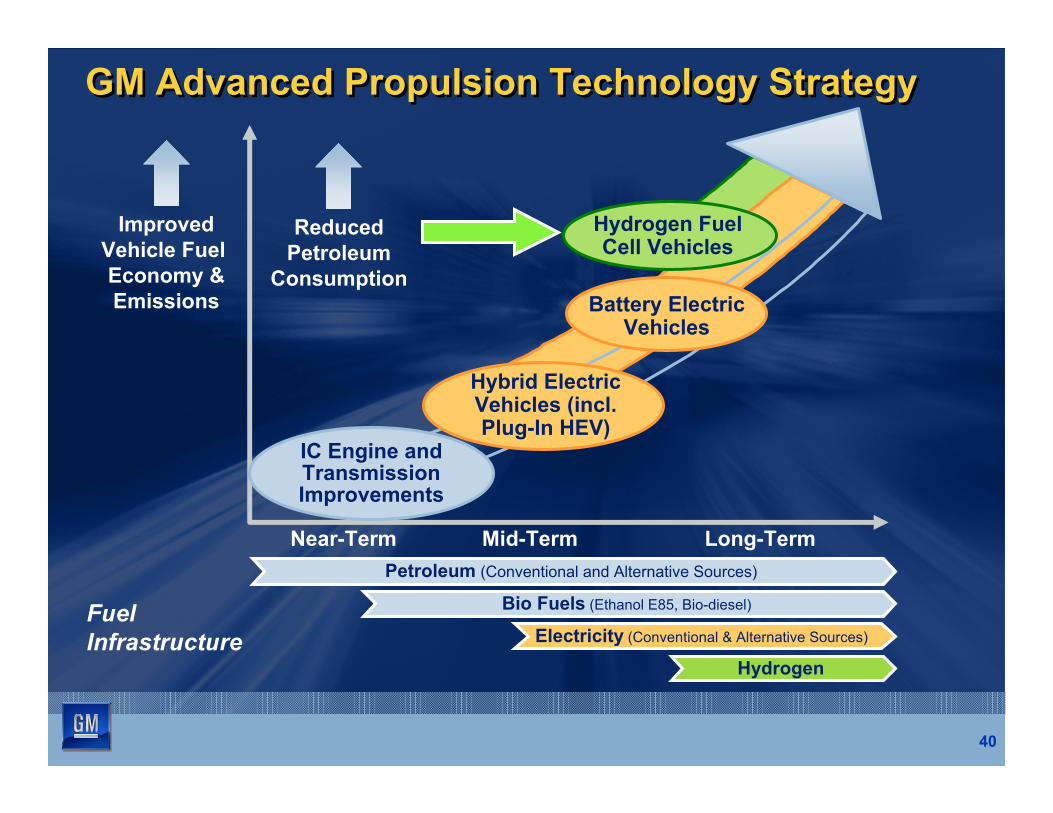
GM Advanced Propulsion Technology StrategyGM Advanced Propulsion Technology Strategy
Improved Vehicle Fuel Economy & Emissions
Reduced Petroleum
Consumption
Fuel Infrastructure
Hybrid ElectricVehicles (incl. Plug-In HEV)
IC Engine andTransmission Improvements
Hydrogen FuelCell Vehicles
Battery ElectricVehicles
Near-Term Mid-Term Long-Term Petroleum (Conventional and Alternative Sources)
Bio Fuels (Ethanol E85, Bio-diesel)
Hydrogen
Electricity (Conventional & Alternative Sources)
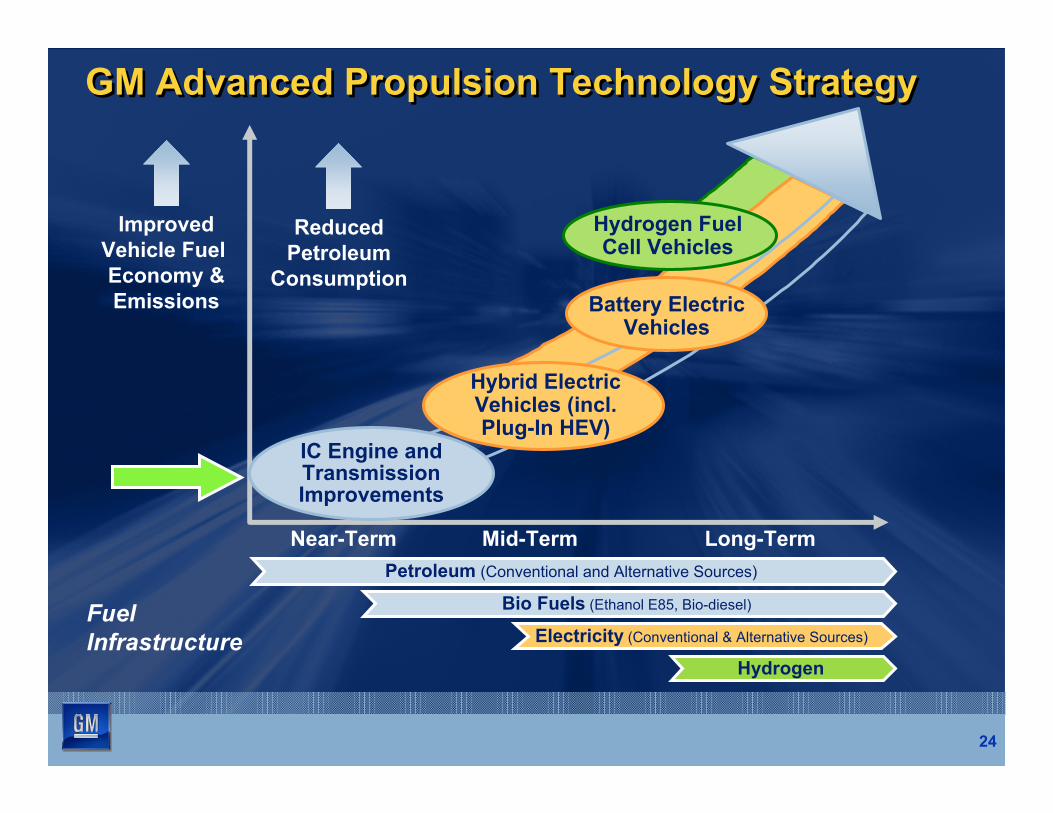
24
GM Advanced Propulsion Technology StrategyGM Advanced Propulsion Technology Strategy
Improved Vehicle Fuel Economy & Emissions
Reduced Petroleum
Consumption
Fuel Infrastructure
Hybrid ElectricVehicles (incl. Plug-In HEV)
IC Engine andTransmission Improvements
Hydrogen FuelCell Vehicles
Battery ElectricVehicles
Near-Term Mid-Term Long-Term Petroleum (Conventional and Alternative Sources)
Bio Fuels (Ethanol E85, Bio-diesel)
Hydrogen
Electricity (Conventional & Alternative Sources)

25
Cam Phasing
Spark Ignition Direction Injection
Port Deactivation
2-Step VVA
Homogenous Charge Compression Ignition
Achieving the Upper Potential of Gasoline Engines
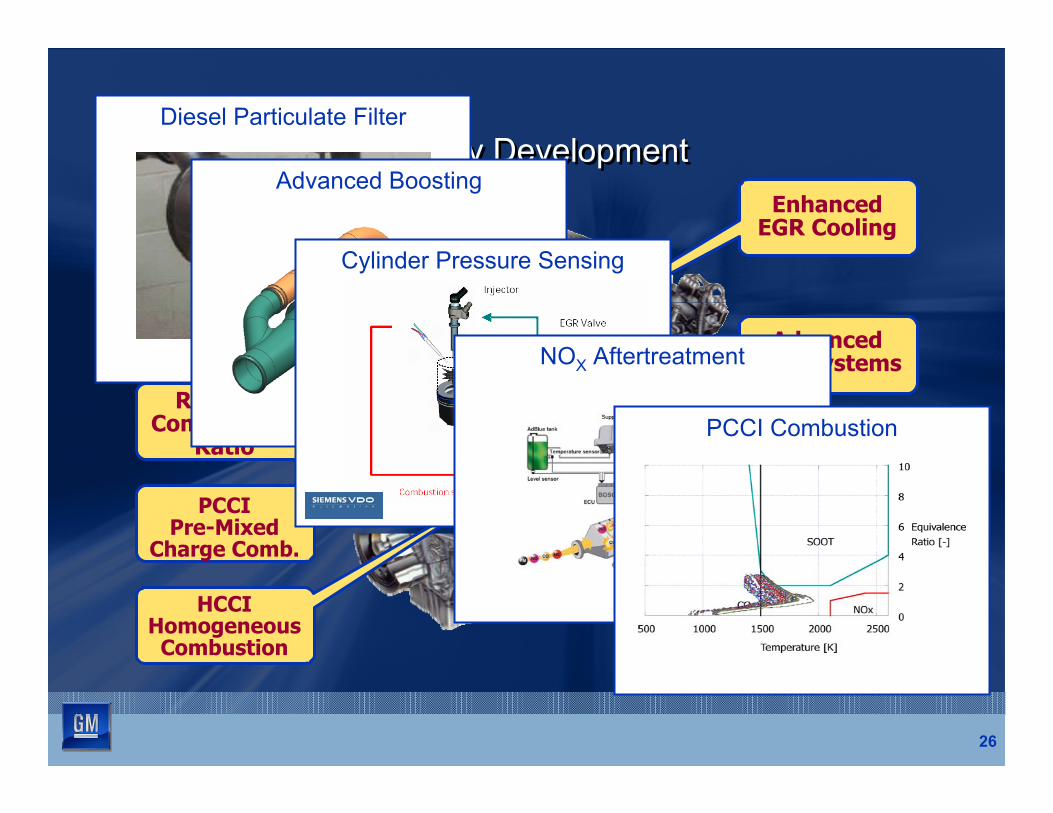
DPF, SCR & LNTAftertreatment
VVT / VVA
Electrically Assisted
Boost
Advanced Boost Configurations
Diesel EngineDiesel Engine
Low Temp / Low soot
Combustion
26
HCCI Homogeneous
Combustion
PCCI Pre-Mixed
Charge Comb.
Advanced EGR Systems
Reduced Compression
Ratio
Enhanced EGR Cooling
Enabling Technology DevelopmentEnabling Technology DevelopmentDiesel Particulate Filter
Advanced Boosting
Cylinder Pressure Sensing
NOX Aftertreatment
PCCI Combustion
-- -
--
- -
27
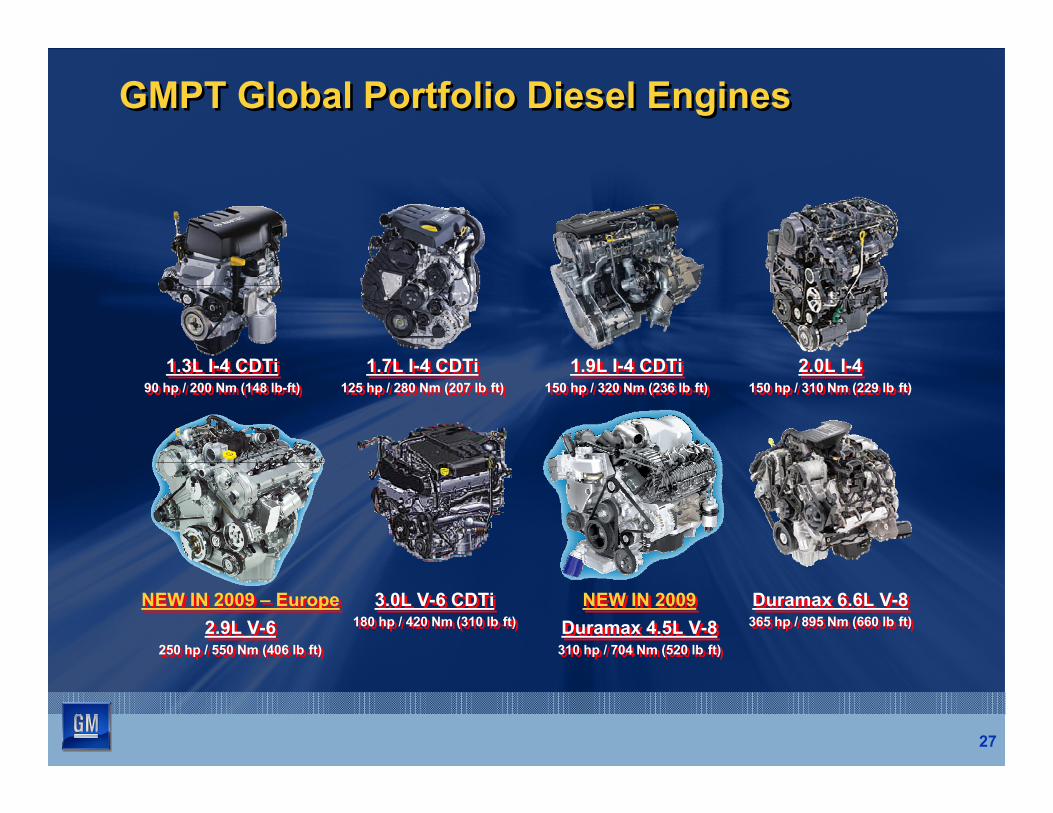
150 hp / 310 Nm (229 lb-ft150 hp / 310 Nm (229 lb ft)90 hp / 200 Nm (148 lb-ft)90 hp / 200 Nm (148 lb-ft) 125 hp / 280 Nm (207 lb-ft)125 hp / 280 Nm (207 lb ft) 150 hp / 320 Nm (236 lb-ft)150 hp / 320 Nm (236 lb ft)
365 hp / 895 Nm (660 lb-ft)365 hp / 895 Nm (660 lb ft)180 hp / 420 Nm (310 lb-ft)180 hp / 420 Nm (310 lb ft) NEW IN 2009 – EuropeNEW IN 2009 – Europe NEW IN 2009NEW IN 2009
2.0L I-42.0L I-41.3L I-4 CDTi1.3L I-4 CDTi 1.7L I-4 CDTi1.7L I-4 CDTi 1.9L I-4 CDTi1.9L I-4 CDTi
Duramax 6.6L V-8Duramax 6.6L V-83.0L V-6 CDTi3.0L V-6 CDTi
GMPT Global Portfolio Diesel EnginesGMPT Global Portfolio Diesel Engines
250 hp / 550 Nm (406 lb-ft)250 hp / 550 Nm (406 lb ft) 310 hp / 704 Nm (520 lb-ft)310 hp / 704 Nm (520 lb ft) 2.9L V-62.9L V-6 Duramax 4.5L V-8Duramax 4.5L V-8
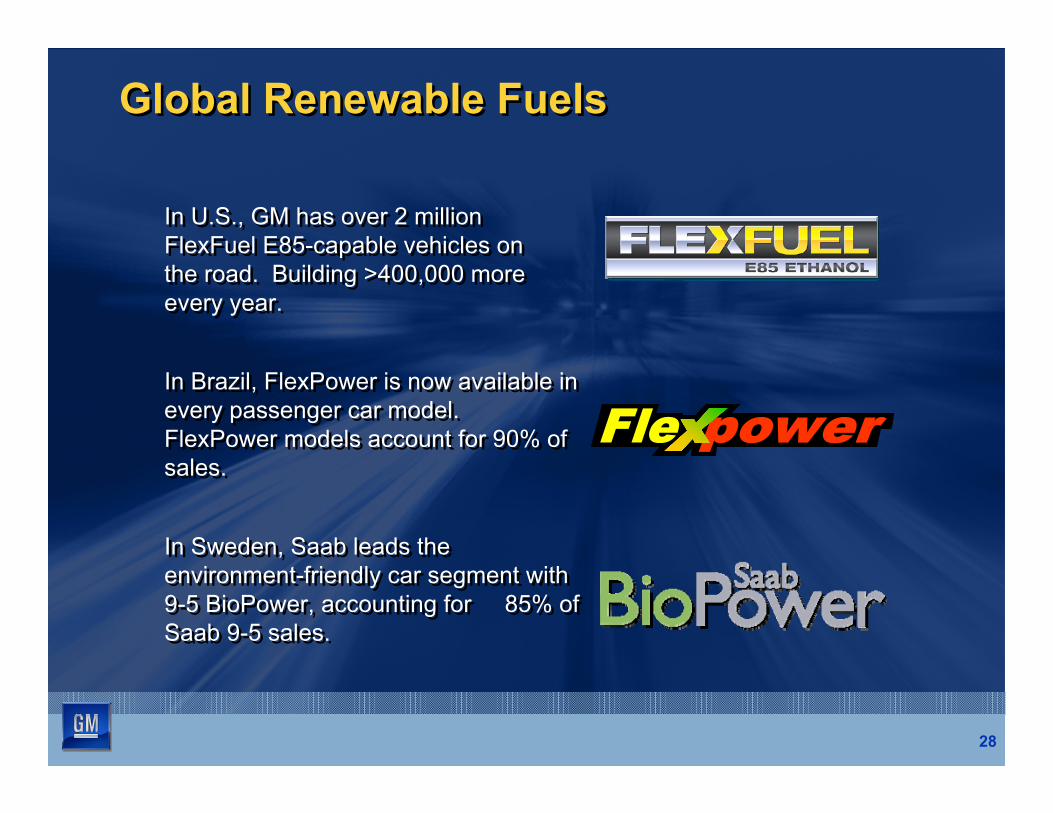
Global Renewable FuelsGlobal Renewable Fuels
In U.S., GM has over 2 millionIn U.S., GM has over 2 million FlexFuel E85-capable vehicles onFlexFuel E85-capable vehicles on the road. Building >400,000 morethe road. Building >400,000 more every year.every year.
In Brazil, FlexPower is now available inIn Brazil, FlexPower is now available in every passenger car model.every passenger car model. FlexPower models account for 90% ofFlexPower models account for 90% of sales.sales.
In Sweden, Saab leads theIn Sweden, Saab leads the environment-friendly car segment withenvironment-friendly car segment with 9-5 BioPower, accounting for 85% of9-5 BioPower, accounting for 85% of Saab 9-5 sales.Saab 9-5 sales.
28
29
GM Advanced Propulsion Technology StrategyGM Advanced Propulsion Technology Strategy
Improved Vehicle Fuel Economy & Emissions
Reduced Petroleum
Consumption
Fuel Infrastructure
Hybrid ElectricVehicles (incl. Plug-In HEV)
IC Engine andTransmission Improvements
Hydrogen FuelCell Vehicles
Battery ElectricVehicles
Near-Term Mid-Term Long-Term Petroleum (Conventional and Alternative Sources)
Bio Fuels (Ethanol E85, Bio-diesel)
Hydrogen
Electricity (Conventional & Alternative Sources)
Saturn VUE (timing not announced)
30
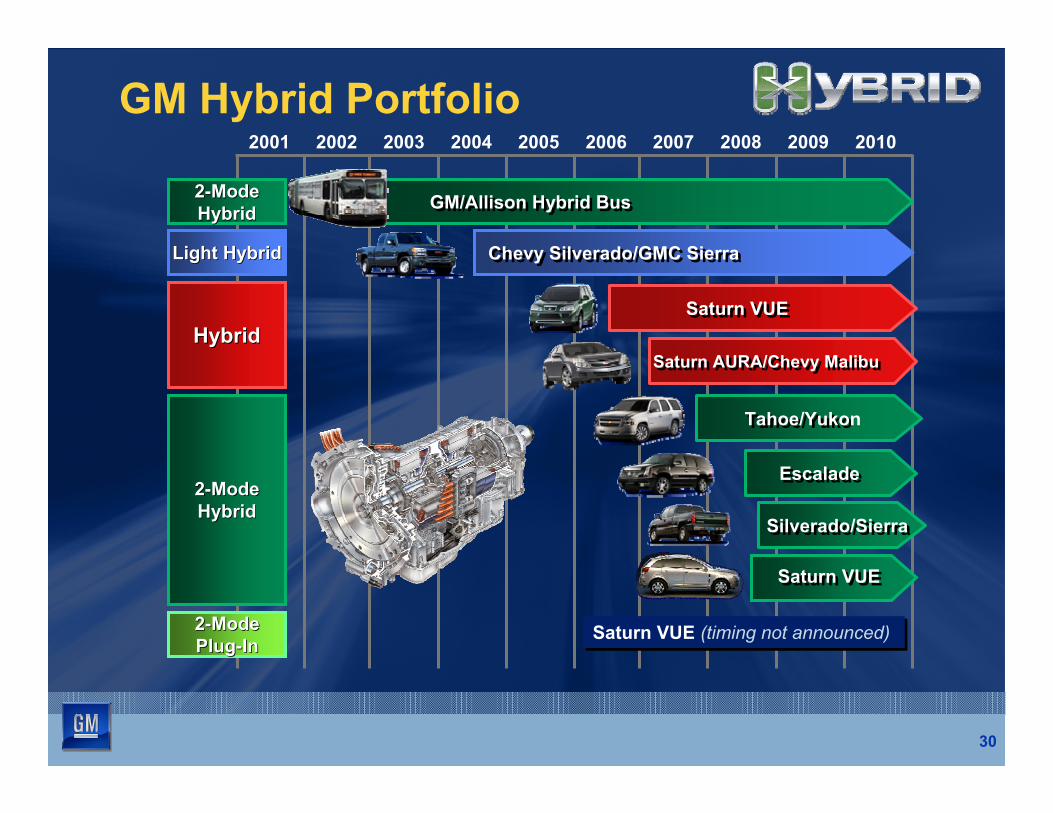
2001 2002 2003 2004 2005 2007 2008 20092006 2010
GM Hybrid Portfolio
HybridHybrid
22--ModeModeHybridHybrid
Light HybridLight Hybrid
GM/Allison Hybrid BusGM/Allison Hybrid Bus
Tahoe/YukoTahoe/Yukon
EscaladeEscalade
Silverado/SierraSilverado/Sierra
22--ModeModeHybridHybrid
Saturn AURA/Chevy MalibuSaturn AURA/Chevy Malibu
Saturn VUESaturn VUE
22--ModeModePlugPlug--InIn
Saturn VUESaturn VUE
Saturn VUE (timing not announced)
Chevy Silverado/GMC SierraChevy Silverado/GMC Sierra
31
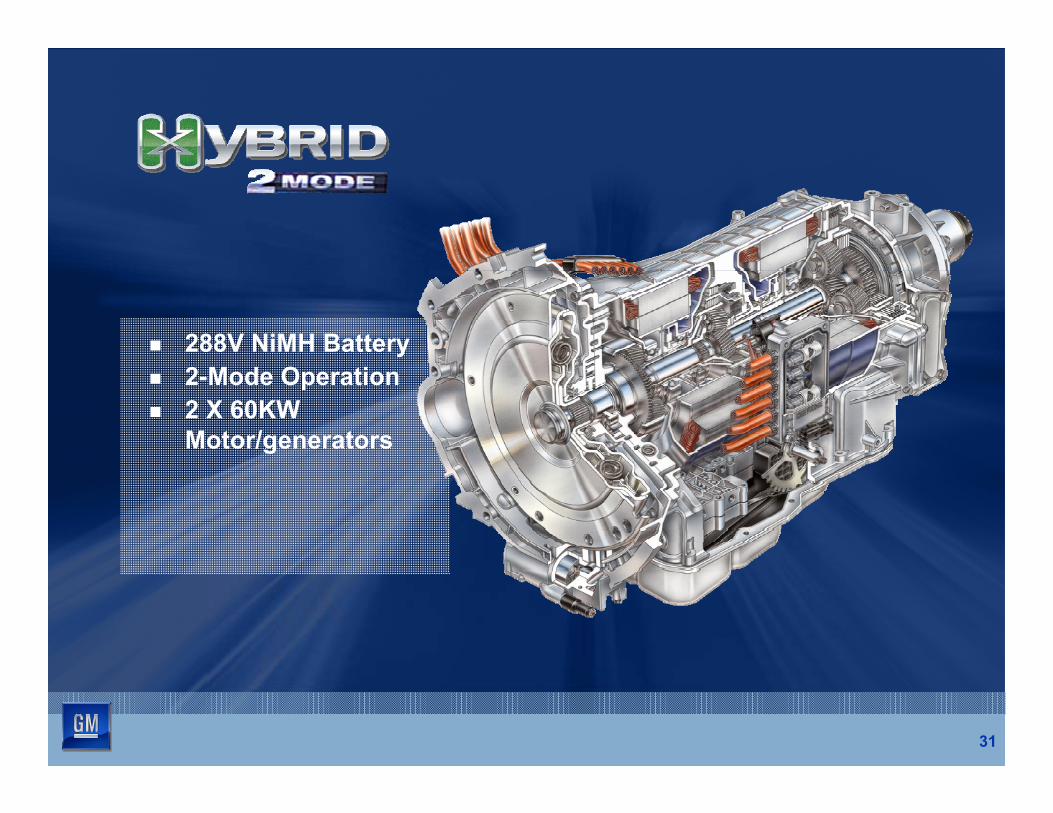
� 288V NiMH Battery � 2-Mode Operation � 2 X 60KW
Motor/generators
32
33
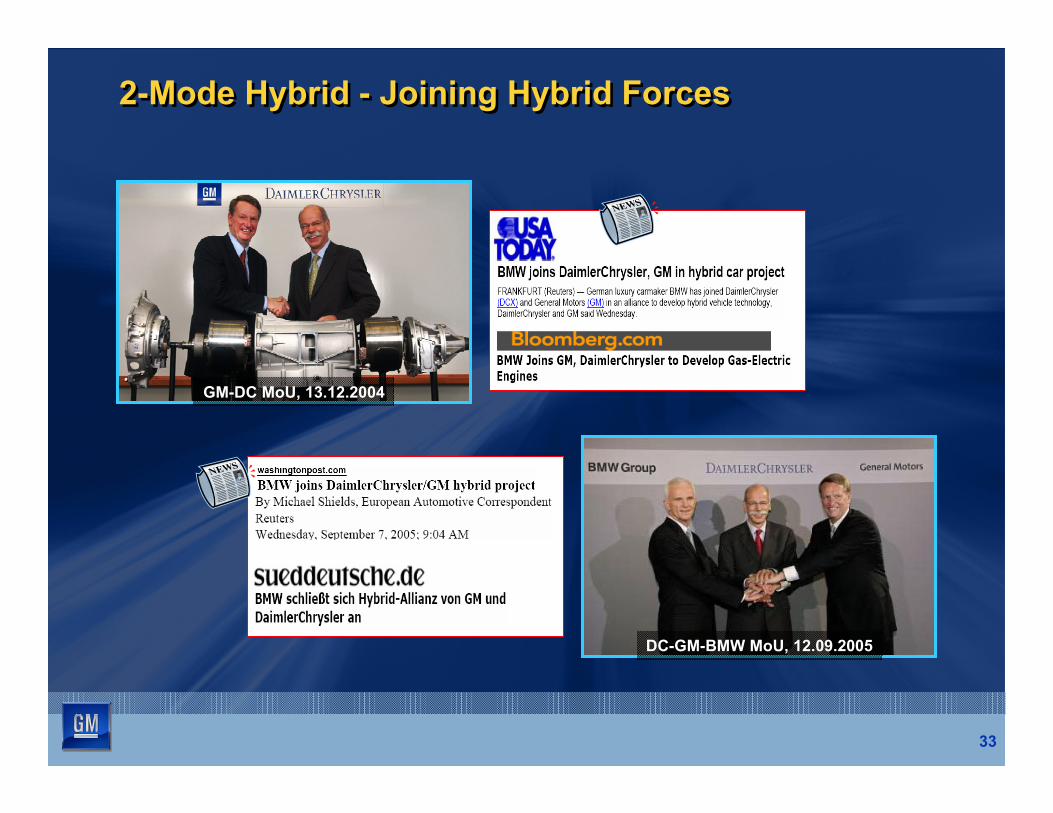
2-Mode Hybrid - Joining Hybrid Forces2-Mode Hybrid - Joining Hybrid Forces
GM-DC MoU, 13.12.2004
DC-GM-BMW MoU, 12.09.2005
ShiftReaction
Heat
Renewables(Solar, Wind, Hydro)
Nuclear
Oil(Non-Conventional) Synthetic Fuels (XTL)
SyngasCO, H2
FischerTropsch
Coal
Natural Gas
1st and 2nd
Biomass
34
Alternate Resources – A Blending StrategyAlternate Resources – A Blending Strategy
Fuel-Cell ElectricHydrogen
Electricity
Energy Carrier Propulsion SystemConversion
Elec
trifi
catio
nEl
ectr
ifica
tion
Energy Resource
ICE Hybrid
Conventional ICE: Gasoline / DieselLiquid
Fuels
Petroleum FuelsOil (Conventional)
Generation Biofuels
Liquid Fuels / Electricity / Hydrogen as the In-Vehicle Energy Carriers
Crit
ical
Dep
ende
ncy
on B
atte
ry T
echn
olog
y
Plug-In Hybrid ICE
Electric Vehicle
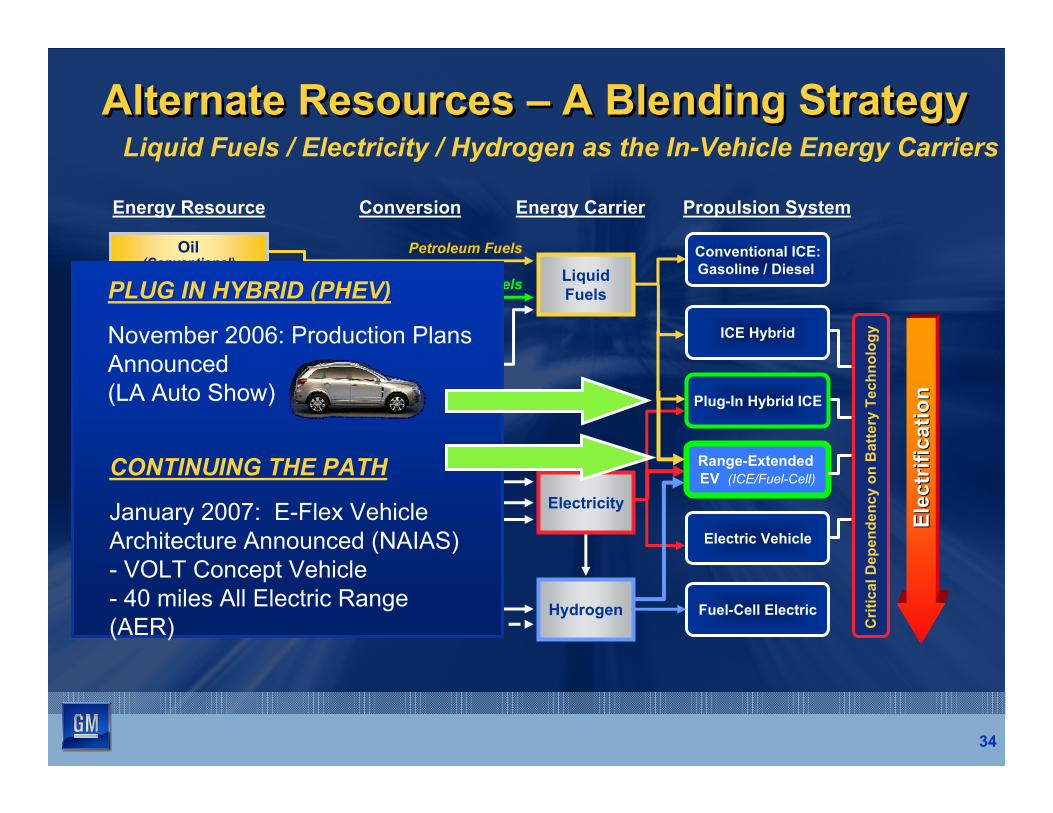
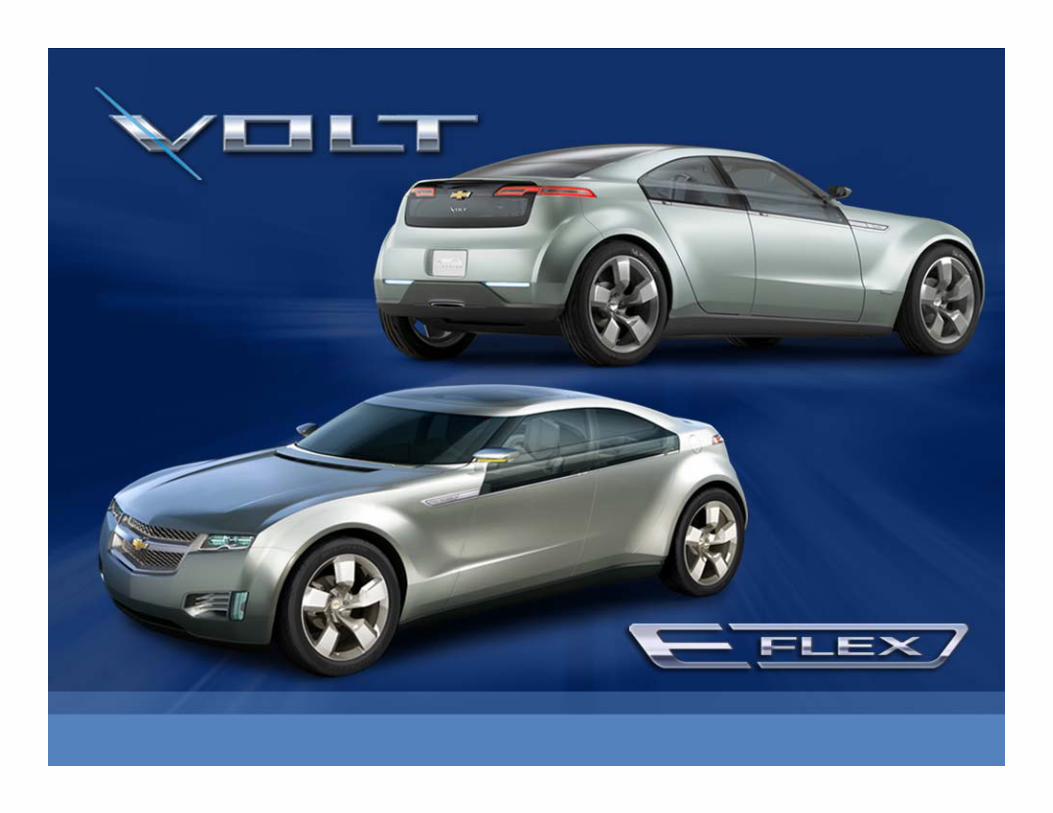
PLUG IN HYBRID (PHEV)
November 2006: Production Plans Announced (LA Auto Show)
Range-Extended EV (ICE/Fuel-Cell)CONTINUING THE PATH
January 2007: E-Flex Vehicle Architecture Announced (NAIAS) - VOLT Concept Vehicle - 40 miles All Electric Range (AER)
35

36
Chevy Volt ConceptChevy Volt Concept
Electric Drive Motor � 120 kW / 320Nm (peak)
Li Ion Battery Pack � 136 kW peak power � 16 kWh energy
53 kW Generator � Internal Combustion Engine � 1.0L 3-cylinder turbo

37
Range-Extended EVRange-Extended EV
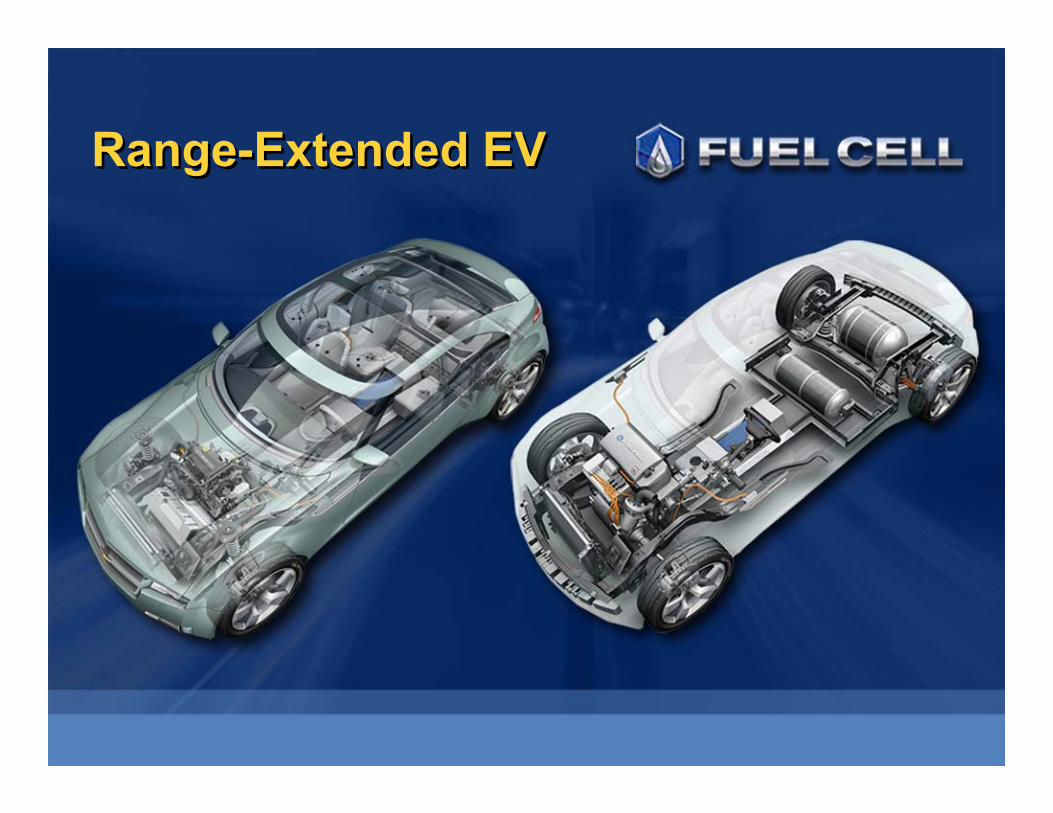
38
Range-Extended EVRange-Extended EV
id
Nickel
Advanced Lithium Ion
--
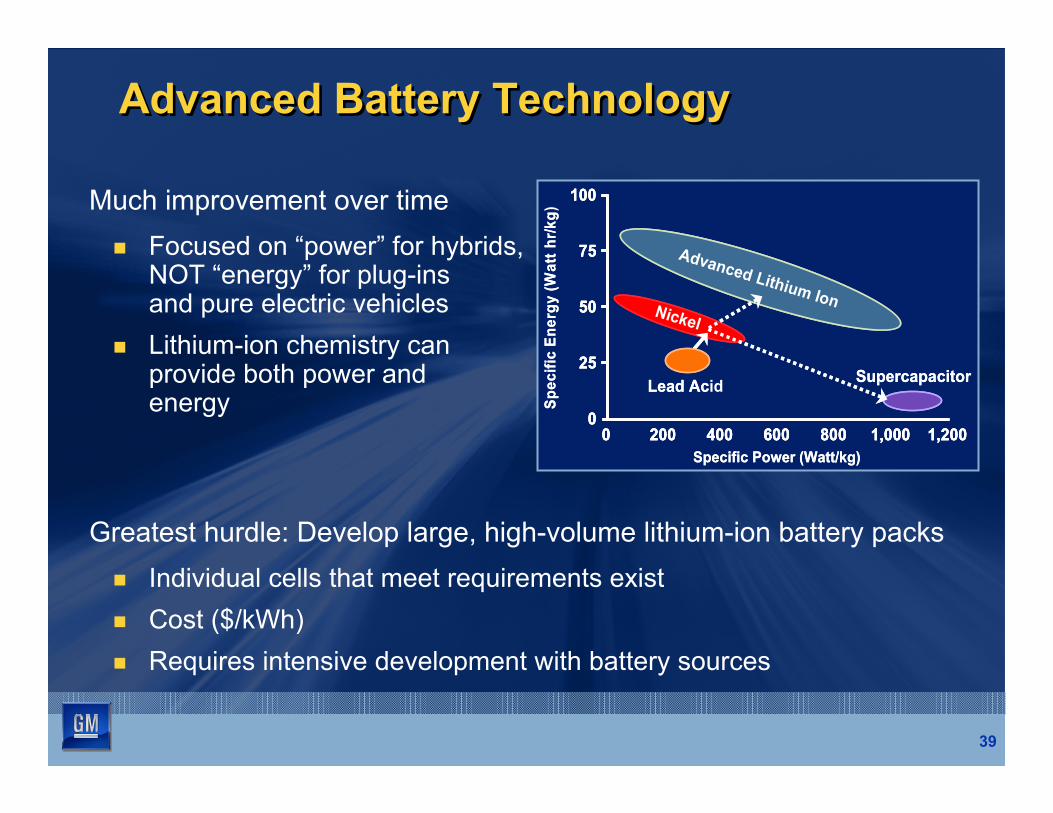
Advanced Battery TechnologyAdvanced Battery Technology
100101000Much improvement over time
� Focused on “power” for hybrids,NOT “energy” for plug-insand pure electric vehicles
� Lithium-ion chemistry can provide both power and energy Sp
ecifi
c En
ergy
(Wat
t hr/k
gSp
ecifi
c En
ergy
(Wat
thr/k
g)
0 200 400 600 800 1,000 1,200 Specific Power (Watt/kg)
Lead Ac Supercapacitor
00 200 400 600 800 1,000 1,200200 400 600 800 1,000 1,200Specific Power (Watt/kg)
Lead Acid Supercapacitor
Nickel
Advanced Lithium Ion
757575
505050
252525
000
Greatest hurdle: Develop large, high-volume lithium-ion battery packs � Individual cells that meet requirements exist � Cost ($/kWh) � Requires intensive development with battery sources
39
40
GM Advanced Propulsion Technology StrategyGM Advanced Propulsion Technology Strategy
Improved Vehicle Fuel Economy & Emissions
Reduced Petroleum
Consumption
Fuel Infrastructure
Hybrid ElectricVehicles (incl. Plug-In HEV)
IC Engine andTransmission Improvements
Hydrogen FuelCell Vehicles
Battery ElectricVehicles
Near-Term Mid-Term Long-Term Petroleum (Conventional and Alternative Sources)
Bio Fuels (Ethanol E85, Bio-diesel)
Hydrogen
Electricity (Conventional & Alternative Sources)

41

42
GM’s Newest Fuel Cell StackGM’s Newest Fuel Cell Stack
4th4 generation fuel cell stackth generation fuel cell stack�� 372 single fuel cells372 single fuel cells
Power:Power:�� 73kW continuous73kW continuous�� 110kW peak110kW peak�� Power density: 1.6kW/literPower density: 1.6kW/liter
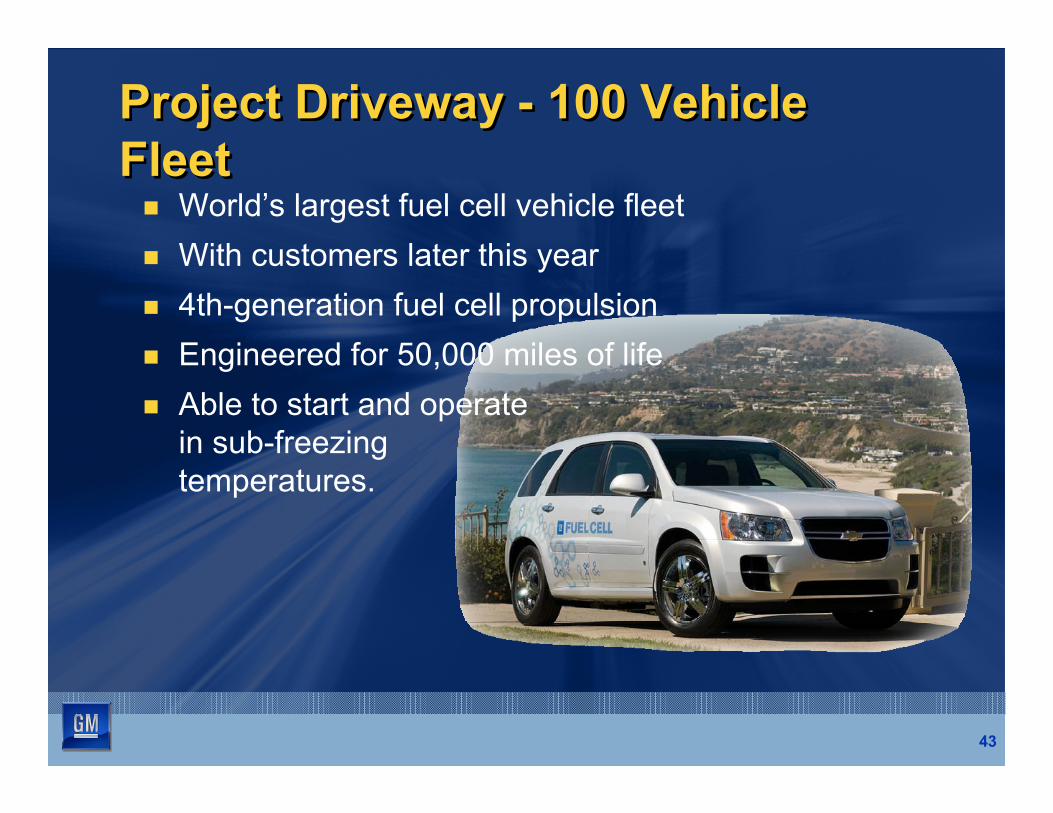
43
Project Driveway - 100 Vehicle Fleet Project Driveway - 100 Vehicle Fleet � World’s largest fuel cell vehicle fleet � With customers later this year � 4th-generation fuel cell propulsion � Engineered for 50,000 miles of life � Able to start and operate
in sub-freezing temperatures.
44
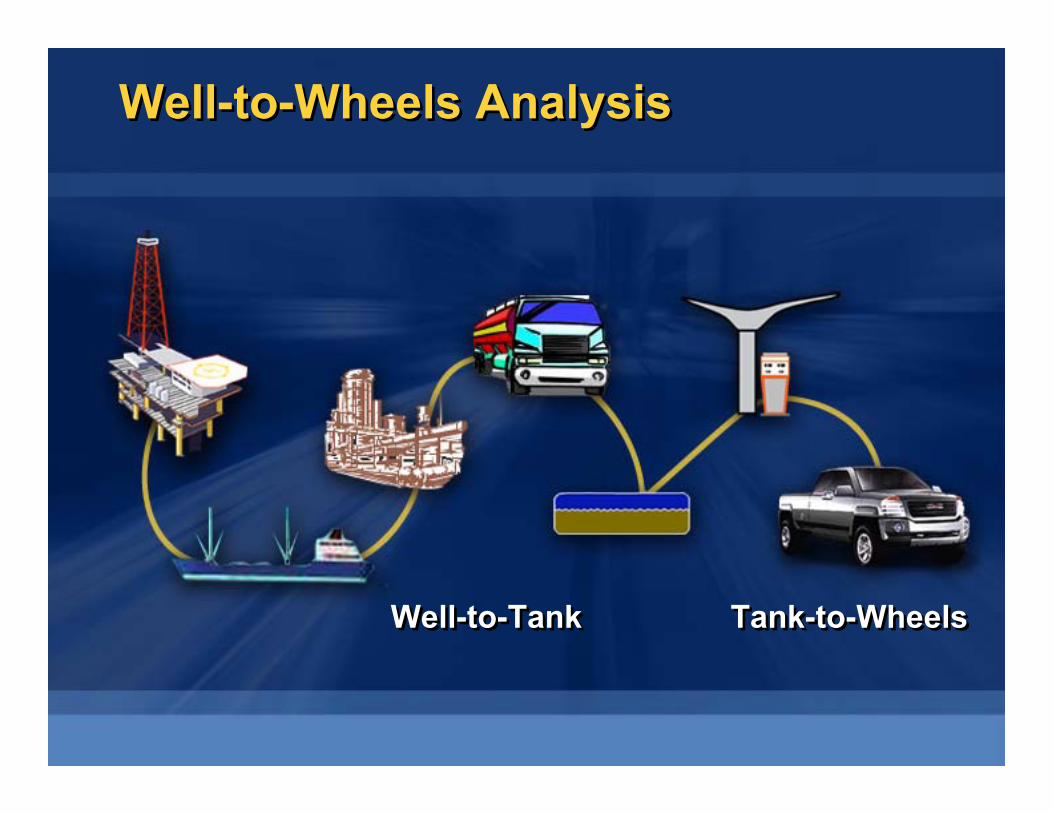
Well-to-Wheels AnalysisWell-to-Wheels Analysis
Tank-to-WheelsTank-to-WheelsWell-to-TankWell-to-Tank

45
Energy Pathways – Well-to-WheelsEnergy Pathways – Well-to-Wheels
Based on 2006 EUCAR/CONCAWE and GM 2005 WTW
0.0 0.5 1.0 1.5 2.0
WTW Energy Use (relative to gasoline ICE)
-1.0 -0.5 0.0 0.5 1.0 1.5 2.0
Gasoline ICE Diesel ICE
FT Diesel ICE Diesel DME
Hydrogen FC
FT Diesel ICE Diesel DME
Hydrogen FC Plug-in: EV only
FT Diesel ICE E85 ICE
Diesel DME Hydrogen FC
Plug-in: EV only RME Diesel ICE
Plug-in: EV only
WTW CO2 (relative to gasoline ICE)
Well-to-Tank Tank-to-Wheel
Oil
Natural Gas
Coal
Biomass
US E-Mix
CO2 ProductionCO2 Production Energy ConsumptionEnergy Consumption
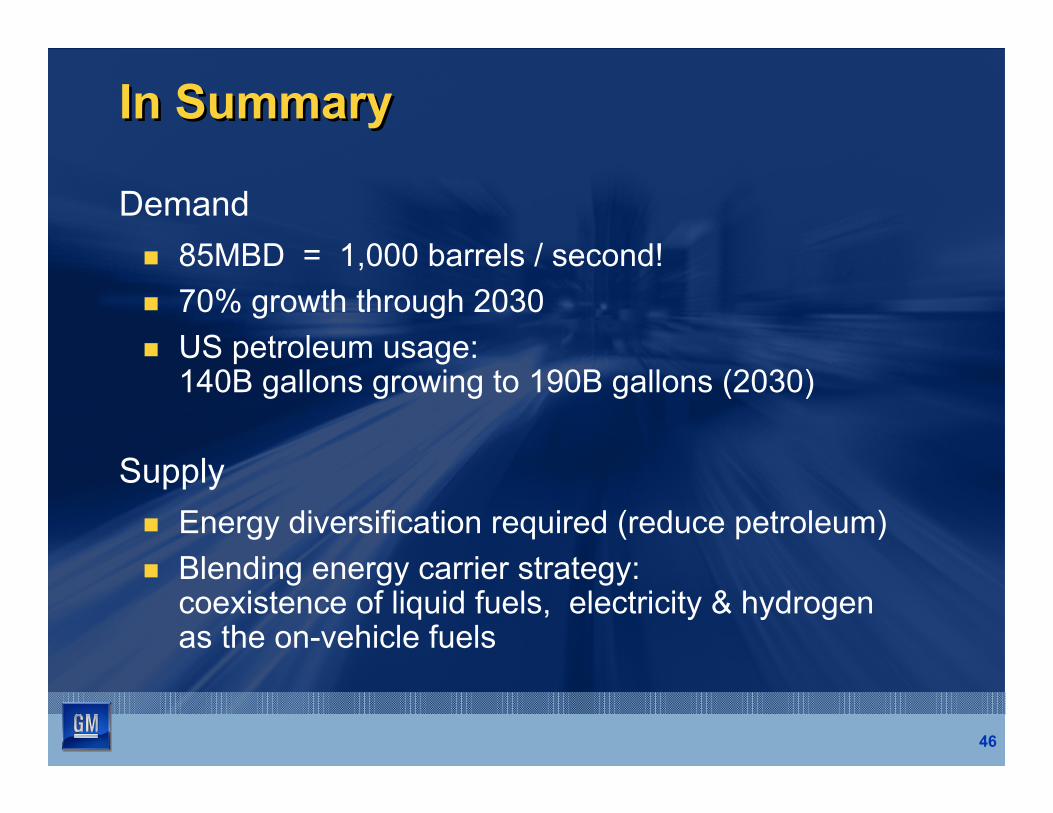
In SummaryIn Summary
Demand � 85MBD = 1,000 barrels / second! � 70% growth through 2030 � US petroleum usage:
140B gallons growing to 190B gallons (2030)
Supply � Energy diversification required (reduce petroleum) � Blending energy carrier strategy:
coexistence of liquid fuels, electricity & hydrogenas the on-vehicle fuels
46
47
Alternate Resources – A Blending StrategyAlternate Resources – A Blending Strategy
Fuel-Cell ElectricHydrogen
Shift Reaction
Electricity
Heat
Renewables (Solar, Wind, Hydro)
Nuclear
Energy Carrier Propulsion SystemConversion
Elec
trifi
catio
nEl
ectr
ifica
tion
Energy Resource
ICE Hybrid
Conventional ICE: Gasoline / DieselLiquid
Fuels
Petroleum FuelsOil (Conventional)
Oil (Non-Conventional) Synthetic Fuels (XTL)
Syngas CO, H2
Fischer Tropsch
Coal
Natural Gas
1st and 2nd Generation Biofuels
Biomass
Liquid Fuels / Electricity / Hydrogen as the In-Vehicle Energy Carriers
Regional Niche Gaseous
Fuels
Crit
ical
Dep
ende
ncy
on B
atte
ry T
echn
olog
y
Plug-In Hybrid ICE
Electric Vehicle

GM’s CommitmentGM’s Commitment
Promote & execute a “Blending Energy CarrierStrategy”
� Efficiency: Implement Advanced PropulsionTechnologies to optimize fuel efficiency and minimizeemissions
� Biomass: Accelerate the utilization of biomass with E85 and Bio Diesel capable propulsion systems
� Electrification: Drive the electrification of the vehicle - Hybrid vehicles & plug in hybrids- State of the art “Electric Drive” systems
� Hydrogen: Reinvent the automobile through thedesign, development and validation of a productionviable automotive fuel cell system
48
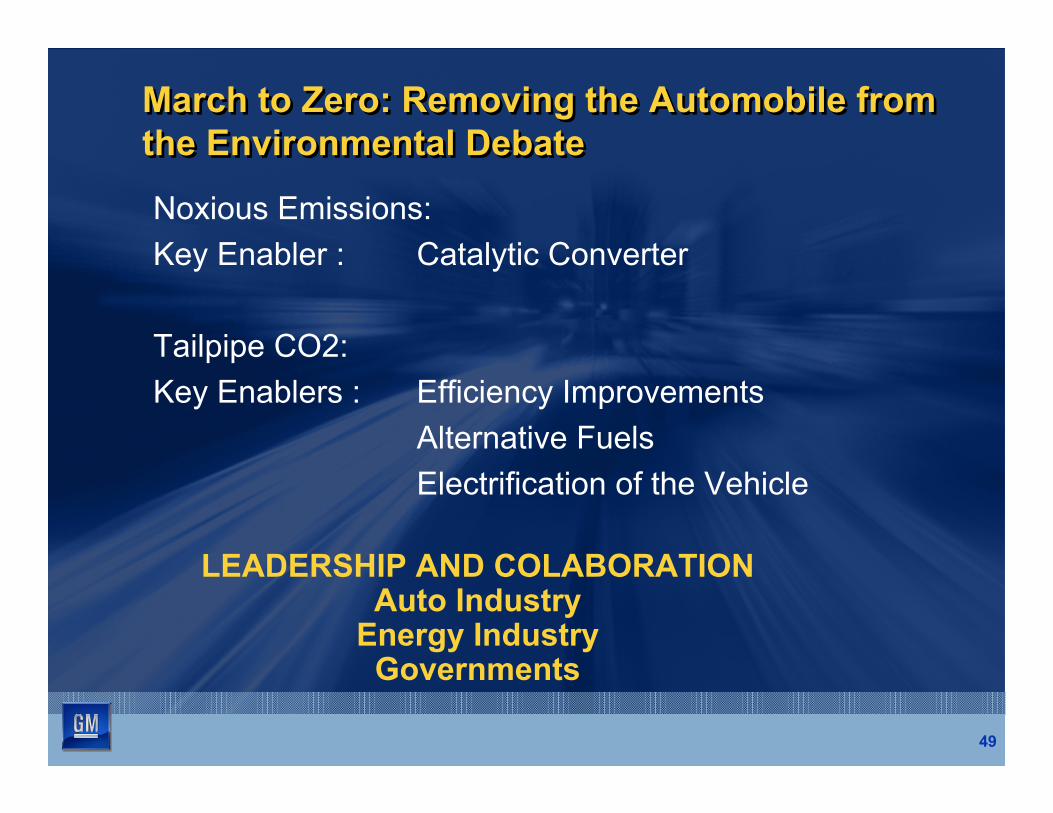
March to Zero: Removing the Automobile fromMarch to Zero: Removing the Automobile from the Environmental Debatethe Environmental Debate
Noxious Emissions:Key Enabler : Catalytic Converter
Tailpipe CO2: Key Enablers : Efficiency Improvements
Alternative Fuels Electrification of the Vehicle
LEADERSHIP AND COLABORATIONAuto Industry
Energy IndustryGovernments
49

50
Thank You for your Attention.Thank You for your Attention.

51
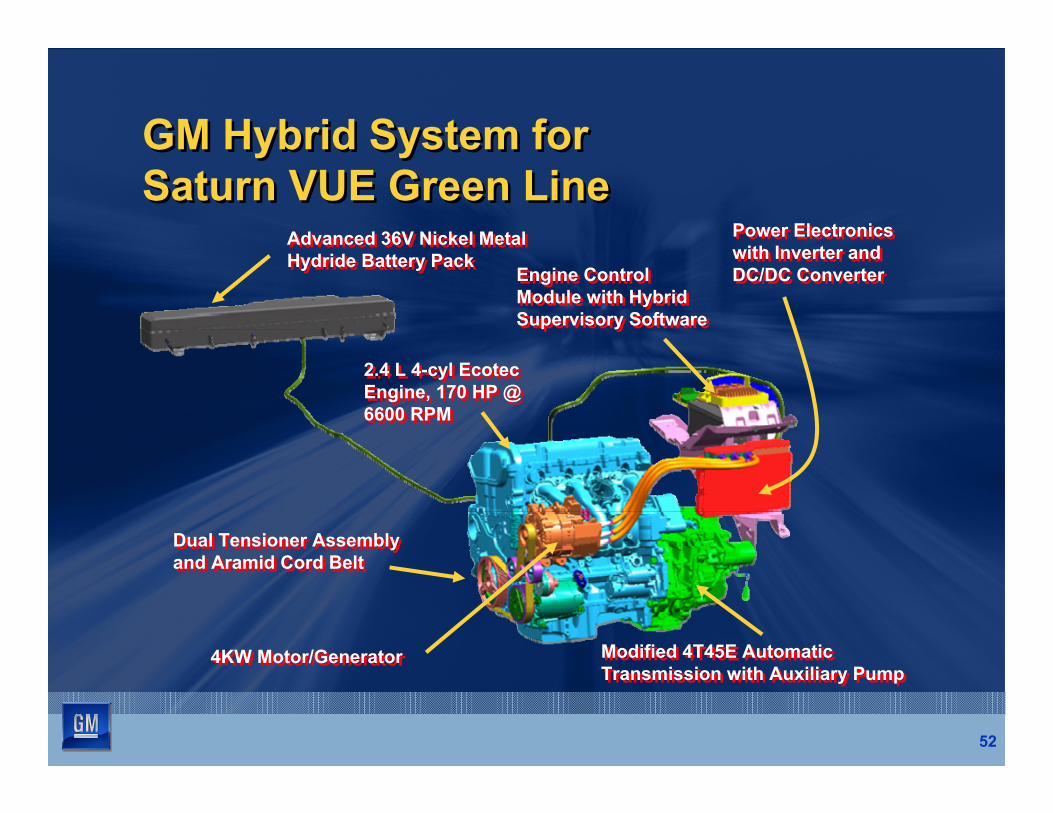
� Delivers 20% improved fuel economy
� Best highway fuel economy
� Priced less than $23,000
52
GM Hybrid System for Saturn VUE Green Line GM Hybrid System for Saturn VUE Green Line
Advanced 36V Nickel Metal Hydride Battery Pack Advanced 36V Nickel Metal Hydride Battery Pack
Engine Control Module with Hybrid Supervisory Software
Engine Control Module with Hybrid Supervisory Software
2.4 L 4-cyl Ecotec Engine, 170 HP @ 6600 RPM
2.4 L 4-cyl Ecotec Engine, 170 HP @ 6600 RPM
Dual Tensioner Assembly and Aramid Cord Belt Dual Tensioner Assemblyand Aramid Cord Belt
Modified 4T45E Automatic Transmission with Auxiliary Pump Modified 4T45E Automatic Transmission with Auxiliary Pump
Power Electronics with Inverter and DC/DC Converter
Power Electronics with Inverter andDC/DC Converter
4KW Motor/Generator4KW Motor/Generator
53
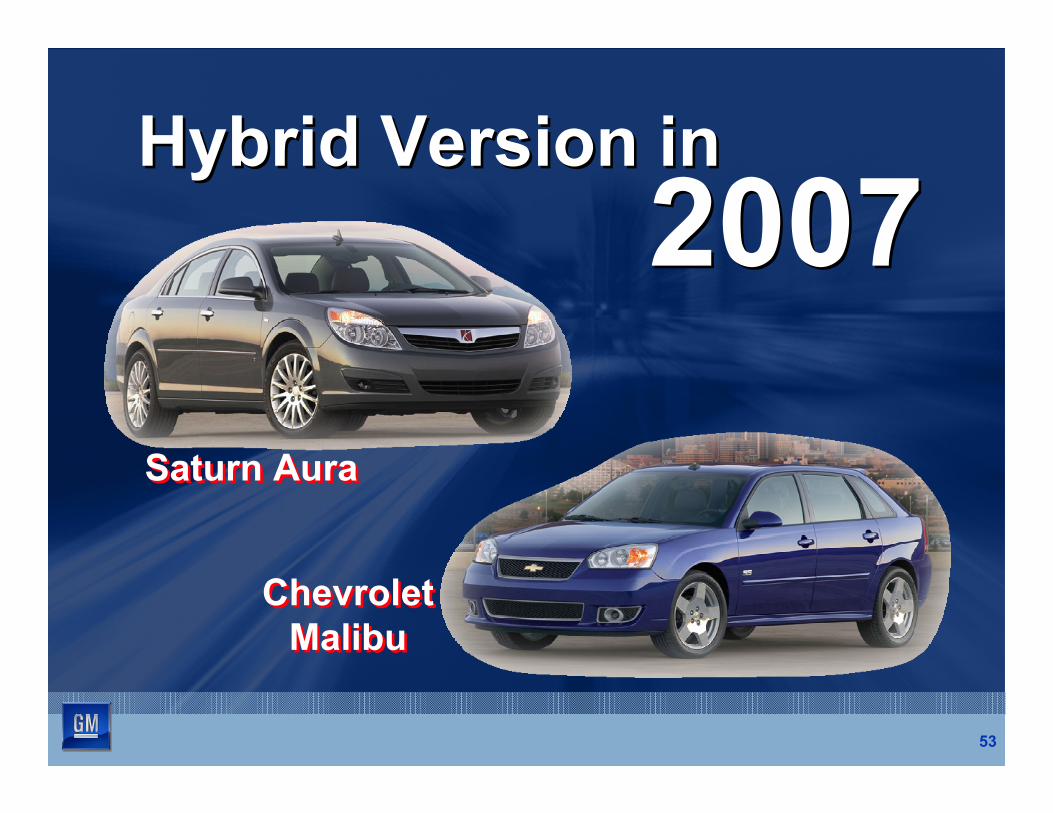
Hybrid Version inHybrid Version in20072007
Saturn AuraSaturn Aura
Chevrolet Malibu
ChevroletMalibu

54
Chevy Avalanche , Suburban & Tahoe
GMC Yukon & Yukon XL
Chevy SilveradoGMC Sierra
Chevy Uplander
Chevy Monte Carlo
Chevy Impala
The GM U.S. “FlexFuel Club” 17 models for 2007 MY! The GM U.S. “FlexFuel Club”17 models for 2007 MY!
GMC Savana

Powertrain Technology Global HighlightsPowertrain Technology Global Highlights2007 MY2007 MY
� Active Fuel Management: 9 engine variants in 15 models available� Active Fuel Management: 9 engine variants in 15 models available � Variable Valve Timing: 26 engine variants in 66 car and truck models26 engine variants in 66 car and truck models� Variable Valve Timing: �� SIDI: Globally, 2 engine variants in 9 modelsSIDI: Globally, 2 engine variants in 9 models�� Port De-Activation: 6 engiPort De-Activation: ne variants in 16 models6 engine variants in 16 models � Turbocharged GasolineTurbocharged Gasoline Engines: 14 engine variants in 18 models� Engines: 14 engine variants in 18 models �� Six-speed TransmissionsSix-speed Transmissions
─ AT: 7 new variants in 41 global models─ AT: 7 new variants in 41 global models─ MT: 7 variants in 21 global models─ MT: 7 variants in 21 global models
�� Diesel EnginesDiesel Engines─ 17 engine variants available in 45 vehicle lines─ 17 engine variants available in 45 vehicle lines─ More than one million diesel engines annually─ More than one million diesel engines annually
55
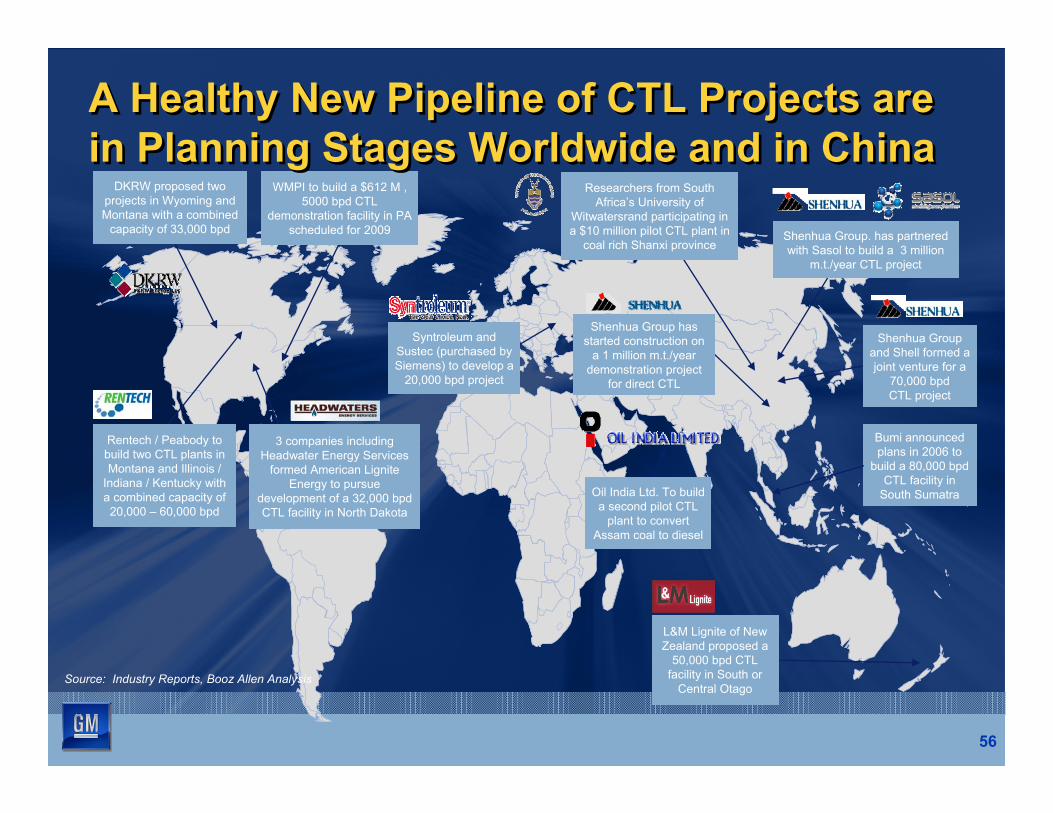
A Healthy New Pipeline of CTL Projects areA Healthy New Pipeline of CTL Projects are in Planning Stages Worldwide and in Chinain Planning Stages Worldwide and in China
DKRW proposed two WMPI to build a $612 M , projects in Wyoming and 5000 bpd CTL Montana with a combined demonstration facility in PA
capacity of 33,000 bpd
Rentech / Peabody to build two CTL plants in Montana and Illinois /
Indiana / Kentucky with a combined capacity of 20,000 – 60,000 bpd
scheduled for 2009
Syntroleum and Sustec (purchased by Siemens) to develop a
20,000 bpd project
3 companies including Headwater Energy Services
formed American Lignite Energy to pursue
development of a 32,000 bpd CTL facility in North Dakota
Researchers from South Africa’s University of
Witwatersrand participating in a $10 million pilot CTL plant in
coal rich Shanxi province
Shenhua Group has started construction on
a 1 million m.t./year demonstration project
for direct CTL
Oil India Ltd. To build a second pilot CTL
plant to convert Assam coal to diesel
Shenhua Group. has partnered with Sasol to build a 3 million
m.t./year CTL project
Shenhua Group and Shell formed a joint venture for a
70,000 bpd CTL project
Bumi announced plans in 2006 to
build a 80,000 bpd CTL facility in
South Sumatra
L&M Lignite of New Zealand proposed a
50,000 bpd CTL facility in South or
Central Otago Source: Industry Reports, Booz Allen Analysis
56