Embed Size (px)
Citation preview
The Dreyfus Fund Incorporated
ANNUAL REPORT December 31, 2017
Save time. Save paper. View your next shareholder report onlineas soon as it’s available. Log into www.dreyfus.com and sign upfor Dreyfus eCommunications. It’s simple and only takes a fewminutes.
The views expressed in this report reflect those of the portfoliomanager(s) only through the end of the period covered and do notnecessarily represent the views of Dreyfus or any other person in theDreyfus organization. Any such views are subject to change at any time based upon market or other conditions and Dreyfus disclaimsany responsibility to update such views. These views may not berelied on as investment advice and, because investment decisions fora Dreyfus fund are based on numerous factors, may not be relied on as an indication of trading intent on behalf of any Dreyfus fund.
Not FDIC-Insured • Not Bank-Guaranteed • May Lose Value
Contents T H E F U N D
A Letter from the President of Dreyfus 2 Discussion of Fund Performance 3 Fund Performance 5 Understanding Your Fund’s Expenses 6 Comparing Your Fund’s Expenses With Those of Other Funds 6 Statement of Investments 7 Statement of Investments in Affiliated Issuers 10 Statement of Assets and Liabilities 11 Statement of Operations 12 Statement of Changes in Net Assets 13 Financial Highlights 14 Notes to Financial Statements 15 Report of Independent Registered Public Accounting Firm 21 Important Tax Information 22 Information About the Renewal of the Fund’s Management Agreement 23 Board Members Information 27 Officers of the Fund 30
F O R M O R E I N F O R M AT I O N
Back Cover
2
A LETTER FROM THE PRESIDENT OF DREYFUS
Dear Shareholder:
We are pleased to present this annual report for The Dreyfus Fund Incorporated, covering the 12-month period from January 1, 2017 through December 31, 2017. For information about how the fund performed during the reporting period, as well as general market perspectives, we provide a Discussion of Fund Performance on the pages that follow.
Stocks set a series of new record highs and bonds produced modestly positive results during 2017. Financial markets early in the year were dominated by the inauguration of a new U.S. president, as equities and corporate-backed bonds surged higher in anticipation of more business-friendly regulatory, tax, and fiscal policies. U.S. and international stocks continued to rally in the spring as corporate earnings grew and global economic conditions improved. Later in the year, the passage of tax reform legislation fueled additional stock market gains.
Despite three short-term interest rate hikes and concerns early in the year that inflation might accelerate in a growing economy, bonds generally produced positive total returns in 2017. Corporate-backed securities and municipal bonds fared particularly well.
The markets’ strong performance last year was supported by solid underlying fundamentals, including sustained economic growth, a robust labor market, and low inflation. We currently expect these favorable conditions to persist in 2018, but we remain watchful for economic and political developments that could negatively impact the markets. As always, we encourage you to discuss the risks and opportunities of today’s investment environment with your financial advisor.
Thank you for your continued confidence and support.
Sincerely,
Renee Laroche-Morris President The Dreyfus Corporation January 16, 2018
The Dreyfus Fund Incorporated The Fund
DISCUSSION OF FUND PERFORMANCE
3
For the period from January 1, 2017 through December 31, 2017, as provided by Elizabeth Slover, David Sealy, Leigh Todd, and Barry K. Mills, Primary Portfolio Managers
Market and Fund Performance Overview For the 12-month period ended December 31, 2017, The Dreyfus Fund Incorporated produced a total return of 20.12%.1 In comparison, the S&P 500® Index (the “Index”), the fund’s benchmark, provided a total return of 21.82% for the same period.2
U.S. equities gained considerable ground during 2017 amid continued economic expansion, better-than-expected corporate earnings, and expectations of stimulative U.S. government policies. The fund lagged the Index, largely due to security selection shortfalls in the financials, consumer staples, and health care sectors.
The Fund’s Investment Approach The fund seeks long-term capital growth consistent with the preservation of capital. Current income is a secondary goal. To pursue these goals, the fund primarily invests in common stocks issued by U.S. companies. The fund may invest up to 20% of its assets in foreign securities. In choosing stocks, we focus on large-capitalization U.S. companies with strong positions in their industries and catalysts that can trigger a price increase. We use fundamental analysis to create a broadly diversified portfolio composed of a blend of growth stocks, value stocks, and stocks that exhibit characteristics of both investment styles. We attempt to measure a security’s intrinsic value by analyzing “real” data (company financials, economic outlook, etc.) and other factors (management, industry conditions, competition, etc.) and select stocks based on value, growth, and financial profile.
Favorable Conditions for Equities Prevailed Equity markets were reenergized in the weeks before the start of 2017 in anticipation of a new presidential administration’s more business-friendly policies, which were expected to stimulate greater economic growth. In early 2017, better-than-expected corporate earnings and the onset of synchronized global economic growth drove the Index to a series of new highs. The market rally paused in the spring, but strengthening U.S. labor markets, further corporate earnings growth, and improving global economic conditions soon sparked additional market gains. Later in the year, the market continued to rise as investors looked forward to the passage of federal tax-reform legislation.
Economically sensitive, growth-oriented market segments fared particularly well, led by the information technology sector. The materials, industrials, and consumer discretionary sectors also outperformed market averages, though to a lesser degree. In contrast, higher-yielding and traditionally defensive market sectors lagged, with the telecommunication services, real estate, and energy sectors proving weakest.
A Few Stock Selections Disappointed A small number of disappointing stock selections detracted from the fund’s performance compared to the Index. In the financials sector, consumer finance company Synchrony Financial lost ground due to credit concerns and a weaker-than-expected outlook, while depository institution U.S. Bancorp lagged to a lesser extent due to the company’s
DISCUSSION OF FUND PERFORMANCE (continued)
4
disappointing growth profile. The fund also underperformed the Index in the consumer staples sector, where beverage maker Molson Coors Brewing failed to realize expected synergies in the wake of an acquisition, and food producers Kellogg and Kraft Heinz came under pressure from competitive challenges in the grocery industry. In the health care sector, biotechnology developer Biogen dipped after two of the company’s most profitable drugs missed sales targets, while another biotechnology holding, Celgene, also suffered due to weak sales of a key drug. Lack of exposure to high-flying pharmaceutical maker AbbVie further hampered the fund’s relative performance. Disappointing holdings in other areas included oilfield services giants Halliburton and Schlumberger, which were hurt during the first half of the reporting period by weak oil prices.
On a more positive note, the fund produced relatively strong gains in the industrials sector by avoiding embattled conglomerate General Electric and focusing instead on Honeywell International, which outperformed sector averages. Likewise, in the telecommunication services sector, the fund avoided AT&T in favor of well-timed investments in Verizon Communications. The fund’s only utilities sector holding, NextEra Energy, generated returns that were nearly three times higher than the sector’s average gain. Overweighted exposure to the information technology sector also contributed positively to the fund’s results, as did several strong individual holdings, including social media giant Facebook, online information provider Alphabet, semiconductor makers Broadcom and Texas Instruments, and software developers salesforce.com and Microsoft. Online retailer Amazon.com further enhanced the fund’s relative returns.
Positioned for Further Growth With global and U.S. economic growth continuing to accelerate at the start of 2018, we believe prospects for U.S. equity markets remain strong. Several industry groups appear particularly well poised to benefit in the current environment. We believe that we have positioned the fund to participate in potential market gains by allocating a relatively large percentage of assets to investments in the information technology, health care (where we are focusing on plan providers), materials (with an emphasis on chemicals and metals-and-mining stocks), and industrials sectors. In contrast, the fund currently holds underweighted exposure to the consumer staples, utilities, and financials sectors, and no exposure to real estate stocks.
January 16, 2018 1 Total return includes reinvestment of dividends and any capital gains paid. Past performance is no guarantee of future results. Share
price and investment return fluctuate such that upon redemption, fund shares may be worth more or less than their original cost. 2 Source: Lipper Inc. — The S&P 500® Index is widely regarded as the best single gauge of large-cap U.S. equities. The index
includes 500 leading companies and captures approximately 80% coverage of available market capitalization. Investors cannot invest directly in any index.
Please note: the position in any security highlighted with italicized typeface was sold during the reporting period. Equities are subject generally to market, market sector, market liquidity, issuer, and investment style risks, among other factors, to varying degrees, all of which are more fully described in the fund’s prospectus.
FUND PERFORMANCE
5
6,000
10,250
14,500
18,750
23,000
1716151413121110090807
Years Ended 12/31
Dol
lars
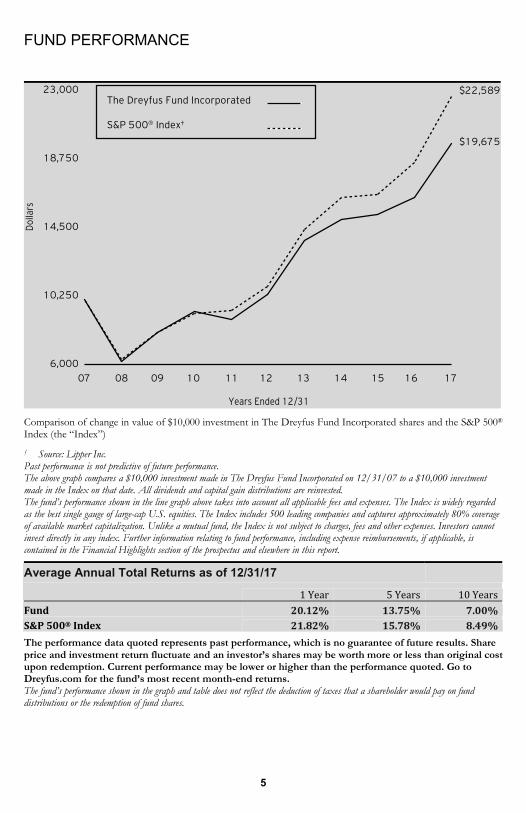
$22,589
$19,675
The Dreyfus Fund Incorporated
S&P 500® Index†
Comparison of change in value of $10,000 investment in The Dreyfus Fund Incorporated shares and the S&P 500® Index (the “Index”) † Source: Lipper Inc. Past performance is not predictive of future performance. The above graph compares a $10,000 investment made in The Dreyfus Fund Incorporated on 12/31/07 to a $10,000 investment made in the Index on that date. All dividends and capital gain distributions are reinvested. The fund’s performance shown in the line graph above takes into account all applicable fees and expenses. The Index is widely regarded as the best single gauge of large-cap U.S. equities. The Index includes 500 leading companies and captures approximately 80% coverage of available market capitalization. Unlike a mutual fund, the Index is not subject to charges, fees and other expenses. Investors cannot invest directly in any index. Further information relating to fund performance, including expense reimbursements, if applicable, is contained in the Financial Highlights section of the prospectus and elsewhere in this report.
Average Annual Total Returns as of 12/31/17 1 Year 5 Years 10 YearsFund 20.12% 13.75% 7.00%S&P 500® Index 21.82% 15.78% 8.49%
The performance data quoted represents past performance, which is no guarantee of future results. Share price and investment return fluctuate and an investor’s shares may be worth more or less than original cost upon redemption. Current performance may be lower or higher than the performance quoted. Go to Dreyfus.com for the fund’s most recent month-end returns. The fund’s performance shown in the graph and table does not reflect the deduction of taxes that a shareholder would pay on fund distributions or the redemption of fund shares.
UNDERSTANDING YOUR FUND’S EXPENSES (Unaudited)
6
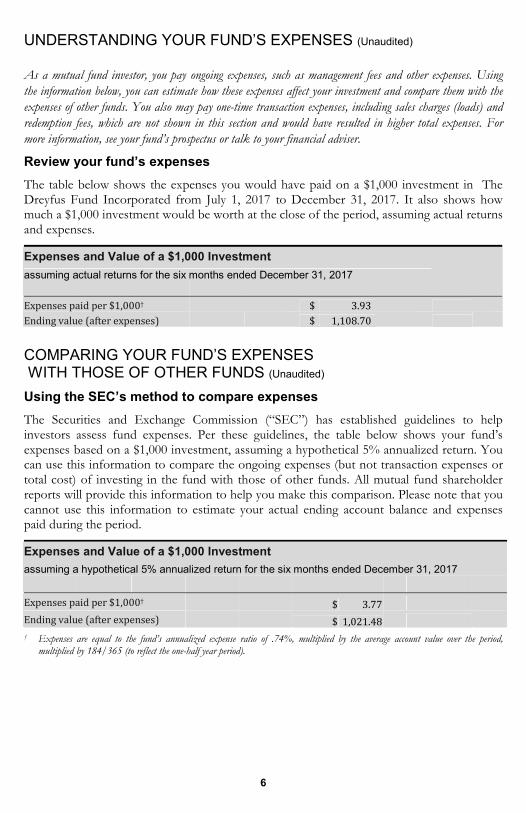
As a mutual fund investor, you pay ongoing expenses, such as management fees and other expenses. Using the information below, you can estimate how these expenses affect your investment and compare them with the expenses of other funds. You also may pay one-time transaction expenses, including sales charges (loads) and redemption fees, which are not shown in this section and would have resulted in higher total expenses. For more information, see your fund’s prospectus or talk to your financial adviser.
Review your fund’s expenses The table below shows the expenses you would have paid on a $1,000 investment in The Dreyfus Fund Incorporated from July 1, 2017 to December 31, 2017. It also shows how much a $1,000 investment would be worth at the close of the period, assuming actual returns and expenses.
Expenses and Value of a $1,000 Investment assuming actual returns for the six months ended December 31, 2017 Expenses paid per $1,000† $ 3.93 Ending value (after expenses) $ 1,108.70
COMPARING YOUR FUND’S EXPENSES WITH THOSE OF OTHER FUNDS (Unaudited) Using the SEC’s method to compare expenses The Securities and Exchange Commission (“SEC”) has established guidelines to help investors assess fund expenses. Per these guidelines, the table below shows your fund’s expenses based on a $1,000 investment, assuming a hypothetical 5% annualized return. You can use this information to compare the ongoing expenses (but not transaction expenses or total cost) of investing in the fund with those of other funds. All mutual fund shareholder reports will provide this information to help you make this comparison. Please note that you cannot use this information to estimate your actual ending account balance and expenses paid during the period.
Expenses and Value of a $1,000 Investment assuming a hypothetical 5% annualized return for the six months ended December 31, 2017 Expenses paid per $1,000† $ 3.77 Ending value (after expenses) $ 1,021.48 † Expenses are equal to the fund’s annualized expense ratio of .74%, multiplied by the average account value over the period,
multiplied by 184/365 (to reflect the one-half year period).
STATEMENT OF INVESTMENTS December 31, 2017
7
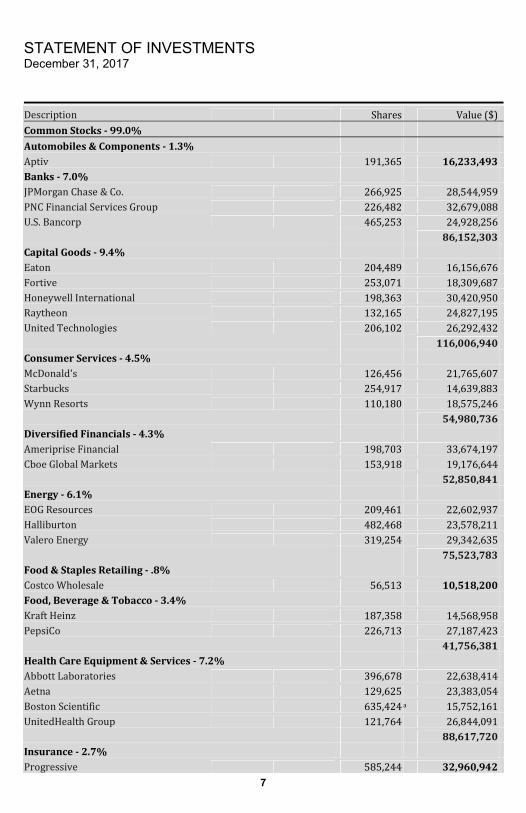
Description Shares Value ($)Common Stocks - 99.0%
Automobiles & Components - 1.3% Aptiv 191,365 16,233,493Banks - 7.0% JPMorgan Chase & Co. 266,925 28,544,959PNC Financial Services Group 226,482 32,679,088U.S. Bancorp 465,253 24,928,256 86,152,303Capital Goods - 9.4% Eaton 204,489 16,156,676Fortive 253,071 18,309,687Honeywell International 198,363 30,420,950Raytheon 132,165 24,827,195United Technologies 206,102 26,292,432 116,006,940Consumer Services - 4.5% McDonald's 126,456 21,765,607Starbucks 254,917 14,639,883Wynn Resorts 110,180 18,575,246 54,980,736Diversified Financials - 4.3% Ameriprise Financial 198,703 33,674,197Cboe Global Markets 153,918 19,176,644 52,850,841Energy - 6.1% EOG Resources 209,461 22,602,937Halliburton 482,468 23,578,211Valero Energy 319,254 29,342,635 75,523,783Food & Staples Retailing - .8% Costco Wholesale 56,513 10,518,200Food, Beverage & Tobacco - 3.4% Kraft Heinz 187,358 14,568,958PepsiCo 226,713 27,187,423 41,756,381Health Care Equipment & Services - 7.2% Abbott Laboratories 396,678 22,638,414Aetna 129,625 23,383,054Boston Scientific 635,424 a 15,752,161UnitedHealth Group 121,764 26,844,091 88,617,720Insurance - 2.7% Progressive 585,244 32,960,942
STATEMENT OF INVESTMENTS (continued)
8
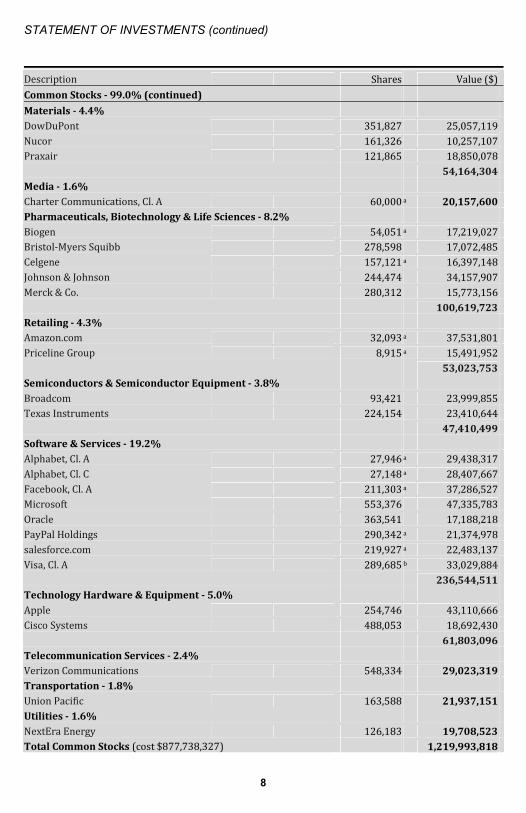
Description Shares Value ($)Common Stocks - 99.0% (continued)
Materials - 4.4% DowDuPont 351,827 25,057,119Nucor 161,326 10,257,107Praxair 121,865 18,850,078 54,164,304Media - 1.6% Charter Communications, Cl. A 60,000 a 20,157,600Pharmaceuticals, Biotechnology & Life Sciences - 8.2% Biogen 54,051 a 17,219,027Bristol-Myers Squibb 278,598 17,072,485Celgene 157,121 a 16,397,148Johnson & Johnson 244,474 34,157,907Merck & Co. 280,312 15,773,156 100,619,723Retailing - 4.3% Amazon.com 32,093 a 37,531,801Priceline Group 8,915 a 15,491,952 53,023,753Semiconductors & Semiconductor Equipment - 3.8% Broadcom 93,421 23,999,855Texas Instruments 224,154 23,410,644 47,410,499Software & Services - 19.2% Alphabet, Cl. A 27,946 a 29,438,317Alphabet, Cl. C 27,148 a 28,407,667Facebook, Cl. A 211,303 a 37,286,527Microsoft 553,376 47,335,783Oracle 363,541 17,188,218PayPal Holdings 290,342 a 21,374,978salesforce.com 219,927 a 22,483,137Visa, Cl. A 289,685 b 33,029,884 236,544,511Technology Hardware & Equipment - 5.0% Apple 254,746 43,110,666Cisco Systems 488,053 18,692,430 61,803,096Telecommunication Services - 2.4% Verizon Communications 548,334 29,023,319Transportation - 1.8% Union Pacific 163,588 21,937,151Utilities - 1.6% NextEra Energy 126,183 19,708,523Total Common Stocks (cost $877,738,327) 1,219,993,818
9
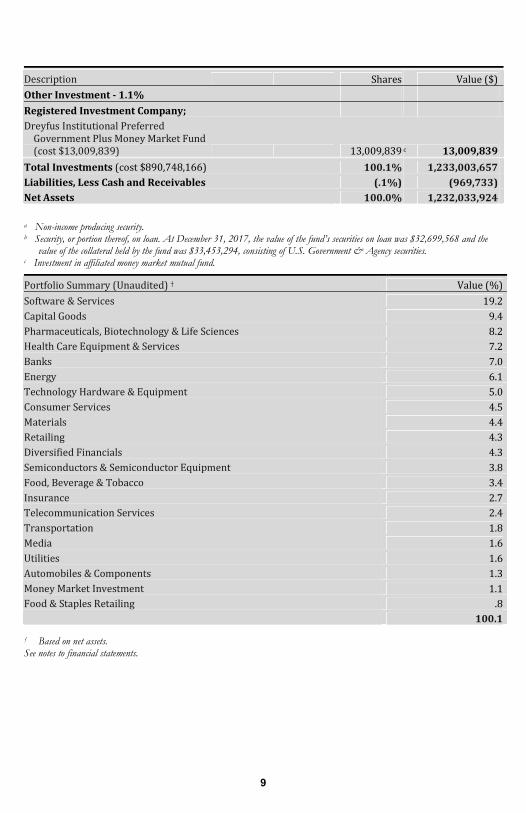
Description Shares Value ($)Other Investment - 1.1%
Registered Investment Company; Dreyfus Institutional Preferred Government Plus Money Market Fund(cost $13,009,839) 13,009,839 c 13,009,839
Total Investments (cost $890,748,166) 100.1% 1,233,003,657Liabilities, Less Cash and Receivables (.1%) (969,733)Net Assets 100.0% 1,232,033,924
a Non-income producing security. b Security, or portion thereof, on loan. At December 31, 2017, the value of the fund’s securities on loan was $32,699,568 and the
value of the collateral held by the fund was $33,453,294, consisting of U.S. Government & Agency securities. c Investment in affiliated money market mutual fund. Portfolio Summary (Unaudited) † Value (%)Software & Services 19.2Capital Goods 9.4Pharmaceuticals, Biotechnology & Life Sciences 8.2Health Care Equipment & Services 7.2Banks 7.0Energy 6.1Technology Hardware & Equipment 5.0Consumer Services 4.5Materials 4.4Retailing 4.3Diversified Financials 4.3Semiconductors & Semiconductor Equipment 3.8Food, Beverage & Tobacco 3.4Insurance 2.7Telecommunication Services 2.4Transportation 1.8Media 1.6Utilities 1.6Automobiles & Components 1.3Money Market Investment 1.1Food & Staples Retailing .8 100.1
† Based on net assets. See notes to financial statements.
STATEMENT OF INVESTMENTS IN AFFILIATED ISSUERS
10
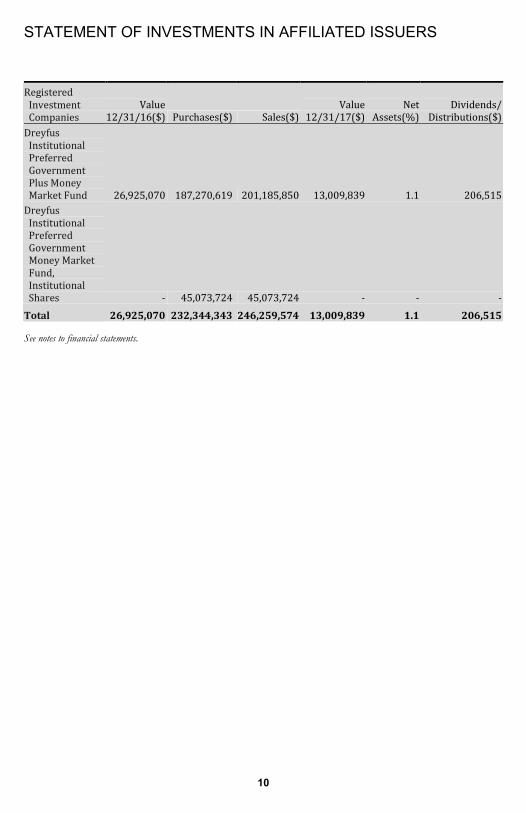
Registered Investment Companies Value 12/31/16($) Purchases($) Sales($) Value 12/31/17($) NetAssets(%) Dividends/Distributions($)Dreyfus Institutional Preferred Government Plus Money Market Fund 26,925,070 187,270,619 201,185,850 13,009,839 1.1 206,515Dreyfus Institutional Preferred Government Money Market Fund, Institutional Shares - 45,073,724 45,073,724 - - -Total 26,925,070 232,344,343 246,259,574 13,009,839 1.1 206,515
See notes to financial statements.
STATEMENT OF ASSETS AND LIABILITIES December 31, 2017
11
Cost Value
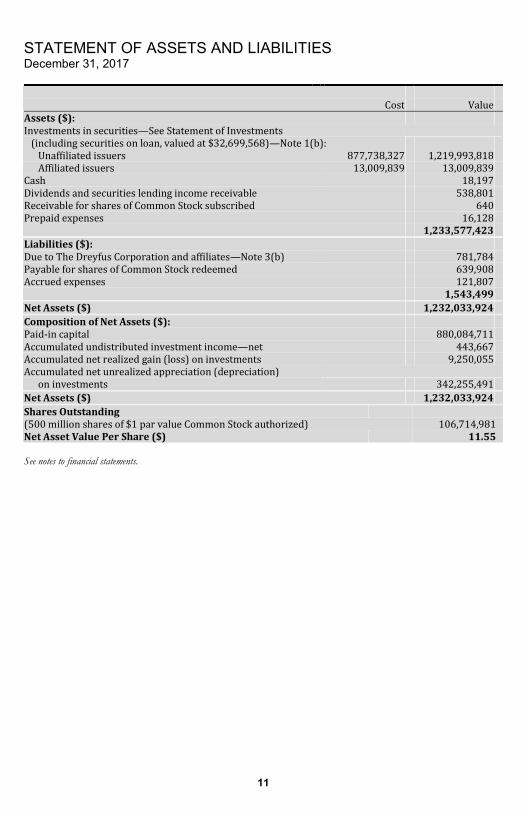
Assets ($): Investments in securities—See Statement of Investments (including securities on loan, valued at $32,699,568)—Note 1(b): Unaffiliated issuers 877,738,327 1,219,993,818 Affiliated issuers 13,009,839 13,009,839 Cash 18,197 Dividends and securities lending income receivable 538,801 Receivable for shares of Common Stock subscribed 640 Prepaid expenses 16,128 1,233,577,423 Liabilities ($): Due to The Dreyfus Corporation and affiliates—Note 3(b) 781,784 Payable for shares of Common Stock redeemed 639,908 Accrued expenses 121,807 1,543,499 Net Assets ($) 1,232,033,924 Composition of Net Assets ($): Paid-in capital 880,084,711 Accumulated undistributed investment income—net 443,667 Accumulated net realized gain (loss) on investments 9,250,055 Accumulated net unrealized appreciation (depreciation) on investments 342,255,491 Net Assets ($) 1,232,033,924 Shares Outstanding (500 million shares of $1 par value Common Stock authorized) 106,714,981 Net Asset Value Per Share ($) 11.55 See notes to financial statements.
STATEMENT OF OPERATIONS Year Ended December 31, 2017
12
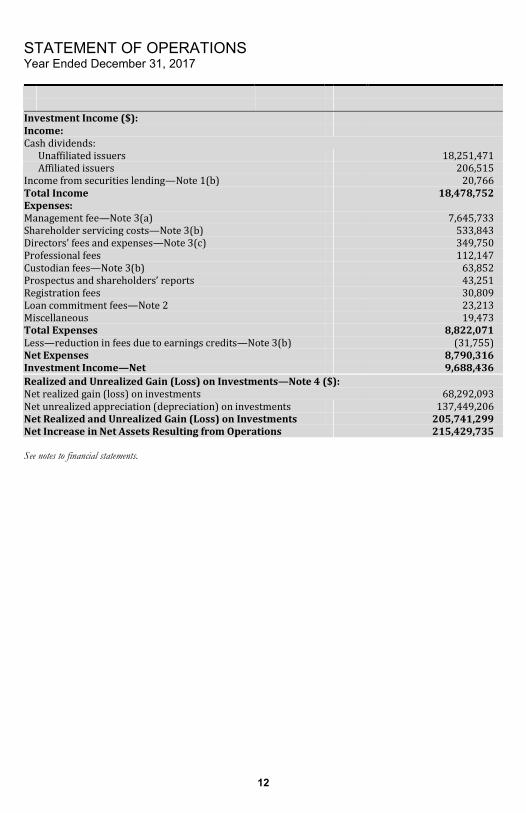
Investment Income ($): Income: Cash dividends: Unaffiliated issuers 18,251,471 Affiliated issuers 206,515 Income from securities lending—Note 1(b) 20,766 Total Income 18,478,752 Expenses: Management fee—Note 3(a) 7,645,733 Shareholder servicing costs—Note 3(b) 533,843 Directors’ fees and expenses—Note 3(c) 349,750 Professional fees 112,147 Custodian fees—Note 3(b) 63,852 Prospectus and shareholders’ reports 43,251 Registration fees 30,809 Loan commitment fees—Note 2 23,213 Miscellaneous 19,473 Total Expenses 8,822,071 Less—reduction in fees due to earnings credits—Note 3(b) (31,755) Net Expenses 8,790,316 Investment Income—Net 9,688,436 Realized and Unrealized Gain (Loss) on Investments—Note 4 ($): Net realized gain (loss) on investments 68,292,093 Net unrealized appreciation (depreciation) on investments 137,449,206 Net Realized and Unrealized Gain (Loss) on Investments 205,741,299 Net Increase in Net Assets Resulting from Operations 215,429,735 See notes to financial statements.
STATEMENT OF CHANGES IN NET ASSETS
13
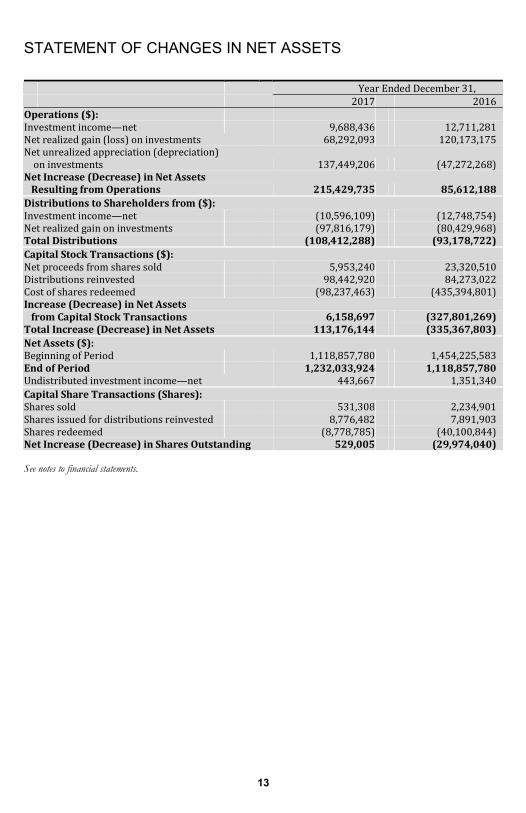
Year Ended December 31, 2017 2016
Operations ($): Investment income—net 9,688,436 12,711,281 Net realized gain (loss) on investments 68,292,093 120,173,175 Net unrealized appreciation (depreciation) on investments 137,449,206 (47,272,268) Net Increase (Decrease) in Net Assets Resulting from Operations 215,429,735 85,612,188 Distributions to Shareholders from ($): Investment income—net (10,596,109) (12,748,754) Net realized gain on investments (97,816,179) (80,429,968) Total Distributions (108,412,288) (93,178,722) Capital Stock Transactions ($): Net proceeds from shares sold 5,953,240 23,320,510 Distributions reinvested 98,442,920 84,273,022 Cost of shares redeemed (98,237,463) (435,394,801) Increase (Decrease) in Net Assets from Capital Stock Transactions 6,158,697 (327,801,269) Total Increase (Decrease) in Net Assets 113,176,144 (335,367,803) Net Assets ($): Beginning of Period 1,118,857,780 1,454,225,583 End of Period 1,232,033,924 1,118,857,780 Undistributed investment income—net 443,667 1,351,340 Capital Share Transactions (Shares): Shares sold 531,308 2,234,901 Shares issued for distributions reinvested 8,776,482 7,891,903 Shares redeemed (8,778,785) (40,100,844) Net Increase (Decrease) in Shares Outstanding 529,005 (29,974,040) See notes to financial statements.
FINANCIAL HIGHLIGHTS
14
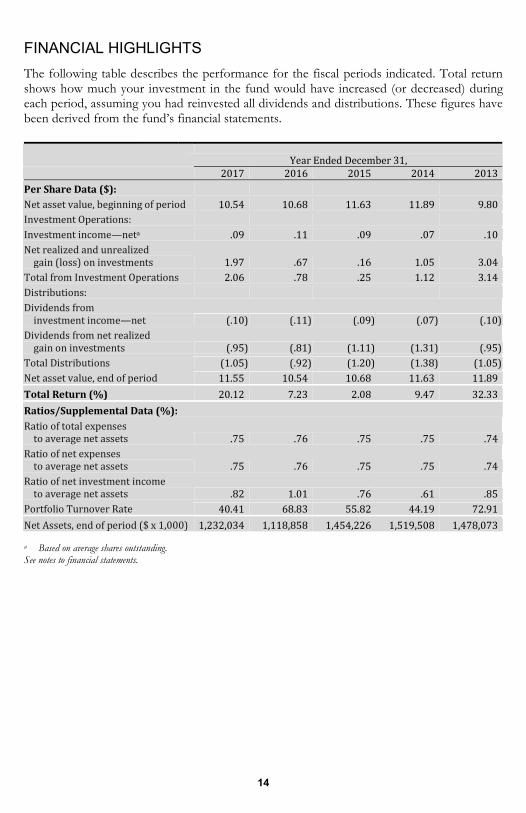
The following table describes the performance for the fiscal periods indicated. Total return shows how much your investment in the fund would have increased (or decreased) during each period, assuming you had reinvested all dividends and distributions. These figures have been derived from the fund’s financial statements.
Year Ended December 31, 2017 2016 2015 2014 2013Per Share Data ($): Net asset value, beginning of period 10.54 10.68 11.63 11.89 9.80Investment Operations: Investment income—neta .09 .11 .09 .07 .10Net realized and unrealized gain (loss) on investments 1.97 .67 .16 1.05 3.04Total from Investment Operations 2.06 .78 .25 1.12 3.14Distributions: Dividends from investment income—net (.10) (.11) (.09) (.07) (.10)Dividends from net realized gain on investments (.95) (.81) (1.11) (1.31) (.95)Total Distributions (1.05) (.92) (1.20) (1.38) (1.05)Net asset value, end of period 11.55 10.54 10.68 11.63 11.89Total Return (%) 20.12 7.23 2.08 9.47 32.33Ratios/Supplemental Data (%): Ratio of total expenses to average net assets .75 .76 .75 .75 .74Ratio of net expenses to average net assets .75 .76 .75 .75 .74Ratio of net investment income to average net assets .82 1.01 .76 .61 .85Portfolio Turnover Rate 40.41 68.83 55.82 44.19 72.91Net Assets, end of period ($ x 1,000) 1,232,034 1,118,858 1,454,226 1,519,508 1,478,073
a Based on average shares outstanding. See notes to financial statements.
NOTES TO FINANCIAL STATEMENTS
15
NOTE 1—Significant Accounting Policies:
The Dreyfus Fund Incorporated (the “fund”) is registered under the Investment Company Act of 1940, as amended (the “Act”), as a diversified open-end management investment company. The fund’s investment objective is to seek long-term capital growth consistent with the preservation of capital. The Dreyfus Corporation (the “Manager” or “Dreyfus”), a wholly-owned subsidiary of The Bank of New York Mellon Corporation (“BNY Mellon”), serves as the fund’s investment adviser. MBSC Securities Corporation (the “Distributor”), a wholly-owned subsidiary of Dreyfus, is the distributor of the fund’s shares, which are sold to the public without a sales charge.
The Financial Accounting Standards Board (“FASB”) Accounting Standards Codification is the exclusive reference of authoritative U.S. generally accepted accounting principles (“GAAP”) recognized by the FASB to be applied by nongovernmental entities. Rules and interpretive releases of the Securities and Exchange Commission (“SEC”) under authority of federal laws are also sources of authoritative GAAP for SEC registrants. The fund’s financial statements are prepared in accordance with GAAP, which may require the use of management estimates and assumptions. Actual results could differ from those estimates.
The fund enters into contracts that contain a variety of indemnifications. The fund’s maximum exposure under these arrangements is unknown. The fund does not anticipate recognizing any loss related to these arrangements.
(a) Portfolio valuation: The fair value of a financial instrument is the amount that would be received to sell an asset or paid to transfer a liability in an orderly transaction between market participants at the measurement date (i.e., the exit price). GAAP establishes a fair value hierarchy that prioritizes the inputs of valuation techniques used to measure fair value. This hierarchy gives the highest priority to unadjusted quoted prices in active markets for identical assets or liabilities (Level 1 measurements) and the lowest priority to unobservable inputs (Level 3 measurements).
Additionally, GAAP provides guidance on determining whether the volume and activity in a market has decreased significantly and whether such a decrease in activity results in transactions that are not orderly. GAAP requires enhanced disclosures around valuation inputs and techniques used during annual and interim periods.
NOTES TO FINANCIAL STATEMENTS (continued)
16
Various inputs are used in determining the value of the fund’s investments relating to fair value measurements. These inputs are summarized in the three broad levels listed below:
Level 1—unadjusted quoted prices in active markets for identical investments.
Level 2—other significant observable inputs (including quoted prices for similar investments, interest rates, prepayment speeds, credit risk, etc.).
Level 3—significant unobservable inputs (including the fund’s own assumptions in determining the fair value of investments).
The inputs or methodology used for valuing securities are not necessarily an indication of the risk associated with investing in those securities.
Changes in valuation techniques may result in transfers in or out of an assigned level within the disclosure hierarchy. Valuation techniques used to value the fund’s investments are as follows:
Investments in securities are valued at the last sales price on the securities exchange or national securities market on which such securities are primarily traded. Securities listed on the National Market System for which market quotations are available are valued at the official closing price or, if there is no official closing price that day, at the last sales price. For open short positions, asked prices are used for valuation purposes. Bid price is used when no asked price is available. Registered investment companies that are not traded on an exchange are valued at their net asset value. All of the preceding securities are generally categorized within Level 1 of the fair value hierarchy.
Securities not listed on an exchange or the national securities market, or securities for which there were no transactions, are valued at the average of the most recent bid and asked prices. These securities are generally categorized within Level 2 of the fair value hierarchy.
Fair valuing of securities may be determined with the assistance of a pricing service using calculations based on indices of domestic securities and other appropriate indicators, such as prices of relevant American Depository Receipts and futures. Utilizing these techniques may result in transfers between Level 1 and Level 2 of the fair value hierarchy.
When market quotations or official closing prices are not readily available, or are determined to not accurately reflect fair value, such as when the value of a security has been significantly affected by events after the close of the exchange or market on which the security is principally traded (for
17
example, a foreign exchange or market), but before the fund calculates its net asset value, the fund may value these investments at fair value as determined in accordance with the procedures approved by the fund’s Board of Directors (the “Board”). Certain factors may be considered when fair valuing investments such as: fundamental analytical data, the nature and duration of restrictions on disposition, an evaluation of the forces that influence the market in which the securities are purchased and sold, and public trading in similar securities of the issuer or comparable issuers. These securities are either categorized within Level 2 or 3 of the fair value hierarchy depending on the relevant inputs used.
For restricted securities where observable inputs are limited, assumptions about market activity and risk are used and are generally categorized within Level 3 of the fair value hierarchy.
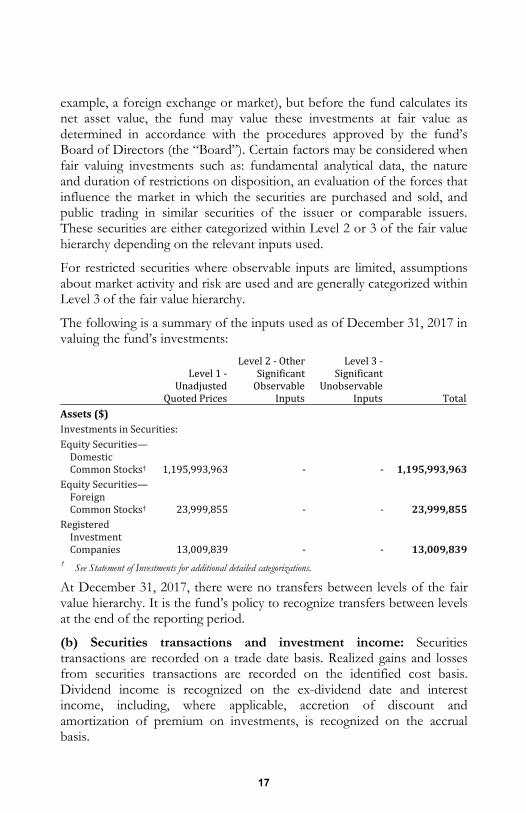
The following is a summary of the inputs used as of December 31, 2017 in valuing the fund’s investments:
Level 1 -Unadjusted Quoted PricesLevel 2 - Other Significant Observable Inputs
Level 3 -Significant Unobservable Inputs TotalAssets ($) Investments in Securities: Equity Securities—Domestic Common Stocks† 1,195,993,963 - - 1,195,993,963Equity Securities—Foreign Common Stocks† 23,999,855 - - 23,999,855Registered Investment Companies 13,009,839 - - 13,009,839† See Statement of Investments for additional detailed categorizations.
At December 31, 2017, there were no transfers between levels of the fair value hierarchy. It is the fund’s policy to recognize transfers between levels at the end of the reporting period.
(b) Securities transactions and investment income: Securities transactions are recorded on a trade date basis. Realized gains and losses from securities transactions are recorded on the identified cost basis. Dividend income is recognized on the ex-dividend date and interest income, including, where applicable, accretion of discount and amortization of premium on investments, is recognized on the accrual basis.
NOTES TO FINANCIAL STATEMENTS (continued)
18
Pursuant to a securities lending agreement with The Bank of New York Mellon, a subsidiary of BNY Mellon and an affiliate of Dreyfus, the fund may lend securities to qualified institutions. It is the fund’s policy that, at origination, all loans are secured by collateral of at least 102% of the value of U.S. securities loaned and 105% of the value of foreign securities loaned. Collateral equivalent to at least 100% of the market value of securities on loan is maintained at all times. Collateral is either in the form of cash, which can be invested in certain money market mutual funds managed by Dreyfus, or U.S. Government and Agency securities. The fund is entitled to receive all dividends, interest and distributions on securities loaned, in addition to income earned as a result of the lending transaction. Should a borrower fail to return the securities in a timely manner, The Bank of New York Mellon is required to replace the securities for the benefit of the fund or credit the fund with the market value of the unreturned securities and is subrogated to the fund’s rights against the borrower and the collateral. Additionally, the contractual maturity of security lending transactions are on an overnight and continuous basis. During the period ended December 31, 2017, The Bank of New York Mellon earned $3,327 from lending portfolio securities, pursuant to the securities lending agreement.
(c) Affiliated issuers: Investments in other investment companies advised by Dreyfus are defined as “affiliated” under the Act.
(d) Dividends and distributions to shareholders: Dividends and distributions are recorded on the ex-dividend date. Dividends from investment income-net are normally declared and paid quarterly. Dividends from net realized capital gains, if any, are normally declared and paid annually, but the fund may make distributions on a more frequent basis to comply with the distribution requirements of the Internal Revenue Code of 1986, as amended (the “Code”). To the extent that net realized capital gains can be offset by capital loss carryovers, it is the policy of the fund not to distribute such gains. Income and capital gain distributions are determined in accordance with income tax regulations, which may differ from GAAP.
(e) Federal income taxes: It is the policy of the fund to continue to qualify as a regulated investment company, if such qualification is in the best interests of its shareholders, by complying with the applicable provisions of the Code, and to make distributions of taxable income sufficient to relieve it from substantially all federal income and excise taxes.
As of and during the period ended December 31, 2017, the fund did not have any liabilities for any uncertain tax positions. The fund recognizes interest and penalties, if any, related to uncertain tax positions as income
19
tax expense in the Statement of Operations. During the period ended December 31, 2017, the fund did not incur any interest or penalties.
Each tax year in the four-year period ended December 31, 2017 remains subject to examination by the Internal Revenue Service and state taxing authorities.
At December 31, 2017, the components of accumulated earnings on a tax basis were as follows: undistributed ordinary income $471,770, undistributed capital gains $9,437,855 and unrealized appreciation $342,039,588.
The tax character of distributions paid to shareholders during the fiscal periods ended December 31, 2017 and December 31, 2016 were as follows: ordinary income $19,684,262 and $12,748,754, and long-term capital gains $88,728,026 and $80,429,968, respectively.
NOTE 2—Bank Lines of Credit:
The fund participates with other Dreyfus-managed funds in an $830 million unsecured credit facility led by Citibank, N.A. and a $300 million unsecured credit facility provided by The Bank of New York Mellon (each, a “Facility”), each to be utilized primarily for temporary or emergency purposes, including the financing of redemptions. Prior to October 4, 2017, the unsecured credit facility with Citibank, N.A. was $810 million. In connection therewith, the fund has agreed to pay its pro rata portion of commitment fees for each Facility. Interest is charged to the fund based on rates determined pursuant to the terms of the respective Facility at the time of borrowing. During the period ended December 31, 2017, the fund did not borrow under the Facilities.
NOTE 3—Management Fee and Other Transactions with Affiliates:
(a) Pursuant to a management agreement (the “Agreement”) with Dreyfus, the management fee is payable monthly, based on the following annual percentages of the value of the fund’s average daily net assets: .65% of the first $1.5 billion; .625% of the next $500 million; .60% of the next $500 million; and .55% over $2.5 billion. The effective management fee rate during the period ended December 31, 2017 was .65%.
The Agreement also provides for an expense reimbursement from Dreyfus should the fund’s aggregate expenses (excluding taxes and brokerage commissions) exceed 1% of the value of the fund’s average daily net assets for any full fiscal year. During the period ended December 31, 2017, there was no reduction in expenses pursuant to the Agreement.
NOTES TO FINANCIAL STATEMENTS (continued)
20
(b) The fund has arrangements with the transfer agent and the custodian whereby the fund may receive earnings credits when positive cash balances are maintained, which are used to offset transfer agency and custody fees. For financial reporting purposes, the fund includes net earnings credits as an expense offset in the Statement of Operations.
The fund compensates Dreyfus Transfer, Inc., a wholly-owned subsidiary of Dreyfus, under a transfer agency agreement for providing transfer agency and cash management services for the fund. The majority of transfer agency fees are comprised of amounts paid on a per account basis, while cash management fees are related to fund subscriptions and redemptions. During the period ended December 31, 2017, the fund was charged $350,365 for transfer agency services and $31,646 for cash management services. These fees are included in Shareholder servicing costs in the Statement of Operations. Cash management fees were offset by earnings credits of $31,646.
The fund compensates The Bank of New York Mellon under a custody agreement for providing custodial services for the fund. These fees are determined based on net assets, geographic region and transaction activity. During the period ended December 31, 2017, the fund was charged $63,852 pursuant to the custody agreement. These fees were partially offset by earnings credits of $109.
During the period ended December 31, 2017, the fund was charged $11,202 for services performed by the Chief Compliance Officer and his staff.
The components of “Due to The Dreyfus Corporation and affiliates” in the Statement of Assets and Liabilities consist of: management fees $667,432, custodian fees $17,000, Chief Compliance Officer fees $8,406 and transfer agency fees $88,946.
(c) Each Board member also serves as a Board member of other funds within the Dreyfus complex. Annual retainer fees and attendance fees are allocated to each fund based on net assets.
NOTE 4—Securities Transactions:
The aggregate amount of purchases and sales of investment securities, excluding short-term securities, during the period ended December 31, 2017, amounted to $465,837,381 and $543,345,156, respectively.
At December 31, 2017, the cost of investments for federal income tax purposes was $890,964,069; accordingly, accumulated net unrealized appreciation on investments was $342,039,588, consisting of $347,601,764 gross unrealized appreciation and $5,562,176 gross unrealized depreciation.
REPORT OF INDEPENDENT REGISTERED PUBLIC ACCOUNTING FIRM
21
To the Shareholders and the Board of Directors of The Dreyfus Fund Incorporated
Opinion on the Financial Statements We have audited the accompanying statement of assets and liabilities of The Dreyfus Fund Incorporated (the “Fund”), including the statements of investments and investments in affiliated issuers, as of December 31, 2017, and the related statement of operations for the year then ended, the statements of changes in net assets for each of the two years in the period then ended, the financial highlights for each of the five years in the period then ended and the related notes (collectively referred to as the “financial statements”). In our opinion, the financial statements present fairly, in all material respects, the financial position of The Dreyfus Fund Incorporated at December 31, 2017, the results of its operations for the year then ended, the changes in its net assets for each of the two years in the period then ended and its financial highlights for each of the five years in the period then ended, in conformity with U.S. generally accepted accounting principles.
Basis for opinion These financial statements are the responsibility of the Fund’s management. Our responsibility is to express an opinion on the Fund’s financial statements based on our audits. We are a public accounting firm registered with the Public Company Accounting Oversight Board (United States) (“PCAOB”) and are required to be independent with respect to the Fund in accordance with the U.S. federal securities laws and the applicable rules and regulations of the Securities and Exchange Commission and the PCAOB. We conducted our audits in accordance with the standards of the PCAOB. Those standards require that we plan and perform the audit to obtain reasonable assurance about whether the financial statements are free of material misstatement, whether due to error or fraud. The Fund is not required to have, nor were we engaged to perform, an audit of the Fund’s internal control over financial reporting. As part of our audits, we are required to obtain an understanding of internal control over financial reporting, but not for the purpose of expressing an opinion on the effectiveness of the Fund’s internal control over financial reporting. Accordingly, we express no such opinion. Our audits included performing procedures to assess the risks of material misstatement of the financial statements, whether due to error or fraud, and performing procedures that respond to those risks. Such procedures included examining, on a test basis, evidence regarding the amounts and disclosures in the financial statements. Our procedures included confirmation of securities owned as of December 31, 2017, by correspondence with the custodian and others or by other appropriate auditing procedures where replies were not received. Our audits also included evaluating the accounting principles used and significant estimates made by management, as well as evaluating the overall presentation of the financial statements. We believe that our audits provide a reasonable basis for our opinion.
We have served as the auditor of one or more Dreyfus investment companies since at least 1957, but we are unable to determine the specific year. New York, New York February 26, 2018
IMPORTANT TAX INFORMATION (Unaudited)
22
In accordance with federal tax law, the fund hereby reports 93.69% of the ordinary dividends paid during the fiscal year ended December 31, 2017 as qualifying for the corporate dividends received deduction. For the fiscal year ended December 31, 2017, certain dividends paid by the fund may be subject to a maximum tax rate of 15%, as provided for by the Jobs and Growth Tax Relief Reconciliation Act of 2003. Of the distributions paid during the fiscal year, $19,602,811 represents the maximum amount that may be considered qualified dividend income. Shareholders will receive notification in early 2018 of the percentage applicable to the preparation of their 2017 income tax returns. Also, the fund hereby reports $.3733 per share as a long-term capital gain distribution paid on March 31, 2017 and the fund also reports $.0889 per share as a short-term capital gain distribution and $.4882 per share as a long-term capital gain distribution paid on December 21, 2017.
INFORMATION ABOUT THE RENEWAL OF THE FUND’S MANAGEMENT AGREEMENT (Unaudited)
23
At a meeting of the fund’s Board of Directors held on July 25-26, 2017, the Board considered the renewal of the fund’s Management Agreement pursuant to which Dreyfus provides the fund with investment advisory and administrative services (the “Agreement”). The Board members, a majority of whom are not “interested persons” (as defined in the Investment Company Act of 1940, as amended) of the fund, were assisted in their review by independent legal counsel and met with counsel in executive session separate from Dreyfus representatives. In considering the renewal of the Agreement, the Board considered all factors that it believed to be relevant, including those discussed below. The Board did not identify any one factor as dispositive, and each Board member may have attributed different weights to the factors considered.
Analysis of Nature, Extent, and Quality of Services Provided to the Fund. The Board considered information provided to them at the meeting and in previous presentations from Dreyfus representatives regarding the nature, extent, and quality of the services provided to funds in the Dreyfus fund complex. Dreyfus provided the number of open accounts in the fund, the fund’s asset size and the allocation of fund assets among distribution channels. Dreyfus also had previously provided information regarding the diverse intermediary relationships and distribution channels of funds in the Dreyfus fund complex (such as retail direct or intermediary, in which intermediaries typically are paid by the fund and/or Dreyfus) and Dreyfus’ corresponding need for broad, deep, and diverse resources to be able to provide ongoing shareholder services to each intermediary or distribution channel, as applicable to the fund.
The Board also considered research support available to, and portfolio management capabilities of, the fund’s portfolio management personnel and that Dreyfus also provides oversight of day-to-day fund operations, including fund accounting and administration and assistance in meeting legal and regulatory requirements. The Board also considered Dreyfus’ extensive administrative, accounting and compliance infrastructures. The Board also considered portfolio management’s brokerage policies and practices (including policies and practices regarding soft dollars) and the standards applied in seeking best execution.
Comparative Analysis of the Fund’s Performance and Management Fee and Expense Ratio. The Board reviewed reports prepared by Broadridge Financial Solutions, Inc. (“Broadridge”), an independent provider of investment company data, which included information comparing (1) the fund’s performance with the performance of a group of comparable funds (the “Performance Group”) and with a broader group of funds (the “Performance Universe”), all for various periods ended May 31, 2017, and (2) the fund’s actual and contractual management fees and total expenses with those of a group of comparable funds (the “Expense Group”) and with a broader group of funds (the “Expense Universe”), the information for which was derived in part from fund financial statements available to Broadridge as of the date of its analysis. Dreyfus previously had furnished the Board with a description of the methodology Broadridge used to select the Performance Group and Performance Universe and the Expense Group and Expense Universe.
INFORMATION ABOUT THE RENEWAL OF THE FUND’S MANAGEMENT AGREEMENT (Unaudited) (continued)
24
Dreyfus representatives stated that the usefulness of performance comparisons may be affected by a number of factors, including different investment limitations that may be applicable to the fund and comparison funds. The Board discussed with representatives of Dreyfus and/or its affiliates the results of the comparisons and considered that the fund’s total return performance was below the Performance Group and Performance Universe medians for all periods. The Board considered the relative proximity of the fund’s performance to the median of the Performance Group and/or Performance Universe median in certain periods. Dreyfus also provided a comparison of the fund’s calendar year total returns to the returns of the fund’s benchmark index, and it was considered that the fund’s returns were above the returns of the index in five of the ten calendar years shown.
The Board also reviewed the range of actual and contractual management fees and total expenses of the Expense Group and Expense Universe funds and discussed the results of the comparisons. The Board considered that the fund’s contractual management fee was slightly above the Expense Group median, the fund’s actual management fee was above the Expense Group median and below the Expense Universe median and the fund’s total expense ratio was below the Expense Group and Expense Universe medians.
Dreyfus representatives reviewed with the Board the management or investment advisory fees (1) paid by funds advised or administered by Dreyfus that are in the same Lipper category as the fund and (2) paid to Dreyfus or the Dreyfus-affiliated primary employer of the fund’s primary portfolio manager(s) for advising any separate accounts and/or other types of client portfolios that are considered to have similar investment strategies and policies as the fund (the “Similar Clients”), and explained the nature of the Similar Clients. They discussed differences in fees paid and the relationship of the fees paid in light of any differences in the services provided and other relevant factors. The Board considered the relevance of the fee information provided for the Similar Clients to evaluate the appropriateness of the fund’s management fee.
Analysis of Profitability and Economies of Scale. Dreyfus representatives reviewed the expenses allocated and profit received by Dreyfus and its affiliates and the resulting profitability percentage for managing the fund and the aggregate profitability percentage to Dreyfus and its affiliates for managing the funds in the Dreyfus fund complex, and the method used to determine the expenses and profit. The Board concluded that the profitability results were not unreasonable, given the services rendered and service levels provided by Dreyfus. The Board also had been provided with information prepared by an independent consulting firm regarding Dreyfus’ approach to allocating costs to, and determining the profitability of, individual funds and the entire Dreyfus fund complex. The consulting firm also had analyzed where any economies of scale might emerge in connection with the management of a fund.
The Board considered, on the advice of its counsel, the profitability analysis (1) as part of its evaluation of whether the fees under the Agreement, considered in relation to the mix of services provided by Dreyfus, including the nature, extent and quality of such services, supported the renewal of the Agreement and (2) in light of the relevant
25
circumstances for the fund and the extent to which economies of scale would be realized if the fund grows and whether fee levels reflect these economies of scale for the benefit of fund shareholders. Dreyfus representatives also stated that, as a result of shared and allocated costs among funds in the Dreyfus fund complex, the extent of economies of scale could depend substantially on the level of assets in the complex as a whole, so that increases and decreases in complex-wide assets can affect potential economies of scale in a manner that is disproportionate to, or even in the opposite direction from, changes in the fund’s asset level. The Board also considered potential benefits to Dreyfus from acting as investment adviser and took into consideration the soft dollar arrangements in effect for trading the fund’s investments.
At the conclusion of these discussions, the Board agreed that it had been furnished with sufficient information to make an informed business decision with respect to the renewal of the Agreement. Based on the discussions and considerations as described above, the Board concluded and determined as follows.
• The Board concluded that the nature, extent and quality of the services provided by Dreyfus are adequate and appropriate.
• The Board agreed to closely monitor performance and determined to approve renewal of the Agreement only until the first quarter 2018 regular Board meeting.
• The Board concluded that the fee paid to Dreyfus continued to be appropriate under the circumstances and in light of the factors and the totality of the services provided as discussed above, subject to review no later than the next renewal consideration.
• The Board determined that the economies of scale which may accrue to Dreyfus and its affiliates in connection with the management of the fund had been adequately considered by Dreyfus in connection with the fee rate charged to the fund pursuant to the Agreement and that, to the extent in the future it were determined that material economies of scale had not been shared with the fund, the Board would seek to have those economies of scale shared with the fund.
In evaluating the Agreement, the Board considered these conclusions and determinations and also relied on its previous knowledge, gained through meetings and other interactions with Dreyfus and its affiliates, of Dreyfus and the services provided to the fund by Dreyfus. The Board also relied on information received on a routine and regular basis throughout the year relating to the operations of the fund and the investment management and other services provided under the Agreement, including information on the investment performance of the fund in comparison to similar mutual funds and benchmark performance indices; general market outlook as applicable to the fund; and compliance reports. In addition, the Board’s consideration of the contractual fee arrangements for this fund had the benefit of a number of years of reviews of the Agreement for the fund, or substantially similar agreements for other Dreyfus funds that the Board oversees, during which lengthy discussions took place between the Board and Dreyfus representatives. Certain aspects of the arrangements
INFORMATION ABOUT THE RENEWAL OF THE FUND’S MANAGEMENT AGREEMENT (Unaudited) (continued)
26
may receive greater scrutiny in some years than in others, and the Board’s conclusions may be based, in part, on their consideration of the fund’s arrangements, or similar arrangements for other Dreyfus funds that the Board oversees, in prior years. The Board determined to renew the Agreement only until the first quarter 2018 regular Board meeting.
BOARD MEMBERS INFORMATION (Unaudited) INDEPENDENT BOARD MEMBERS
27
Joseph S. DiMartino (74) Chairman of the Board (1995) Principal Occupation During Past 5 Years: • Corporate Director and Trustee (1995-present)
Other Public Company Board Memberships During Past 5 Years: • CBIZ (formerly, Century Business Services, Inc.), a provider of outsourcing functions for small and
medium size companies, Director (1997-present)
No. of Portfolios for which Board Member Serves: 127 ———————
Francine J. Bovich (66) Board Member (2015) Principal Occupation During Past 5 Years: • Trustee, The Bradley Trusts, private trust funds (2011-present)
Other Public Company Board Membership During Past 5 Years: • Annaly Capital Management, Inc., Director (May 2014-present)
No. of Portfolios for which Board Member Serves: 73 ———————
Isabel P. Dunst (70) Board Member (2014) Principal Occupation During Past 5 Years: • Of Counsel to the law firm of Hogan Lovells LLP (2015-present; previously, Partner, 1990-2014)
No. of Portfolios for which Board Member Serves: 33 ———————
Nathan Leventhal (74) Board Member (2009) Principal Occupation During Past 5 Years: • President Emeritus of Lincoln Center for the Performing Arts (2001-present) • Chairman of the Avery Fisher Artist Program (1997-2014) • Commissioner, NYC Planning Commission (2007-2011)
Other Public Company Board Membership During Past 5 Years: • Movado Group, Inc., Director (2003-present)
No. of Portfolios for which Board Member Serves: 47 ———————
BOARD MEMBERS INFORMATION (Unaudited) (continued) INDEPENDENT BOARD MEMBERS (continued)
28
Robin A. Melvin (54) Board Member (2014) Principal Occupation During Past 5 Years: • Co-chairman, Illinois Mentoring Partnership, non-profit organization dedicated to increasing the
quantity and quality of mentoring services in Illinois (2014-present; board member since 2013) • Director, Boisi Family Foundation, a private family foundation that supports youth-serving
organizations that promote the self sufficiency of youth from disadvantaged circumstances (1995-2012)
No. of Portfolios for which Board Member Serves: 101 ———————
Roslyn M. Watson (68) Board Member (2014) Principal Occupation During Past 5 Years: • Principal, Watson Ventures, Inc., a real estate investment company (1993-present)
No. of Portfolios for which Board Member Serves: 59 ———————
Benaree Pratt Wiley (71) Board Member (2009) Principal Occupation During Past 5 Years: • Principal, The Wiley Group, a firm specializing in strategy and business development (2005-present)
Other Public Company Board Membership During Past 5 Years: • CBIZ (formerly, Century Business Services, Inc.), a provider of outsourcing functions for small and
medium size companies, Director (2008-present)
No. of Portfolios for which Board Member Serves: 81 ———————
INTERESTED BOARD MEMBERS
29
J. Charles Cardona (62) Board Member (2014) Principal Occupation During Past 5 Years: • Retired. President and a Director of the Manager (2008-2016), Chairman of the Distributor (2013-
2016, Executive Vice President, 1997-2013) • No. of Portfolios for which Board Member Serves: 33
J. Charles Cardona is deemed to be an “interested person” (as defined under the Act) of the fund as a result of his previous affiliation with The Dreyfus Corporation.
——————— Gordon J. Davis (76) Board Member (2012) Principal Occupation During Past 5 Years: • Partner in the law firm of Venable LLP (2012-present) • Partner in the law firm of Dewey & LeBoeuf LLP (1994-2012)
Other Public Company Board Membership During Past 5 Years: • Consolidated Edison, Inc., a utility company, Director (1997-2014) • The Phoenix Companies, Inc., a life insurance company, Director (2000-2014)
No. of Portfolios for which Board Member Serves: 55
Gordon J. Davis is deemed to be an “interested person” (as defined under the Act) of the fund as a result of his affiliation with Venable LLP, which provides legal services to the fund.
———————
Once elected all Board Members serve for an indefinite term, but achieve Emeritus status upon reaching age 80. The address of the Board Members and Officers is c/o The Dreyfus Corporation, 200 Park Avenue, New York, New York 10166. Additional information about the Board Members is available in the fund’s Statement of Additional Information which can be obtained from Dreyfus free of charge by calling this toll free number: 1-800-DREYFUS.
Clifford L. Alexander, Jr., Emeritus Board Member Whitney I. Gerard, Emeritus Board Member George L. Perry, Emeritus Board Member
OFFICERS OF THE FUND (Unaudited)
30
BRADLEY J. SKAPYAK, President since January 2010.
Chief Operating Officer and a director of the Manager since June 2009, Chairman of Dreyfus Transfer, Inc., an affiliate of the Manager and the transfer agent of the funds, since May 2011 and Chief Executive Officer of MBSC Securities Corporation since August 2016. He is an officer of 63 investment companies (comprised of 127 portfolios) managed by the Manager. He is 59 years old and has been an employee of the Manager since February 1988.
BENNETT A. MACDOUGALL, Chief Legal Officer since October 2015.
Chief Legal Officer of the Manager and Associate General Counsel and Managing Director of BNY Mellon since June 2015; from June 2005 to June 2015, he served in various capacities with Deutsche Bank – Asset & Wealth Management Division, including as Director and Associate General Counsel, and Chief Legal Officer of Deutsche Investment Management Americas Inc. from June 2012 to May 2015. He is an officer of 64 investment companies (comprised of 152 portfolios) managed by the Manager. He is 46 years old and has been an employee of the Manager since June 2015.
JANETTE E. FARRAGHER, Vice President and Secretary since December 2011.
Associate General Counsel of BNY Mellon, and an officer of 64 investment companies (comprised of 152 portfolios) managed by the Manager. She is 55 years old and has been an employee of the Manager since February 1984.
JAMES BITETTO, Vice President and Assistant Secretary since August 2005.
Managing Counsel of BNY Mellon and Secretary of the Manager, and an officer of 64 investment companies (comprised of 152 portfolios) managed by the Manager. He is 51 years old and has been an employee of the Manager since December 1996.
JOSEPH M. CHIOFFI, Vice President and Assistant Secretary since August 2005.
Managing Counsel of BNY Mellon, and an officer of 64 investment companies (comprised of 152 portfolios) managed by the Manager. He is 56 years old and has been an employee of the Manager since June 2000.
MAUREEN E. KANE, Vice President and Assistant Secretary since April 2015.
Managing Counsel of BNY Mellon since July 2014; from October 2004 until July 2014, General Counsel, and from May 2009 until July 2014, Chief Compliance Officer of Century Capital Management. She is an officer of 64 investment companies (comprised of 152 portfolios) managed by the Manager. She is 55 years old and has been an employee of the Manager since July 2014.
SARAH S. KELLEHER, Vice President and Assistant Secretary since April 2014.
Senior Counsel of BNY Mellon since March 2013, from August 2005 to March 2013, Associate General Counsel of Third Avenue Management. She is an officer of 64 investment companies (comprised of 152 portfolios) managed by the Manager. She is 42 years old and has been an employee of the Manager since March 2013.
JEFF PRUSNOFSKY, Vice President and Assistant Secretary since August 2005.
Senior Managing Counsel of BNY Mellon, and an officer of 64 investment companies (comprised of 152 portfolios) managed by the Manager. He is 52 years old and has been an employee of the Manager since October 1990.
NATALYA ZELENSKY, Vice President and Assistant Secretary since March 2017.
Counsel and Vice President of BNY Mellon since May 2016; Attorney at Wildermuth Endowment Strategy Fund/Wildermuth Advisory, LLC from November 2015 until May 2016; Assistant General Counsel at RCS Advisory Services from July 2014 until November 2015; Associate at Sutherland, Asbill & Brennan from January 2013 until January 2014; Associate at K&L Gates from October 2011 until January 2013. She is an officer of 64 investment companies (comprised of 152 portfolios) managed by Dreyfus. She is 32 years old and has been an employee of the Manager since May 2016.
JAMES WINDELS, Treasurer since November 2001.
Director – Mutual Fund Accounting of the Manager, and an officer of 64 investment companies (comprised of 152 portfolios) managed by the Manager. He is 59 years old and has been an employee of the Manager since April 1985.
31
RICHARD CASSARO, Assistant Treasurer since January 2008.
Senior Accounting Manager – Money Market and Municipal Bond Funds of the Manager, and an officer of 64 investment companies (comprised of 152 portfolios) managed by the Manager. He is 58 years old and has been an employee of the Manager since September 1982.
GAVIN C. REILLY, Assistant Treasurer since December 2005.
Tax Manager of the Investment Accounting and Support Department of the Manager, and an officer of 64 investment companies (comprised of 152 portfolios) managed by the Manager. He is 49 years old and has been an employee of the Manager since April 1991.
ROBERT S. ROBOL, Assistant Treasurer since August 2005.
Senior Accounting Manager – Dreyfus Financial Reporting of the Manager, and an officer of 64 investment companies (comprised of 152 portfolios) managed by the Manager. He is 53 years old and has been an employee of the Manager since October 1988.
ROBERT SALVIOLO, Assistant Treasurer since July 2007.
Senior Accounting Manager – Equity Funds of the Manager, and an officer of 64 investment companies (comprised of 152 portfolios) managed by the Manager. He is 50 years old and has been an employee of the Manager since June 1989.
ROBERT SVAGNA, Assistant Treasurer since December 2002.
Senior Accounting Manager – Fixed Income and Equity Funds of the Manager, and an officer of 64 investment companies (comprised of 152 portfolios) managed by the Manager. He is 50 years old and has been an employee of the Manager since November 1990.
JOSEPH W. CONNOLLY, Chief Compliance Officer since October 2004.
Chief Compliance Officer of the Manager and The Dreyfus Family of Funds (64 investment companies, comprised of 152 portfolios). He is 60 years old and has served in various capacities with the Manager since 1980, including manager of the firm’s Fund Accounting Department from 1997 through October 2001.
CARIDAD M. CAROSELLA, Anti-Money Laundering Compliance Officer since January 2016.
Anti-Money Laundering Compliance Officer of the Dreyfus Family of Funds and BNY Mellon Funds Trust since January 2016; from May 2015 to December 2015, Interim Anti-Money Laundering Compliance Officer of the Dreyfus Family of Funds and BNY Mellon Funds Trust and the Distributor; from January 2012 to May 2015, AML Surveillance Officer of the Distributor and from 2007 to December 2011, Financial Processing Manager of the Distributor. She is an officer of 58 investment companies (comprised of 146 portfolios) managed by the Manager. She is 49 years old and has been an employee of the Distributor since 1997.

NOTES
32

NOTES
33
For More Information
The Dreyfus Fund Incorporated 200 Park Avenue New York, NY 10166 Manager The Dreyfus Corporation 200 Park Avenue New York, NY 10166 Custodian The Bank of New York Mellon 225 Liberty Street New York, NY 10286
Transfer Agent & Dividend Disbursing Agent Dreyfus Transfer, Inc. 200 Park Avenue New York, NY 10166 Distributor MBSC Securities Corporation 200 Park Avenue New York, NY 10166
Ticker Symbol: DREVX
Telephone Call your financial representative or 1-800-DREYFUS
Mail The Dreyfus Family of Funds, 144 Glenn Curtiss Boulevard, Uniondale, NY 11556-0144
E-mail Send your request to [email protected]
Internet Information can be viewed online or downloaded at www.dreyfus.com
The fund files its complete schedule of portfolio holdings with the Securities and Exchange Commission (“SEC”) for the first and third quarters of each fiscal year on Form N-Q. The fund’s Forms N-Q are available on the SEC’s website at www.sec.gov and may be reviewed and copied at the SEC’s Public Reference Room in Washington, D.C. (phone 1-800-SEC-0330 for information).
A description of the policies and procedures that the fund uses to determine how to vote proxies relating to portfolio securities and information regarding how the fund voted these proxies for the most recent 12-month period ended June 30 is available at www.dreyfus.com and on the SEC’s website at www.sec.gov and without charge, upon request, by calling 1-800-DREYFUS.
© 2018 MBSC Securities Corporation 0026AR1217