Embed Size (px)
Citation preview

The DRAM Market AdvisorMarch 2010
DE DIOS & ASSOCIATES
Focused on our clients
(c)2010DEDIOS&ASSOCIATES.Allrightsreserved,ReproducAonprohibitedwithoutpriorpermission.
CONTENTS
GeneralMarketDevelopments...............................1
Changesindemand&supplytrends
MajoruncertainAesinthemarket
DRAMpricesatAppingpoint,hurAngPCOEMprofits
Theimmersionscannermyth
Q22010MarketOutlook........................................4
LowerdemandandslowerGB/PCgrowth
RebalancingtheDDR3‐DDR2demandmix
AUempttoincreaseAprilprices
Highlightsofdemand‐supplycondiAons,inventorymovement,andimpactonprice
SensiAvitytoOtherRebalancingVolumes
2H2010MarketOutlook........................................8
Demandincreases:CommercialPCs
Complexityanduncertaintyofsupplyin2H10
ImpactofmobileDRAMmarketstrength
Constrained1GbDDR3supplygrowth
Dependenceofsupplygrowthon4XnmnodeandimmersionscannerinstallaAons
DisorderlytransiAontothe2GbDDR3
HighsupplyconcentraAonandmarketsharechanges
Crowdingofproductsat5X/4Xnmand6Xnmnodes
Highlightsofdemand‐supplycondiAons,inventorymovement,andimpactonprice
PriceForecast&[email protected]
Priceforecasthighlights:2GBPCDIMM,4GBDDR3SODIMM,andDDR3RDIMM
DRAMrevenuehaspotenAaltobehighestinDRAMhistory
PriceForecastTables
EXECUTIVE SUMMARYDDR3andDDR2priceswillriseinAprildespiteprojecAonsofalowQ210demandgrowthof5%,becauseofrelaAvelyflatPCunitshipmentsandaweakGB/PCgrowth,andahigherDDR3+DDR2bitproducAongrowthof8%.Drivingthepricehikearethespot‐pricejumpin2HMarch(dueheavilytospeculaAvebuying)andprevailingAghtsupplycondiAonsrelaAvetodemand.DRAMsuppliersareworkingwithverylowinventories,resulAngininconsistentdeliveriestoOEMs.WebelievechannelinventoriesarealsobelownormaloperaAnglevels.
Theother,less‐discussedreasonisthatDRAMsuppliersneedtoboostprofitsandcashtostabilizebalancesheets(paydownmaturingdebt)andfundcapextargetstokeepthemcompeAAvewithSamsung.Withoutenoughimmersionscanners,DRAMcostreducAonshavebeenslowandthecashgeneraAonrateinQ110isinsufficientdespitethehighDRAMprices.TheaddiAonalprofitsandcashneedtocomefromhigherprices.
PC‐OEMsfaceprofitchallengesespeciallywithanAprilpriceincrease.WeexpectarebalancingoftheQ210demandmixduetoCalpellaplaformshortagesandtheneedtoaUunedemandmixtothesupplymix.WeesAmateatransferof100‐120millionGbitsfromDDR3demandtoDDR2.PC‐OEMswillslowGB/PCgrowthevenmoreandtheslowerDDR3transiAonwillassistthat.Weproject21‐22%GB/PCgrowthin2010.
WeexpectDDR2supplytoloosenfromMaytoAugust,resulAnginsupportforawidercustomerbaseratherthananincreaseofsupplytomajorOEMs.Supplierinventorywillstayverylowthrough2010,keepingOEMpriceshigh.WebelievethelooseningofsupplywillinhibitfurtherDDR3priceincreasesbeyond1HMay.Mostofthelimitedpricepressurewillbeonthechannelandspotprices.HigherchannelinventorywillbecausedbyDDR3fromJulytoAugust,whenpricepressureswillbegreatest,andDDR2fromAugusttotheendof2010.ChannelinventorywillstaymostlywithinnormaloperaAnglevels.
Intheend,bothsupplierandchannelinventorieswillbelowtomanageableandpriceswillfluctuatebutremainrelaAvelyhigh.Weprojecta36%ASPincreasefrom2009to2010anda100%increaseinrevenueto44.5BUSD,basedona48%bitshipmentgrowth.DDR3+DDR2revenueisforecasttobe36BUSD.
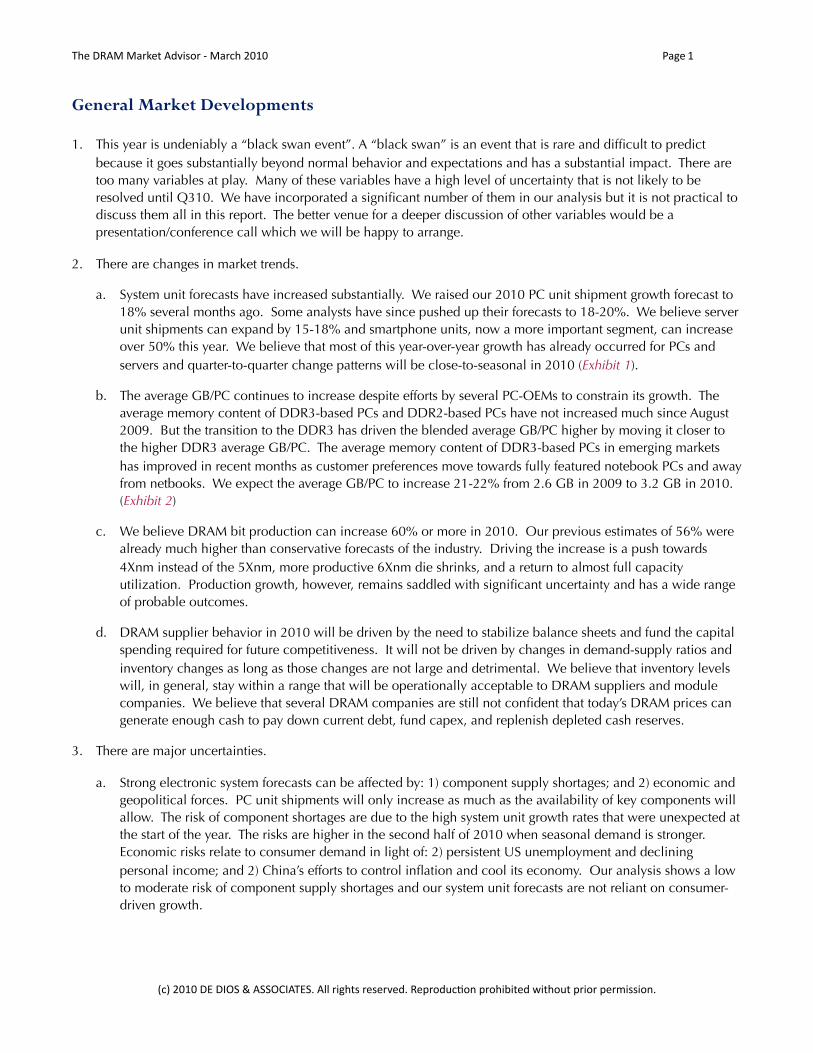
General Market Developments
1. This year is undeniably a “black swan event”. A “black swan” is an event that is rare and difficult to predict because it goes substantially beyond normal behavior and expectations and has a substantial impact. There are too many variables at play. Many of these variables have a high level of uncertainty that is not likely to be resolved until Q310. We have incorporated a significant number of them in our analysis but it is not practical to discuss them all in this report. The better venue for a deeper discussion of other variables would be a presentation/conference call which we will be happy to arrange.
2. There are changes in market trends.
a. System unit forecasts have increased substantially. We raised our 2010 PC unit shipment growth forecast to 18% several months ago. Some analysts have since pushed up their forecasts to 18-20%. We believe server unit shipments can expand by 15-18% and smartphone units, now a more important segment, can increase over 50% this year. We believe that most of this year-over-year growth has already occurred for PCs and servers and quarter-to-quarter change patterns will be close-to-seasonal in 2010 (Exhibit 1).
b. The average GB/PC continues to increase despite efforts by several PC-OEMs to constrain its growth. The average memory content of DDR3-based PCs and DDR2-based PCs have not increased much since August 2009. But the transition to the DDR3 has driven the blended average GB/PC higher by moving it closer to the higher DDR3 average GB/PC. The average memory content of DDR3-based PCs in emerging markets has improved in recent months as customer preferences move towards fully featured notebook PCs and away from netbooks. We expect the average GB/PC to increase 21-22% from 2.6 GB in 2009 to 3.2 GB in 2010. (Exhibit 2)
c. We believe DRAM bit production can increase 60% or more in 2010. Our previous estimates of 56% were already much higher than conservative forecasts of the industry. Driving the increase is a push towards 4Xnm instead of the 5Xnm, more productive 6Xnm die shrinks, and a return to almost full capacity utilization. Production growth, however, remains saddled with significant uncertainty and has a wide range of probable outcomes.
d. DRAM supplier behavior in 2010 will be driven by the need to stabilize balance sheets and fund the capital spending required for future competitiveness. It will not be driven by changes in demand-supply ratios and inventory changes as long as those changes are not large and detrimental. We believe that inventory levels will, in general, stay within a range that will be operationally acceptable to DRAM suppliers and module companies. We believe that several DRAM companies are still not confident that today’s DRAM prices can generate enough cash to pay down current debt, fund capex, and replenish depleted cash reserves.
3. There are major uncertainties.
a. Strong electronic system forecasts can be affected by: 1) component supply shortages; and 2) economic and geopolitical forces. PC unit shipments will only increase as much as the availability of key components will allow. The risk of component shortages are due to the high system unit growth rates that were unexpected at the start of the year. The risks are higher in the second half of 2010 when seasonal demand is stronger. Economic risks relate to consumer demand in light of: 2) persistent US unemployment and declining personal income; and 2) China’s efforts to control inflation and cool its economy. Our analysis shows a low to moderate risk of component supply shortages and our system unit forecasts are not reliant on consumer-driven growth.
TheDRAMMarketAdvisor‐March2010 Page1
(c)2010DEDIOS&ASSOCIATES.Allrightsreserved.ReproducEonprohibitedwithoutpriorpermission.
b. DRAM companies can cause some of the component supply shortages themselves. DRAMs are used in major computer components, such as hard disk drives and graphic cards. Ironically, how DRAM companies prioritize their production mix and customer allocations can affect their demand. Today, graphic card and controller companies, hard disk drive manufactures, and consumer system producers (other than mobile phones and digital TV) have more acute supply issues.
c. DRAM prices are now a major threat to PC-OEM profitability. Higher prices in April 2010 will very likely trigger the tipping point for OEMs and change their behavior for the rest of the year. These behavioral changes can affect GB/PC trends, a major component of DRAM demand, and the demand mix. An important question is whether PC-OEMs can truly affect GB/PC growth given their competition, the demands of the market, and retailer attitudes. We believe that competition will not be an issue because the profits of all PC companies, with few exceptions, have been hit.
d. Production uncertainties are the highest and have the greatest impact on the market. They include: a) schedule of immersion scanner installations; b) improvement of 4Xnm yields; and c) the ability to increase DDR3 production.
4. DRAM prices are at the tipping point at which the impact on profits will force PC-OEMs to implement serious countermeasures.
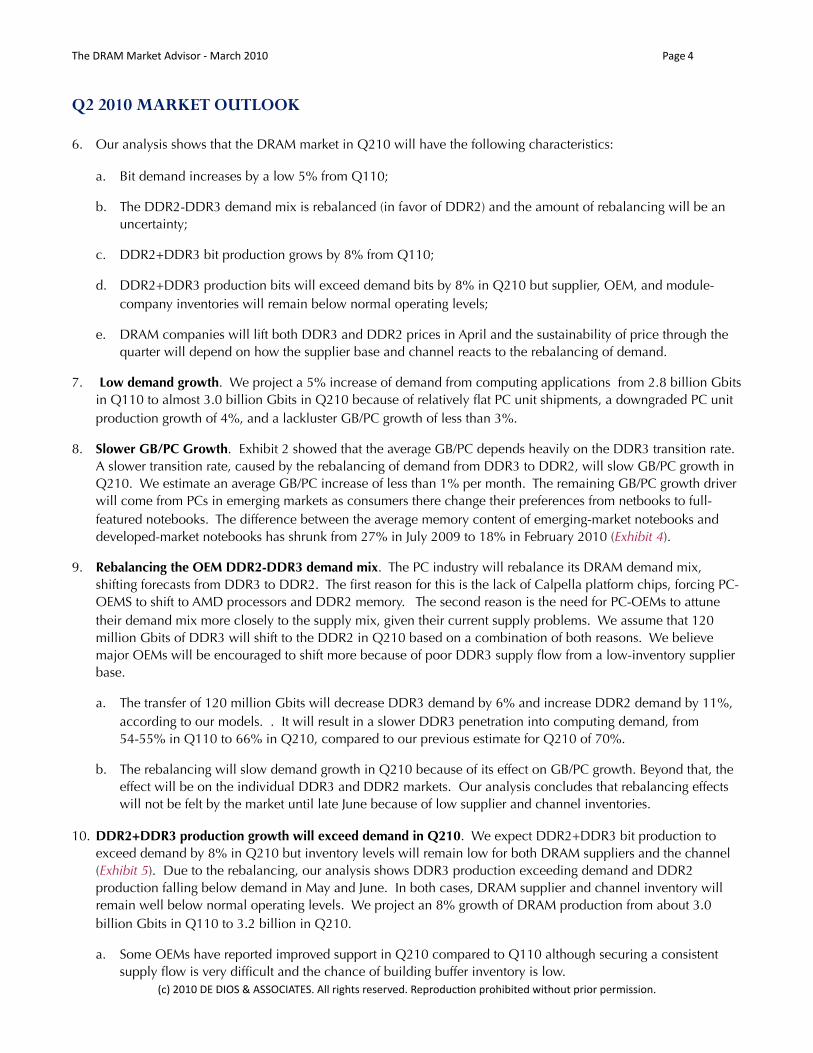
a. How do we know how close the tipping point is? We look at history. Exhibit 3 shows the history of the DRAM cost’s impact on the PC budget (ASP) since mid-1997. We show it for both consumer desktops and notebooks because desktops were the dominant system before 2007 and more reflective of the impact on PC-OEMs. The data shows that the DRAM cost impact on the consumer desktop budget hit 8.5% on January 2010, which is lower but close to the historical peak impact of 10.3% in December 2006. The DRAM cost impact on the notebook budget hit 6.2%, 60% higher than the past highest peak in Q406/Q107. The DRAM cost impact on notebook PCs will always be lower because of the additional cost of the LCD.
b. History also reveals some lessons DRAM companies would do well to heed. PC-OEMs reduced the average GB per consumer desktop by 25% from December 2006 to February 2007 and combined that with a 5% increase in PC ASP. It is not clear that PC-OEMs can repeat this but it is likely that they will explore alternatives to correct the DRAM cost’s impact.
c. We are not convinced that the DRAM costs’ impact on the PC budget has hit its peak. We expect further DRAM price increases in 2010. It took almost a year between when the cost impact broke above 7% to when it broke below 7% in 2006 to early 2007. March 2010 is only the 6th month since the DRAM cost impact on desktops broke above 7%. The economics today are different though because of the primacy of notebook PCs.
5. The immersion scanner myth. The common belief is that the lack of immersion scanners is due to limited ASML capacity. We believe that the real cause of immersion scanner delays are: a) cash and capital spending constraints; and b) problems with 4Xnm yield.
a. It is true that ASML order slots are relatively full through most of Q310 but it is also true that many orders are not firm. We have seen constant changes in quantity and schedule of immersion scanner deliveries by some DRAM producers. Generally, Samsung has taken advantage of the order changes and will procure half of DRAM immersions scanners in 1H10. We believe that the order push-outs are due to capex constraints and 4Xnm yields.
b. The result will be a wider gap between Samsung and other DRAM producers in the 4Xnm node. Bit supply growth, dependent on the 4Xnm transition in 2H10, will remain uncertain until immersion scanner orders stabilize. Finally, we see ASML capacity loosening up in Q410.
TheDRAMMarketAdvisor‐March2010 Page2
(c)2010DEDIOS&ASSOCIATES.Allrightsreserved.ReproducEonprohibitedwithoutpriorpermission.
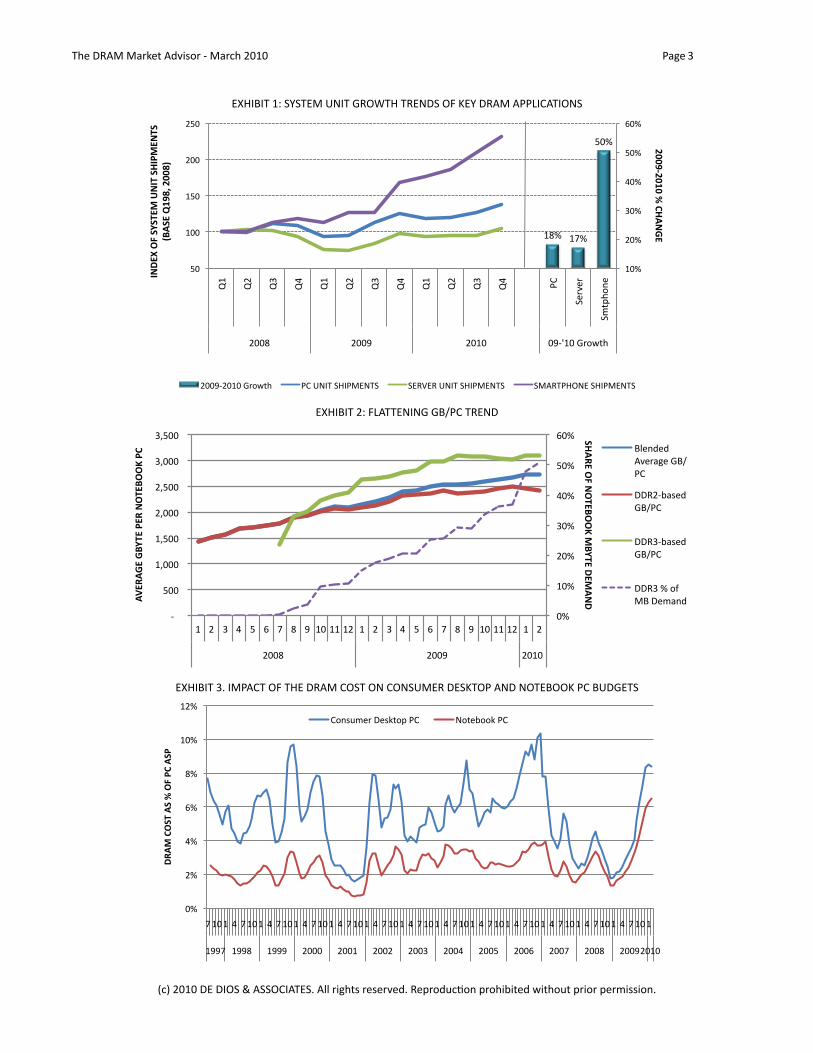
EXHIBIT1:SYSTEMUNITGROWTHTRENDSOFKEYDRAMAPPLICATIONS
!"#$ !%#$
&'#$
!'#$
('#$
)'#$
*'#$
&'#$
+'#$
&'$
!''$
!&'$
(''$
(&'$
,!$
,($
,)$
,*$
,!$
,($
,)$
,*$
,!$
,($
,)$
,*$
-.$
/01201$
/3456780$
(''"$ (''9$ ('!'$ '9:;!'$<17=46$
!""#$!"%"&'&()*+,-&
.+/-0&12&3435-6&7+.5&3).86-+53&&
9:*3-&;%#<=&!""<>&
(''9:('!'$<17=46$ -.$>?@A$/B@-CD?A/$ /DEFDE$>?@A$/B@-CD?A/$ /CGEA-BH?D$/B@-CD?A/$
EXHIBIT2:FLATTENINGGB/PCTREND
!"#
$!"#
%!"#
&!"#
'!"#
(!"#
)!"#
#*####
#(!!##
#$+!!!##
#$+(!!##
#%+!!!##
#%+(!!##
#&+!!!##
#&+(!!##
$# %# &# '# (# )# ,# -# .# $!#$$#$%# $# %# &# '# (# )# ,# -# .# $!#$$#$%# $# %#
%!!-# %!!.# %!$!#
!"#$%&'(&)'*%+'',&-
+.*%&/%-#)/&
#0%$#1%&1+.*%&2%$&)'*%+'',&23& /012313#
4516781#9/:
;<#
==>%*?7@13#
9/:;<#
==>&*?7@13#
9/:;<#
==>&#"#AB#
C/#=1D723#
EXHIBIT3.IMPACTOFTHEDRAMCOSTONCONSUMERDESKTOPANDNOTEBOOKPCBUDGETS
!"#
$"#
%"#
&"#
'"#
(!"#
($"#
)#(!#(# %# )#(!#(# %# )#(!#(# %# )#(!#(# %# )#(!#(# %# )#(!#(# %# )#(!#(# %# )#(!#(# %# )#(!#(# %# )#(!#(# %# )#(!#(# %# )#(!#(# %# )#(!#(#
(**)# (**'# (***# $!!!# $!!(# $!!$# $!!+# $!!%# $!!,# $!!&# $!!)# $!!'# $!!*#$!(!#
!"#$%&'()%#(%*%'+%,&%#(,%
-./01234#53067.8#9-# :.73;..6#9-#
TheDRAMMarketAdvisor‐March2010 Page3
(c)2010DEDIOS&ASSOCIATES.Allrightsreserved.ReproducEonprohibitedwithoutpriorpermission.
Q2 2010 MARKET OUTLOOK
6. Our analysis shows that the DRAM market in Q210 will have the following characteristics:
a. Bit demand increases by a low 5% from Q110;
b. The DDR2-DDR3 demand mix is rebalanced (in favor of DDR2) and the amount of rebalancing will be an uncertainty;
c. DDR2+DDR3 bit production grows by 8% from Q110;
d. DDR2+DDR3 production bits will exceed demand bits by 8% in Q210 but supplier, OEM, and module-company inventories will remain below normal operating levels;
e. DRAM companies will lift both DDR3 and DDR2 prices in April and the sustainability of price through the quarter will depend on how the supplier base and channel reacts to the rebalancing of demand.
7. Low demand growth. We project a 5% increase of demand from computing applications from 2.8 billion Gbits in Q110 to almost 3.0 billion Gbits in Q210 because of relatively flat PC unit shipments, a downgraded PC unit production growth of 4%, and a lackluster GB/PC growth of less than 3%.
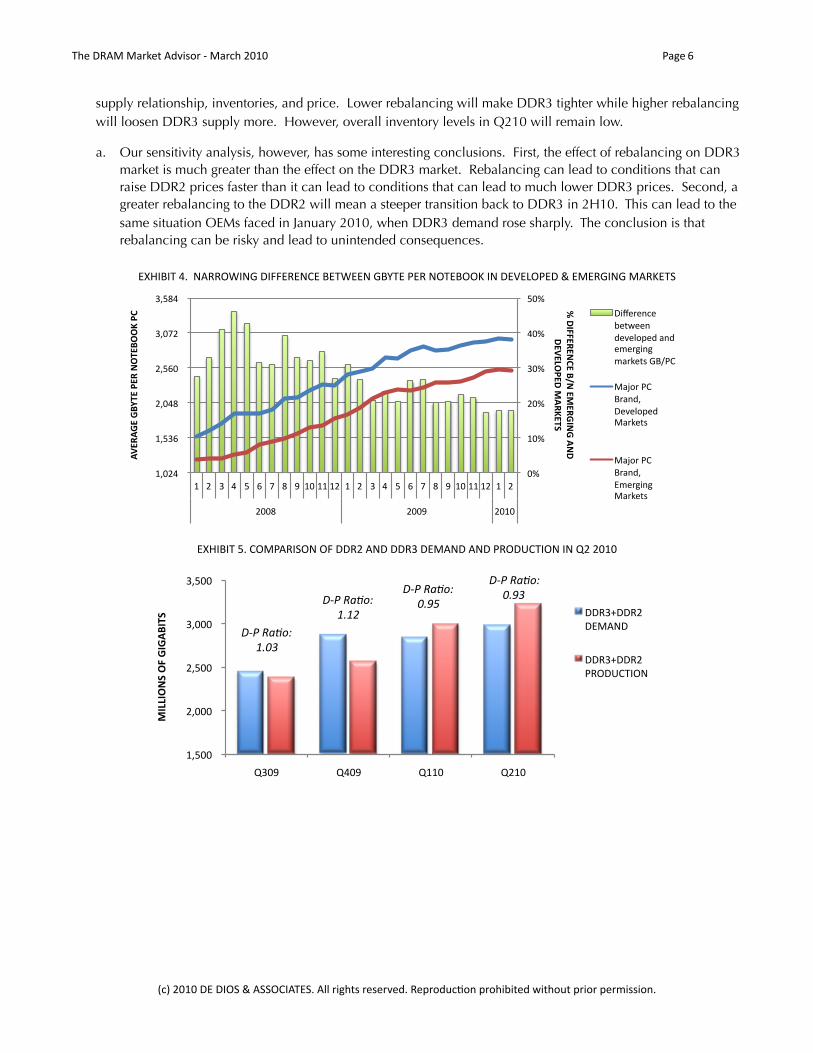
8. Slower GB/PC Growth. Exhibit 2 showed that the average GB/PC depends heavily on the DDR3 transition rate. A slower transition rate, caused by the rebalancing of demand from DDR3 to DDR2, will slow GB/PC growth in Q210. We estimate an average GB/PC increase of less than 1% per month. The remaining GB/PC growth driver will come from PCs in emerging markets as consumers there change their preferences from netbooks to full-featured notebooks. The difference between the average memory content of emerging-market notebooks and developed-market notebooks has shrunk from 27% in July 2009 to 18% in February 2010 (Exhibit 4).
9. Rebalancing the OEM DDR2-DDR3 demand mix. The PC industry will rebalance its DRAM demand mix, shifting forecasts from DDR3 to DDR2. The first reason for this is the lack of Calpella platform chips, forcing PC-OEMS to shift to AMD processors and DDR2 memory. The second reason is the need for PC-OEMs to attune their demand mix more closely to the supply mix, given their current supply problems. We assume that 120 million Gbits of DDR3 will shift to the DDR2 in Q210 based on a combination of both reasons. We believe major OEMs will be encouraged to shift more because of poor DDR3 supply flow from a low-inventory supplier base.
a. The transfer of 120 million Gbits will decrease DDR3 demand by 6% and increase DDR2 demand by 11%, according to our models. . It will result in a slower DDR3 penetration into computing demand, from 54-55% in Q110 to 66% in Q210, compared to our previous estimate for Q210 of 70%.
b. The rebalancing will slow demand growth in Q210 because of its effect on GB/PC growth. Beyond that, the effect will be on the individual DDR3 and DDR2 markets. Our analysis concludes that rebalancing effects will not be felt by the market until late June because of low supplier and channel inventories.
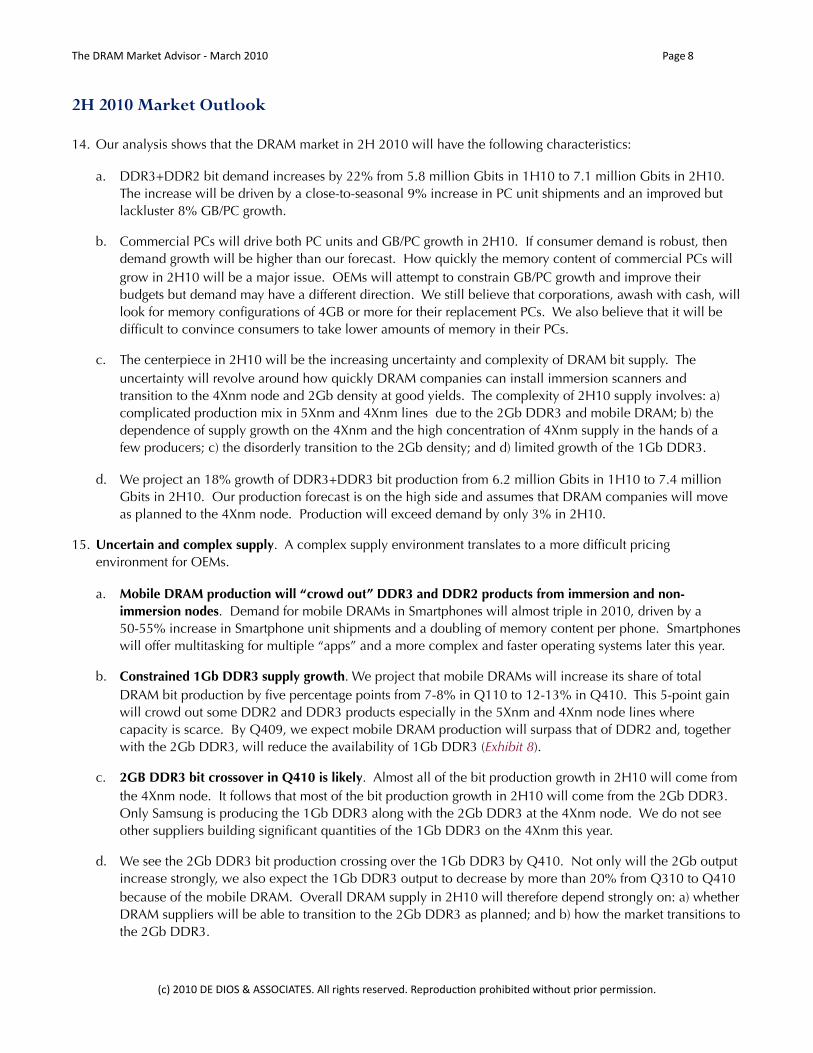
10. DDR2+DDR3 production growth will exceed demand in Q210. We expect DDR2+DDR3 bit production to exceed demand by 8% in Q210 but inventory levels will remain low for both DRAM suppliers and the channel (Exhibit 5). Due to the rebalancing, our analysis shows DDR3 production exceeding demand and DDR2 production falling below demand in May and June. In both cases, DRAM supplier and channel inventory will remain well below normal operating levels. We project an 8% growth of DRAM production from about 3.0 billion Gbits in Q110 to 3.2 billion in Q210.
a. Some OEMs have reported improved support in Q210 compared to Q110 although securing a consistent supply flow is very difficult and the chance of building buffer inventory is low.
TheDRAMMarketAdvisor‐March2010 Page4
(c)2010DEDIOS&ASSOCIATES.Allrightsreserved.ReproducEonprohibitedwithoutpriorpermission.
11. Attempt to increase April 2010 DDR3 prices before the effect of rebalancing. Faced with low inventory levels and persistent customer requests, we believe DRAM companies will attempt to increase DDR3 prices and succeed for several reasons.
a. DDR2 and DDR3 spot prices have jumped 17% and 6%, respectively, from 1H to 2H March 2010. The DDR2 spot price is now 5% higher than the DDR3. At the end of March, the DDR2 and DDR3 spot prices were 20% and 10%, respectively, higher than their equivalent average major OEM price. DRAM companies will look to close the gap (Exhibit 6).
b. Several DRAM companies are highly motivated and feel the need more profit and cash to stabilize their balance sheets and fund their capital spending budgets. Our rough estimate shows that it will take a DRAM revenue of over 40 billion USD for all DRAM companies, except Samsung, to generate enough cash to buy down matured and maturing debt and meet capital spending plans.
c. Their cost reductions have slowed because of the inability to buy immersion scanners early. Without significant cost reductions, these companies must raise prices to generate more profit and cash.
d. Market conditions today are conducive for a price increase. Supplier, OEM, and module company inventory levels remain very low and customers are continuing to follow up deliveries and increase their supply support from DRAM companies.
12. Highlights of Demand-Supply Conditions and Impact on Price. We believe the demand rebalancing will not significantly affect market conditions and the pricing environment in Q210. At the most, it will extend DDR3 supply support to a wider customer base and change the channel inventory mix towards DDR3 (Exhibit 7). After the April price increase, we do not see a market-based justification for further price increases. At the same time, the market environment through May will not inhibit further attempts by DRAM companies to raise prices.
a. We do not believe that the surge of DDR2 spot prices can continue. The first reason is that the demand surge that raised DDR2 spot prices was temporary and based on speculative buying, probably fueled by rumors of the Calpella platform shortage. The second reason is that unfilled DDR3 demand, which has boosted DDR2 demand since Q309, will diminish considerably by May and counteract the DDR2 demand increase due to the rebalancing of demand. However, we expect DDR2 spot prices to remain higher through June because channel inventories will remain low.
b. DRAM supplier inventory levels will remain very low through Q210. Despite the rebalancing of demand, inventories throughout the market will remain low. DDR3 supplier inventory will be the lowest, between 0.6 to 1.0 week. However, we expect OEMs to see improvements in supply flow by 2H May. DDR3+DDR2 supplier inventory will stay below one week, based on our analysis. We believe the improvement of DDR3 supply will allow DRAM companies to expand their support beyond major OEMs to regional customers and third-party module companies. As a result, we expect most of the DDR3 price increases to affect customers at the low end of the price range in April. We also see DDR3 and DDR2 prices leveling in May as supply flows, though still tight, improve.
c. Channel inventory will remain low through Q210. The channel inventory mix will shift from a heavy weight on DDR2 to a heavy weight on DDR3. We believe that channel DDR3 inventory will rise sharply in June but overall DRAM inventory will remain at the low end of normal operating levels. DDR2 inventory, in bits and weeks, will decrease and offset rising DDR3 stock. We therefore expect DDR3 spot prices to rise gradually and peak at the end of May and early June.
13. Sensitivity to Higher Rebalancing Volumes. Our analysis shows, that increasing or decreasing the rebalanced volume (of 120 million Gbits) will change market conditions but will not alter our conclusions on demand-
TheDRAMMarketAdvisor‐March2010 Page5
(c)2010DEDIOS&ASSOCIATES.Allrightsreserved.ReproducEonprohibitedwithoutpriorpermission.
supply relationship, inventories, and price. Lower rebalancing will make DDR3 tighter while higher rebalancing will loosen DDR3 supply more. However, overall inventory levels in Q210 will remain low.
a. Our sensitivity analysis, however, has some interesting conclusions. First, the effect of rebalancing on DDR3 market is much greater than the effect on the DDR3 market. Rebalancing can lead to conditions that can raise DDR2 prices faster than it can lead to conditions that can lead to much lower DDR3 prices. Second, a greater rebalancing to the DDR2 will mean a steeper transition back to DDR3 in 2H10. This can lead to the same situation OEMs faced in January 2010, when DDR3 demand rose sharply. The conclusion is that rebalancing can be risky and lead to unintended consequences.
EXHIBIT4.NARROWINGDIFFERENCEBETWEENGBYTEPERNOTEBOOKINDEVELOPED&EMERGINGMARKETS
!"#
$!"#
%!"#
&!"#
'!"#
(!"#
#$)!%'##
#$)(&*##
#%)!'+##
#%)(*!##
#&)!,%##
#&)(+'##
$# %# &# '# (# *# ,# +# -# $!#$$#$%# $# %# &# '# (# *# ,# +# -# $!#$$#$%# $# %#
%!!+# %!!-# %!$!#
!"#$%%&
'&()&"*+(
"&,&'-$(-".(#"
#&/&01
2&#",
.'3&45"
./&'.-&"-*64&"2&'"(14&*113"2)"
./0121341#
5167113#
8191:;<18#=38#1>12?/3?#
>=2@16A#BCDEF#
G=H;2#EF#
C2=38)#
.191:;<18#G=2@16A#
G=H;2#EF#
C2=38)#
I>12?/3?#G=2@16A#
EXHIBIT5.COMPARISONOFDDR2ANDDDR3DEMANDANDPRODUCTIONINQ22010
!"#$%%!!
!&#%%%!!
!&#$%%!!
!'#%%%!!
!'#$%%!!
('%)! (*%)! (""%! (&"%!
!"##"$%&'$(')")*+",&' ++,'-++,&!
+./01+!
++,'-++,&!
2,3+456731!
!"#$%&'()$
*+,-$
!"#$%&'()$
*+*.$
!"#$%&'()$
,+/0$
!"#$%&'()$
,+/-$
TheDRAMMarketAdvisor‐March2010 Page6
(c)2010DEDIOS&ASSOCIATES.Allrightsreserved.ReproducEonprohibitedwithoutpriorpermission.

EXHIBIT6.WIDENEDGAPBETWEENOEMANDSPOTPRICES
!"#$%&!!
!'&$&&!!
!''$%&!!
!'%$&&!!
!'#$%&!!
"! (! %! )! ""!"%!"#!")!'(!'%! "! (! %! )! ""!"%!"#!")!'(!'%!')!("!
*+,! -./!
001'!-2341!
45-!61785!
001'!9:;<-.=:/!
45-!6/>?+!
001'!@A:B!6/>?+!
!"#$%&!!
!'&$&&!!
!''$%&!!
!'%$&&!!
!'#$%&!!
"! (! %! )! ""!"%!"#!")!'(!'%! "! (! %! )! ""!"%!"#!")!'(!'%!')!("!
*+,! -./!
0012!-.34/!56-!
7/89+!
001(!:4;<-.34/!
56-!7/89+!
001(!=>4?!7/89+!
EXHIBIT7.FORECASTOFQ210DDR3ANDDDR2MARKETCONDITIONS
TheDRAMMarketAdvisor‐March2010 Page7
(c)2010DEDIOS&ASSOCIATES.Allrightsreserved.ReproducEonprohibitedwithoutpriorpermission.
2H 2010 Market Outlook
14. Our analysis shows that the DRAM market in 2H 2010 will have the following characteristics:
a. DDR3+DDR2 bit demand increases by 22% from 5.8 million Gbits in 1H10 to 7.1 million Gbits in 2H10. The increase will be driven by a close-to-seasonal 9% increase in PC unit shipments and an improved but lackluster 8% GB/PC growth.
b. Commercial PCs will drive both PC units and GB/PC growth in 2H10. If consumer demand is robust, then demand growth will be higher than our forecast. How quickly the memory content of commercial PCs will grow in 2H10 will be a major issue. OEMs will attempt to constrain GB/PC growth and improve their budgets but demand may have a different direction. We still believe that corporations, awash with cash, will look for memory configurations of 4GB or more for their replacement PCs. We also believe that it will be difficult to convince consumers to take lower amounts of memory in their PCs.
c. The centerpiece in 2H10 will be the increasing uncertainty and complexity of DRAM bit supply. The uncertainty will revolve around how quickly DRAM companies can install immersion scanners and transition to the 4Xnm node and 2Gb density at good yields. The complexity of 2H10 supply involves: a) complicated production mix in 5Xnm and 4Xnm lines due to the 2Gb DDR3 and mobile DRAM; b) the dependence of supply growth on the 4Xnm and the high concentration of 4Xnm supply in the hands of a few producers; c) the disorderly transition to the 2Gb density; and d) limited growth of the 1Gb DDR3.
d. We project an 18% growth of DDR3+DDR3 bit production from 6.2 million Gbits in 1H10 to 7.4 million Gbits in 2H10. Our production forecast is on the high side and assumes that DRAM companies will move as planned to the 4Xnm node. Production will exceed demand by only 3% in 2H10.
15. Uncertain and complex supply. A complex supply environment translates to a more difficult pricing environment for OEMs.
a. Mobile DRAM production will “crowd out” DDR3 and DDR2 products from immersion and non-immersion nodes. Demand for mobile DRAMs in Smartphones will almost triple in 2010, driven by a 50-55% increase in Smartphone unit shipments and a doubling of memory content per phone. Smartphones will offer multitasking for multiple “apps” and a more complex and faster operating systems later this year.
b. Constrained 1Gb DDR3 supply growth. We project that mobile DRAMs will increase its share of total DRAM bit production by five percentage points from 7-8% in Q110 to 12-13% in Q410. This 5-point gain will crowd out some DDR2 and DDR3 products especially in the 5Xnm and 4Xnm node lines where capacity is scarce. By Q409, we expect mobile DRAM production will surpass that of DDR2 and, together with the 2Gb DDR3, will reduce the availability of 1Gb DDR3 (Exhibit 8).
c. 2GB DDR3 bit crossover in Q410 is likely. Almost all of the bit production growth in 2H10 will come from the 4Xnm node. It follows that most of the bit production growth in 2H10 will come from the 2Gb DDR3. Only Samsung is producing the 1Gb DDR3 along with the 2Gb DDR3 at the 4Xnm node. We do not see other suppliers building significant quantities of the 1Gb DDR3 on the 4Xnm this year.
d. We see the 2Gb DDR3 bit production crossing over the 1Gb DDR3 by Q410. Not only will the 2Gb output increase strongly, we also expect the 1Gb DDR3 output to decrease by more than 20% from Q310 to Q410 because of the mobile DRAM. Overall DRAM supply in 2H10 will therefore depend strongly on: a) whether DRAM suppliers will be able to transition to the 2Gb DDR3 as planned; and b) how the market transitions to the 2Gb DDR3.
TheDRAMMarketAdvisor‐March2010 Page8
(c)2010DEDIOS&ASSOCIATES.Allrightsreserved.ReproducEonprohibitedwithoutpriorpermission.
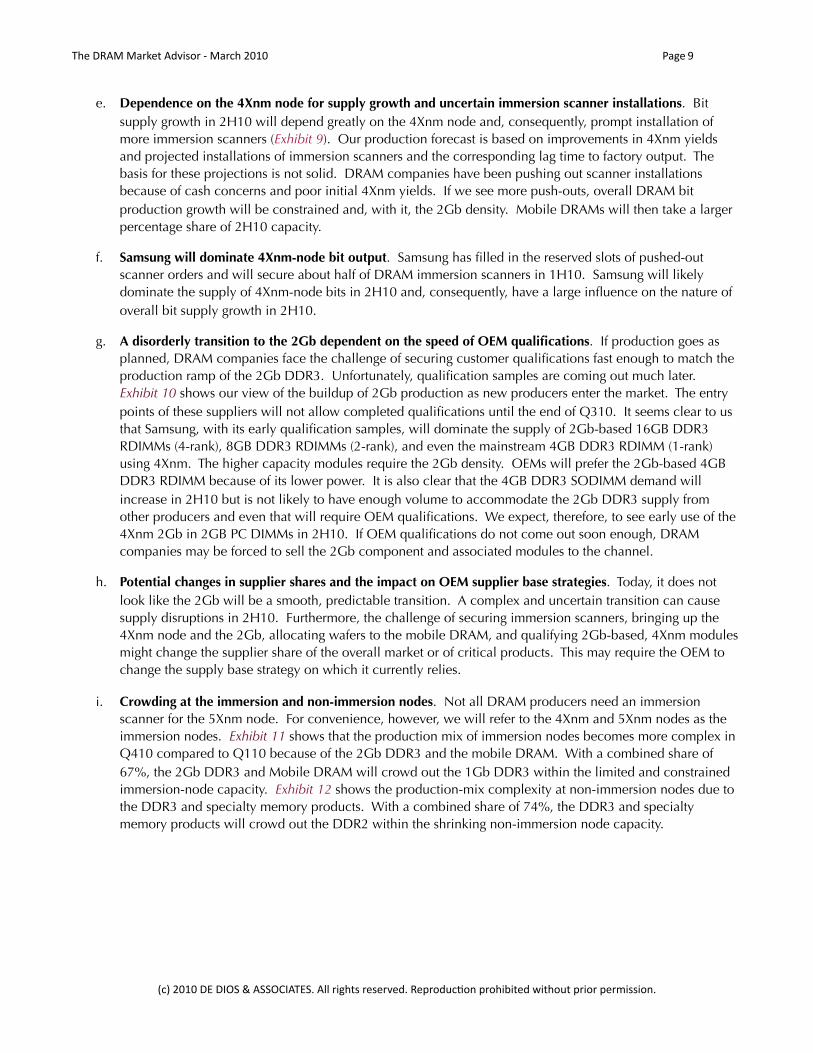
e. Dependence on the 4Xnm node for supply growth and uncertain immersion scanner installations. Bit supply growth in 2H10 will depend greatly on the 4Xnm node and, consequently, prompt installation of more immersion scanners (Exhibit 9). Our production forecast is based on improvements in 4Xnm yields and projected installations of immersion scanners and the corresponding lag time to factory output. The basis for these projections is not solid. DRAM companies have been pushing out scanner installations because of cash concerns and poor initial 4Xnm yields. If we see more push-outs, overall DRAM bit production growth will be constrained and, with it, the 2Gb density. Mobile DRAMs will then take a larger percentage share of 2H10 capacity.
f. Samsung will dominate 4Xnm-node bit output. Samsung has filled in the reserved slots of pushed-out scanner orders and will secure about half of DRAM immersion scanners in 1H10. Samsung will likely dominate the supply of 4Xnm-node bits in 2H10 and, consequently, have a large influence on the nature of overall bit supply growth in 2H10.
g. A disorderly transition to the 2Gb dependent on the speed of OEM qualifications. If production goes as planned, DRAM companies face the challenge of securing customer qualifications fast enough to match the production ramp of the 2Gb DDR3. Unfortunately, qualification samples are coming out much later. Exhibit 10 shows our view of the buildup of 2Gb production as new producers enter the market. The entry points of these suppliers will not allow completed qualifications until the end of Q310. It seems clear to us that Samsung, with its early qualification samples, will dominate the supply of 2Gb-based 16GB DDR3 RDIMMs (4-rank), 8GB DDR3 RDIMMs (2-rank), and even the mainstream 4GB DDR3 RDIMM (1-rank) using 4Xnm. The higher capacity modules require the 2Gb density. OEMs will prefer the 2Gb-based 4GB DDR3 RDIMM because of its lower power. It is also clear that the 4GB DDR3 SODIMM demand will increase in 2H10 but is not likely to have enough volume to accommodate the 2Gb DDR3 supply from other producers and even that will require OEM qualifications. We expect, therefore, to see early use of the 4Xnm 2Gb in 2GB PC DIMMs in 2H10. If OEM qualifications do not come out soon enough, DRAM companies may be forced to sell the 2Gb component and associated modules to the channel.
h. Potential changes in supplier shares and the impact on OEM supplier base strategies. Today, it does not look like the 2Gb will be a smooth, predictable transition. A complex and uncertain transition can cause supply disruptions in 2H10. Furthermore, the challenge of securing immersion scanners, bringing up the 4Xnm node and the 2Gb, allocating wafers to the mobile DRAM, and qualifying 2Gb-based, 4Xnm modules might change the supplier share of the overall market or of critical products. This may require the OEM to change the supply base strategy on which it currently relies.
i. Crowding at the immersion and non-immersion nodes. Not all DRAM producers need an immersion scanner for the 5Xnm node. For convenience, however, we will refer to the 4Xnm and 5Xnm nodes as the immersion nodes. Exhibit 11 shows that the production mix of immersion nodes becomes more complex in Q410 compared to Q110 because of the 2Gb DDR3 and the mobile DRAM. With a combined share of 67%, the 2Gb DDR3 and Mobile DRAM will crowd out the 1Gb DDR3 within the limited and constrained immersion-node capacity. Exhibit 12 shows the production-mix complexity at non-immersion nodes due to the DDR3 and specialty memory products. With a combined share of 74%, the DDR3 and specialty memory products will crowd out the DDR2 within the shrinking non-immersion node capacity.
TheDRAMMarketAdvisor‐March2010 Page9
(c)2010DEDIOS&ASSOCIATES.Allrightsreserved.ReproducEonprohibitedwithoutpriorpermission.
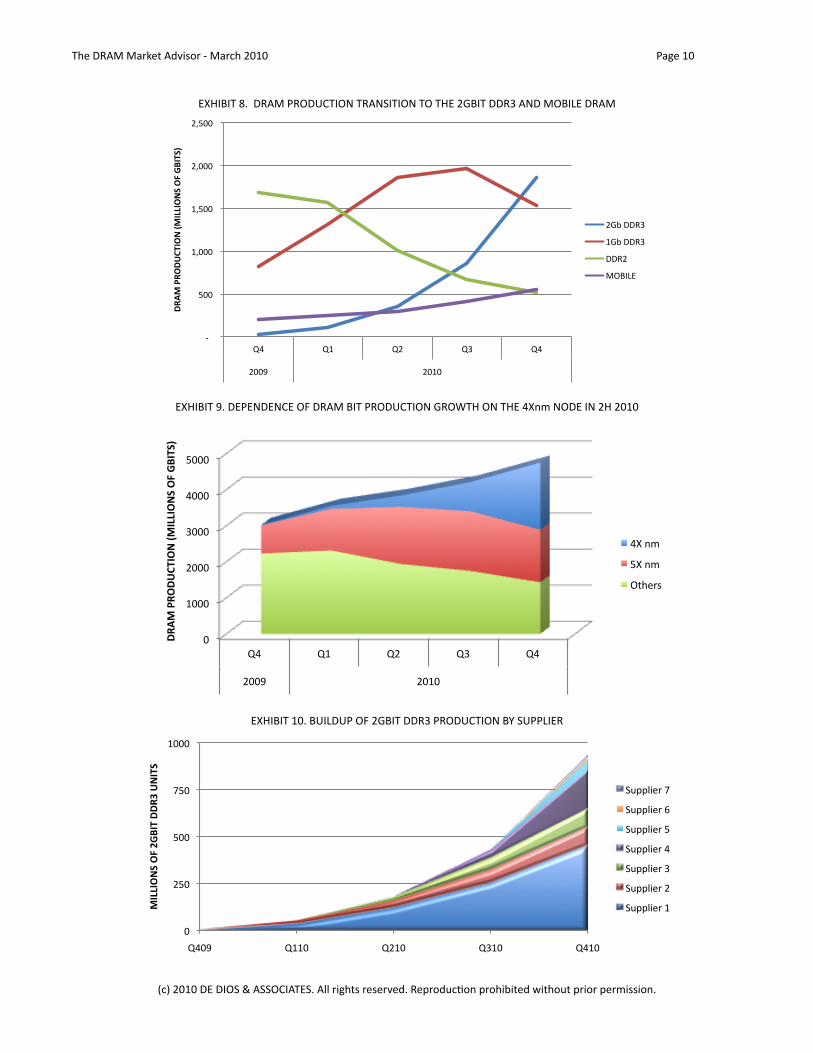
EXHIBIT8.DRAMPRODUCTIONTRANSITIONTOTHE2GBITDDR3ANDMOBILEDRAM
!"!!!!
!#$$!!
!%&$$$!!
!%&#$$!!
!'&$$$!!
!'&#$$!!
()! (%! ('! (*! ()!
'$$+! '$%$!
!"#$%&"'!()*+',%-$+..+',/%'0%12+*/3%
',-!../*!
%,-!../*!
../'!
012345!
EXHIBIT9.DEPENDENCEOFDRAMBITPRODUCTIONGROWTHONTHE4XnmNODEIN2H2010
!"
#!!!"
$!!!"
%!!!"
&!!!"
'!!!"
(&" (#" ($" (%" (&"
$!!)" $!#!"
!"#$%&"'!()*+',%-$+..+',/%'0%12+*/3%
&*"+,"
'*"+,"
-./012"
EXHIBIT10.BUILDUPOF2GBITDDR3PRODUCTIONBYSUPPLIER
!"
#$!"
$!!"
%$!"
&!!!"
'(!)" '&&!" '#&!" '*&!" '(&!"
!"##"$%&'$(')*+",'--./'0%",&'
+,--./01"%"
+,--./01"2"
+,--./01"$"
+,--./01"("
+,--./01"*"
+,--./01"#"
+,--./01"&"
TheDRAMMarketAdvisor‐March2010 Page10
(c)2010DEDIOS&ASSOCIATES.Allrightsreserved.ReproducEonprohibitedwithoutpriorpermission.

EXHIBIT11.INCREASINGCOMPLEXITYOF5XnmAND4XnmPRODUCTIONMIXIN2H2010
!"#
$!"#
%!"#
&!"#
'!"#
(!!"#
)%# )(# )$# )*# )%#
$!!+# $!(!#
!"#$%&'(&)*+,*-.&/'0%&123&4$'05632'/&
,-./0123#
456178#9:;4#
(,6#99:$#
$,6#99:$#
(,6#99:*#
$,6#99:*#
$,6#99:*#
EXHIBIT12.INCREASINGCOMPLEXITYOF6XnmANDHIGHERPRODUCTIONMIXIN2H2010
!"#
$!"#
%!"#
&!"#
'!"#
(!!"#
)%# )(# )$# )*# )%#
$!!+# $!(!#
!"#$%&'(&)*+,&-&"./"%$&0'1%&2.3&
4$'1563.'0&
,-./0123#
4356789/#
:-;8<2#=>?:#
(4;#==>$#
$4;#==>$#
(4;#==>*#
$4;#==>*#
$4;#==>*#
TheDRAMMarketAdvisor‐March2010 Page11
(c)2010DEDIOS&ASSOCIATES.Allrightsreserved.ReproducEonprohibitedwithoutpriorpermission.

16. Highlights of Demand-Supply Conditions and Impact on Price. Exhibit 13 summarizes our view of DDR3 and DDR2 market conditions in 2H10. These conditions depend on improved production in 2H10, which still carries a lot of uncertainty. If that production growth does not materialize, tight supply conditions will prevail and may get worse because of the increasing product-mix complexity. We assume no additional and significant rebalancing efforts in 2H10.
a. Higher channel inventory levels in 2H10. Our analysis shows that the DRAM channel will experience rising inventory pressures from July to September. Inventory pressure will come from the DDR3 between July and August and from the DDR2 between August and September. How third-party module companies approach the rising inventory will determine prices in Q310. If they are consistent with their behavior since Q2 2009, we believe third-party module companies will absorb the inventory and attempt to periodically reduce prices gradually to bring that inventory back to normal operating levels. Regardless, of the approach, the DDR3 spot prices will experience downward pressures in July and August and DDR2 prices will experience the same from August through September and towards the end of Q410.
b. DDR2 inventory pressures as demand shrinks. Third-party module companies and the channel will face the challenge of shifting their inventory mix to a greater DDR3 weight. This will be especially true in Q310 when we expect the channel to reduce its speculative stock as prices soften. We expect DRAM companies to see their DDR2 inventory weeks rising beyond acceptable levels in September. Because demand will be shrinking more quickly in 2H10, DRAM producers will continue to shift their DDR2 production plans to the DDR3 or other DRAMs. We believe this challenge or reducing DDR2 in the inventory mix will lead to spot prices being consistently lower than the major OEM prices.
c. DRAM supplier inventory levels will remain low. We project supplier inventory levels below a week in 2H10. The probability of a price increase is high in September and October as demand exceeds production.
d. Year-end price pressures. We expect market conditions to weaken in November and December as it normally does. More pressure will be put on the channel and the spot prices than on major OEM prices. All DRAM companies will have made their revenue targets easily and will not find it necessary to bring prices down significantly.
TheDRAMMarketAdvisor‐March2010 Page12
(c)2010DEDIOS&ASSOCIATES.Allrightsreserved.ReproducEonprohibitedwithoutpriorpermission.
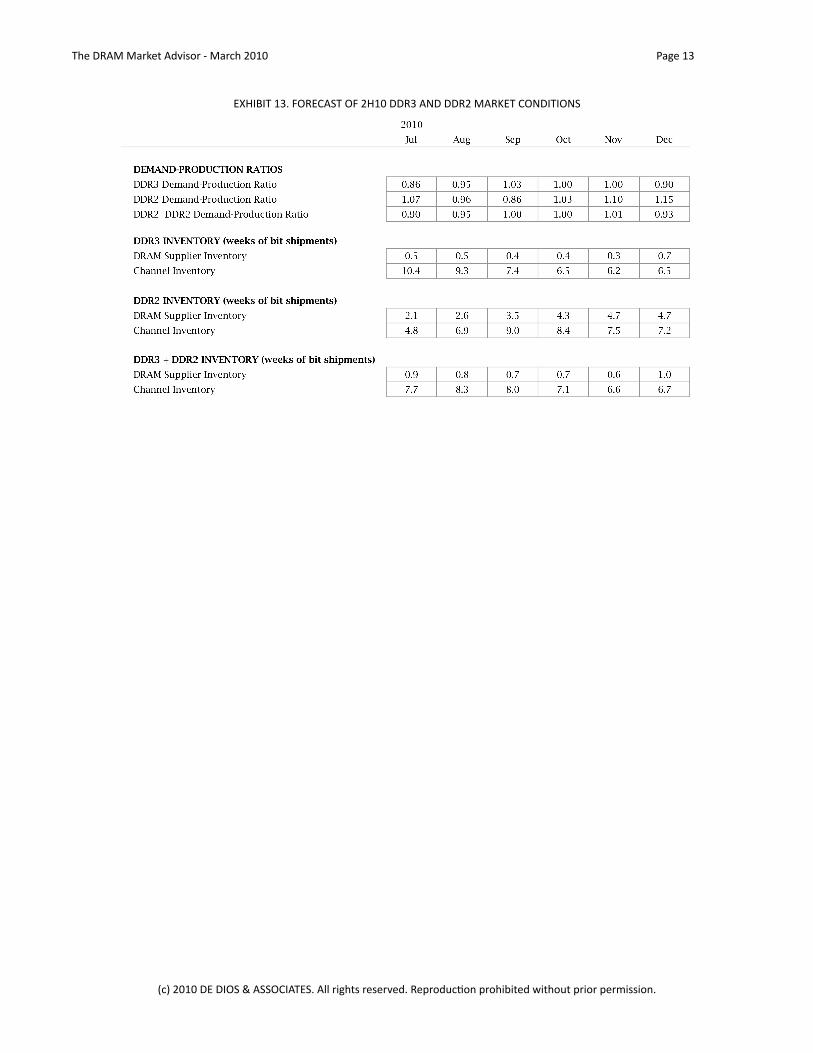
EXHIBIT13.FORECASTOF2H10DDR3ANDDDR2MARKETCONDITIONS
TheDRAMMarketAdvisor‐March2010 Page13
(c)2010DEDIOS&ASSOCIATES.Allrightsreserved.ReproducEonprohibitedwithoutpriorpermission.
Price Forecast and Revenue Projection
PRICE FORECAST HIGHLIGHTS
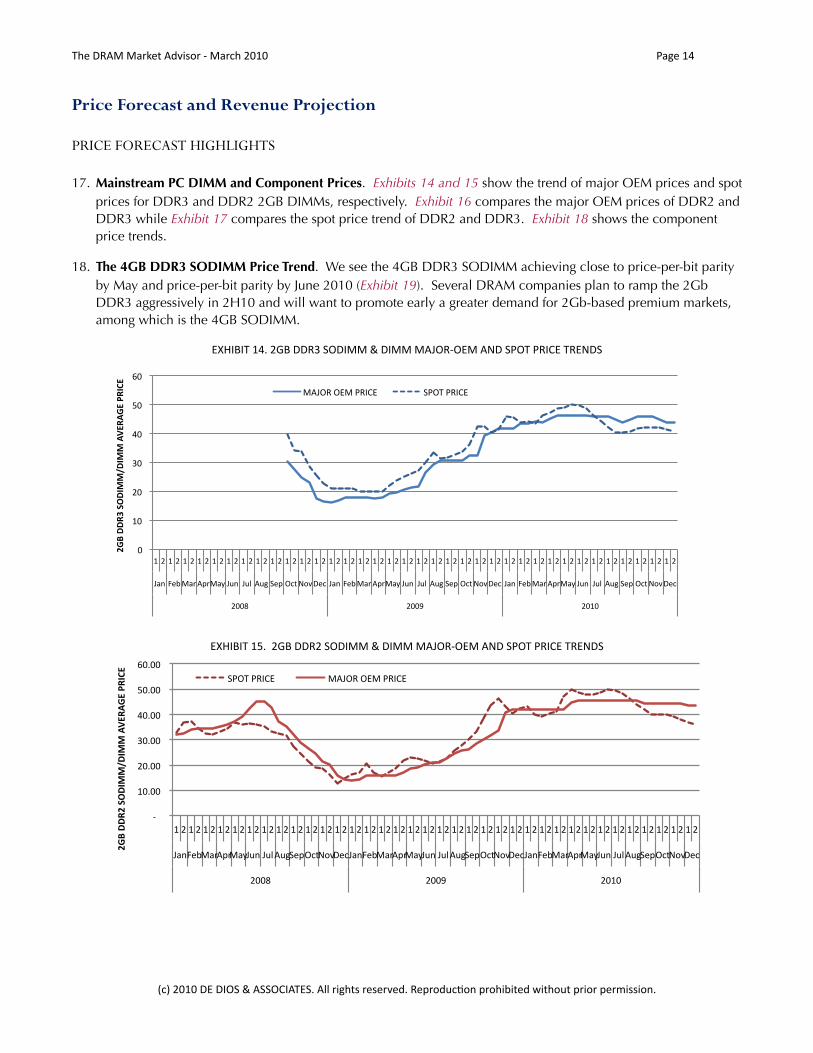
17. Mainstream PC DIMM and Component Prices. Exhibits 14 and 15 show the trend of major OEM prices and spot prices for DDR3 and DDR2 2GB DIMMs, respectively. Exhibit 16 compares the major OEM prices of DDR2 and DDR3 while Exhibit 17 compares the spot price trend of DDR2 and DDR3. Exhibit 18 shows the component price trends.
18. The 4GB DDR3 SODIMM Price Trend. We see the 4GB DDR3 SODIMM achieving close to price-per-bit parity by May and price-per-bit parity by June 2010 (Exhibit 19). Several DRAM companies plan to ramp the 2Gb DDR3 aggressively in 2H10 and will want to promote early a greater demand for 2Gb-based premium markets, among which is the 4GB SODIMM.
EXHIBIT14.2GBDDR3SODIMM&DIMMMAJOR‐OEMANDSPOTPRICETRENDS
!"
#!"
$!"
%!"
&!"
'!"
(!"
#"$"#"$"#"$"#"$"#"$"#"$"#"$"#"$"#"$"#"$"#"$"#"$"#"$"#"$"#"$"#"$"#"$"#"$"#"$"#"$"#"$"#"$"#"$"#"$"#"$"#"$"#"$"#"$"#"$"#"$"#"$"#"$"#"$"#"$"#"$"#"$"
)*+",-."/*0"120"/*3")4+" )45" 146"7-2"89:";<=">-9" )*+",-."/*0"120"/*3")4+" )45" 146"7-2"89:";<=">-9" )*+",-."/*0"120"/*3")4+" )45" 146"7-2"89:";<=">-9"
$!!?" $!!@" $!#!"
!"#$%%&'$()%*+
+,%
*++$-./&-"/$0&*1/$
/1)8A"8B/"CADEB" 7C8F"CADEB"
EXHIBIT15.2GBDDR2SODIMM&DIMMMAJOR‐OEMANDSPOTPRICETRENDS
!"!!!!
!#$%$$!!
!&$%$$!!
!'$%$$!!
!($%$$!!
!)$%$$!!
!*$%$$!!
#!&!#!&!#!&!#!&!#!&!#!&!#!&!#!&!#!&!#!&!#!&!#!&!#!&!#!&!#!&!#!&!#!&!#!&!#!&!#!&!#!&!#!&!#!&!#!&!#!&!#!&!#!&!#!&!#!&!#!&!#!&!#!&!#!&!#!&!#!&!#!&!
+,-!./0!1,2!342!1,5!+6-!+67!368!9/4!:;<!=>?!@/;!+,-!./0!1,2!342!1,5!+6-!+67!368!9/4!:;<!=>?!@/;!+,-!./0!1,2!342!1,5!+6-!+67!368!9/4!:;<!=>?!@/;!
&$$A! &$$B! &$#$!
!"#$%%&!$'(%)*
*+%
)**$,-.&,".$/&)0.$
9C:D!CEFGH! 13+:E!:H1!CEFGH!
TheDRAMMarketAdvisor‐March2010 Page14
(c)2010DEDIOS&ASSOCIATES.Allrightsreserved.ReproducEonprohibitedwithoutpriorpermission.
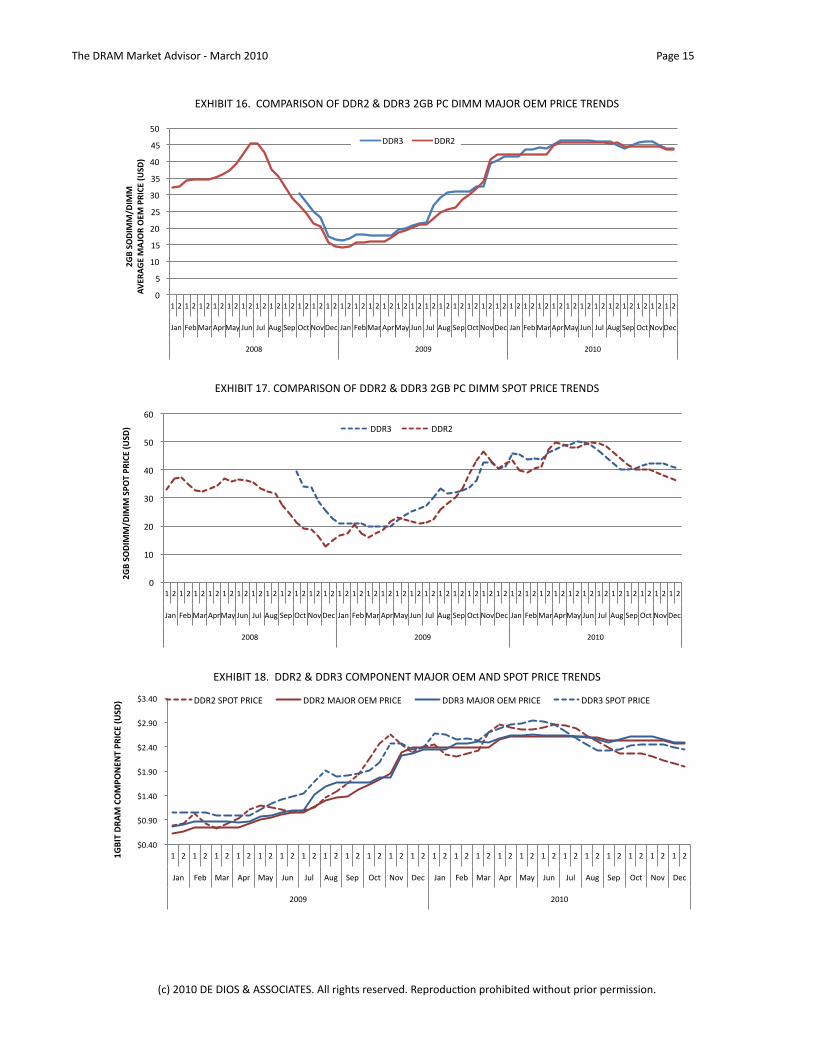
EXHIBIT16.COMPARISONOFDDR2&DDR32GBPCDIMMMAJOROEMPRICETRENDS
!"
#"
$!"
$#"
%!"
%#"
&!"
&#"
'!"
'#"
#!"
$" %" $" %" $" %" $" %" $" %" $" %" $" %" $" %" $" %" $" %" $" %" $" %" $" %" $" %" $" %" $" %" $" %" $" %" $" %" $" %" $" %" $" %" $" %" $" %" $" %" $" %" $" %" $" %" $" %" $" %" $" %" $" %" $" %" $" %" $" %" $" %"
()*" +,-".)/"01/".)2"(3*" (34" 035"6,1"789":;<"=,8" ()*" +,-".)/"01/".)2"(3*" (34" 035"6,1"789":;<"=,8" ()*" +,-".)/"01/".)2"(3*" (34" 035"6,1"789":;<"=,8"
%!!>" %!!?" %!$!"
!"#$%&'()
)*'
())$$
+,-.+"-$)
+/&.$&-)$0.(1-$23%'4$
==@&" ==@%"
EXHIBIT17.COMPARISONOFDDR2&DDR32GBPCDIMMSPOTPRICETRENDS
!"
#!"
$!"
%!"
&!"
'!"
(!"
#" $" #" $" #" $" #" $" #" $" #" $" #" $" #" $" #" $" #" $" #" $" #" $" #" $" #" $" #" $" #" $" #" $" #" $" #" $" #" $" #" $" #" $" #" $" #" $" #" $" #" $" #" $" #" $" #" $" #" $" #" $" #" $" #" $" #" $" #" $" #" $"
)*+" ,-."/*0"120"/*3")4+" )45" 146"7-2"89:";<=">-9" )*+" ,-."/*0"120"/*3")4+" )45" 146"7-2"89:";<=">-9" )*+" ,-."/*0"120"/*3")4+" )45" 146"7-2"89:";<=">-9"
$!!?" $!!@" $!#!"
!"#$%&'()
)*'
())$%+&,$+-(./$01%'2$ >>A%" >>A$"
EXHIBIT18.DDR2&DDR3COMPONENTMAJOROEMANDSPOTPRICETRENDS
!"#$%#!!
!"#$&#!!
!"'$%#!!
!"'$&#!!
!"($%#!!
!"($&#!!
!")$%#!!
'! (! '! (! '! (! '! (! '! (! '! (! '! (! '! (! '! (! '! (! '! (! '! (! '! (! '! (! '! (! '! (! '! (! '! (! '! (! '! (! '! (! '! (! '! (! '! (!
*+,! -./! 0+1! 231! 0+4! *5,! *56! 257! 8.3! 9:;! <=>! ?.:! *+,! -./! 0+1! 231! 0+4! *5,! *56! 257! 8.3! 9:;! <=>! ?.:!
(##&! (#'#!
!"#$%&'()*&+,*-,./.%&-($+/&012'3& ??@(!8A9B!A@CDE! ??@(!02*9@!9E0!A@CDE! ??@)!02*9@!9E0!A@CDE! ??@)!8A9B!A@CDE!
TheDRAMMarketAdvisor‐March2010 Page15
(c)2010DEDIOS&ASSOCIATES.Allrightsreserved.ReproducEonprohibitedwithoutpriorpermission.
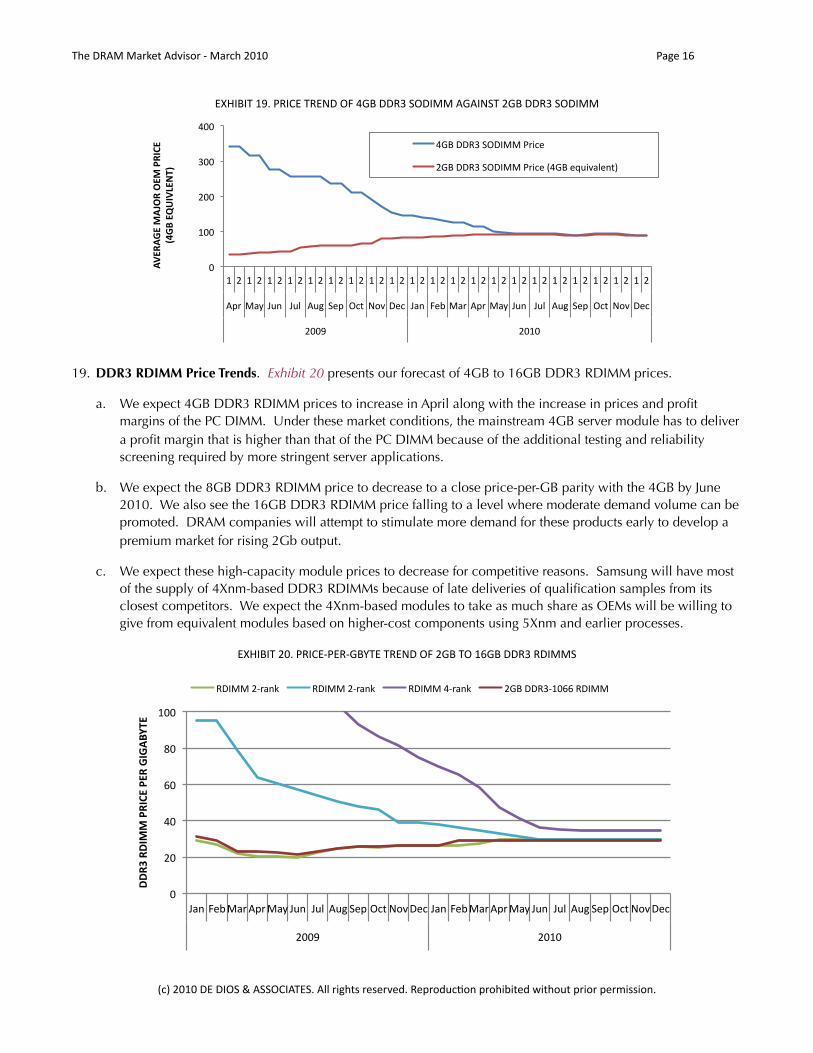
EXHIBIT19.PRICETRENDOF4GBDDR3SODIMMAGAINST2GBDDR3SODIMM
!"
#!!"
$!!"
%!!"
&!!"
#" $" #" $" #" $" #" $" #" $" #" $" #" $" #" $" #" $" #" $" #" $" #" $" #" $" #" $" #" $" #" $" #" $" #" $" #" $" #" $" #" $"
'()"*+," -./" -.0" '.1" 23(" 456" 789":35" -+/" ;3<"*+)" '()"*+," -./" -.0" '.1" 23(" 456" 789":35"
$!!=" $!#!"
!"#$!%#&'
!()$&)#'&*$+,#&&
-.%/+"2#345&
&>?"::@%"24:A**"B)C53"
$>?"::@%"24:A**"B)C53"D&>?"3E.C9+03/6F"
19. DDR3 RDIMM Price Trends. Exhibit 20 presents our forecast of 4GB to 16GB DDR3 RDIMM prices.
a. We expect 4GB DDR3 RDIMM prices to increase in April along with the increase in prices and profit margins of the PC DIMM. Under these market conditions, the mainstream 4GB server module has to deliver a profit margin that is higher than that of the PC DIMM because of the additional testing and reliability screening required by more stringent server applications.
b. We expect the 8GB DDR3 RDIMM price to decrease to a close price-per-GB parity with the 4GB by June 2010. We also see the 16GB DDR3 RDIMM price falling to a level where moderate demand volume can be promoted. DRAM companies will attempt to stimulate more demand for these products early to develop a premium market for rising 2Gb output.
c. We expect these high-capacity module prices to decrease for competitive reasons. Samsung will have most of the supply of 4Xnm-based DDR3 RDIMMs because of late deliveries of qualification samples from its closest competitors. We expect the 4Xnm-based modules to take as much share as OEMs will be willing to give from equivalent modules based on higher-cost components using 5Xnm and earlier processes.
EXHIBIT20.PRICE‐PER‐GBYTETRENDOF2GBTO16GBDDR3RDIMMS
!"
#!"
$!"
%!"
&!"
'!!"
()*"+,-".)/"01/".)2"(3*" (34" 035"6,1"789":;<"=,8"()*"+,-".)/"01/".)2"(3*" (34" 035"6,1"789":;<"=,8"
#!!>" #!'!"
!!"#$"!%&
&$'"%()$')"$*%*+,-.)$
?=@.."#A/)*B" ?=@.."#A/)*B" ?=@.."$A/)*B" #CD"==?EA'!%%"?=@.."
TheDRAMMarketAdvisor‐March2010 Page16
(c)2010DEDIOS&ASSOCIATES.Allrightsreserved.ReproducEonprohibitedwithoutpriorpermission.
2010 DRAM REVENUE FORECAST
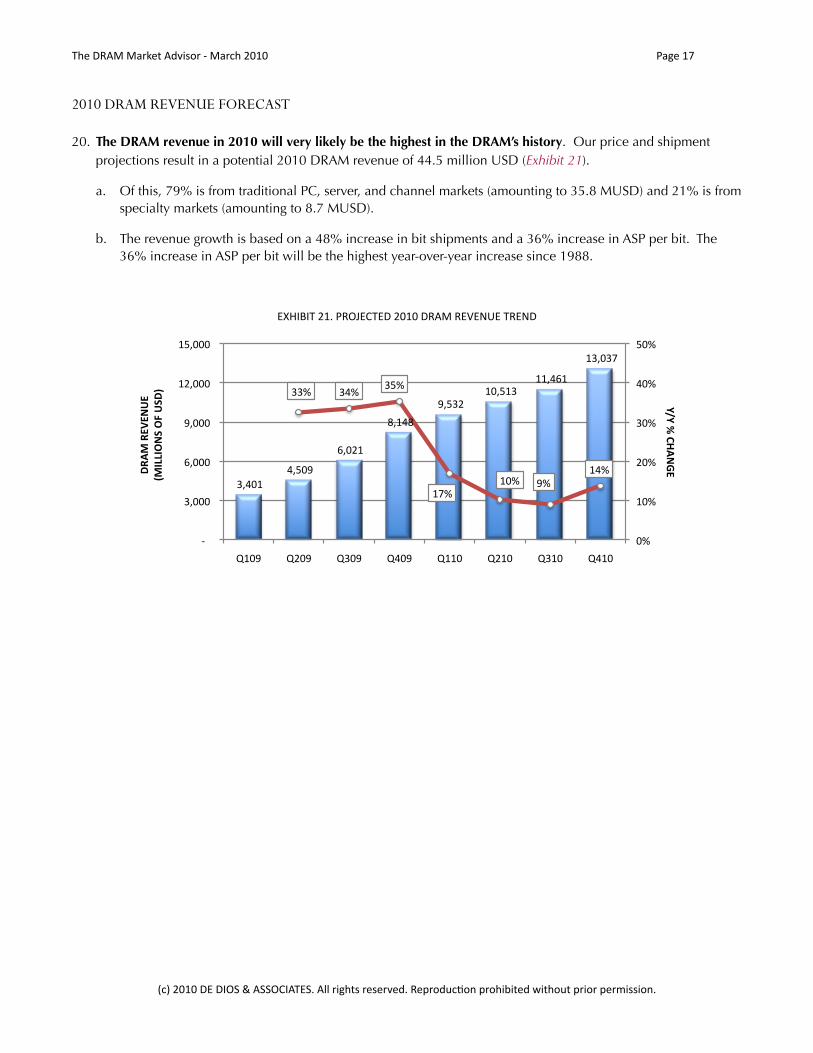
20. The DRAM revenue in 2010 will very likely be the highest in the DRAM’s history. Our price and shipment projections result in a potential 2010 DRAM revenue of 44.5 million USD (Exhibit 21).
a. Of this, 79% is from traditional PC, server, and channel markets (amounting to 35.8 MUSD) and 21% is from specialty markets (amounting to 8.7 MUSD).
b. The revenue growth is based on a 48% increase in bit shipments and a 36% increase in ASP per bit. The 36% increase in ASP per bit will be the highest year-over-year increase since 1988.
EXHIBIT21.PROJECTED2010DRAMREVENUETREND
!"#$%&!!
!$#'%(!!
!)#%*&!!
!+#&$+!!
!(#'"*!!
!&%#'&"!!
!&&#$)&!!
!&"#%",!!
""-! "$-!"'-!
&,-!
&%-! (-!
&$-!
%-!
&%-!
*%-!
"%-!
$%-!
'%-!
!.!!!!
!"#%%%!!
!)#%%%!!
!(#%%%!!
!&*#%%%!!
!&'#%%%!!
/&%(! /*%(! /"%(! /$%(! /&&%! /*&%! /"&%! /$&%!
!"!#$#%&'()*#+
,'-#,*.*(/*##
0-12213(4#35#/4+6#
TheDRAMMarketAdvisor‐March2010 Page17
(c)2010DEDIOS&ASSOCIATES.Allrightsreserved.ReproducEonprohibitedwithoutpriorpermission.

PRICE FORECAST TABLES
The following tables present actual and forecast prices of various DRAM modules and components. Prices are actual
through the second half of March 2010 and the forecast extends through December 2010. Each table shows an average price and a range of prices for a given DRAM product in a given half of the month. The average and range of
prices are based on a collection of the lowest contract or spot prices of each DRAM manufacturer for product delivered in that period of the month. They can exclude special deals and promotional incentives that DRAM suppliers offer from time to time to selected customers for specific and temporary strategic or tactical reasons.
Average prices may be weighted by the production shares of the different vendors.
Price forecast tables are available for the following products:
1GB - 2GB DDR2-667/800 SODIMM & UDIMMs
1GB - 4GB DDR3-1066 SODIMM & UDIMMs
1GB - 16GB DDR3-1066/1333 Registered DIMMs
1GB - 4GB DDR2-800 Fully Buffered DIMMs
1GB - 4GB DDR2-800 Registered DIMMs
1Gb DDR2-800 and 1Gb DDR3-1066/1333 SDRAMs
TheDRAMMarketAdvisor‐March2010 Page18
(c)2010DEDIOS&ASSOCIATES.Allrightsreserved.ReproducEonprohibitedwithoutpriorpermission.
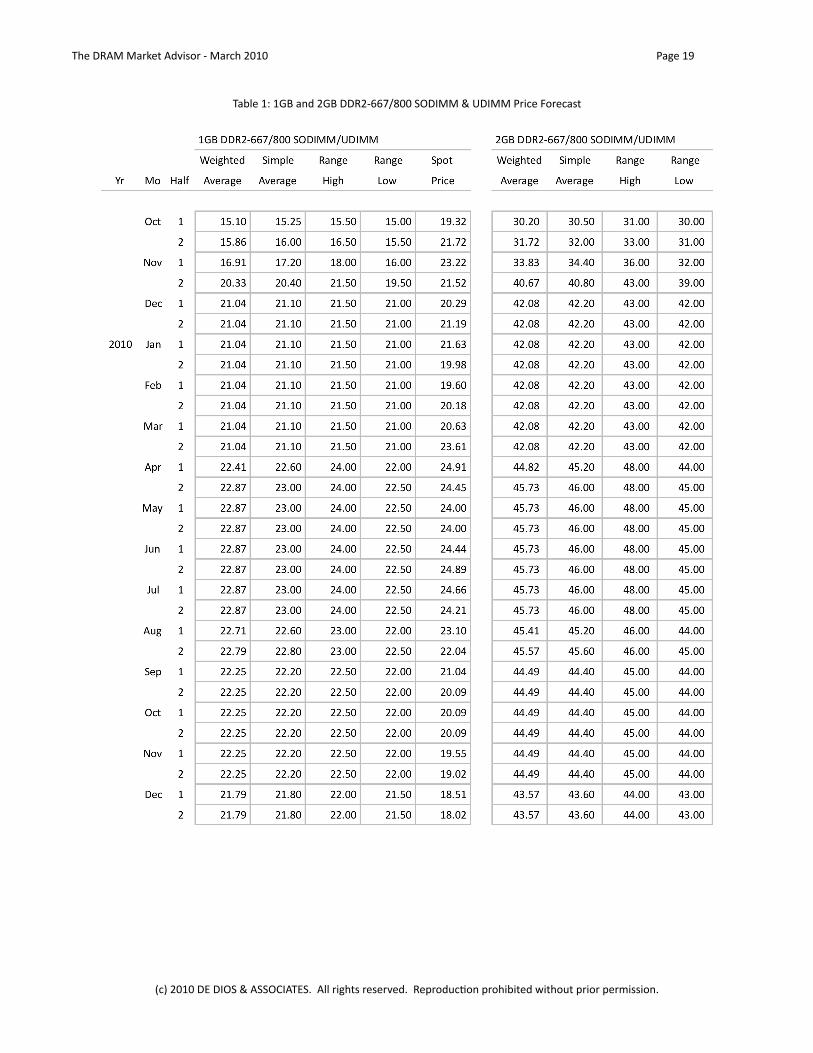
Table1:1GBand2GBDDR2‐667/800SODIMM&UDIMMPriceForecast
TheDRAMMarketAdvisor‐March2010 Page19
(c)2010DEDIOS&ASSOCIATES.Allrightsreserved.ReproducQonprohibitedwithoutpriorpermission.

Table2:1GB,2GBand4GBDDR3‐1066/1333SODIMM&UDIMMPriceForecast
TheDRAMMarketAdvisor‐March2010 Page20
(c)2010DEDIOS&ASSOCIATES.Allrightsreserved.ReproducQonprohibitedwithoutpriorpermission.
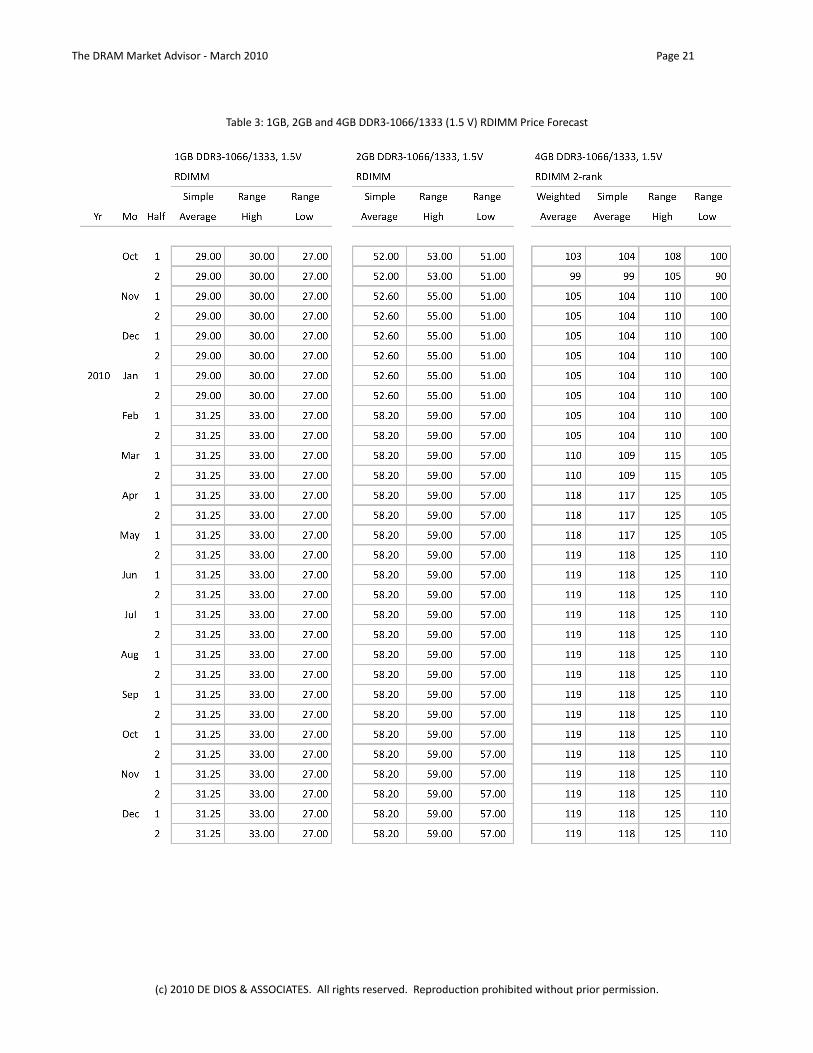
Table3:1GB,2GBand4GBDDR3‐1066/1333(1.5V)RDIMMPriceForecast
TheDRAMMarketAdvisor‐March2010 Page21
(c)2010DEDIOS&ASSOCIATES.Allrightsreserved.ReproducQonprohibitedwithoutpriorpermission.

Table4:1GB,2GBand4GBDDR3‐1066/1333(1.35V)RDIMMPriceForecast
TheDRAMMarketAdvisor‐March2010 Page22
(c)2010DEDIOS&ASSOCIATES.Allrightsreserved.ReproducQonprohibitedwithoutpriorpermission.
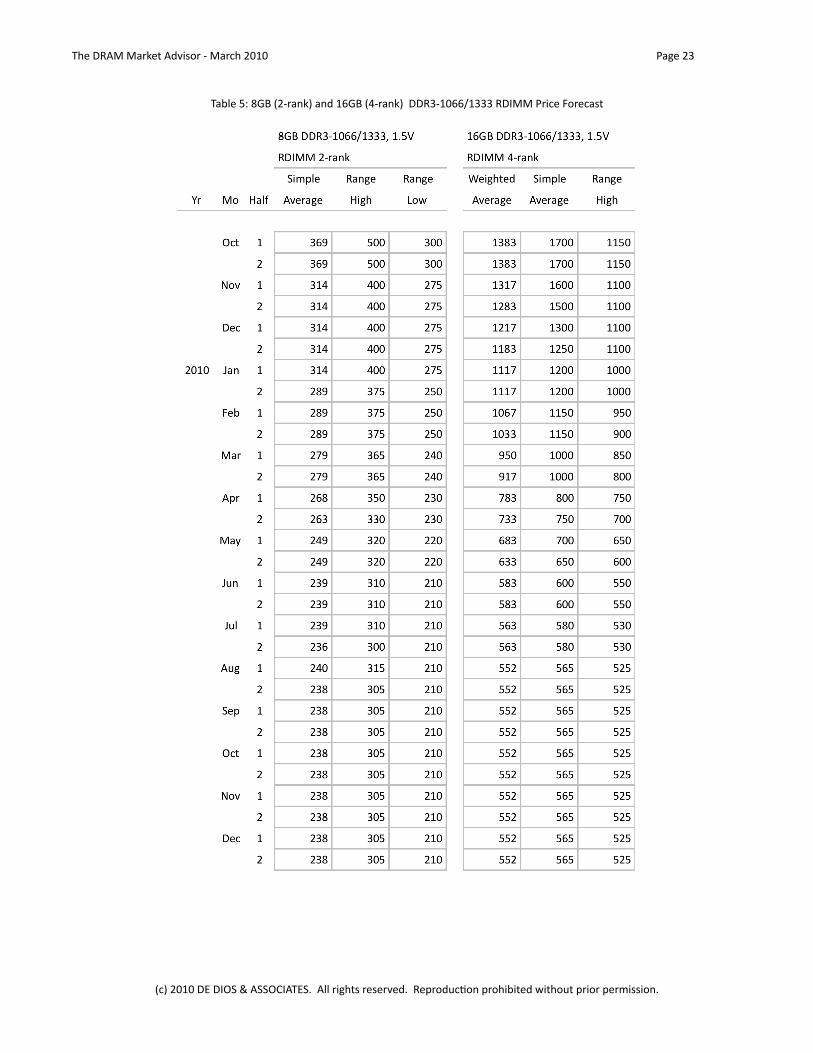
Table5:8GB(2‐rank)and16GB(4‐rank)DDR3‐1066/1333RDIMMPriceForecast
TheDRAMMarketAdvisor‐March2010 Page23
(c)2010DEDIOS&ASSOCIATES.Allrightsreserved.ReproducQonprohibitedwithoutpriorpermission.
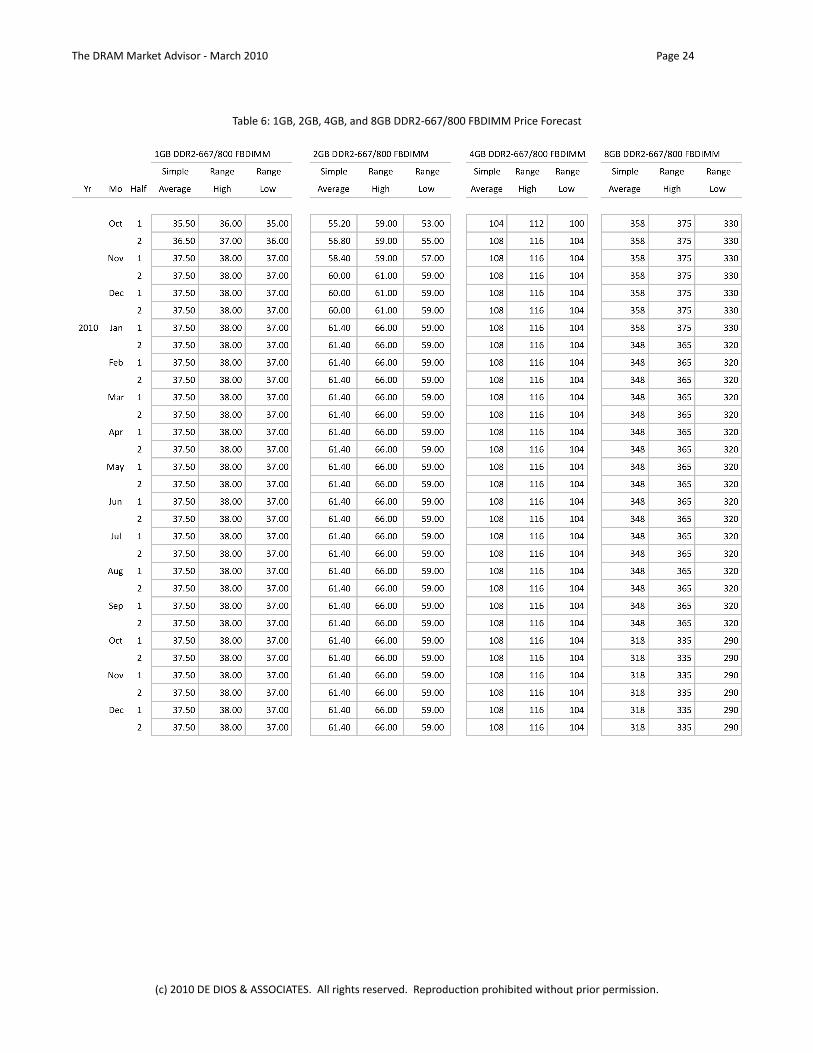
Table6:1GB,2GB,4GB,and8GBDDR2‐667/800FBDIMMPriceForecast
TheDRAMMarketAdvisor‐March2010 Page24
(c)2010DEDIOS&ASSOCIATES.Allrightsreserved.ReproducQonprohibitedwithoutpriorpermission.
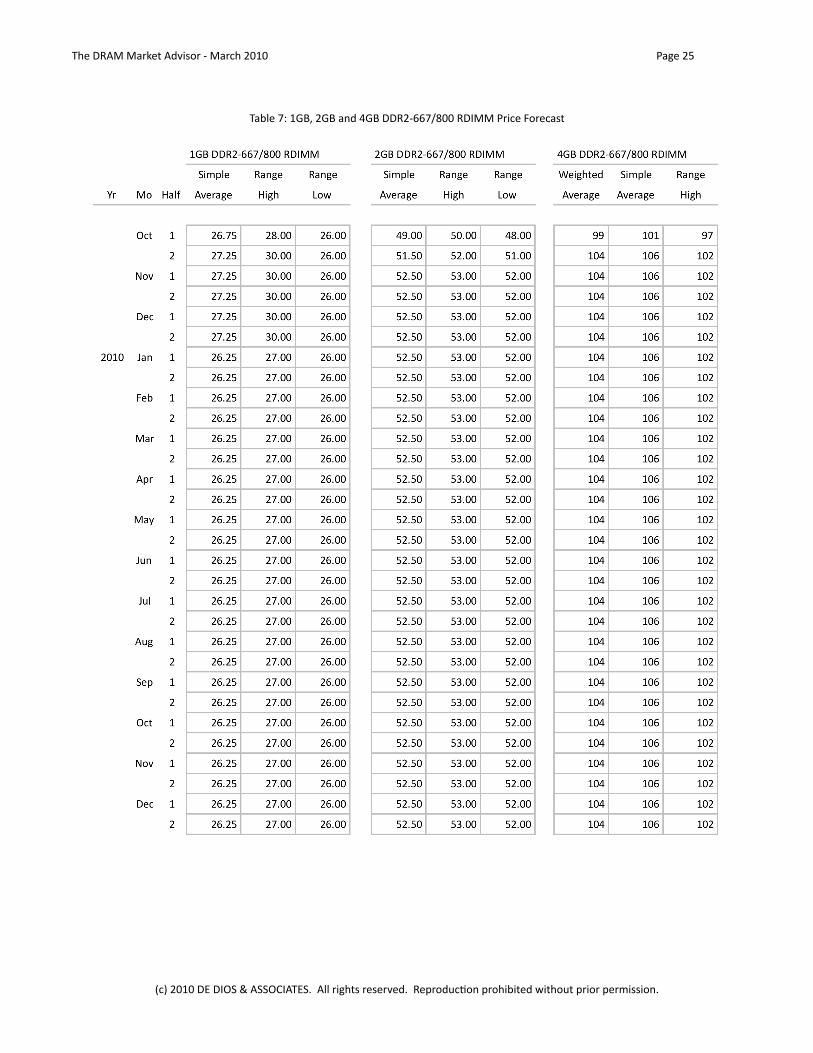
Table7:1GB,2GBand4GBDDR2‐667/800RDIMMPriceForecast
TheDRAMMarketAdvisor‐March2010 Page25
(c)2010DEDIOS&ASSOCIATES.Allrightsreserved.ReproducQonprohibitedwithoutpriorpermission.

Table8:1GbDDR2andDDR3SDRAMComponentPriceForecast
NOTE:2GbDDR3priceswillbeavailableincomingreports.
TheDRAMMarketAdvisor‐March2010 Page26
(c)2010DEDIOS&ASSOCIATES.Allrightsreserved.ReproducQonprohibitedwithoutpriorpermission.