Embed Size (px)
Citation preview
The Dow Hits All-Time Highs, But The Truth IsIt Remains Cheaply Valued
May 16, 2013by Chuck Carnevaleof F.A.S.T. Graphs
The Dow Jones industrial average sits above 15,000, an all-time high. But don’t be fooled, this doesn’tmean that stocks are expensive. I understand that it seems logical to assume that if the Dow Jonesindustrial average, what many believe to be the bellwether index of the stock market, is at an all-timehigh, then it must simultaneously be overvalued. Herein is the danger of relying on headlines andsimple statistics.
This article intends to demonstrate that more than one third of the 30 Dow stocks (11) areundervalued, another 6 are fairly valued, another 6 fully valued, but not overly so, and finally, only 7that could rightfully be classified as overvalued. In other words, the Dow Jones industrial average israther cheap, even though it sits near an all-time high.
Page 1, ©2018 Advisor Perspectives, Inc. All rights reserved.
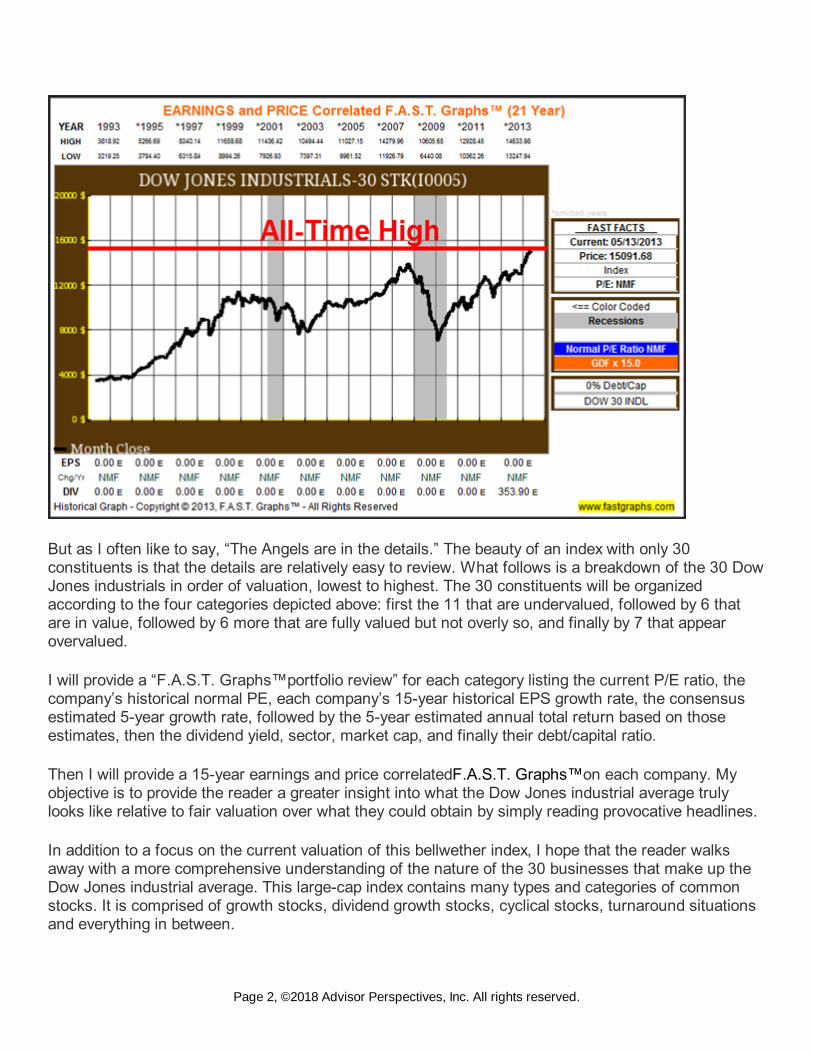
But as I often like to say, “The Angels are in the details.” The beauty of an index with only 30constituents is that the details are relatively easy to review. What follows is a breakdown of the 30 DowJones industrials in order of valuation, lowest to highest. The 30 constituents will be organizedaccording to the four categories depicted above: first the 11 that are undervalued, followed by 6 thatare in value, followed by 6 more that are fully valued but not overly so, and finally by 7 that appearovervalued.
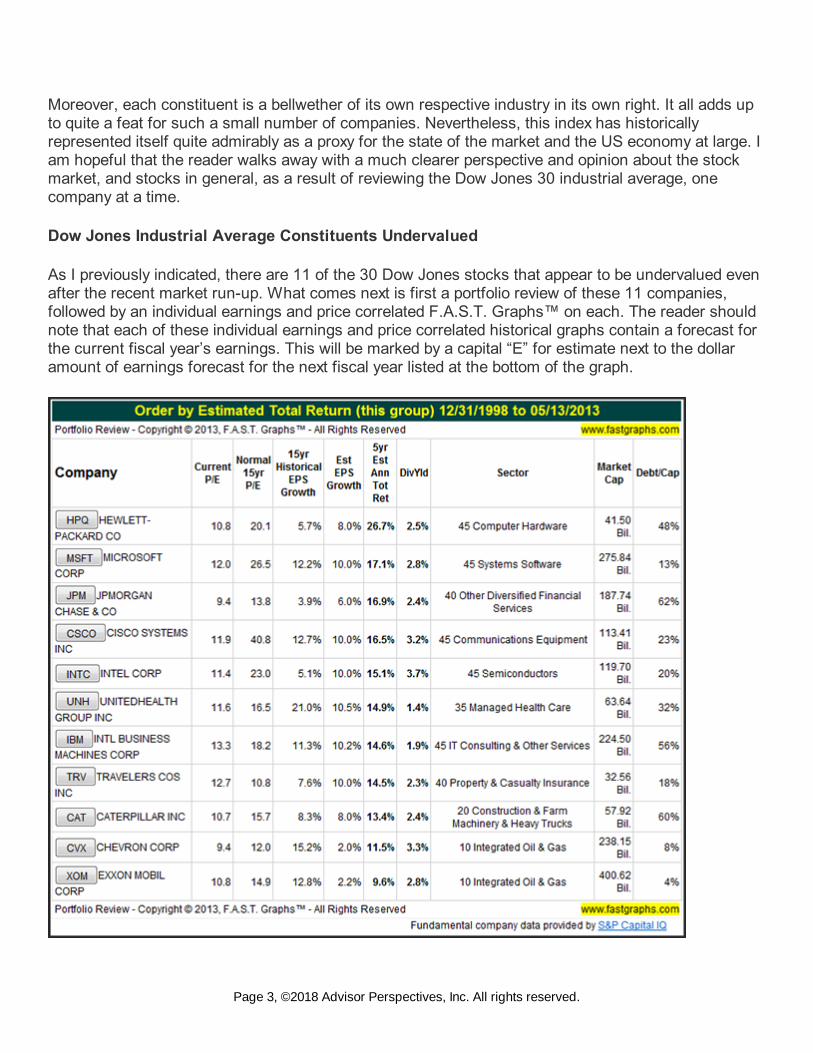
I will provide a “F.A.S.T. Graphs™portfolio review” for each category listing the current P/E ratio, thecompany’s historical normal PE, each company’s 15-year historical EPS growth rate, the consensusestimated 5-year growth rate, followed by the 5-year estimated annual total return based on thoseestimates, then the dividend yield, sector, market cap, and finally their debt/capital ratio.
Then I will provide a 15-year earnings and price correlatedF.A.S.T. Graphs™on each company. Myobjective is to provide the reader a greater insight into what the Dow Jones industrial average trulylooks like relative to fair valuation over what they could obtain by simply reading provocative headlines.
In addition to a focus on the current valuation of this bellwether index, I hope that the reader walksaway with a more comprehensive understanding of the nature of the 30 businesses that make up theDow Jones industrial average. This large-cap index contains many types and categories of commonstocks. It is comprised of growth stocks, dividend growth stocks, cyclical stocks, turnaround situationsand everything in between.
Page 2, ©2018 Advisor Perspectives, Inc. All rights reserved.
Moreover, each constituent is a bellwether of its own respective industry in its own right. It all adds upto quite a feat for such a small number of companies. Nevertheless, this index has historicallyrepresented itself quite admirably as a proxy for the state of the market and the US economy at large. Iam hopeful that the reader walks away with a much clearer perspective and opinion about the stockmarket, and stocks in general, as a result of reviewing the Dow Jones 30 industrial average, onecompany at a time.
Dow Jones Industrial Average Constituents Undervalued
As I previously indicated, there are 11 of the 30 Dow Jones stocks that appear to be undervalued evenafter the recent market run-up. What comes next is first a portfolio review of these 11 companies,followed by an individual earnings and price correlated F.A.S.T. Graphs™ on each. The reader shouldnote that each of these individual earnings and price correlated historical graphs contain a forecast forthe current fiscal year’s earnings. This will be marked by a capital “E” for estimate next to the dollaramount of earnings forecast for the next fiscal year listed at the bottom of the graph.
Page 3, ©2018 Advisor Perspectives, Inc. All rights reserved.
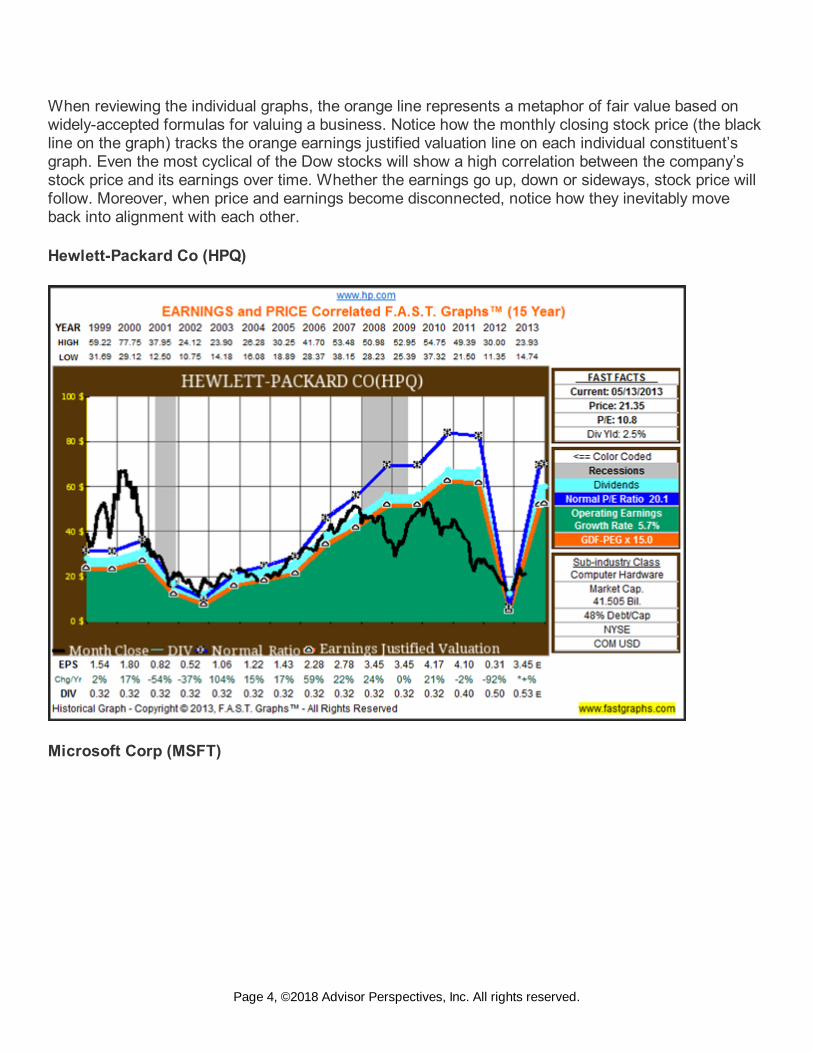
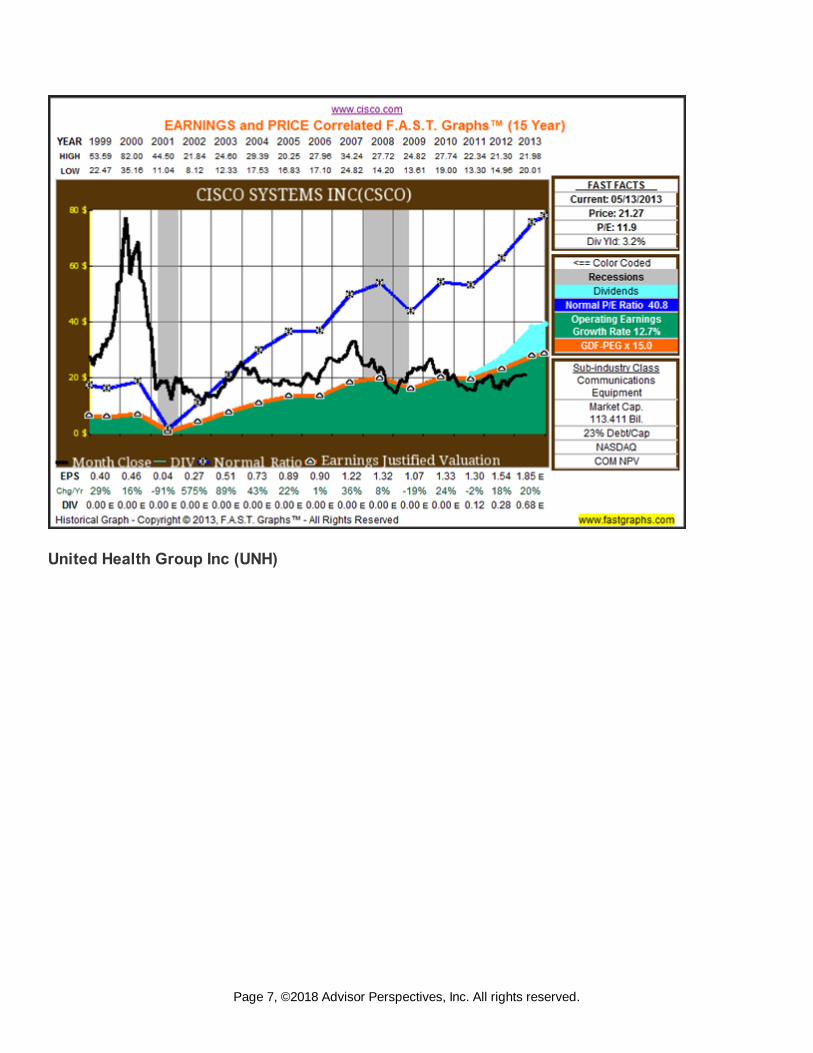
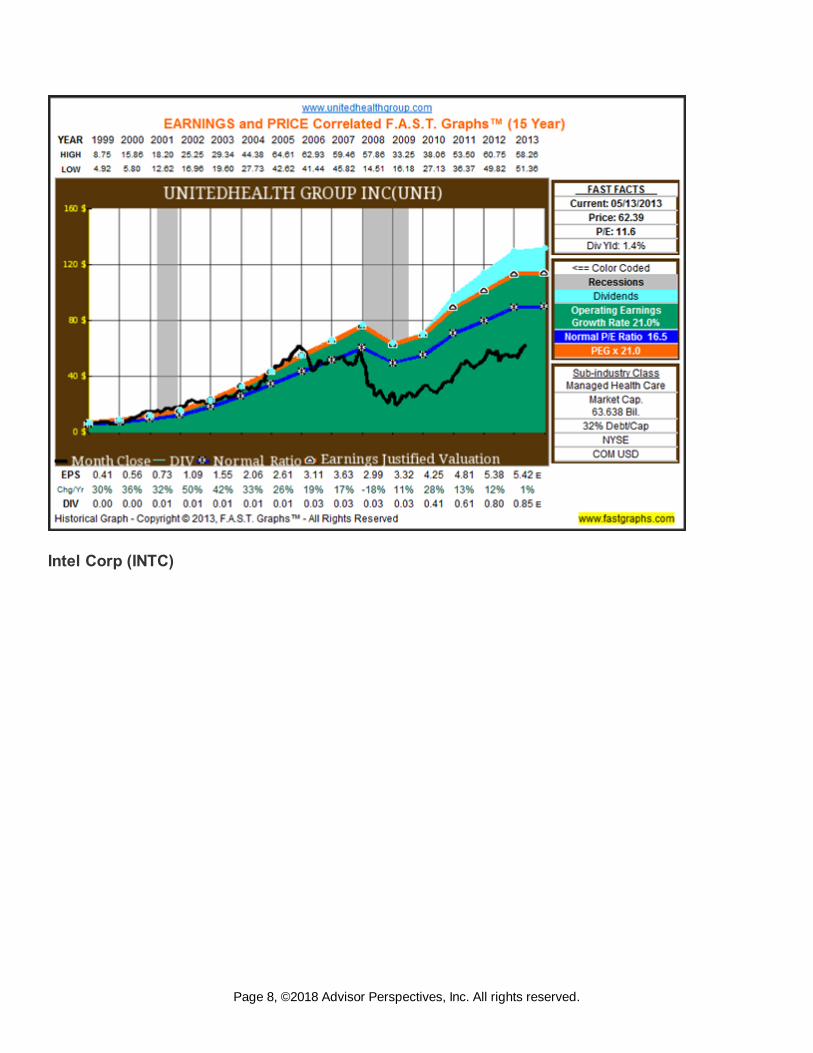
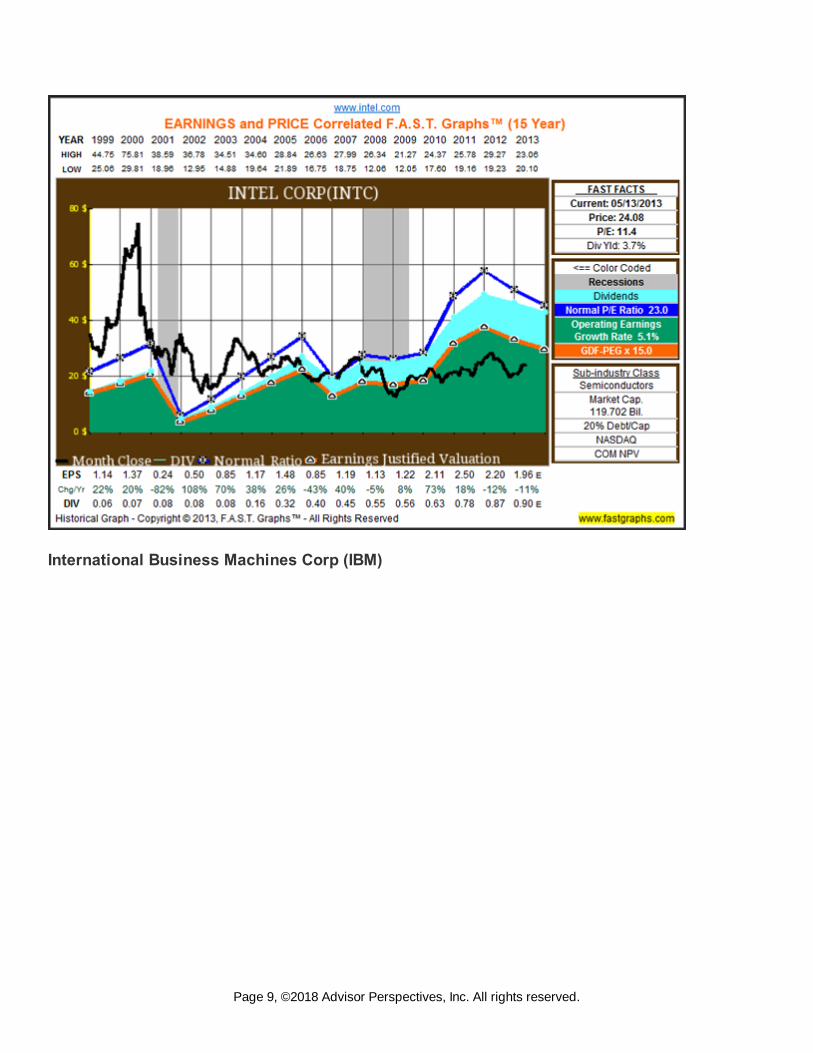
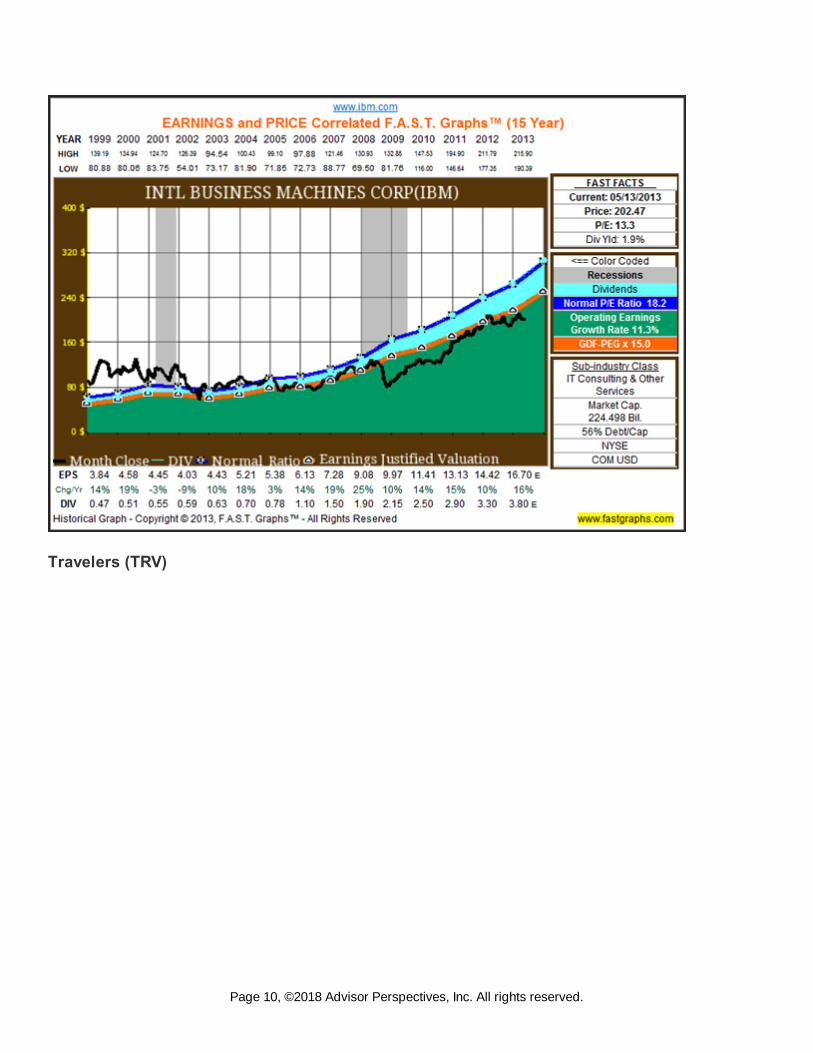
When reviewing the individual graphs, the orange line represents a metaphor of fair value based onwidely-accepted formulas for valuing a business. Notice how the monthly closing stock price (the blackline on the graph) tracks the orange earnings justified valuation line on each individual constituent’sgraph. Even the most cyclical of the Dow stocks will show a high correlation between the company’sstock price and its earnings over time. Whether the earnings go up, down or sideways, stock price willfollow. Moreover, when price and earnings become disconnected, notice how they inevitably moveback into alignment with each other.
Hewlett-Packard Co (HPQ)
Microsoft Corp (MSFT)
Page 4, ©2018 Advisor Perspectives, Inc. All rights reserved.
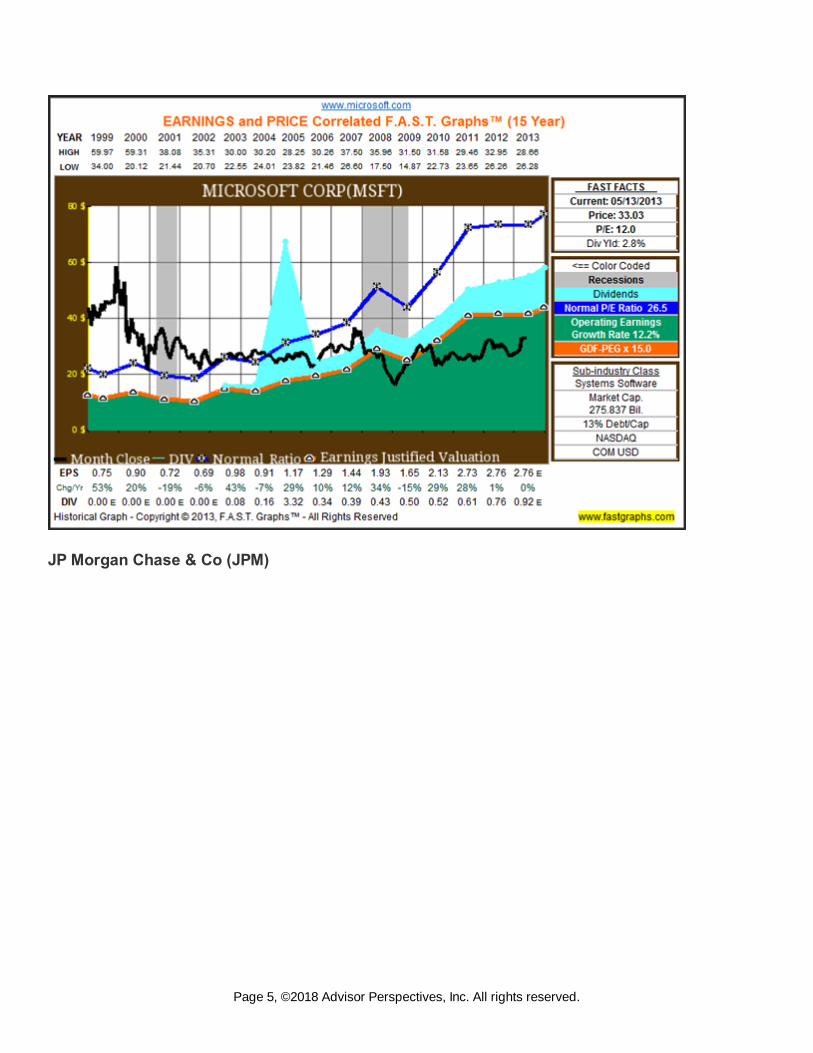
JP Morgan Chase & Co (JPM)
Page 5, ©2018 Advisor Perspectives, Inc. All rights reserved.

Cisco Systems Inc (CSCO)
Page 6, ©2018 Advisor Perspectives, Inc. All rights reserved.
United Health Group Inc (UNH)
Page 7, ©2018 Advisor Perspectives, Inc. All rights reserved.
Intel Corp (INTC)
Page 8, ©2018 Advisor Perspectives, Inc. All rights reserved.
International Business Machines Corp (IBM)
Page 9, ©2018 Advisor Perspectives, Inc. All rights reserved.
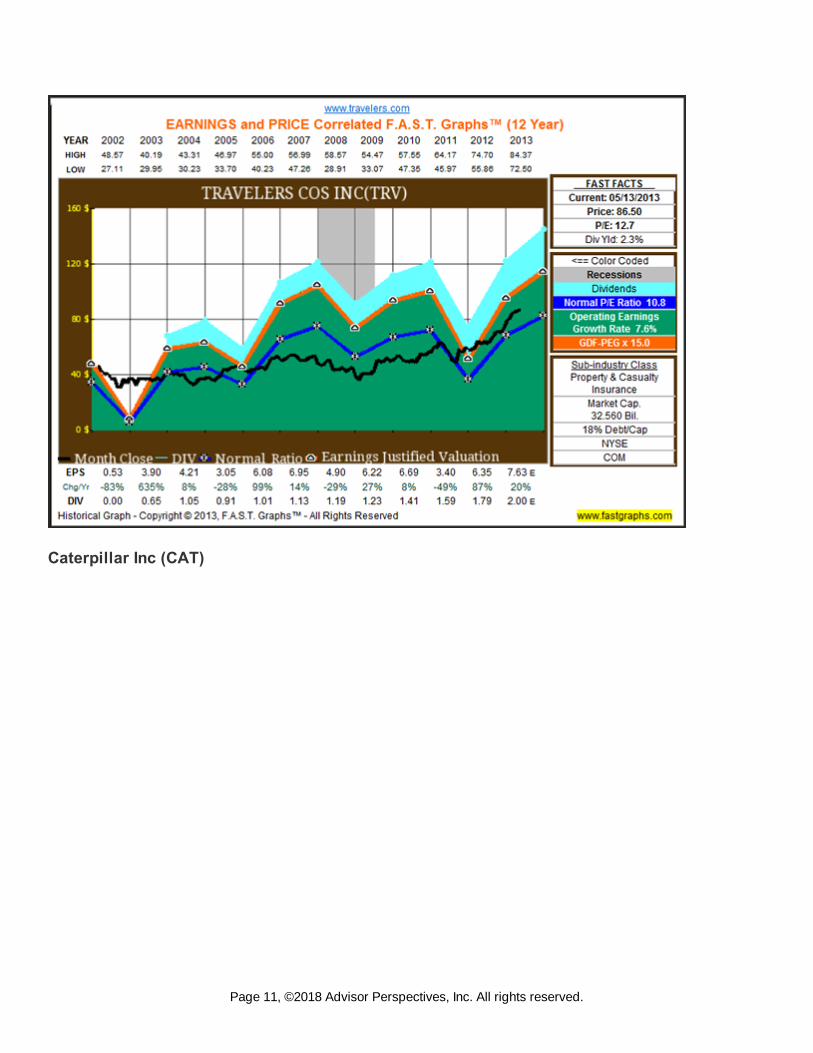
Travelers (TRV)
Page 10, ©2018 Advisor Perspectives, Inc. All rights reserved.
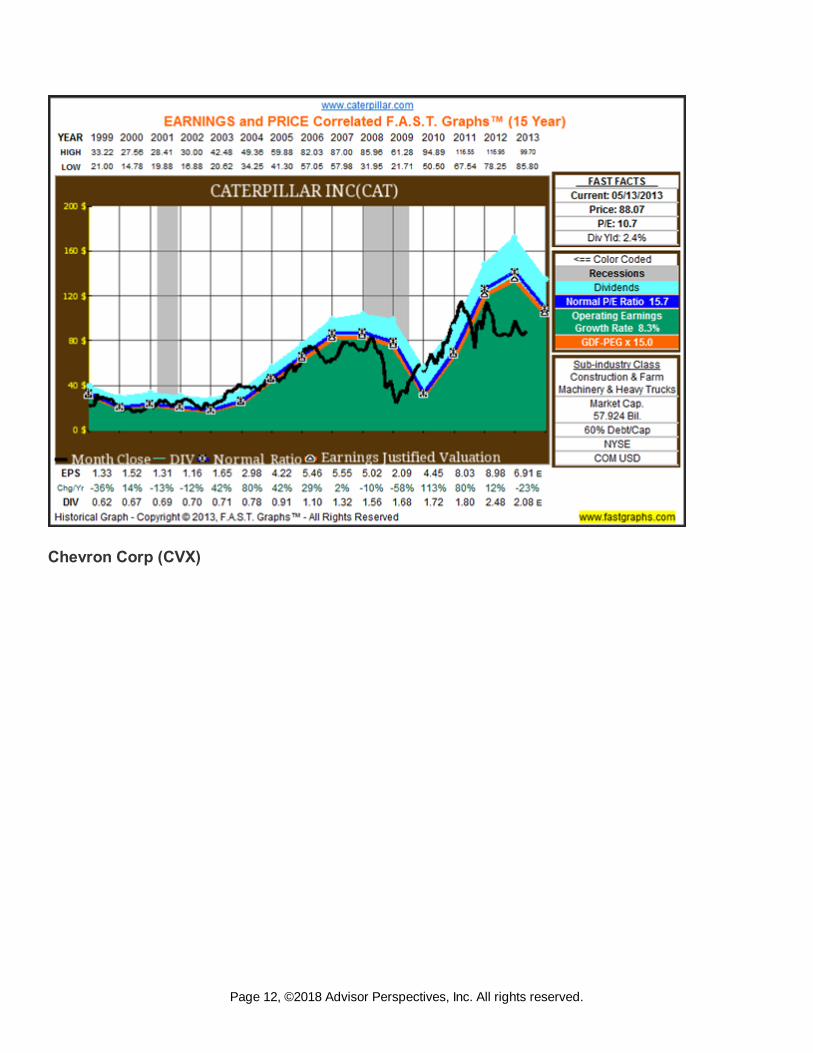
Caterpillar Inc (CAT)
Page 11, ©2018 Advisor Perspectives, Inc. All rights reserved.
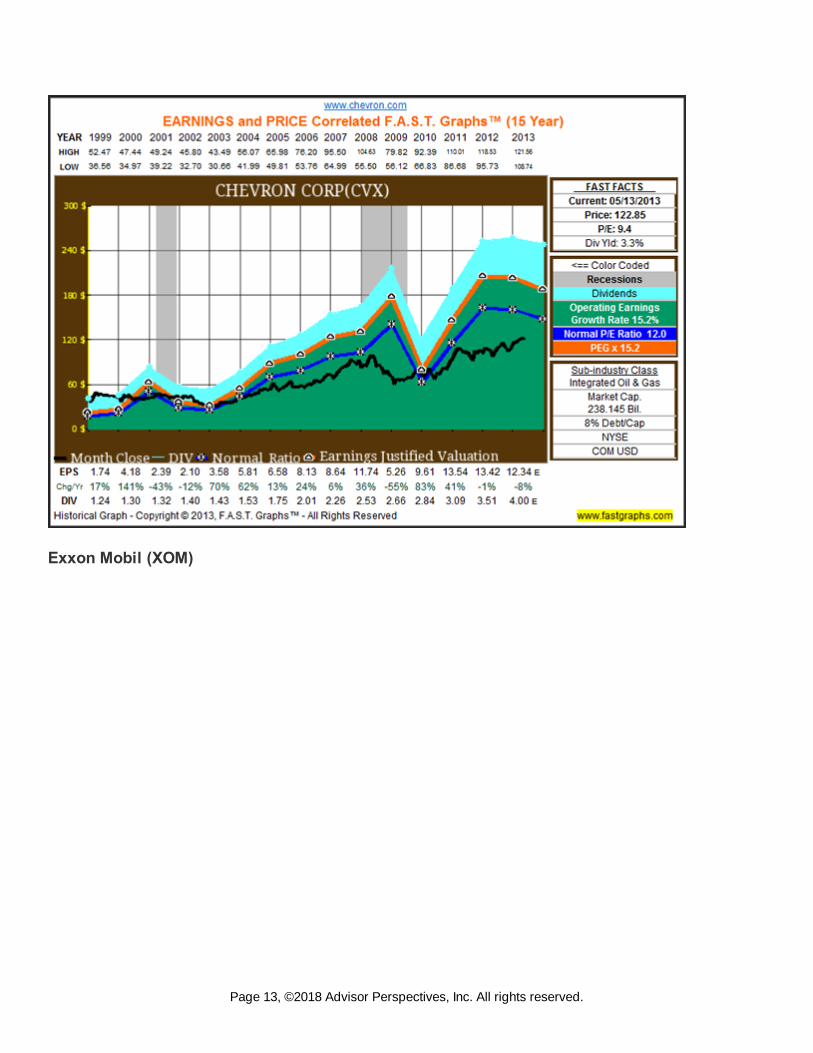
Chevron Corp (CVX)
Page 12, ©2018 Advisor Perspectives, Inc. All rights reserved.
Exxon Mobil (XOM)
Page 13, ©2018 Advisor Perspectives, Inc. All rights reserved.
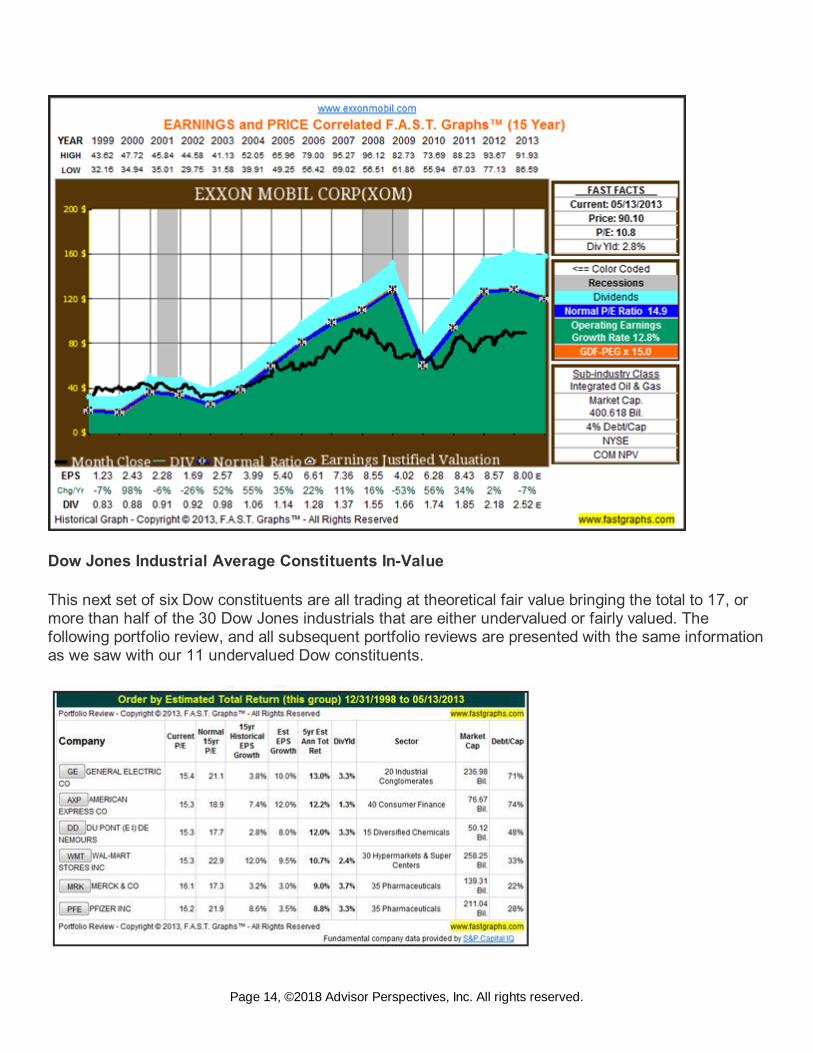
Dow Jones Industrial Average Constituents In-Value
This next set of six Dow constituents are all trading at theoretical fair value bringing the total to 17, ormore than half of the 30 Dow Jones industrials that are either undervalued or fairly valued. Thefollowing portfolio review, and all subsequent portfolio reviews are presented with the same informationas we saw with our 11 undervalued Dow constituents.
Page 14, ©2018 Advisor Perspectives, Inc. All rights reserved.
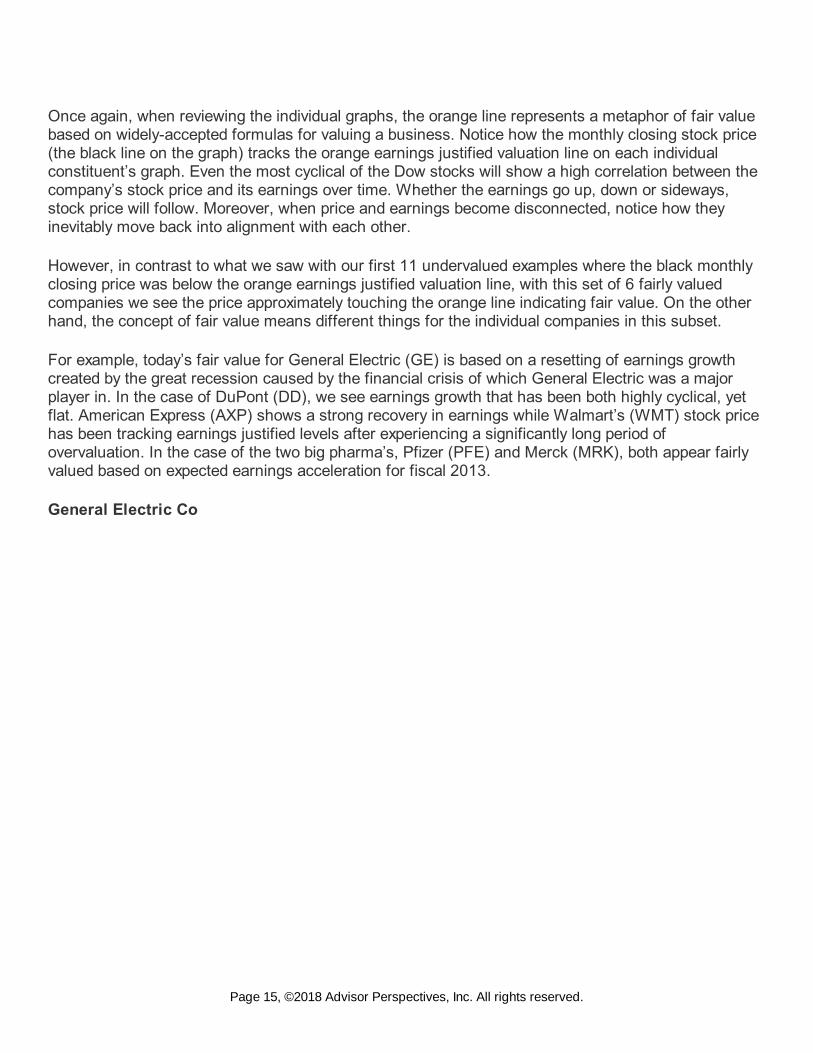
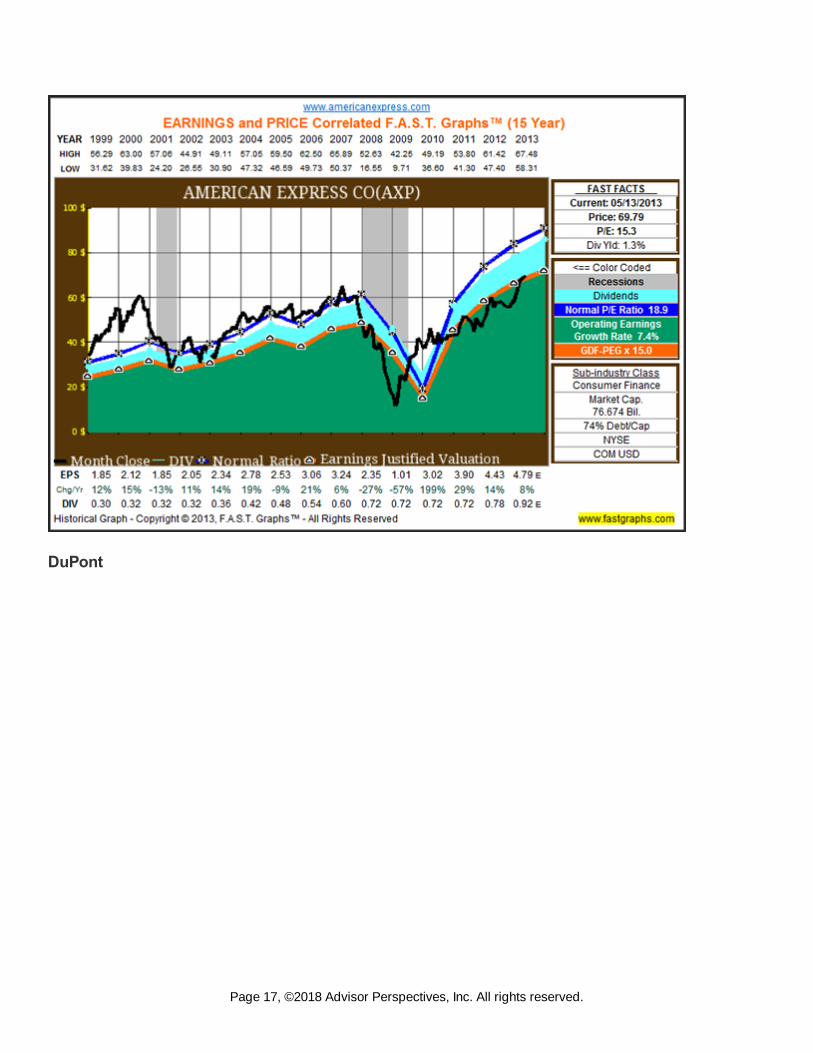
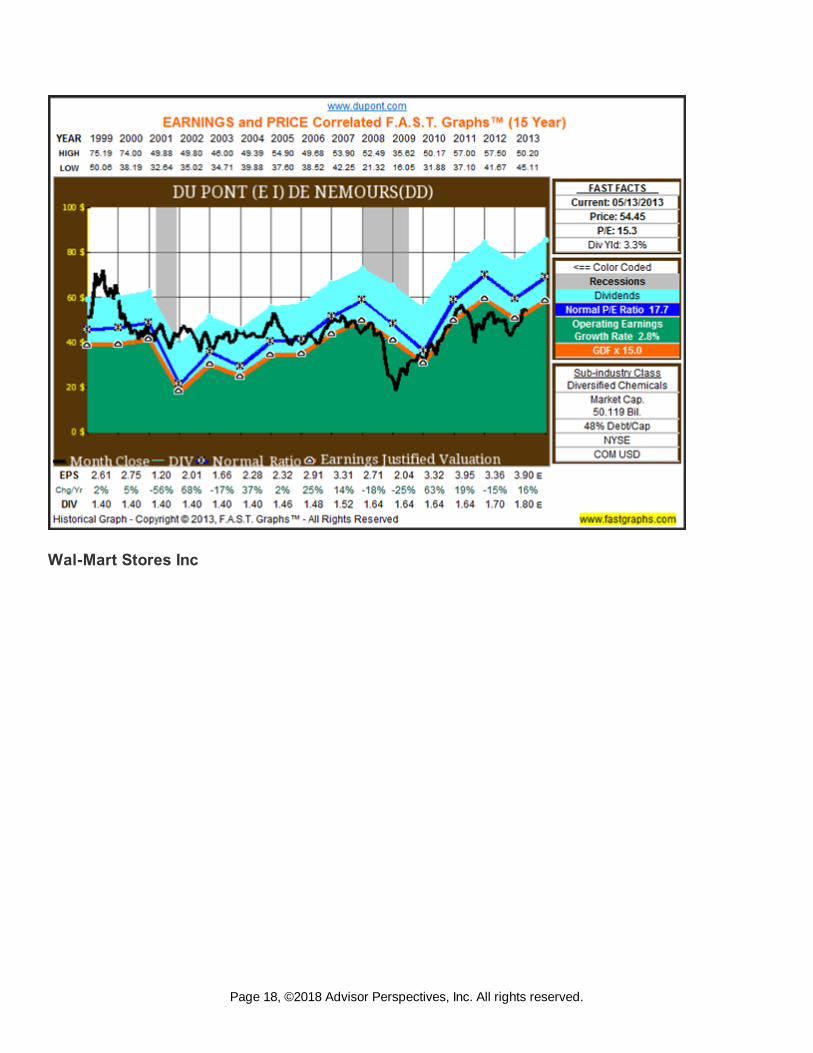
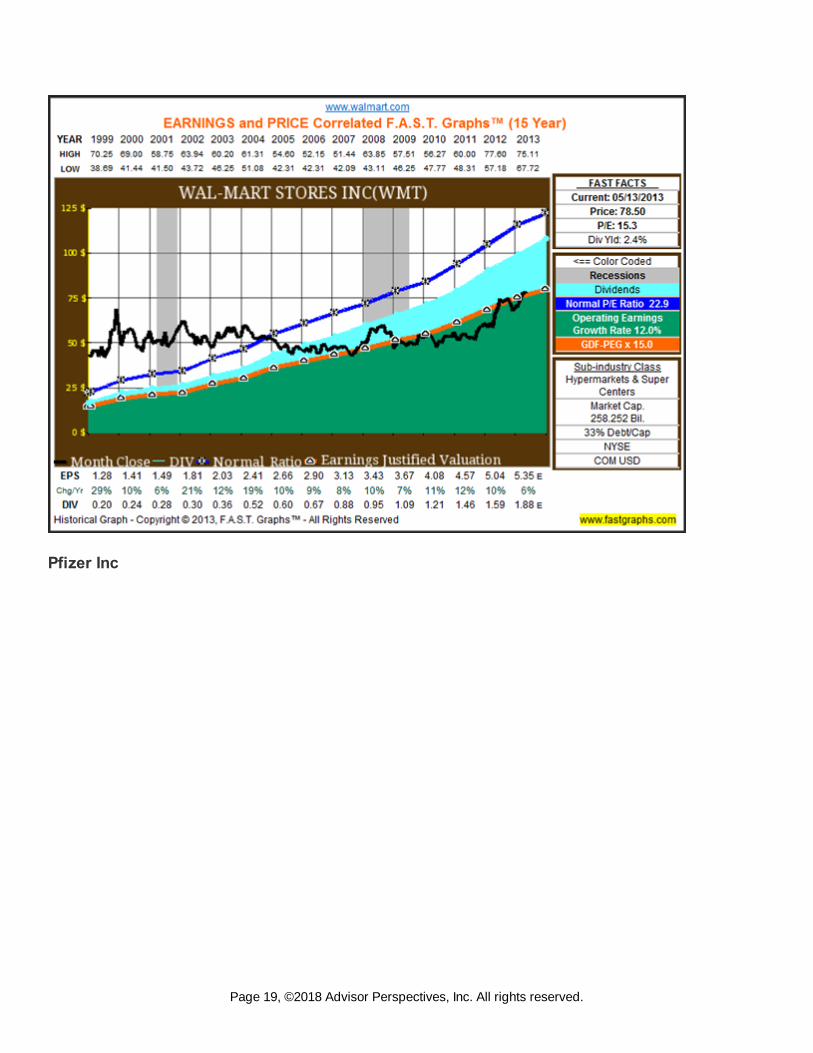
Once again, when reviewing the individual graphs, the orange line represents a metaphor of fair valuebased on widely-accepted formulas for valuing a business. Notice how the monthly closing stock price(the black line on the graph) tracks the orange earnings justified valuation line on each individualconstituent’s graph. Even the most cyclical of the Dow stocks will show a high correlation between thecompany’s stock price and its earnings over time. Whether the earnings go up, down or sideways,stock price will follow. Moreover, when price and earnings become disconnected, notice how theyinevitably move back into alignment with each other.
However, in contrast to what we saw with our first 11 undervalued examples where the black monthlyclosing price was below the orange earnings justified valuation line, with this set of 6 fairly valuedcompanies we see the price approximately touching the orange line indicating fair value. On the otherhand, the concept of fair value means different things for the individual companies in this subset.
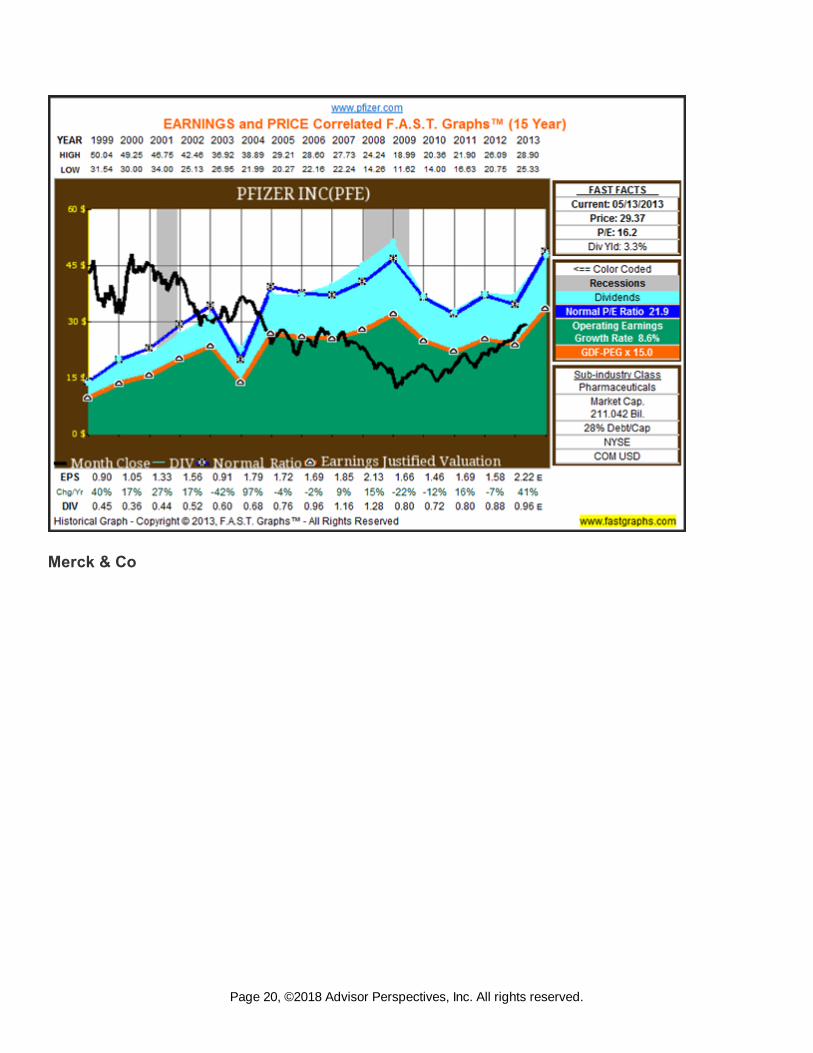
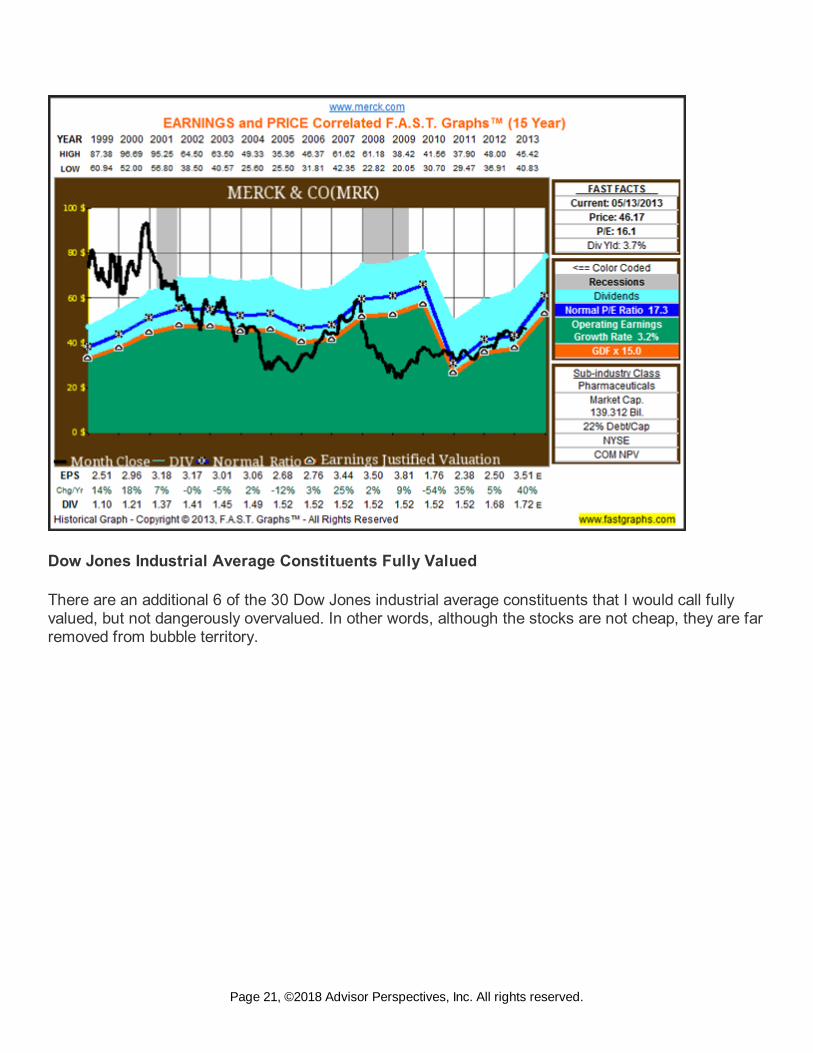
For example, today’s fair value for General Electric (GE) is based on a resetting of earnings growthcreated by the great recession caused by the financial crisis of which General Electric was a majorplayer in. In the case of DuPont (DD), we see earnings growth that has been both highly cyclical, yetflat. American Express (AXP) shows a strong recovery in earnings while Walmart’s (WMT) stock pricehas been tracking earnings justified levels after experiencing a significantly long period ofovervaluation. In the case of the two big pharma’s, Pfizer (PFE) and Merck (MRK), both appear fairlyvalued based on expected earnings acceleration for fiscal 2013.
General Electric Co
Page 15, ©2018 Advisor Perspectives, Inc. All rights reserved.

American Express Co
Page 16, ©2018 Advisor Perspectives, Inc. All rights reserved.
DuPont
Page 17, ©2018 Advisor Perspectives, Inc. All rights reserved.
Wal-Mart Stores Inc
Page 18, ©2018 Advisor Perspectives, Inc. All rights reserved.
Pfizer Inc
Page 19, ©2018 Advisor Perspectives, Inc. All rights reserved.
Merck & Co
Page 20, ©2018 Advisor Perspectives, Inc. All rights reserved.
Dow Jones Industrial Average Constituents Fully Valued
There are an additional 6 of the 30 Dow Jones industrial average constituents that I would call fullyvalued, but not dangerously overvalued. In other words, although the stocks are not cheap, they are farremoved from bubble territory.
Page 21, ©2018 Advisor Perspectives, Inc. All rights reserved.
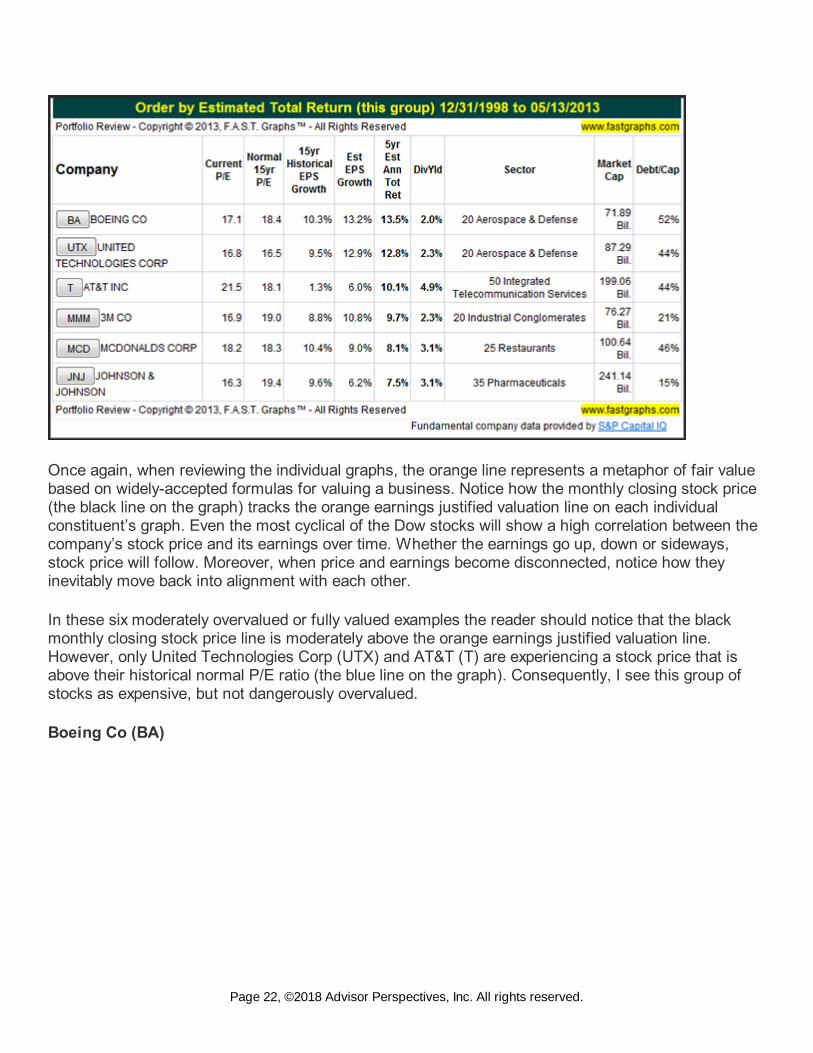
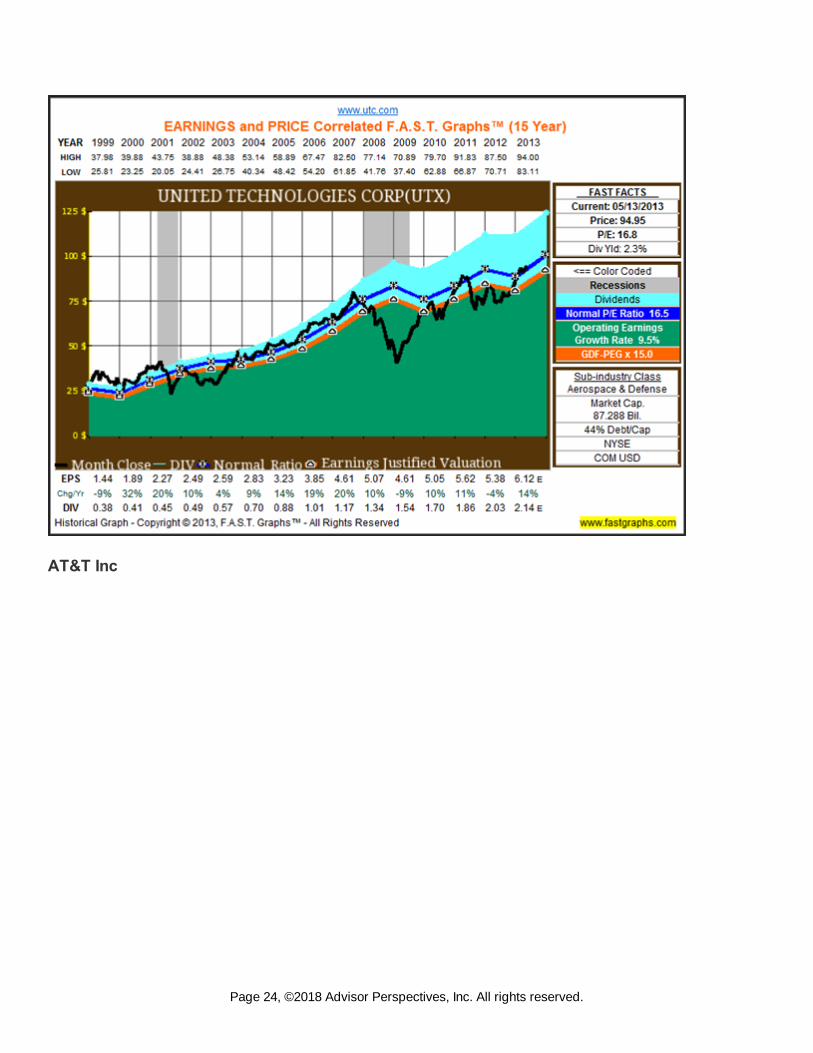
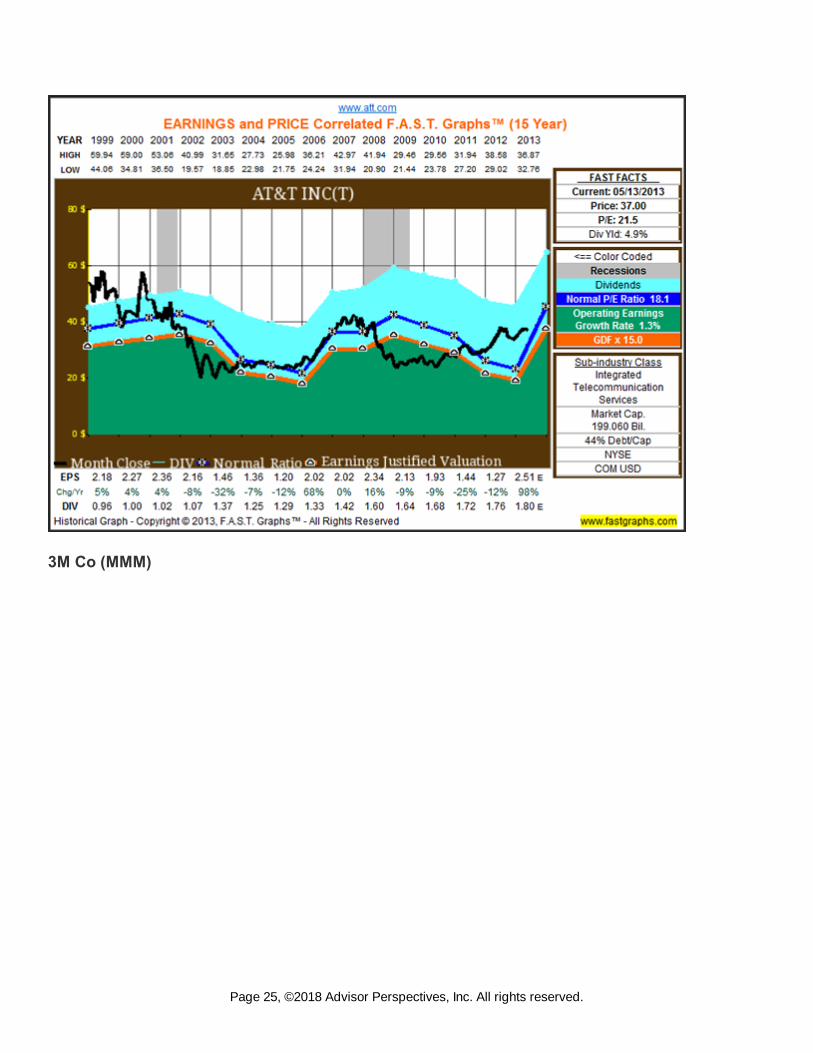
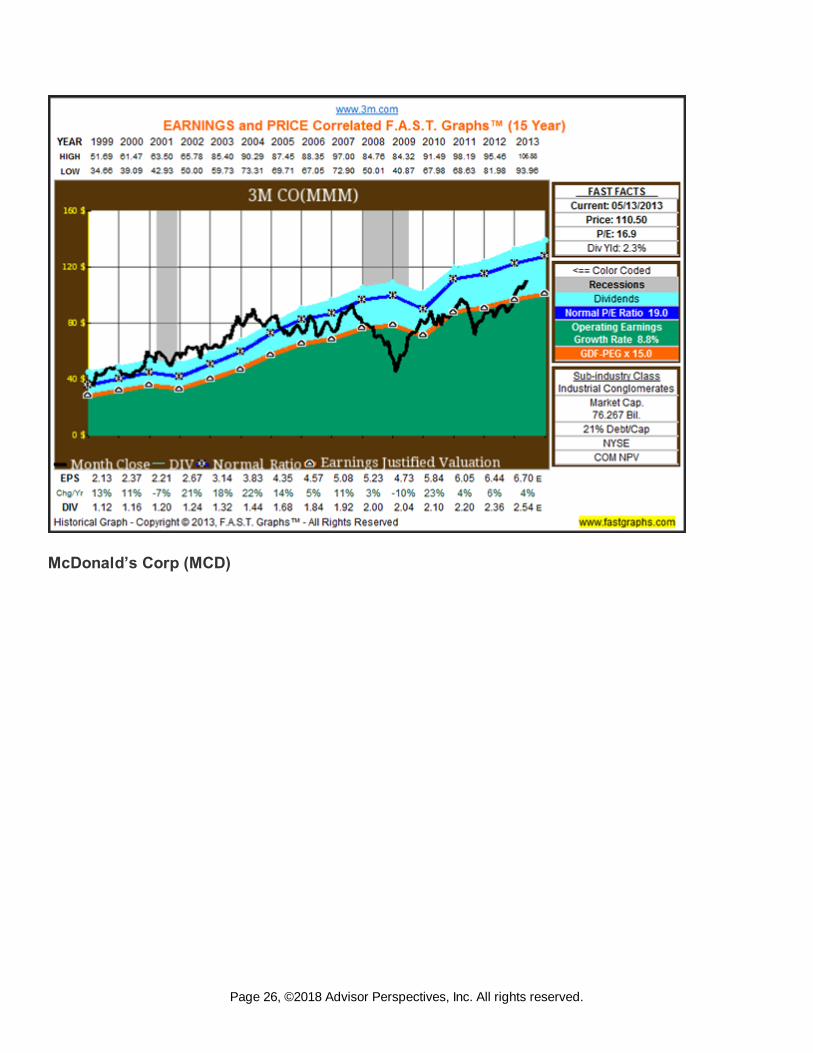
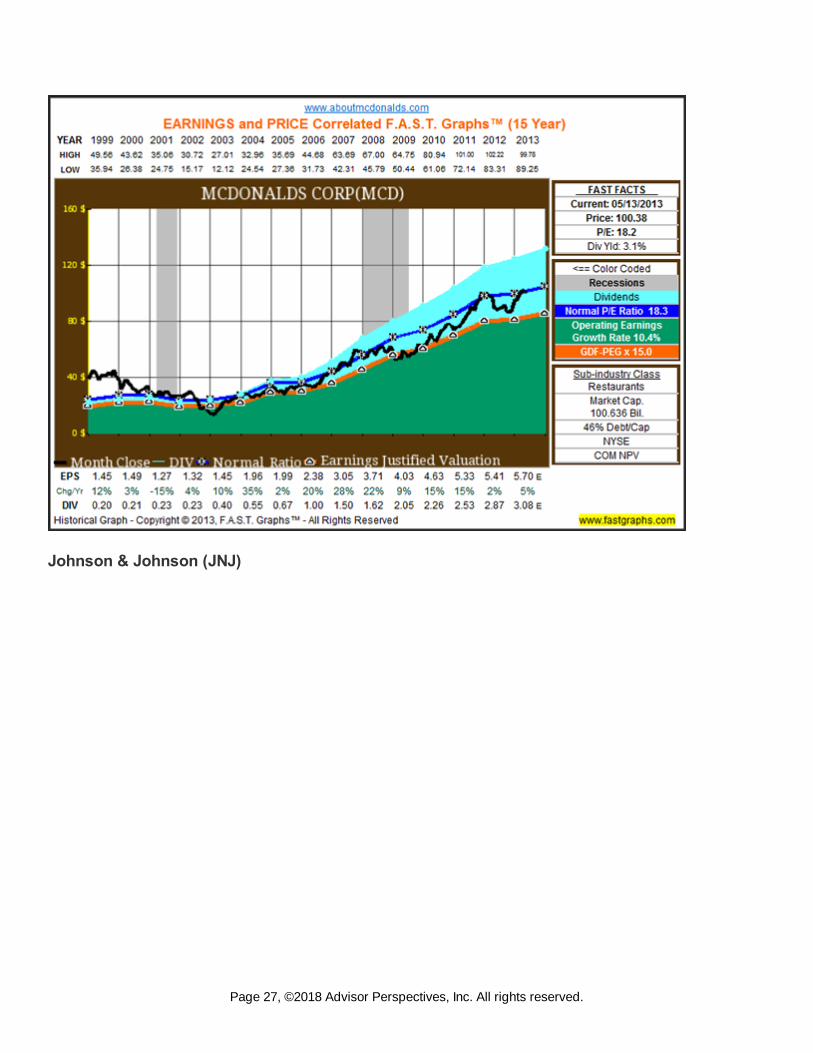
Once again, when reviewing the individual graphs, the orange line represents a metaphor of fair valuebased on widely-accepted formulas for valuing a business. Notice how the monthly closing stock price(the black line on the graph) tracks the orange earnings justified valuation line on each individualconstituent’s graph. Even the most cyclical of the Dow stocks will show a high correlation between thecompany’s stock price and its earnings over time. Whether the earnings go up, down or sideways,stock price will follow. Moreover, when price and earnings become disconnected, notice how theyinevitably move back into alignment with each other.
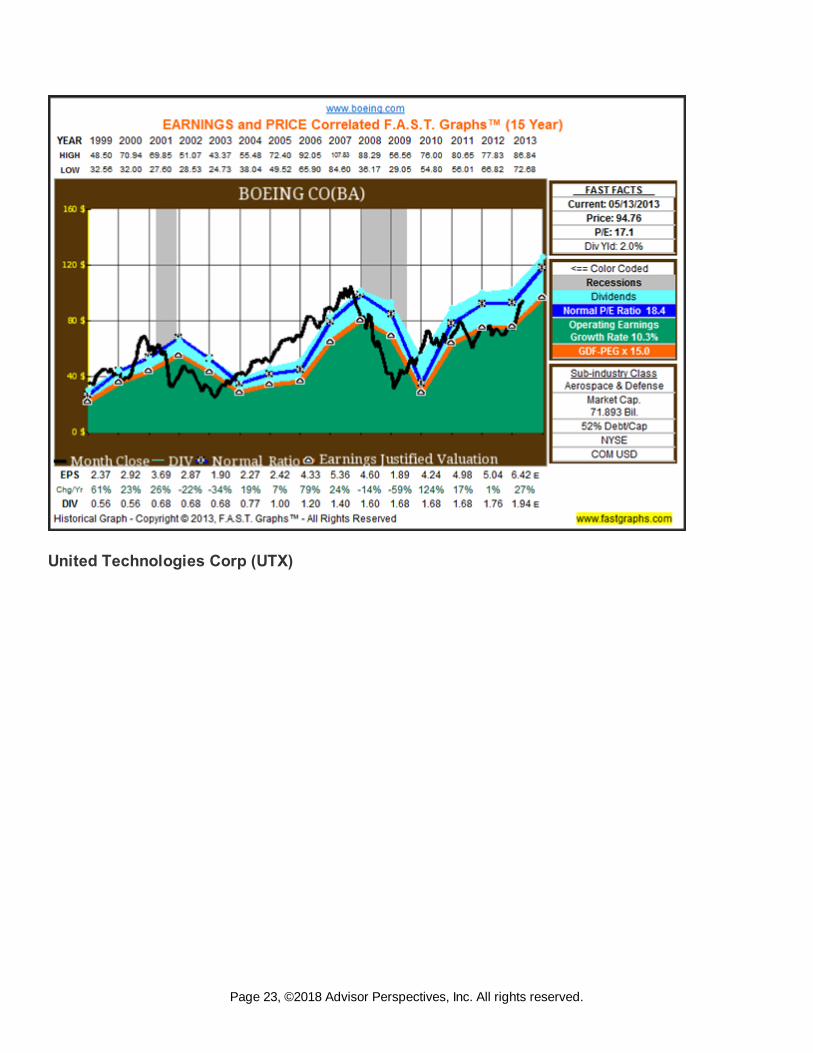
In these six moderately overvalued or fully valued examples the reader should notice that the blackmonthly closing stock price line is moderately above the orange earnings justified valuation line.However, only United Technologies Corp (UTX) and AT&T (T) are experiencing a stock price that isabove their historical normal P/E ratio (the blue line on the graph). Consequently, I see this group ofstocks as expensive, but not dangerously overvalued.
Boeing Co (BA)
Page 22, ©2018 Advisor Perspectives, Inc. All rights reserved.
United Technologies Corp (UTX)
Page 23, ©2018 Advisor Perspectives, Inc. All rights reserved.
AT&T Inc
Page 24, ©2018 Advisor Perspectives, Inc. All rights reserved.
3M Co (MMM)
Page 25, ©2018 Advisor Perspectives, Inc. All rights reserved.
McDonald’s Corp (MCD)
Page 26, ©2018 Advisor Perspectives, Inc. All rights reserved.
Johnson & Johnson (JNJ)
Page 27, ©2018 Advisor Perspectives, Inc. All rights reserved.
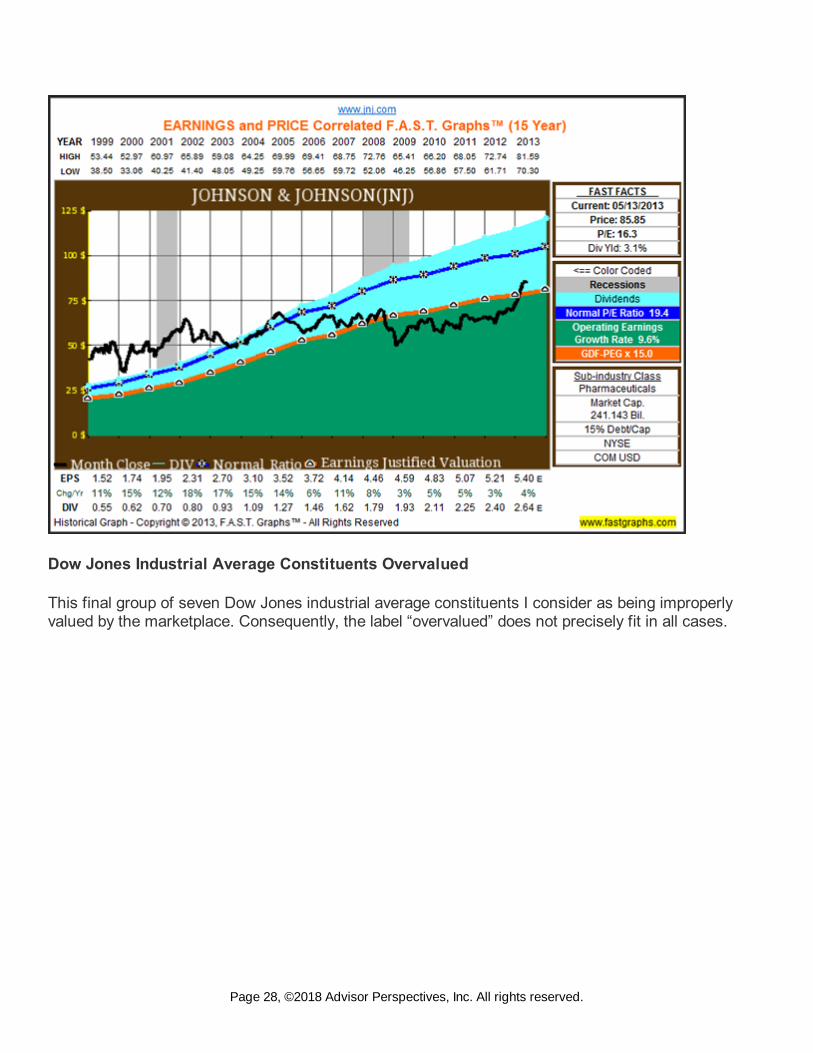
Dow Jones Industrial Average Constituents Overvalued
This final group of seven Dow Jones industrial average constituents I consider as being improperlyvalued by the marketplace. Consequently, the label “overvalued” does not precisely fit in all cases.
Page 28, ©2018 Advisor Perspectives, Inc. All rights reserved.
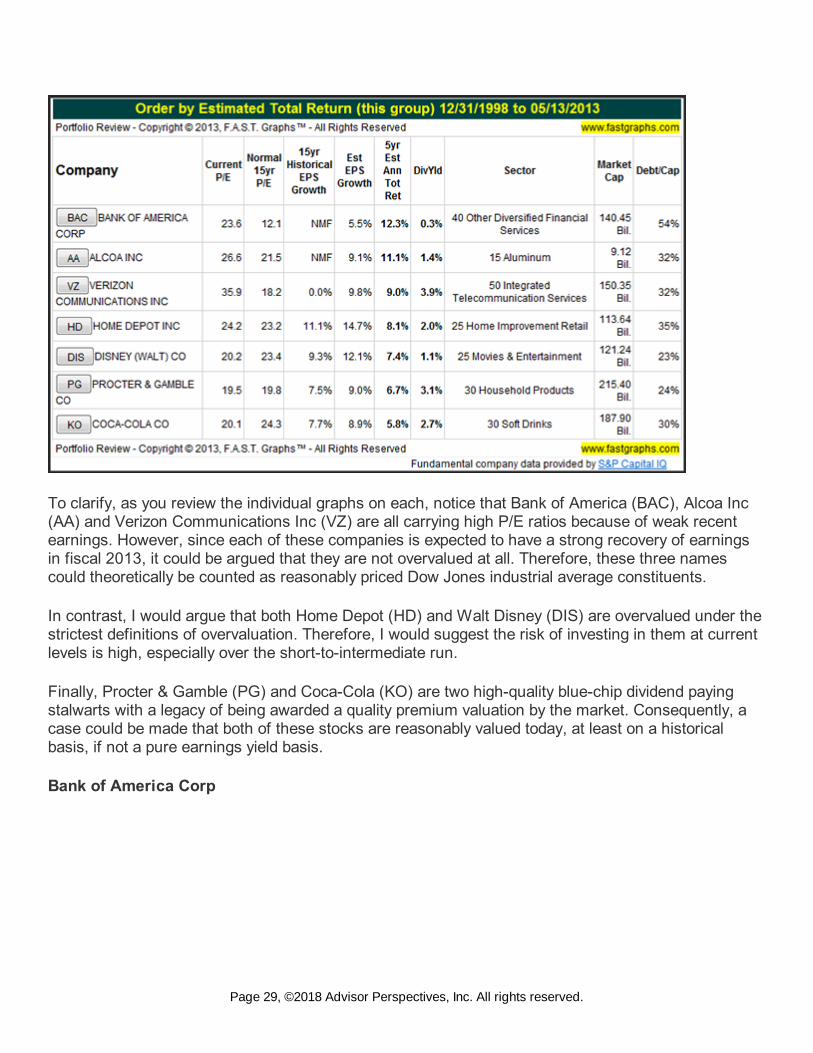
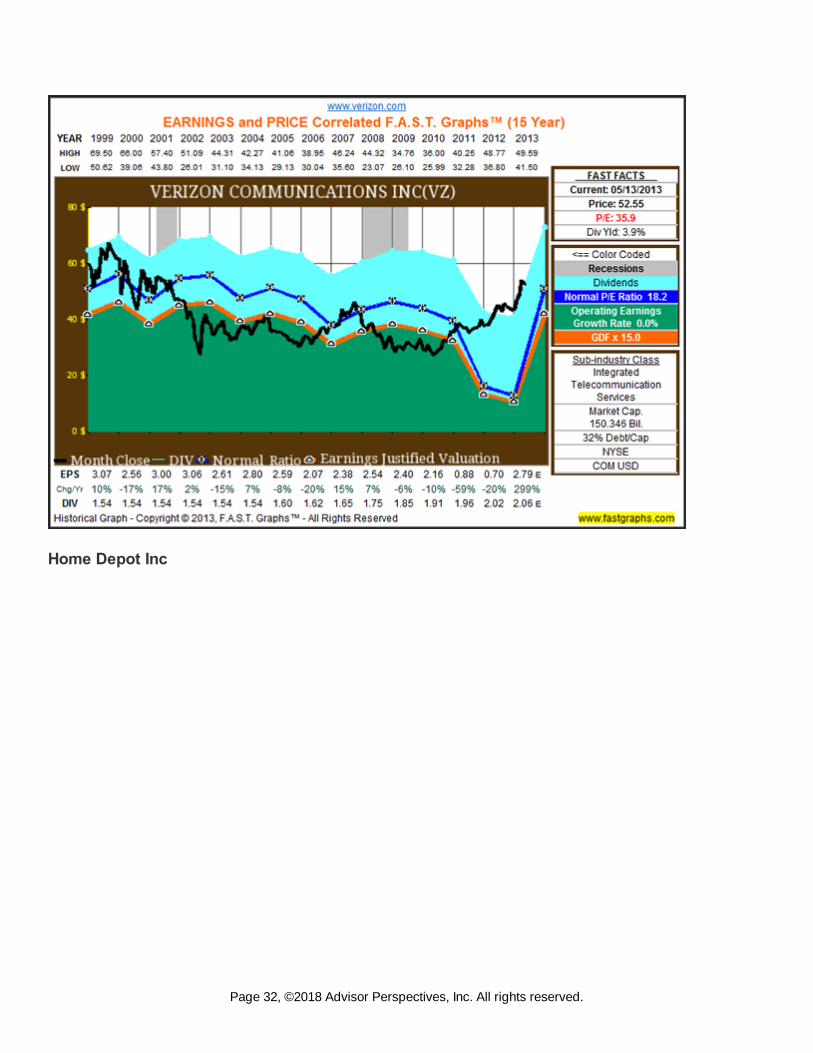
To clarify, as you review the individual graphs on each, notice that Bank of America (BAC), Alcoa Inc(AA) and Verizon Communications Inc (VZ) are all carrying high P/E ratios because of weak recentearnings. However, since each of these companies is expected to have a strong recovery of earningsin fiscal 2013, it could be argued that they are not overvalued at all. Therefore, these three namescould theoretically be counted as reasonably priced Dow Jones industrial average constituents.
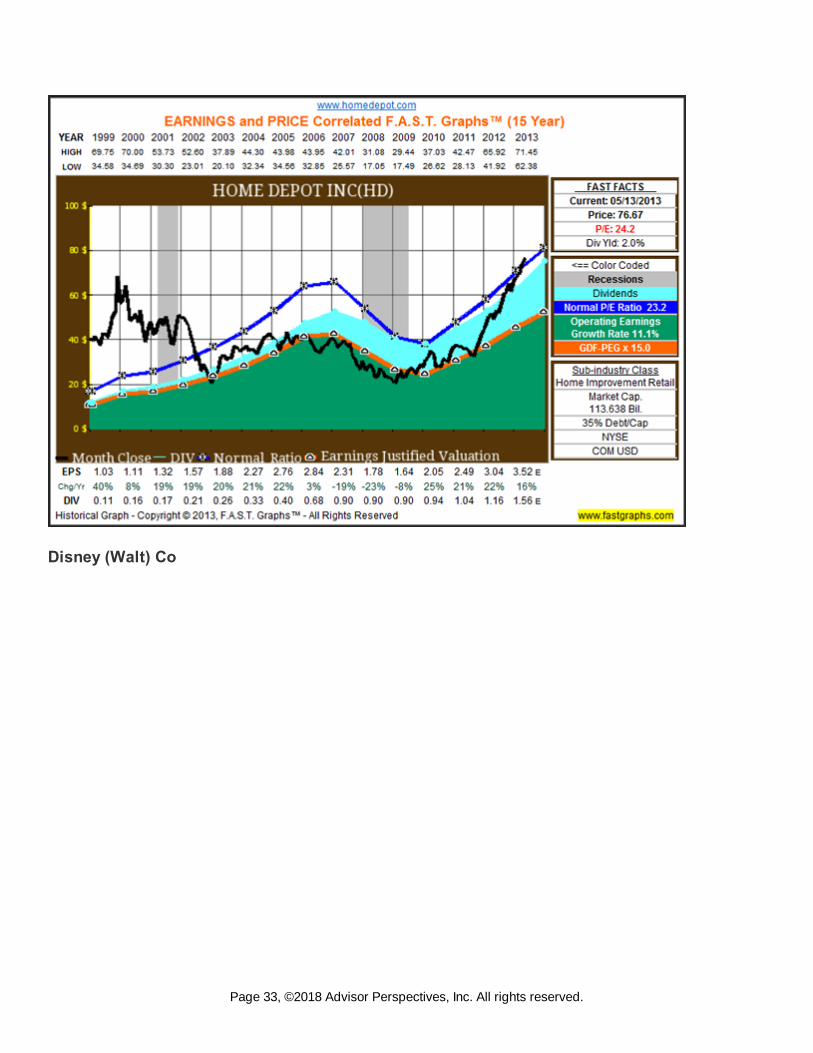
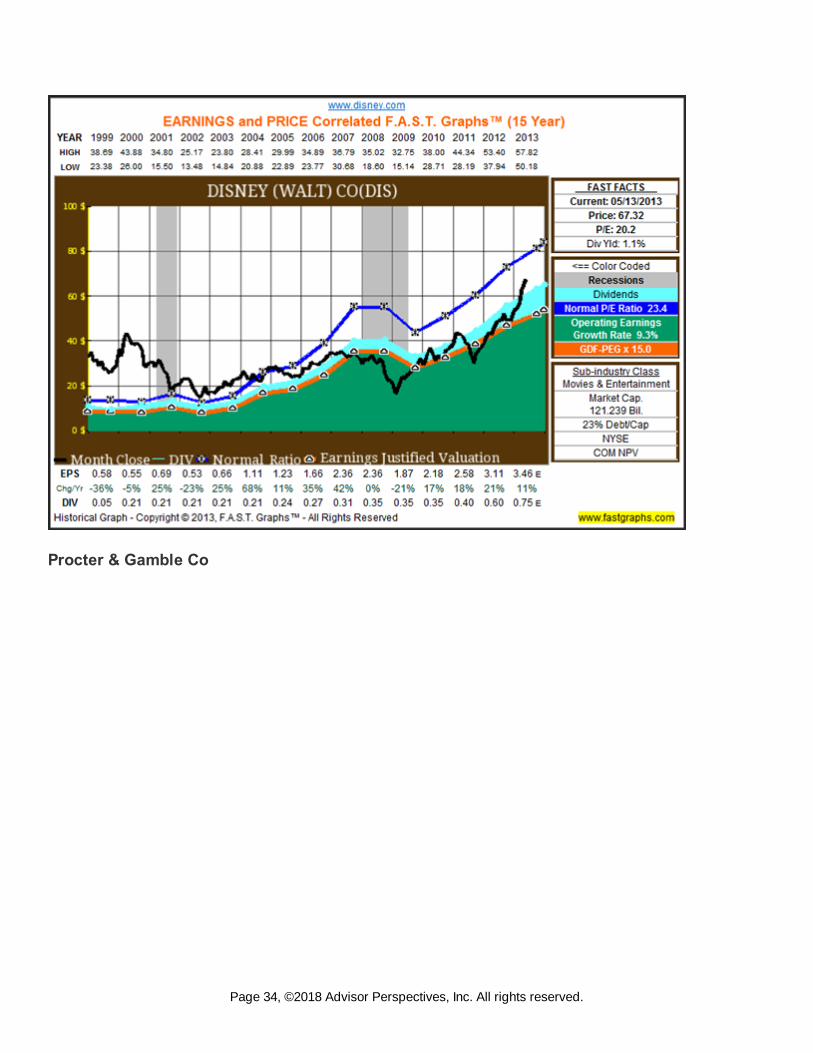
In contrast, I would argue that both Home Depot (HD) and Walt Disney (DIS) are overvalued under thestrictest definitions of overvaluation. Therefore, I would suggest the risk of investing in them at currentlevels is high, especially over the short-to-intermediate run.
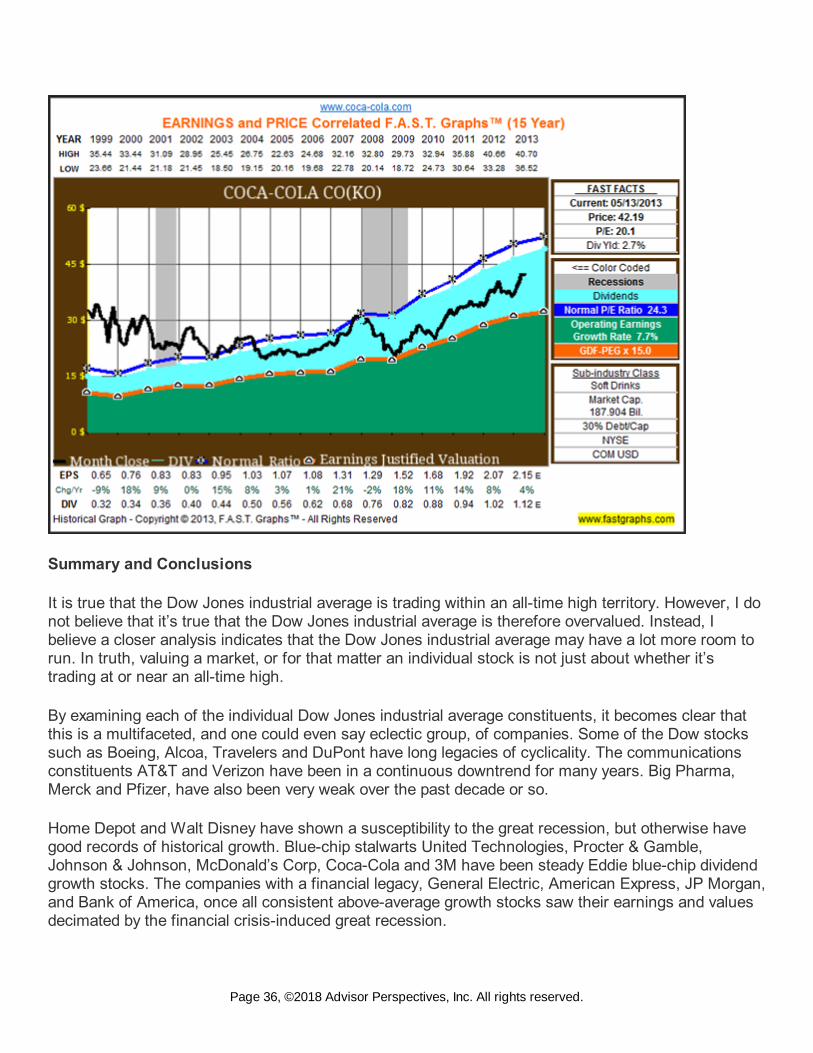
Finally, Procter & Gamble (PG) and Coca-Cola (KO) are two high-quality blue-chip dividend payingstalwarts with a legacy of being awarded a quality premium valuation by the market. Consequently, acase could be made that both of these stocks are reasonably valued today, at least on a historicalbasis, if not a pure earnings yield basis.
Bank of America Corp
Page 29, ©2018 Advisor Perspectives, Inc. All rights reserved.
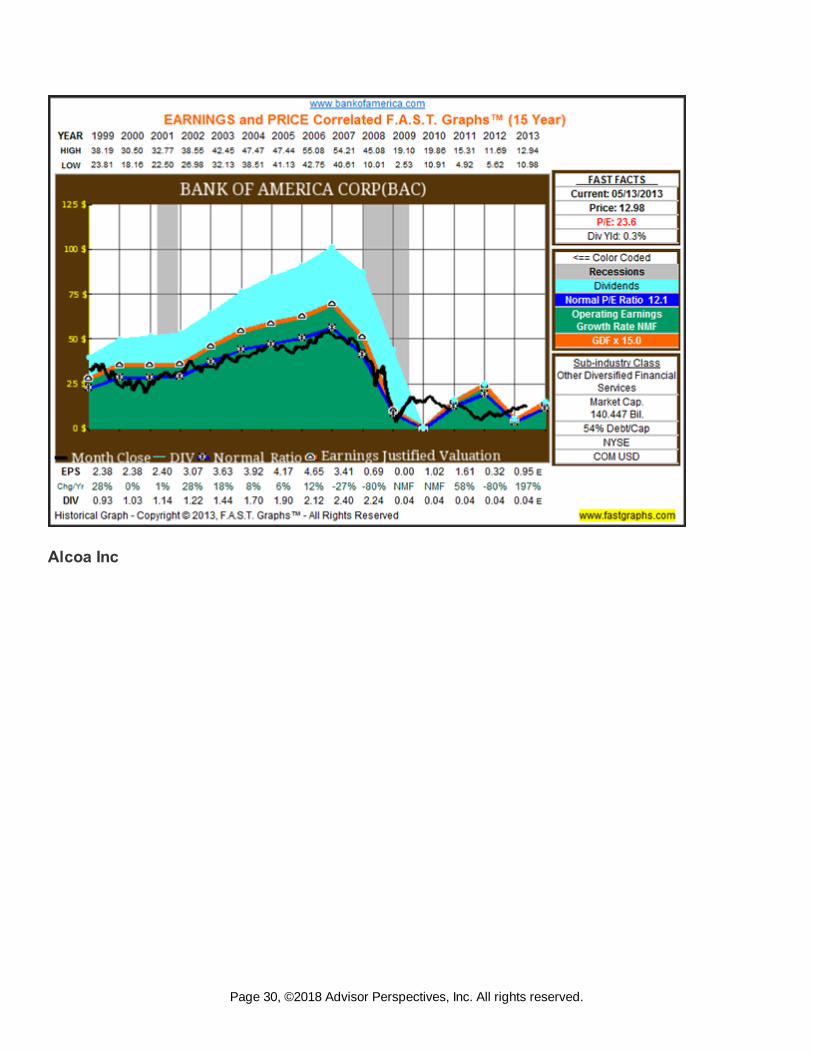
Alcoa Inc
Page 30, ©2018 Advisor Perspectives, Inc. All rights reserved.
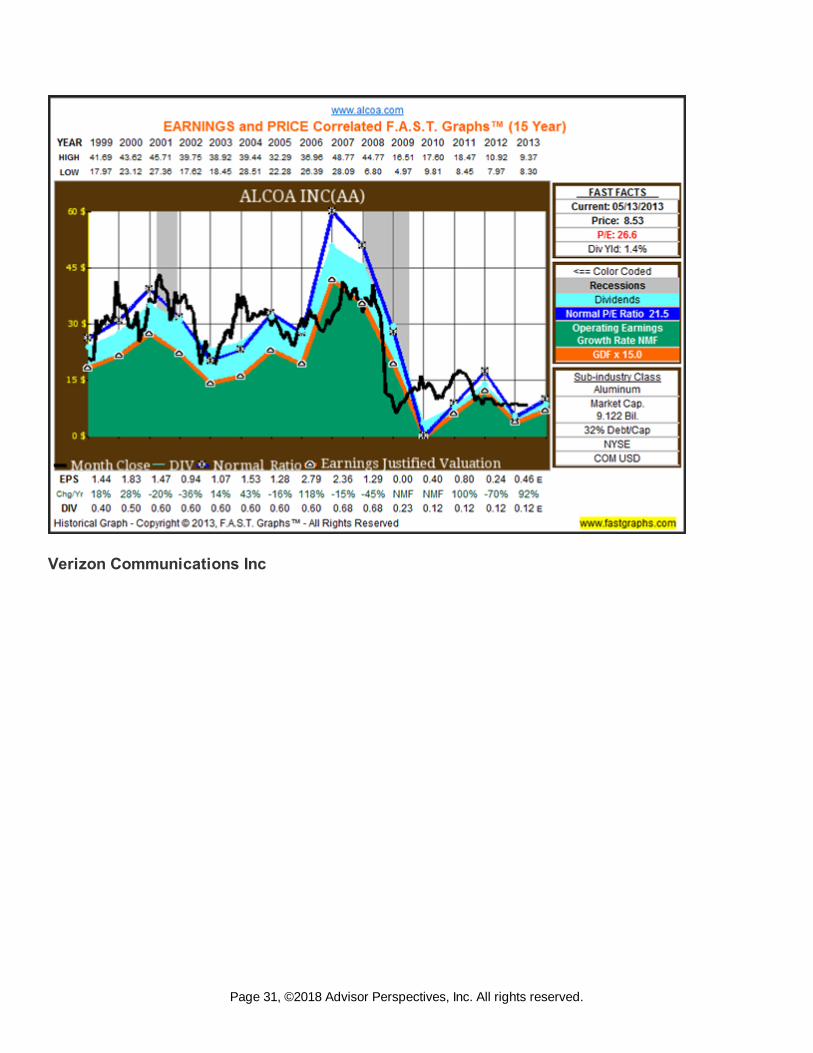
Verizon Communications Inc
Page 31, ©2018 Advisor Perspectives, Inc. All rights reserved.
Home Depot Inc
Page 32, ©2018 Advisor Perspectives, Inc. All rights reserved.
Disney (Walt) Co
Page 33, ©2018 Advisor Perspectives, Inc. All rights reserved.
Procter & Gamble Co
Page 34, ©2018 Advisor Perspectives, Inc. All rights reserved.

Coca-Cola Co
Page 35, ©2018 Advisor Perspectives, Inc. All rights reserved.
Summary and Conclusions
It is true that the Dow Jones industrial average is trading within an all-time high territory. However, I donot believe that it’s true that the Dow Jones industrial average is therefore overvalued. Instead, Ibelieve a closer analysis indicates that the Dow Jones industrial average may have a lot more room torun. In truth, valuing a market, or for that matter an individual stock is not just about whether it’strading at or near an all-time high.
By examining each of the individual Dow Jones industrial average constituents, it becomes clear thatthis is a multifaceted, and one could even say eclectic group, of companies. Some of the Dow stockssuch as Boeing, Alcoa, Travelers and DuPont have long legacies of cyclicality. The communicationsconstituents AT&T and Verizon have been in a continuous downtrend for many years. Big Pharma,Merck and Pfizer, have also been very weak over the past decade or so.
Home Depot and Walt Disney have shown a susceptibility to the great recession, but otherwise havegood records of historical growth. Blue-chip stalwarts United Technologies, Procter & Gamble,Johnson & Johnson, McDonald’s Corp, Coca-Cola and 3M have been steady Eddie blue-chip dividendgrowth stocks. The companies with a financial legacy, General Electric, American Express, JP Morgan,and Bank of America, once all consistent above-average growth stocks saw their earnings and valuesdecimated by the financial crisis-induced great recession.
Page 36, ©2018 Advisor Perspectives, Inc. All rights reserved.
For the most part the technology components, Cisco Systems Inc., Intel Corp and Microsoft, havesuffered from significant overvaluation during the technology bubble which culminated in calendar year2000, but have subsequently come back into fair value. Wal-Mart is a non-technology stalwart that hassuffered from the same overvaluation issues during the irrational exuberance period. IBM has been agreat growth story, and Hewlett-Packard is attempting to recover from a series of mishaps.
Energy constituents Chevron and Exxon have a long history of market undervaluation, as does thehealthcare constituent United health Group. Finally, Caterpillar is a semi-cyclical that appears veryundervalued currently.
The bottom line is that the Dow Jones industrial average is made up of 30 very diverse companies. Thepurpose of this article was to cast a light upon just how very different each of these companies were,and to illustrate that the Dow Jones industrial average is far from being in bubble territory. Personally, Ibelieve there is a great deal more insight in reviewing these companies as individual entities than thereis in thinking about them as the market in the general sense.
Disclosure: Long HD, PG, KO, HPQ, MSFT, CSCO, INTC, CAT, CVX, GE, PFE, BA, UTX and MCD atthe time of writing.
Disclaimer:The opinions in this document are for informational and educational purposes only andshould not be construed as a recommendation to buy or sell the stocks mentioned or to solicittransactions or clients. Past performance of the companies discussed may not continue and thecompanies may not achieve the earnings growth as predicted. The information in this document isbelieved to be accurate, but under no circumstances should a person act upon the informationcontained within. We do not recommend that anyone act upon any investment information withoutfirst consulting an investment advisor as to the suitability of such investments for his specificsituation.
© F.A.S.T. Graphs
www.fastgraphs.com
Page 37, ©2018 Advisor Perspectives, Inc. All rights reserved.


![Lookout Report - S&P Dow Jones Indices · Greek sovereign credit default swap (CDS) spreads spiked to new highs on both the trading days before (7,891 basis points [bps]) and after](https://img.pdfslide.us/doc/110x75/5faf9bfb1fcc5938ec4c6cf4/lookout-report-sp-dow-jones-indices-greek-sovereign-credit-default-swap-cds.jpg)