Embed Size (px)
Citation preview
Actual Values
For DOW, we made 55 income statement and balance sheetadjustments to convert accounting earnings to economicearnings in FY13 for a total value of $37,458 million.
75
52-Week Range
See Appendices 1 and 2 for details on our adjustments.
Investment Recommendation
7.7%
Positive EE
DOW earns our Very Dangerous rating. SeeInvestment Rating Details below.
•
•
•
•
•
•
•
•
•
•
STOCK RESEARCH
Very Dangerous <-5%
Attractive
-5%<-1%
Very Attractive
-1%<3%
3%<10%
Dangerous
>10%
Neutral
DOW's accounting earnings overstate its economic earnings.
(6.4%)
Accounting vs Economic Earnings
5.9%
$54,473
Investment Rating Details
20 < 50
10 < 20
3 < 10
0 < 3
> 50
60
$88,835
DOW ranks 3,013 of all the companies we cover for the numberof earnings adjustments and 2,785 for the number of valuationadjustments.
1.3%
Last 60 Days
Price-to-EBV Ratio
Valuation
Year to Date
S&P 500 (SPY)
Last 30 Days
3rd Quintile
2nd Quintile
Top Quintile
Russell 2000 (IWM)
21.0%
30 Day Avg Volume (thousands)
DOW ranks in the 8th percentile of the 3000+stocks we cover.
4th Quintile
Bottom Quintile
Last Year
$3.42
Overall Rating
Page 1
162 out of 172 Materials Sector stocks.
8,608
Return on Invested Capital (ROIC)
Stock Rating Methodology
Start Your Membership Today
Get More Ratings
Read Our Blog for Daily Updates
Rising EE
Positive EE
Neutral EE
False Positive
Misleading Trend
Price 02/04/2015:
(7.0%)
Closing Price as of 02/04/2015: $46.22
Market Value (MM)
Stock Performance
2.07
12.08
Very Dangerous
Need Help?
The Dow Chemical Company (DOW)
Key Market Statistics
We made 6 adjustments equal to $40,980 million in our DCFvaluation of the stock.
Last 90 DaysEBV per Share
$41.08 - $54.09
Shares Outstanding (thousands)
4.80
1,178,561
vs.
A Very Dangerous rating means this stock hasfar more downside risk than upside potential.
3.5%
6.0%
Economic vs Reported EPS
The Dow Chemical Company (DOW)
1.1 < 1.6
0 < 1.1
2.4 < 3.5 or < -1
1.6 < 2.4
> 3.5 or -1 < 0
Neutral EE
28
Economic Book Value per share
NYSE - Materials
Quality of Earnings
4.6%
(1.2%)
FCF Yield
Period End Date: 12/31/2013
Growth Appreciation Period (yrs)
Earnings & Valuation Diligence Summary
Enterprise Value (MM)
$46.22
We strongly recommend investors sell DOW.
4.8%
$3.83
$3.83
($1.52)
ROIC vs WACC is
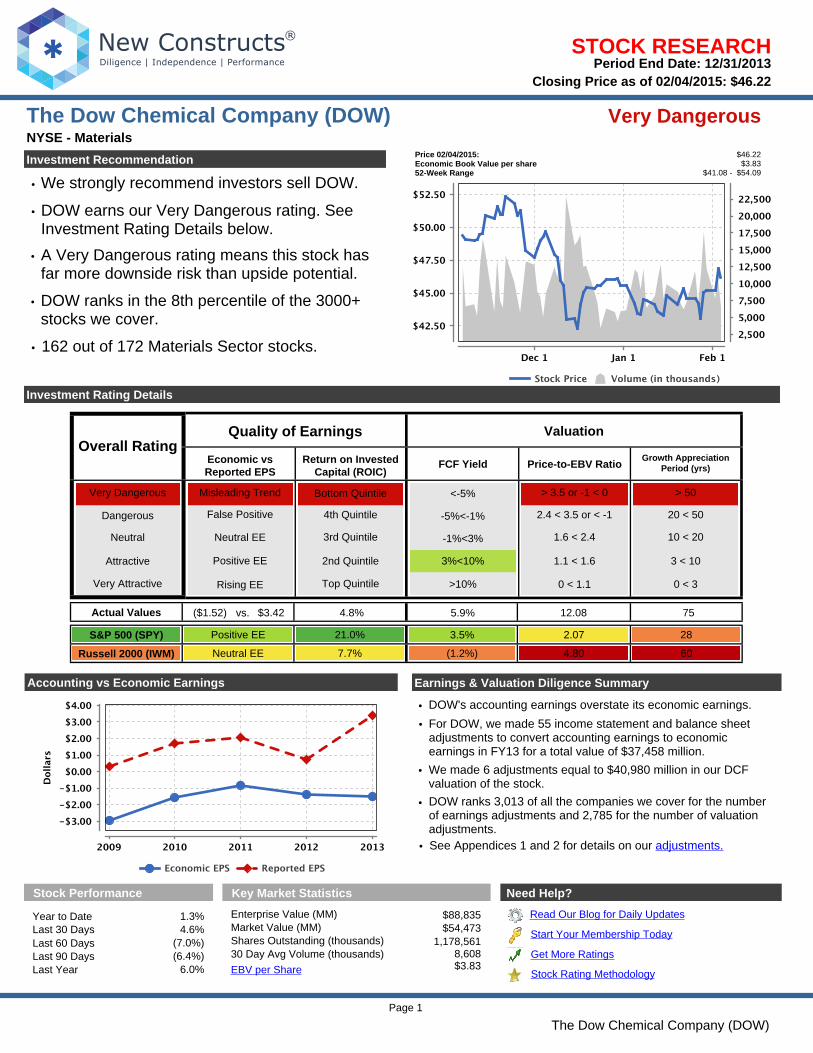
Economic Earnings per share (EEPS) for DOW are ($1.52) forthe last fiscal year and earn a Very Dangerous rating.
Return on Invested Capital (ROIC)
STOCK RESEARCH
Economic vs Reported Earnings
DOW's current FCF is $5,284 million. The FCF Yield is 6.0% andearns an Attractive rating.
DOW's ROIC of 4.8% compared to its WACC of 8.4% in the lastfiscal year earns a Very Dangerous rating.
Very Dangerous
Attractive
Page 2
Very Dangerous
02/05/2015
The Dow Chemical Company (DOW)
Free Cash Flow Yield is
ROIC measures a company's return on all cash invested in the business. It is the truest measure of profitability. Stock valuations are more highly correlated to ROIC than any other metric. Weighted-Average Cost of Capital (WACC) is the average of debt and equity capital costs that all publicly traded companies with debt and equity stakeholders incur as a cost of operating. Companies must earn an ROIC greater than WACC to generate positive economic earnings and create value for shareholders.
Free Cash Flow Yield (FCF Yield)
Economic Earnings are almost always meaningfully different than reported earnings. We believe Economic Earnings provide a truer measure of profitability and shareholder value creation than reported earnings because they have been adjusted to remove over twenty accounting distortions. The majority of data required to reverse accounting distortions is available only in the Footnotes and MD&A, which we analyze rigorously. Our core competency is gathering and analyzing all relevant financial data from filings so that we can deliver earnings analysis that best represents the true profitability of businesses.
Economic Earnings are
Free Cash Flow reflects the amount of cash free for distribution to all stakeholders (including debt & equity). FCF Yield divides free cash flow by enterprise value. Using Free Cash Flow Yield to pick stocks is not a new strategy. However, our strategy yields superior results because we use a better measure of Free Cash Flow. In the same way our Economic EPS are better measures of profitability than reported EPS, our measure of Free Cash Flow is better than traditional accounting-based Free Cash Flow.
6.2%
$27.63
3Yr
Historical Performance
(3.8%)
Price-to-EBV Ratio is
5 Yr
Growth Appreciation Period
Growth Appreciation Period 75 years
$44.40
Market Expectations
These results are derived using our dynamic discounted cash flow model.
STOCK RESEARCH
(2.4%) 2.8%Revenue CAGR
DefaultThe market-implied duration of profit growth or GAP measures the number of years the company must maintain an edge over its competitors by earning ROIC greater than the weighted-average cost of capital on new investments.
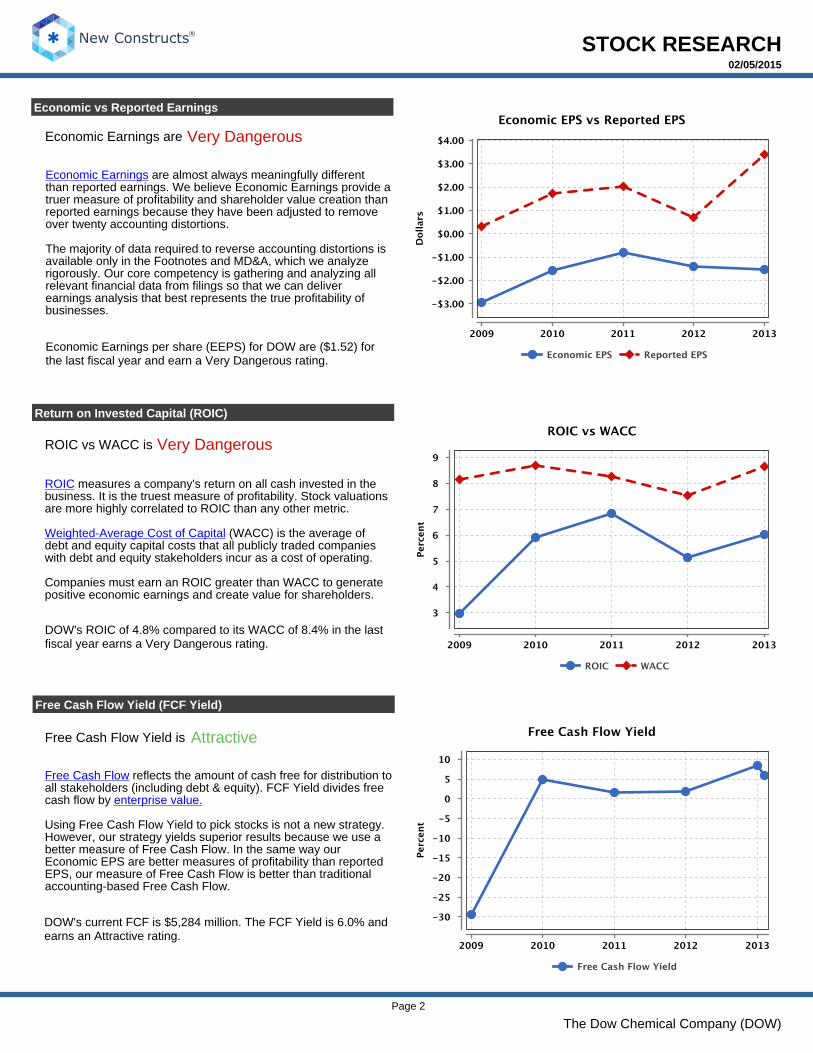
DOW's current Price-to-EBV per share is 12.1 and earns a VeryDangerous rating.
Performance Hurdles
Price-to-EBV Ratio
We believe DOW embeds a Very Dangerous level of marketexpectations because there is a very large difference between theexpected financial performance implied by its market price andthe company's historical performance.
At DOW's current stock price of $46.22, the market is expectingrevenue to grow at 6.2% for the next 75 years. Over this period,DOW is also expected to generate an average EconomicEarnings Margin of 2.3%.
Page 3
Very Dangerous
- - -
Stock Price
based on current price
02/05/2015
The Growth Appreciation Period is
The Dow Chemical Company (DOW)
Price-to-Economic Book Value (EBV) measures the difference between the market's expectations for future profits and the no-growth value of the stock. EBV measures the no-growth value of the company based on the company's current Net Operating Profit After Tax (NOPAT). When prices are higher than EBV, the market predicts the NOPAT of the company will increase and expectations for profit growth are reflected in the stock. If the stock price equals EBV, the market predicts NOPAT will remain the same and there are no expectations for profit growth reflected in the stock. When stock prices are lower than EBV, the market predicts NOPAT will decrease and expectations for permanent profit decline are reflected in the stock. In general, we like to buy stocks with low expectations for profit growth and sell/short stocks with high expectations for profit growth.
6.2%
Avg Economic Earnings Margin (3.1%)
$28.76
Very Dangerous
Last FY
$46.22
(2.5%) 2.3%
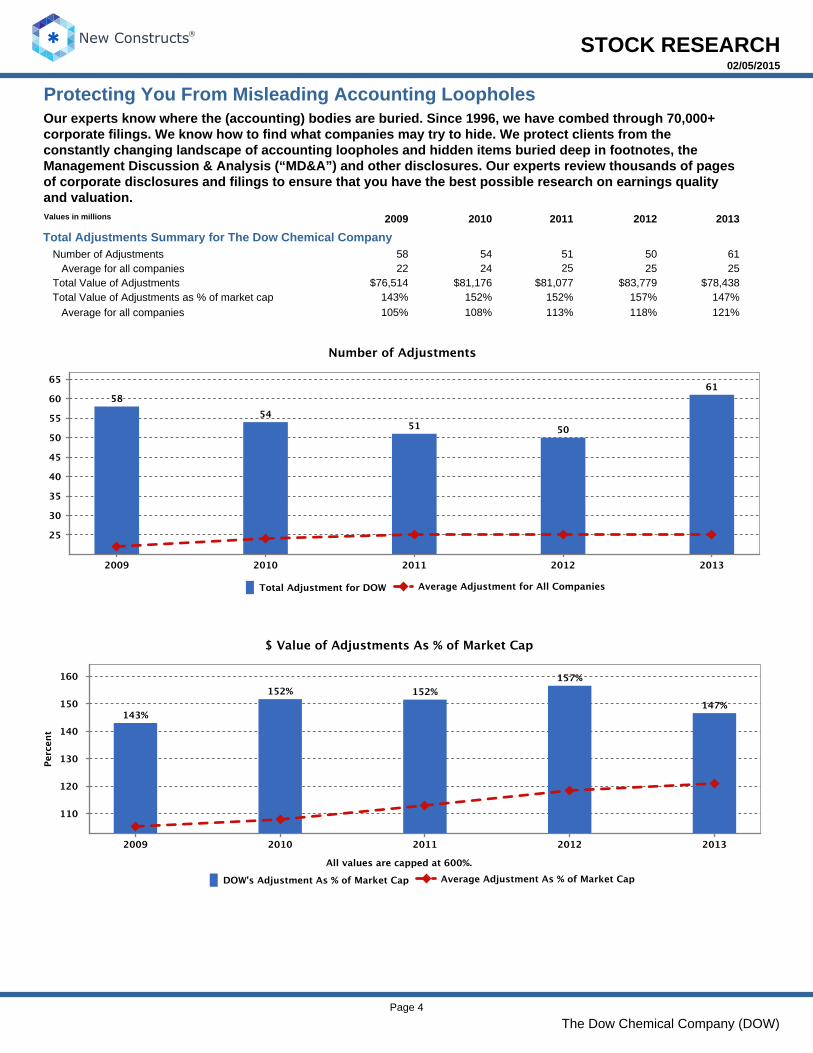
Total Value of Adjustments $83,779
Values in millions
152%118%
STOCK RESEARCH
Number of Adjustments
$81,077143%
Protecting You From Misleading Accounting Loopholes
58
113%147%152%
2012
157%
Page 4
25 25
105%
02/05/2015
2011
54
The Dow Chemical Company (DOW)
$76,514
50
20102009 2013
Average for all companies
51 612524
$78,438
121%
$81,176
Total Adjustments Summary for The Dow Chemical Company
108%
Our experts know where the (accounting) bodies are buried. Since 1996, we have combed through 70,000+ corporate filings. We know how to find what companies may try to hide. We protect clients from the constantly changing landscape of accounting loopholes and hidden items buried deep in footnotes, the Management Discussion & Analysis (“MD&A”) and other disclosures. Our experts review thousands of pages of corporate disclosures and filings to ensure that you have the best possible research on earnings quality and valuation.
Total Value of Adjustments as % of market cap
22 Average for all companies
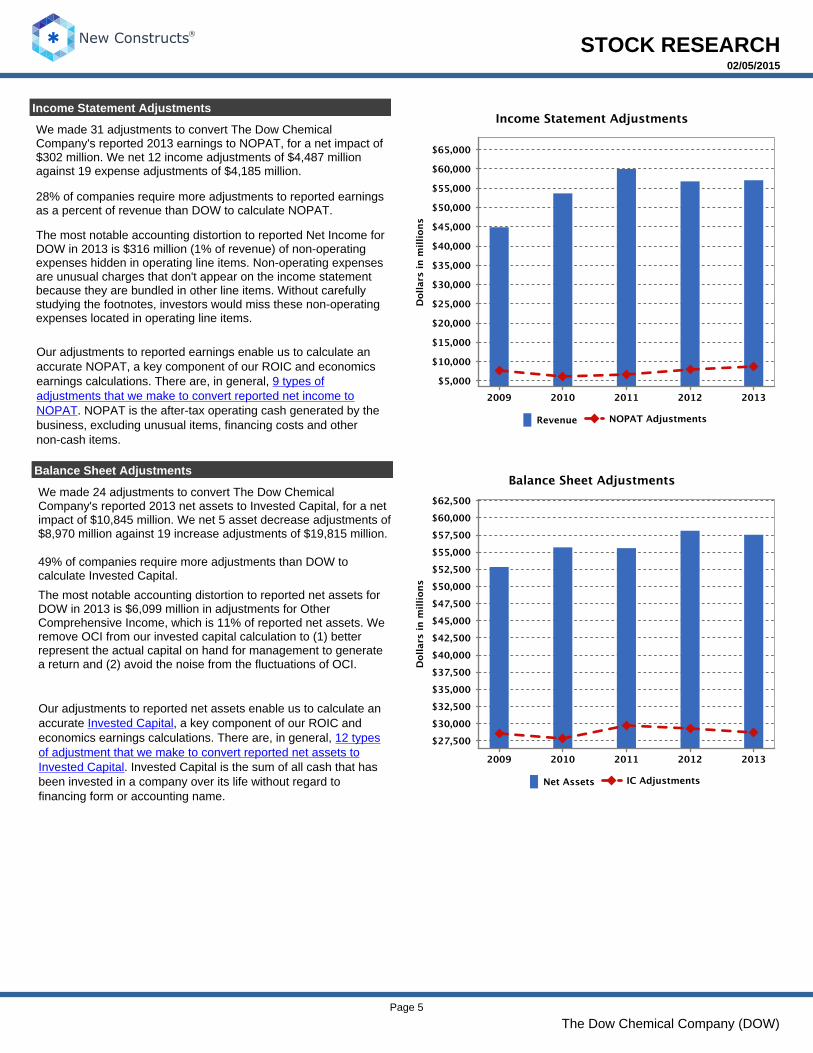
We made 24 adjustments to convert The Dow ChemicalCompany's reported 2013 net assets to Invested Capital, for a netimpact of $10,845 million. We net 5 asset decrease adjustments of$8,970 million against 19 increase adjustments of $19,815 million.
Income Statement Adjustments
The most notable accounting distortion to reported net assets forDOW in 2013 is $6,099 million in adjustments for OtherComprehensive Income, which is 11% of reported net assets. Weremove OCI from our invested capital calculation to (1) betterrepresent the actual capital on hand for management to generatea return and (2) avoid the noise from the fluctuations of OCI.
Our adjustments to reported net assets enable us to calculate an accurate Invested Capital, a key component of our ROIC and economics earnings calculations. There are, in general, 12 types of adjustment that we make to convert reported net assets to Invested Capital. Invested Capital is the sum of all cash that has been invested in a company over its life without regard to financing form or accounting name.
STOCK RESEARCH
49% of companies require more adjustments than DOW tocalculate Invested Capital.
Balance Sheet Adjustments
Page 5
The most notable accounting distortion to reported Net Income forDOW in 2013 is $316 million (1% of revenue) of non-operatingexpenses hidden in operating line items. Non-operating expensesare unusual charges that don't appear on the income statementbecause they are bundled in other line items. Without carefullystudying the footnotes, investors would miss these non-operatingexpenses located in operating line items.
28% of companies require more adjustments to reported earningsas a percent of revenue than DOW to calculate NOPAT.
02/05/2015
The Dow Chemical Company (DOW)
We made 31 adjustments to convert The Dow ChemicalCompany's reported 2013 earnings to NOPAT, for a net impact of$302 million. We net 12 income adjustments of $4,487 millionagainst 19 expense adjustments of $4,185 million.
Our adjustments to reported earnings enable us to calculate an accurate NOPAT, a key component of our ROIC and economics earnings calculations. There are, in general, 9 types of adjustments that we make to convert reported net income to NOPAT. NOPAT is the after-tax operating cash generated by the business, excluding unusual items, financing costs and other non-cash items.
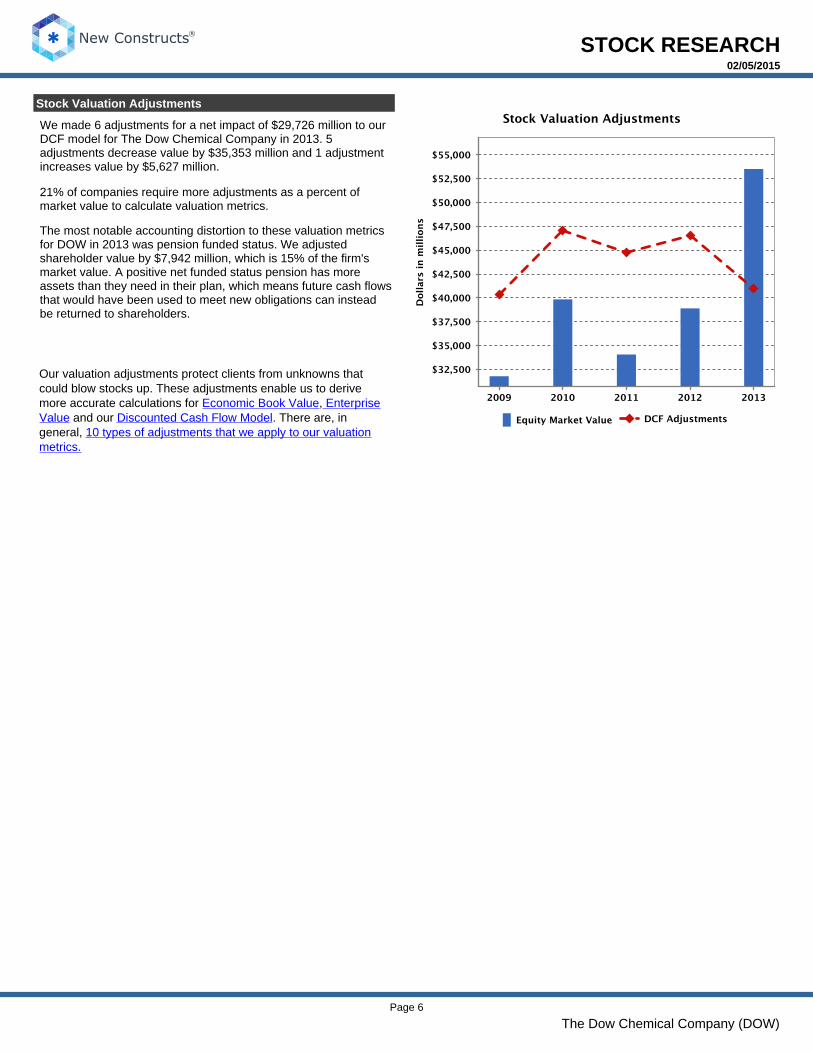
Our valuation adjustments protect clients from unknowns that could blow stocks up. These adjustments enable us to derive more accurate calculations for Economic Book Value, Enterprise Value and our Discounted Cash Flow Model. There are, in general, 10 types of adjustments that we apply to our valuation metrics.
The most notable accounting distortion to these valuation metricsfor DOW in 2013 was pension funded status. We adjustedshareholder value by $7,942 million, which is 15% of the firm'smarket value. A positive net funded status pension has moreassets than they need in their plan, which means future cash flowsthat would have been used to meet new obligations can insteadbe returned to shareholders.
STOCK RESEARCH
Stock Valuation Adjustments
Page 6
We made 6 adjustments for a net impact of $29,726 million to ourDCF model for The Dow Chemical Company in 2013. 5adjustments decrease value by $35,353 million and 1 adjustmentincreases value by $5,627 million.
02/05/2015
21% of companies require more adjustments as a percent ofmarket value to calculate valuation metrics.
The Dow Chemical Company (DOW)
$102.00
$569.00
$2,372.00
$0.00
$4,043.70
($839.39)
$0.00
$4,485.40
$0.00
($23,564.59)
($8,578.00)
Over Funded Pensions (Asset)
$68,726.25
($0.00)
$4,399.00
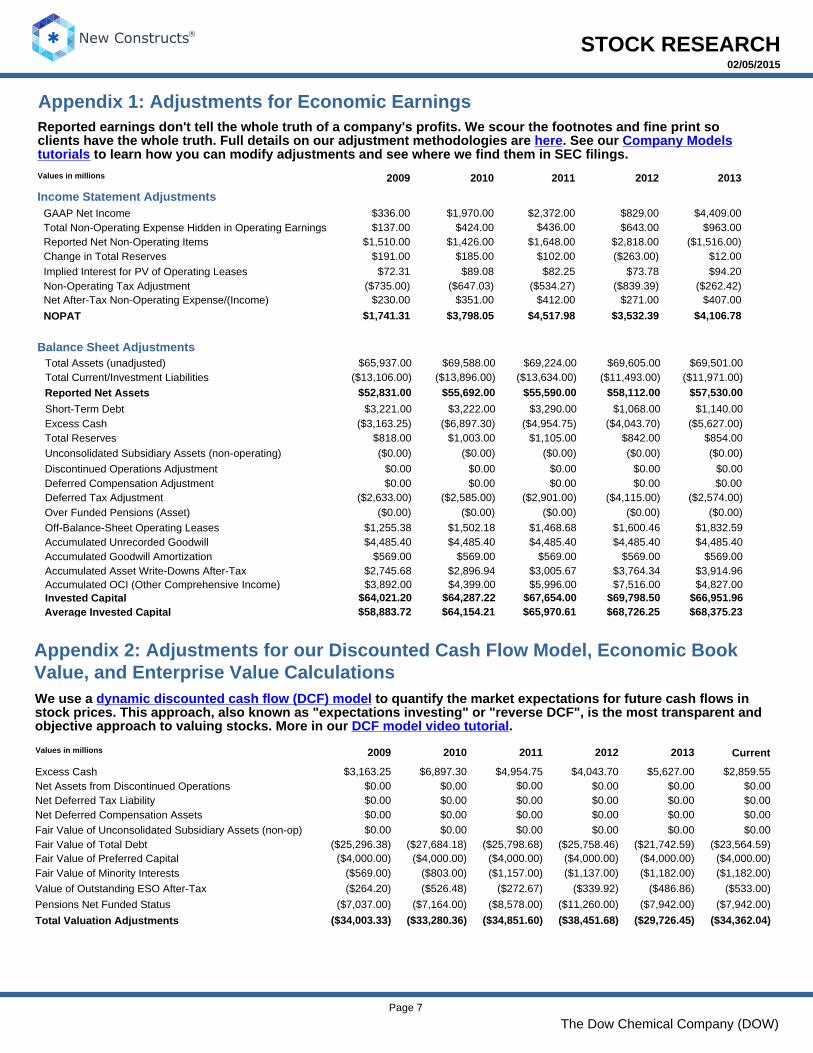
Reported earnings don't tell the whole truth of a company's profits. We scour the footnotes and fine print so clients have the whole truth. Full details on our adjustment methodologies are here. See our Company Models tutorials to learn how you can modify adjustments and see where we find them in SEC filings.
Short-Term Debt
Fair Value of Unconsolidated Subsidiary Assets (non-op)
($29,726.45)
$4,827.00
Values in millions
Values in millions
Appendix 2: Adjustments for our Discounted Cash Flow Model, Economic Book Value, and Enterprise Value Calculations
Appendix 1: Adjustments for Economic Earnings
$1,741.31
$1,140.00
$3,005.67
($27,684.18)
$64,154.21
$1,970.00
$3,532.39
($7,037.00)
$0.00
$69,588.00
$7,516.00
($21,742.59)
$69,605.00
Reported Net Non-Operating Items
($533.00)
$842.00
Invested Capital
$0.00
($486.86)
($262.42)
$336.00
$55,590.00
Net Deferred Tax Liability
Total Assets (unadjusted)
($5,627.00)
STOCK RESEARCH
$0.00
($2,633.00)
$0.00
Reported Net Assets
$271.00
$1,510.00
($34,003.33)
$1,105.00
Fair Value of Total Debt
($13,896.00)
$58,883.72
$963.00
$69,501.00
($34,851.60)
($526.48)
$0.00
$73.78
$643.00
$0.00
($4,000.00)
Change in Total Reserves
$4,485.40
$1,068.00($3,163.25)
($11,493.00)
2012
2012
($1,516.00)
($264.20)
$0.00
$0.00
($647.03)
$4,485.40
($0.00)
$2,818.00
$89.08
$1,468.68
($38,451.68)
Accumulated Unrecorded Goodwill
Deferred Tax Adjustment
$3,764.34
$191.00
$351.00
($13,634.00)
$4,409.00
$3,914.96
($2,585.00)Deferred Compensation Adjustment
$1,502.18
$0.00
$4,106.78
$829.00
$1,003.00
($2,574.00)
($25,758.46)
$1,648.00
Unconsolidated Subsidiary Assets (non-operating)
$424.00
$0.00
$0.00
Pensions Net Funded Status
($0.00)
Accumulated Asset Write-Downs After-Tax
$4,485.40
$4,517.98
$3,222.00
Total Current/Investment Liabilities
($25,296.38)
$569.00
$5,996.00
Fair Value of Minority Interests
$0.00 $0.00
$230.00
($272.67)
$407.00
Page 7
$12.00
$6,897.30
$818.00
$0.00
($0.00)
$1,426.00
($7,942.00)
Accumulated OCI (Other Comprehensive Income)
$0.00
$412.00($735.00)
$1,600.46
GAAP Net Income
($25,798.68)
($4,954.75)
$0.00
$64,021.20
$1,832.59
Balance Sheet Adjustments
($1,157.00)
$185.00
($0.00)
($0.00)
($0.00)
$0.00
02/05/2015
$0.00
$69,224.00
$0.00
$0.00
($4,000.00)
($263.00)
$569.00
$436.00
$2,896.94
$0.00
2011
2011
$5,627.00
$0.00
Fair Value of Preferred Capital($803.00)
The Dow Chemical Company (DOW)
$68,375.23$64,287.22
$65,970.61
$82.25
Income Statement Adjustments
($11,260.00)
Value of Outstanding ESO After-Tax
$4,954.75
($11,971.00)
($1,137.00)
$0.00
$3,163.25
Total Reserves
2010
2010
Total Valuation Adjustments
$0.00
($7,164.00)
2009
2009
2013
2013
$137.00
($6,897.30)
($13,106.00)
($4,000.00)
$0.00$0.00
Non-Operating Tax Adjustment ($534.27)
$0.00
($2,901.00)
$3,290.00
($4,000.00)
$3,892.00
Current
Net Assets from Discontinued Operations
$67,654.00
$94.20
($569.00)
Accumulated Goodwill Amortization
$0.00
Average Invested Capital
Net Deferred Compensation Assets
($0.00)
($1,182.00)
($7,942.00)
$65,937.00
Implied Interest for PV of Operating Leases
($4,000.00)
$72.31
($33,280.36)
$4,485.40
$2,745.68$569.00
Net After-Tax Non-Operating Expense/(Income)
$69,798.50
We use a dynamic discounted cash flow (DCF) model to quantify the market expectations for future cash flows in stock prices. This approach, also known as "expectations investing" or "reverse DCF", is the most transparent and objective approach to valuing stocks. More in our DCF model video tutorial .
$854.00
($1,182.00)
($34,362.04)
NOPAT
($4,043.70)
$52,831.00
$569.00
$0.00
Total Non-Operating Expense Hidden in Operating Earnings
$58,112.00
$2,859.55
($4,115.00)
$57,530.00
($0.00)
$66,951.96
$3,221.00Excess Cash
Excess Cash
($339.92)
$1,255.38
$0.00
$55,692.00
($4,000.00)
Discontinued Operations Adjustment$0.00
Off-Balance-Sheet Operating Leases
($0.00)
$3,798.05
Unconsolidated Subsidiaries
2.4 < 3.5 or < -1
• •
• •
• •
• •
• •
• •
• •
• •
•
Deferred Compensation
Excess Cash
Neutral
4th Quintile
Net Deferred tax Assets and Liabilities
Pooling Goodwill
Price-to-EBV Ratio
-1% < 3%
2nd Quintile
Mid-Year Acquisitions
10 < 20
FCF Yield
Ratings
Off-Balance-Sheet Financing
Restructuring Charges
Misleading Trend
STOCK RESEARCH
Minority Interests
LIFO Reserve
Economic earnings and return on capital metrics are significantly more accurate when as-reported financial statements have been adjusted to reverse accounting distortions and Red Flags. The majority of the data required to reverse accounting distortions is available only in the Notes to the Financial Statements, which we analyze rigorously. Our core competency is gathering and analyzing all relevant financial data (from the Financial Statements and Notes) so that we can deliver earnings analysis that best represents the true profitability of businesses. See the figure below for a list of the Red Flag adjustments we make to a company's reported GAAP profits in order to reverse accounting distortions and arrive at a better measure of a firm's profits.
< -5% > 50
Employee Stock Options
0 < 1.1
Preferred Stock
Discontinued Operations
3% < 10%
Unrealized Gains/Losses
Attractive
Dangerous
Page 8
Rising EE 0 < 3
Neutral EE
> 10%
20 < 50
Overall Rating
False Positive
02/05/2015
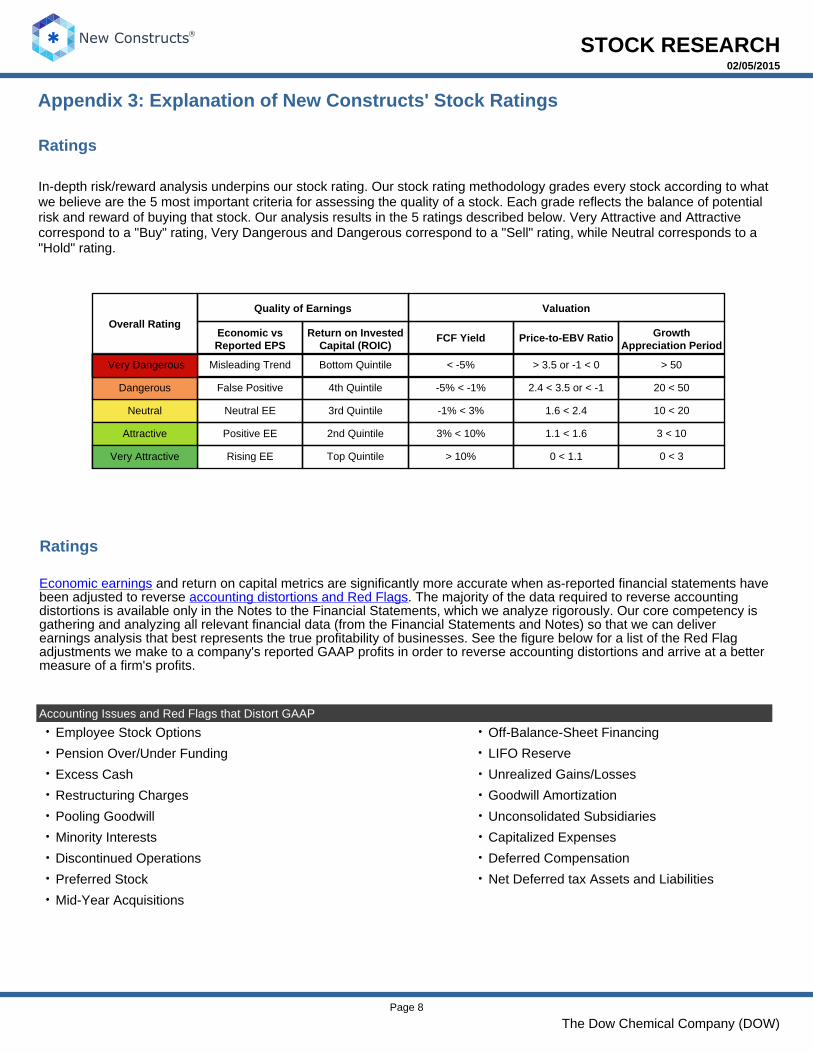
In-depth risk/reward analysis underpins our stock rating. Our stock rating methodology grades every stock according to what we believe are the 5 most important criteria for assessing the quality of a stock. Each grade reflects the balance of potential risk and reward of buying that stock. Our analysis results in the 5 ratings described below. Very Attractive and Attractive correspond to a "Buy" rating, Very Dangerous and Dangerous correspond to a "Sell" rating, while Neutral corresponds to a "Hold" rating.
3rd Quintile
Goodwill Amortization
Very Dangerous > 3.5 or -1 < 0
Growth Appreciation Period
The Dow Chemical Company (DOW)
Positive EE 1.1 < 1.6
Ratings
Appendix 3: Explanation of New Constructs' Stock Ratings
Return on Invested Capital (ROIC)
Economic vs Reported EPS
-5% < -1%
Very Attractive
Pension Over/Under Funding
3 < 10
Accounting Issues and Red Flags that Distort GAAP
1.6 < 2.4
Capitalized Expenses
Quality of Earnings
Bottom Quintile
Valuation
Top Quintile
STOCK RESEARCH
Our Philosophy About Research
How New Constructs Creates Value for Clients
Page 9
DISCLAIMERS
New Constructs®, LLC (together with any subsidiaries and/or affiliates, 'New Constructs') is an independent organization with no management ties to the companies it covers. None of the members of New Constructs' management team or the management team of any New Constructs' affiliate holds a seat on the Board of Directors of any of the companies New Constructs covers. New Constructs does not perform any investment or merchant banking functions and does not operate a trading desk. New Constructs' Stock Ownership Policy prevents any of its employees or managers from engaging in Insider Trading and restricts any trading whereby an employee may exploit inside information regarding our stock research. In addition, employees and managers of the company are bound by a code of ethics that restricts them from purchasing or selling a security that they know or should have known was under consideration for inclusion in a New Constructs report nor may they purchase or sell a security for the first 15 days after New Constructs issues a report on that security. New Constructs is affiliated with Novo Capital Management, LLC, the general partner of a hedge fund. At any particular time, New Constructs' research recommendations may not coincide with the hedge fund's holdings. However, in no event will the hedge fund receive any research information or recommendations in advance of the information that New Constructs provides to its other clients.
The information and opinions presented in this report are provided to you for information purposes only and are not to be used or considered as an offer or solicitation of an offer to buy or sell securities or other financial instruments. New Constructs has not taken any steps to ensure that the securities referred to in this report are suitable for any particular investor and nothing in this report constitutes investment, legal, accounting or tax advice. This report includes general information that does not take into account your individual circumstance, financial situation or needs, nor does it represent a personal recommendation to you. The investments or services contained or referred to in this report may not be suitable for you and it is recommended that you consult an independent investment advisor if you are in doubt about any such investments or investment services. Information and opinions presented in this report have been obtained or derived from sources believed by New Constructs to be reliable, but New Constructs makes no representation as to their accuracy, authority, usefulness, reliability, timeliness or completeness. New Constructs accepts no liability for loss arising from the use of the information presented in this report, and New Constructs makes no warranty as to results that may be obtained from the information presented in this report. Past performance should not be taken as an indication or guarantee of future performance, and no representation or warranty, express or implied, is made regarding future performance. Information and opinions contained in this report reflect a judgment at its original date of publication by New Constructs and are subject to change without notice. New Constructs may have issued, and may in the future issue, other reports that are inconsistent with, and reach different conclusions from, the information presented in this report. Those reports reflect the different assumptions, views and analytical methods of the analysts who prepared them and New Constructs is under no obligation to insure that such other reports are brought to the attention of any recipient of this report. New Constructs' reports are intended for distribution to its professional and institutional investor customers. Recipients who are not professionals or institutional investor customers of New Constructs should seek the advice of their independent financial advisor prior to making any investment decision or for any necessary explanation of its contents. This report is not directed to, or intended for distribution to or use by, any person or entity who is a citizen or resident of or located in any locality, state, country or jurisdiction where such distribution, publication, availability or use would be contrary to law or regulation or which would be subject New Constructs to any registration or licensing requirement within such jurisdiction. This report may provide the addresses of websites. Except to the extent to which the report refers to New Constructs own website material, New Constructs has not reviewed the linked site and takes no responsibility for the content therein. Such address or hyperlink (including addresses or hyperlinks to New Constructs own website material) is provided solely for your convenience and the information and content of the linked site do not in any way form part of this report. Accessing such websites or following such hyperlink through this report shall be at your own risk. All material in this report is the property of, and under copyright, of New Constructs. None of the contents, nor any copy of it, may be altered in any way, copied, or distributed or transmitted to any other party without the prior express written consent of New Constructs. All trademarks, service marks and logos used in this report are trademarks or service marks or registered trademarks or service marks of New Constructs. Copyright New Constructs, LLC 2003 through the present date. All rights reserved.
Accounting data is not designed for equity investors, but for debt investors. Accounting data must be translated into economic earnings to understand the profitability and valuation relevant to equity investors. Respected investors (e.g. Adam Smith, Warren Buffett and Ben Graham) have repeatedly emphasized that accounting results should not be used to value stocks. Economic earnings are what matter because they are:
1. Based on the complete set of financial information available. 2. Standard for all companies. 3. A more accurate representation of the true underlying cash flows of the business.
02/05/2015
The Dow Chemical Company (DOW)
New Constructs® - Profile
1. Superior Recommendations - Our stock-picks consistently outperform. See our track record in our stock-picking accolades and Proof Is In Performance reports. 2. More Accurate Research - Our patented Research Platform for reversing accounting distortions and discounted cash flow analysis leverages better data to deliver smarter research. 3. Time Savings - We check the fine print in thousands of corporate filings so you don't have to. As reported by Barron's, our expertise in analyzing SEC filings delivers Hidden Gems and Red Flags that drive long-term stock-picking success. 4. Transparency - We are proud to share the results of our analysis of over 50,000 10-Ks. See the Corporate Disclosure Transgressions report we provided to the SEC. Our reports detail all data and assumptions. Company Models enable users to change them. 5. Objectivity - New Constructs is an independent research firm, not tied to Wall Street or investment banking services. See our presentation to the Senate Banking Committee, the SEC and many others in DC.
Incorporated in July 2002, New Constructs is an independent publisher of investment research that provides clients with consulting and research services. We specialize in quality-of-earnings, forensic accounting and discounted cash flow valuation analyses for all U.S. public companies.
DISCLOSURES


![Date: 20170419 Chemical Company and... · Page: 3 I. Overview [1] In these reasons, I refer to the plaintiffs Dow Chemical Company, Dow Global Technologies Inc and Dow Chemical Canada](https://img.pdfslide.us/doc/110x75/5b6414c47f8b9af5448ccff3/date-chemical-company-and-page-3-i-overview-1-in-these-reasons-i-refer.jpg)