Embed Size (px)
Citation preview
THE DISTRIBUTION OF WEALTH IN SPAIN:
EVIDENCE FROM CAPITALIZED INCOME TAX DATA
Master Thesis
written by
Clara Martínez-Toledano Toledano
and supervised by
Professors Facundo Alvaredo and Thomas Piketty
to obtain the degree of
Master in Public Policy and Development
September 2015
Abstract*
In this paper we analyze wealth inequality in Spain throughout the economic ex-
pansion of the early 2000s and the subsequent recession. For that, we construct wealth
shares for the period 2002 and 2011 using income tax micro-data and the investment
income method. Our results reveal two striking facts. First, there was a generalized
drop in wealth concentration between 2002 and 2006, the years of the boom, followed
by a marked increase in wealth inequality in 2007, the year of the burst of the crisis,
and a subsequent slight decline in concentration until 2011. Second, the increase in
wealth inequality between 2002 and 2011 was a phenomenon concentrated within the
top 10 to 0.5%. The main reason is that at the very top of the wealth distribution, the
surge in stock prices was not enough to compensate for the dramatic increase in real
estate prices, which benefits upper (but not very top) wealth holders. Surprisingly, we
find that wealth is much more concentrated than in previous studies which use other
data and methods. In fact, our series reveal that the level of wealth concentration in
Spain is close to the one obtained by Saez and Zucman [2014] in the US.
Keywords: Wealth; Inequality; Spain.
*I thank my two supervisors, Professors Facundo Alvaredo and Thomas Piketty, for
giving me the opportunity to study under their guidance and for their excellent super-
vision. I am also very grateful to Jonathan Goupille for his constant support during
many of the steps of my Master Thesis. I would also like to thank Professors Miguel
Artola, Branko Milanovic, Salvador Ortigueira and Gabriel Zucman for their helpful
comments and their interest in my work. I am also very thankful to Álvaro Álvarez-
Blázquez, Julien Daviet, Luis Estévez, Duarte Gonçalves, Marion Leroutier, José Mon-
talbán, Lisa Oberländer and Asunción Toledano for their help and support during the
carrying out of my Master Thesis. I would also like to thank the Spanish Institute of
Fiscal Studies, the Bank of Spain and the Spanish National Statistics Institute for help-
ing me to obtain the data needed to carry out this work. Finally, but not less important,
I am deeply grateful to Fundación Ramón Areces for its financial support.
2
Contents
1 Introduction 4
2 Wealth: Definition, Data and Trends 8
2.1 Our Wealth Concept and Data Sources . . . . . . . . . . . . . . . . . . . . 8
2.2 Aggregate Wealth Stylized Facts (1990-2013) . . . . . . . . . . . . . . . . 10
3 The Income Capitalization Approach: Using Taxable Capital Income to Ob-
tain the Wealth Distribution 13
3.1 The distribution of taxable capital income . . . . . . . . . . . . . . . . . . 13
3.2 The income capitalization method . . . . . . . . . . . . . . . . . . . . . . 15
3.2.1 A formal setting . . . . . . . . . . . . . . . . . . . . . . . . . . . . . 16
3.2.2 How the capitalization technique works for the Spanish case . . . 16
3.2.3 How we deal with capital gains . . . . . . . . . . . . . . . . . . . . 18
3.3 Accounting for Wealth that Does not Generate Taxable Income . . . . . . 18
4 Trends in the Distribution of Wealth before and after the Housing Bubble 22
5 Comparison of our Results with Previous Studies 24
5.1 Wealth Tax . . . . . . . . . . . . . . . . . . . . . . . . . . . . . . . . . . . . 24
5.2 The Survey of Household Finances . . . . . . . . . . . . . . . . . . . . . . 25
5.3 Spain versus US . . . . . . . . . . . . . . . . . . . . . . . . . . . . . . . . . 26
6 Conclusion 28
A Figures 30
3
1 Introduction
The evolution of wealth inequality is currently at the center of the academic and po-
litical debate. Piketty [2014] shows in his prominent book, Capital in the Twenty-First
Century, the importance of analyzing empirically the historical evolution of wealth dis-
tributions. Nonetheless, due to data limitations, the evidence is still scarce.
There exist five main methods to analyze wealth inequality. The first is the estate
multiplier method, that provides a snapshot of the wealth distribution at the time of
death with estate tax records data. The second possible approach is the survey-based
method, which uses survey data with an oversampling of wealthy households. The
third available method is the use of wealth tax returns to analyze the distribution of
wealth. The fourth is the investment income approach, which consists of capitalizing
income tax data in order to arrive to the wealth distribution. Finally, one can also an-
alyze the upper part of the distribution using lists of high-wealth individuals, such
the annual Forbes 400 list. There are conflicting results depending on the method of
analysis used. For instance, Saez and Zucman [2014] find that wealth considerably
increased at the top 0.1% in the US over the last two decades using the income cap-
italization method, contrary to the results obtained using survey data and the estate
multiplier method.
The aim of this research is to analyze wealth inequality in Spain using income tax
micro-data and the investment income method throughout the economic expansion
and the subsequent recession. By analyzing Spain we will contribute to the literature
of wealth inequality in three ways. First, Spain has high-quality income tax samples
with detailed income for each tax unit and income category. They are constructed by
the Spanish Institute of Fiscal Studies (Instituto de Estudios Fiscales) and they cover the
period between 2002 and 2011. Thus, we are able to provide a careful estimation of the
evolution of Spanish wealth shares for the top half of the distribution for years 2002
to 2011. To our knowledge, the few studies that have analyzed wealth concentration
in Spain using tax data have only focused on the top 1%. Second, Spain experienced a
huge increase in aggregate wealth due to a boom in housing prices during this period
of time. Hence, it is interesting to analyze which are the distributional effects of this
economic fact which has not been studied in any academic paper yet. Third, Spain is
4
one of the few countries in the world that has a wealth tax. Thus, from the method-
ological point of view, it is interesting to compare our wealth shares using the income
capitalization method with the shares using wealth tax returns.
The wealth distribution in Spain has been analyzed in the past using three different
data sources. Firstly, Alvaredo and Saez [2009] use wealth tax returns to construct long
run series of wealth concentration for the period 1982 to 2007. The progressive wealth
tax has high exemption levels and only the top 2% or 3% wealthiest individuals file
wealth tax returns. Thus, they limit their analysis of wealth concentration to the top
1% and above. They find that top wealth concentration decreases at the top 1% from
19% in 1982 to 16% in 1992 and then increases to almost 20% in 2007. However, in
contrast to the top 1%, they obtain that the 0.1% falls substantially from over 7% in
1982 to 5.6% in 2007.
Durán-Cabré and Esteller-Moré [2010] also use wealth tax returns to analyze the dis-
tribution of wealth at the top and obtain similar results. Their approach complements
theirs by offering a more precise treatment of the correction of fiscal underassessment
and tax fraud in real estate, which is the main asset in Spaniards’ portfolios.
Secondly, Azpitarte [2010] and Bover [2010] use the 2002 Survey of Household Fi-
nances developed by the Bank of Spain in order to analyze the distribution of wealth
at the top. This analysis can be carried out because the survey is constructed doing
an oversampling of wealthy households. Azpitarte [2010] presents results for the top
10-5%, 5-1% and 1%. Bover [2010] provides shares for the top 50%, top 10%, top 5%
and top 1%. Their estimates for the top 1% are very similar, 13.6% and 13.2%, respec-
tively. However, they are much lower than the results of Alvaredo and Saez [2009]
using wealth tax returns, who obtain that the top 1% holds 20% of total wealth. The
OECD has also published recently a report in which they analyze wealth inequality
across countries (OECD [2015]) using household survey data. They find that the top
1% holds 15.2% in 2011 and that wealth inequality in Spain is lower relative to the
average of other 16 OECD countries.
Finally, Alvaredo and Artola [2015] use inheritance tax statistics to estimate the con-
centration of personal wealth at death in Spain between 1901 and 1958. They compare
their results with the estimates among the living of Alvaredo and Saez [2009] for the
5
period between 1982 and 2007. They find that concentration of wealth at the top 1% of
the distribution was approximately three times larger during the first half of the 20th
century than at the end of the same century.
We follow this branch of the literature by constructing series on the distribution of
wealth using individual income tax data disaggregated by asset class and the invest-
ment income method. This approach involves the application of a capitalization factor
to the distribution of capital income to arrive to an estimate of the wealth distribu-
tion. Capitalization factors are computed for each asset in such a way as to map the
total flow of taxable income to total wealth recorded in Financial and Non-financial
accounts. When combining taxable incomes and aggregate capitalization factors, we
assume that within each asset class capitalization factors are the same for each individ-
ual. By using this methodology, we are able to obtain the wealth distribution of total
aggregate wealth recorded in Financial and Non-Financial Accounts.
In Spain, as in most of countries, not all assets generate taxable income. We account
for them by allocating them on the basis of how they are distributed, in such a way as to
match the distribution of these assets in the Survey of Household Finances developed
by the Bank of Spain. The assets which we account for are owner-occupied housing,
investment and pension funds.
Our new series of top wealth shares for years 2002 to 2011 reveal a generalized drop
in wealth concentration between 2002 and 2006, the years of the boom, followed by a
marked increase in wealth inequality in 2007, the year of the burst of the crisis, and a
subsequent slight decline in concentration until 2011. Furthermore, we find that the
increase in wealth inequality between 2002 and 2011 was a phenomenon concentrated
within the top 10 to 0.5%. The reason is that the dramatic increase in real estate prices
that Spain has experienced during this period of time has benefited upper (but not very
top) wealth holders.
When comparing our top wealth shares with previous studies that use wealth tax
returns (i.e. Alvaredo and Saez [2009]) and the Survey of Household Finances (i.e.
Bover [2010]), we find that our estimates reveal a higher concentration of wealth during
that period of time. For instance, Bover [2010] and Alvaredo and Saez [2009] find a top
1% wealth share of 13.2% and 20% in 2002, respectively. In contrast, we obtain that
6
concentration at the top 1% amounts to 42.3%. These conflicting results arise due to
significant differences in the methodology and the definitions of wealth used by each
of the studies.
The layout of the paper is as follows. Section 2 discusses our definition, and aggre-
gate measures of wealth, together with an analysis of the trends in wealth in the last
20 years in Spain. In Section 3 we carry out an analysis of the distribution of taxable
capital income and we formalize and explain the procedure we have used in order to
obtain wealth shares from income tax data. Our results for the period 2002 to 2011,
derived from using the income capitalization method, are presented in Section 4. In
Section 5 we compare our series with previous studies using other methods and with
the wealth inequality trends in the US obtained by Saez and Zucman [2014]. Finally,
Section 6 concludes. All Figures to which the text refers to are included in the Ap-
pendix at the end of the paper. An Excel file (“Data Appendix”) includes the complete
set of results.
7

2 Wealth: Definition, Data and Trends
2.1 Our Wealth Concept and Data Sources
According to the System of National Accounts (2009), wealth is the current market
value of all the financial and non-financial assets owned by households net of all their
debts.
For financial wealth, that is, for both assets and liabilities, we rely on the latest Fi-
nancial Accounts (SEC 2010, Bank of Spain) for the most recent period (1996 and 2014),
and on previous Financial Accounts (SEC95, Bank of Spain) for the period between
1990 and 1995. Financial Accounts report wealth quarterly and we use mid-year val-
ues.
Households’ financial assets include equities (stocks, investment funds and finan-
cial derivatives), debt assets, cash, deposits, life insurance and pensions. Households’
financial liabilities are composed of loans and other debts.1 It is important to mention
that pension wealth excludes Social Security pensions. Social Security pensions are
promises of future government transfers. As it is stated in Saez and Zucman [2014], in-
cluding them in wealth would thus call for including the present value of future health
care benefits, future government education spending for one’s children, etc., net of
future taxes. Hence, it would not be clear where to stop.
We will only focus on households, excluding non-profit institutions serving house-
holds (NPISH). There are three reasons which explain this decision. First, due to lack
of data, non-profit wealth is not easy attributable to individuals. Second, income
from NPISH is not reported in personal income tax returns. Third, non-profit finan-
cial wealth amounts to around only 1% of household financial wealth between 1996
and 2014 in Spain. Hence, it is a negligible part of wealth and excluding it should not
alter our results.2
Spanish Financial Accounts report financial wealth for the household and NPISH
sector and also for both households and NPISH isolated as separate sectors. However,
1See Table A1 in Appendix.2See Table B1 in Appendix.
8
the level of disaggregation of the Balance Sheets in the latter case is lower than in the
case in which households and NPISH are considered as one single sector. For instance,
whereas the Balance Sheet of the sector of households and NPISH distinguishes among
wealth held in investment funds and wealth held in stocks, the Balance Sheet of the
household sector only provides an aggregate value with the sum of wealth held in
these two assets. In order to have one value for household wealth held in investment
funds and one value for household wealth held in stocks, we assume that they are
proportional to the values of households’ investment funds and stocks in the Balance
Sheet of households and NPISH.
For non-financial wealth, we can not rely on Non-financial Accounts based on the
System of National Accounts. Even though there are some countries that have these
accounts, such as France and United Kingdom, no institution has constructed these
type of statistics for Spain yet. We need to use other statistics instead. Our definition
of household non-financial wealth consists of housing and business assets from self-
employment.
For housing wealth, we use the Housing Market Indicators statistics (Bank of Spain,
2015), which provide the value of household housing wealth for the period between
1987 and 2014. This variable includes the value of all dwellings, main residence and
other state properties, regardless of whether they are rented or not. The series are
constructed based on residential units, average surface, and average market prices.
Our net housing wealth is the result of deducting mortgage loans from household real
estate wealth. We approximate mortgage debts by total household liabilities.
For business assets from self-employment, we use the Survey of Household Fi-
nances (Bank of Spain, 2002, 2005, 2008 and 2011). In order to obtain annual values
for business assets wealth, we first construct the share of business assets over total
housing wealth with the survey data. We decide to use the average percentage for the
four years, which is 10.6%, since shares do not vary much for the four available years
of the survey.3 We then obtain the value of business assets by calculating which is the
amount of housing wealth from the Housing Market Indicators that this average share
3See Table B3 in Appendix.
9
represents for the whole period of analysis.4
We exclude collectibles, since they amount to only 1% of total household wealth
and they are not subject to the personal income tax. Furthermore, we also exclude
consumer durables, which amount to approximately 10% of total household wealth,
because they are not included in the definition of wealth by the System of National
Accounts.5
It is important to keep in mind that the official financial and non-financial data used
fail to capture a large part of the wealth held by households abroad such as the port-
folios of equities, bonds, and mutual fund shares held by Spanish persons through
offshore financial institutions in tax havens. Zucman [2013, 2014] estimates that off-
shore financial wealth amounts to about 8% and 10% of household financial wealth at
the global level and at the European level, respectively. In the case of Spain, this per-
centage might be even larger. According to Zucman [2015], the wealth held by Spanish
people in Switzerland amounts to 80 billion euros in 2013. This already represents
about 4.4% of total household financial wealth, according to our household wealth
data. Hence, when interpreting our results we need to take into account that there is a
significant part of missing wealth.
2.2 Aggregate Wealth Stylized Facts (1990-2013)
Before going into the distributional analysis of wealth, it is important to understand
how wealth has evolved in aggregate terms in Spain.
From a historical perspective, the ratio of household wealth to national income has
followed a U-shaped evolution over the past century, a pattern also seen in other ad-
vanced economies (Artola et al. [2015], Piketty and Zucman [2014]). However, this
process was initially delayed with respect to leading European countries. This finding
is consistent with a long post-Civil war economic stagnation and the larger importance
of agriculture in Spain. Focusing on our period of analysis, the years between 1990 and
4See Table A1 in Appendix.5The shares of both collectibles and consumer durables over total household wealth are obtained
using the 2002 Survey of Household Finances developed by the Bank of Spain. In a future version of thepaper, we plan to include collectibles using wealth tax returns.
10
2013, we observe four stylized facts that have significantly changed the level and com-
position of the stock of wealth in Spain.
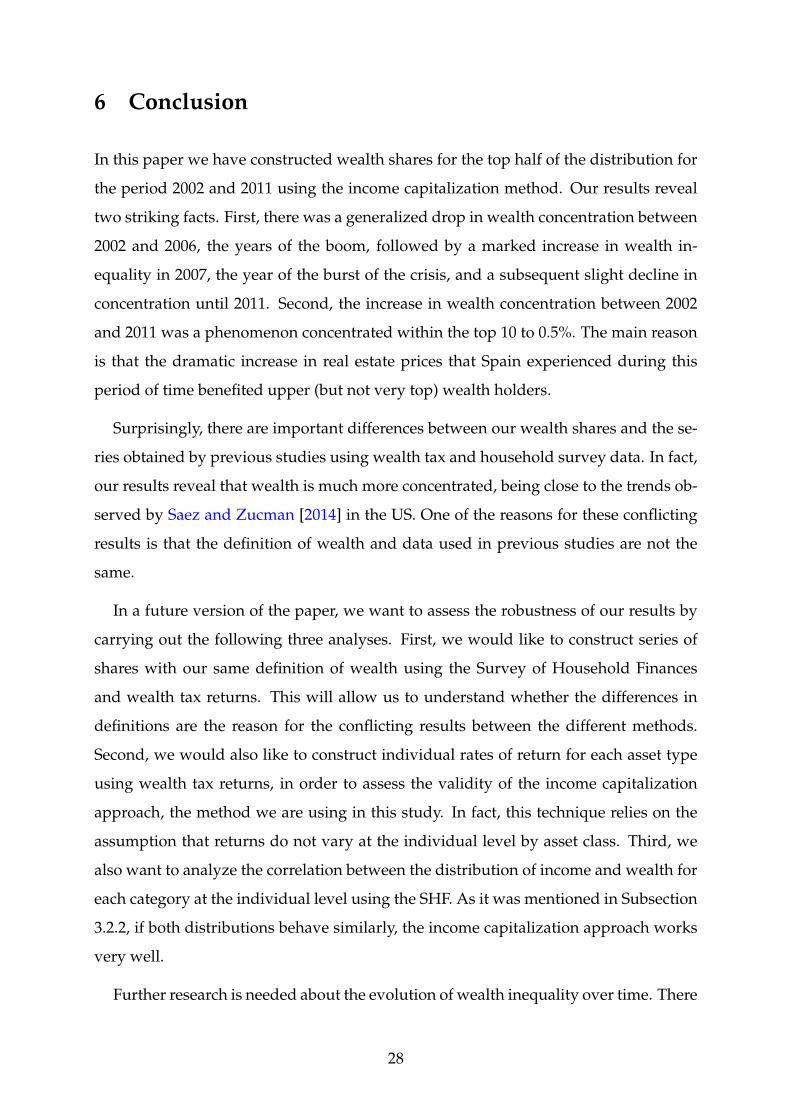
The first stylized fact is that the household wealth to national income ratio has ex-
perienced a huge increase during that period of time. Household wealth amounted to
around 470% of national income from early nineties and it remained stable until mid-
nineties. However, from 1995 onwards, it started to increase rapidly reaching the peak
of 875% of national income in 2007. After the burst of the crisis in 2008, it dropped and
it has been decreasing since then. In 2013, the household wealth to national income
ratio amounted to 649%, a level which is similar to the wealth to national income ratio
of years 2003 and 2004, but much higher than the household wealth to national income
ratios of the nineties (Figure A.1).
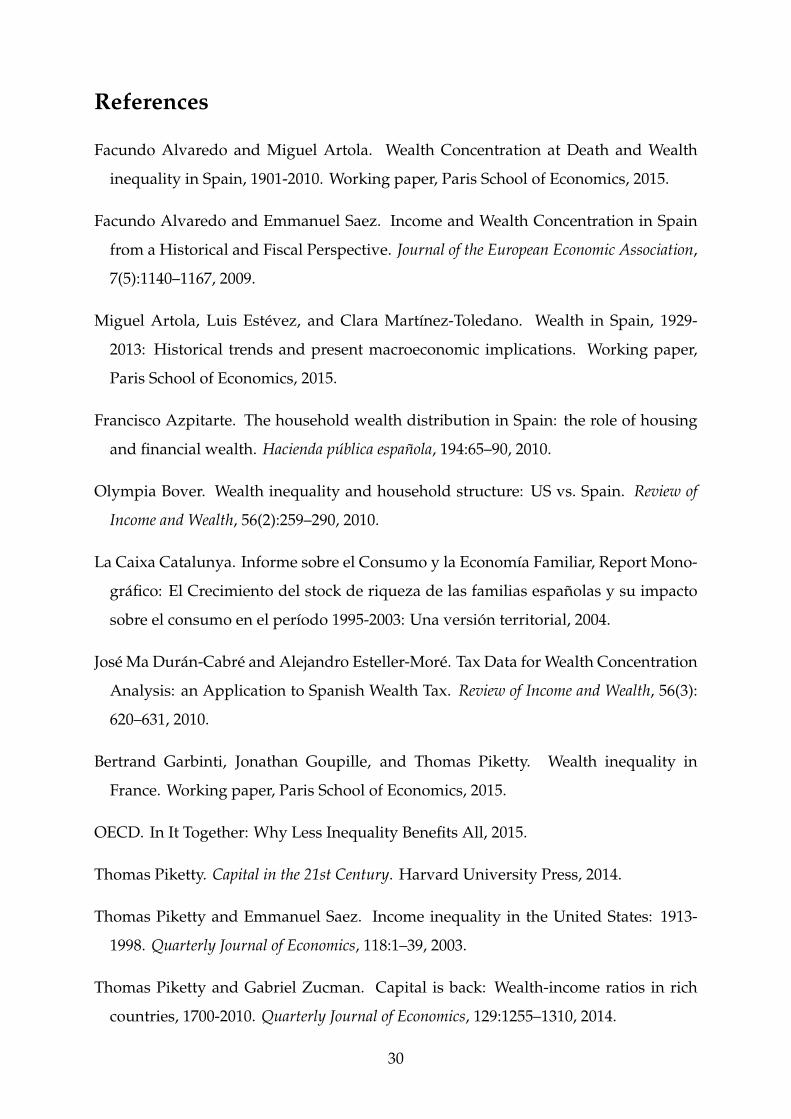
The second stylized fact determines the existence of temporal differences not only in
the growth of total net wealth (as it was pointed out in the first stylized fact), but also
in the growth of its components. In fact, we can clearly distinguish two phases, being
year 1998 the inflection point between the two. During the first phase, from 1990 until
1998, financial assets grew 147% (from 355 up to 877 billion euros), more than three
times the growth in net housing wealth which was 39% (from 852 up to 1180 billion
euros) and the growth in business assets which was 45% (from 103 up to 150 billion
euros). This was mainly driven by the increase in the price of stocks.
Nevertheless, during the second phase, from 1999 until the peak in 2008, net housing
wealth growth amounted to 308% (from 1312 up to 5349 billion euros). The increase
in the accumulation of net housing during the second phase was more than six times
larger than that of financial assets which was 47% (from 948 up to 1170 billion euros)
and more than three times larger than the growth of business assets which was 86%
(from 168 up to 667 billion euros) (Figure A.2).
The third stylized fact points out the different contribution of each of the compo-
nents of wealth to its total growth. Net housing represented 300% over national income
in 1990 and this ratio decreased up to 246% in 1998. However, from 1999 onwards,
when the boom in the price of dwellings started, it sharply increased reaching 592% of
national income in 2007. The evolution of financial assets has been quite different, they
grew from 125% of national income in 1990 up to 185% in 1998. From 1999 onwards,
11
they have been increasing and decreasing, reaching the minimum of 170% in 2002 and
2003, and the maximum of 210% in 2007. Business assets have experienced a similar
evolution to net housing, although they represent a much lower part of wealth. They
decreased from 39% in 1991 up to 31% in 1998. From 1999, they started to increase
reaching the peak of 73% in 2008. Since 2009 they have decreased up to 52% in 2013
(Figure A.1).
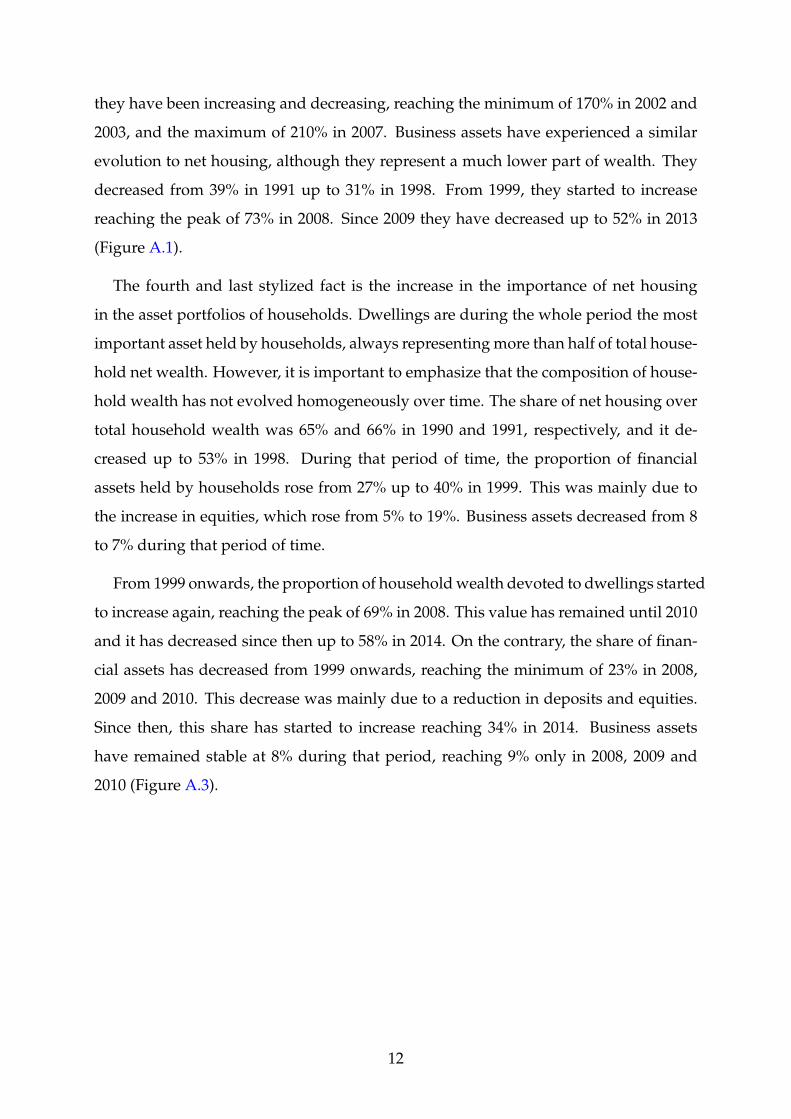
The fourth and last stylized fact is the increase in the importance of net housing
in the asset portfolios of households. Dwellings are during the whole period the most
important asset held by households, always representing more than half of total house-
hold net wealth. However, it is important to emphasize that the composition of house-
hold wealth has not evolved homogeneously over time. The share of net housing over
total household wealth was 65% and 66% in 1990 and 1991, respectively, and it de-
creased up to 53% in 1998. During that period of time, the proportion of financial
assets held by households rose from 27% up to 40% in 1999. This was mainly due to
the increase in equities, which rose from 5% to 19%. Business assets decreased from 8
to 7% during that period of time.
From 1999 onwards, the proportion of household wealth devoted to dwellings started
to increase again, reaching the peak of 69% in 2008. This value has remained until 2010
and it has decreased since then up to 58% in 2014. On the contrary, the share of finan-
cial assets has decreased from 1999 onwards, reaching the minimum of 23% in 2008,
2009 and 2010. This decrease was mainly due to a reduction in deposits and equities.
Since then, this share has started to increase reaching 34% in 2014. Business assets
have remained stable at 8% during that period, reaching 9% only in 2008, 2009 and
2010 (Figure A.3).
12
3 The Income Capitalization Approach: Using Taxable
Capital Income to Obtain the Wealth Distribution
The main goal of our analysis is to construct wealth shares by allocating the total house-
hold wealth depicted in Figure A.1 to the various groups of the distribution. For that,
we need to proceed with the following three steps. Firstly, we start by analyzing the
distribution of taxable capital income at the individual level. Secondly, we have to
capitalize this income. Finally, we need to account for wealth that does not generate
taxable income.
3.1 The distribution of taxable capital income
The starting point is the taxable capital income reported on personal income tax re-
turns. We use personal income tax samples constructed by the Spanish Institute of
Fiscal Studies (Instituto de Estudios Fiscales). They are available for the period between
2002 and 2011 and they provide information for a large sample of taxpayers, with de-
tailed income categories.6 Income tax samples are based on Spain excluding two au-
tonomous regions: País Vasco and Navarra. The reason is that they do not belong to
the Common Fiscal Regime (Régimen Fiscal Común), because they manage their income
taxes directly. Hence, they are excluded from the statistics. These two regions repre-
sent about 6% and 8% of Spain in terms of population and gross domestic product,
respectively.
Different from Piketty and Saez [2003] and Saez and Zucman [2014], our unit of
analysis is the individual aged 20 or above, rather than the tax unit. Since in personal
income tax returns the unit of analysis is the tax unit, we need to transform it into an
individual unit. A tax unit in Spain is defined as a married couple (with or without
dependent children aged less than 18 or aged more than 18 if they are disabled) living
together, or a single adult (with or without dependent children aged less than 18 or
aged more than 18 if they are disabled). Hence, we only need to transform the units
6In a future version of this paper, we plan to extend our period of analysis and cover years 1982 to2011 using the Income Tax Panel constructed by the Spanish Institute of Fiscal Studies.
13
for which the tax return has been jointly made by a married couple. For each of these
units we create a new individual in order to split the joint tax returns into two sepa-
rate individual returns. We assign then half of the capital income jointly reported to
each member of the couple. In 2011, for instance, there are 19.38 million tax units and
23.07 million individual units in the population aged 20 or above. Hence, in 2011 only
19% of tax units file jointly, typically those in the bottom of the distribution, given the
incentives of the tax code to file separately.
Fractiles are defined relative to the total number of individuals aged 20 or above ac-
cording to the Spanish Population Census (Spanish National Statistics Institute, 2015).
In 2011, for instance, the proportion of individual units in personal income tax returns
was 66% of the total population aged 20 or above. We correct for this 34% of missing
individuals by creating one single unit with no capital income, that accounts for this
part of the population.7
Capital income in personal income tax returns includes interests, dividends, real
rents, life insurance income, as well as the profits of sole proprietorships. Before capi-
talizing all these income categories in order to obtain the wealth distribution, we will
analyze the distribution of taxable capital income. Even though our ultimate aim is to
arrive to the wealth distribution, we believe that it is important to first focus on the
distribution of capital income. There are two reasons for that. Firstly, analyzing the
distribution of taxable capital income is a way to check that the income that we have
to capitalize is distributed in a coherent way and that there are no significant jumps
across years due to, for instance, tax reforms. If already the income data are not co-
herently distributed, neither our wealth estimates will be.8 Secondly, the capitalization
technique relies on income data to arrive to wealth estimates. Hence, it is important
to know how this income is distributed before capitalizing it, in order to better under-
stand the evolution of wealth inequality over time.
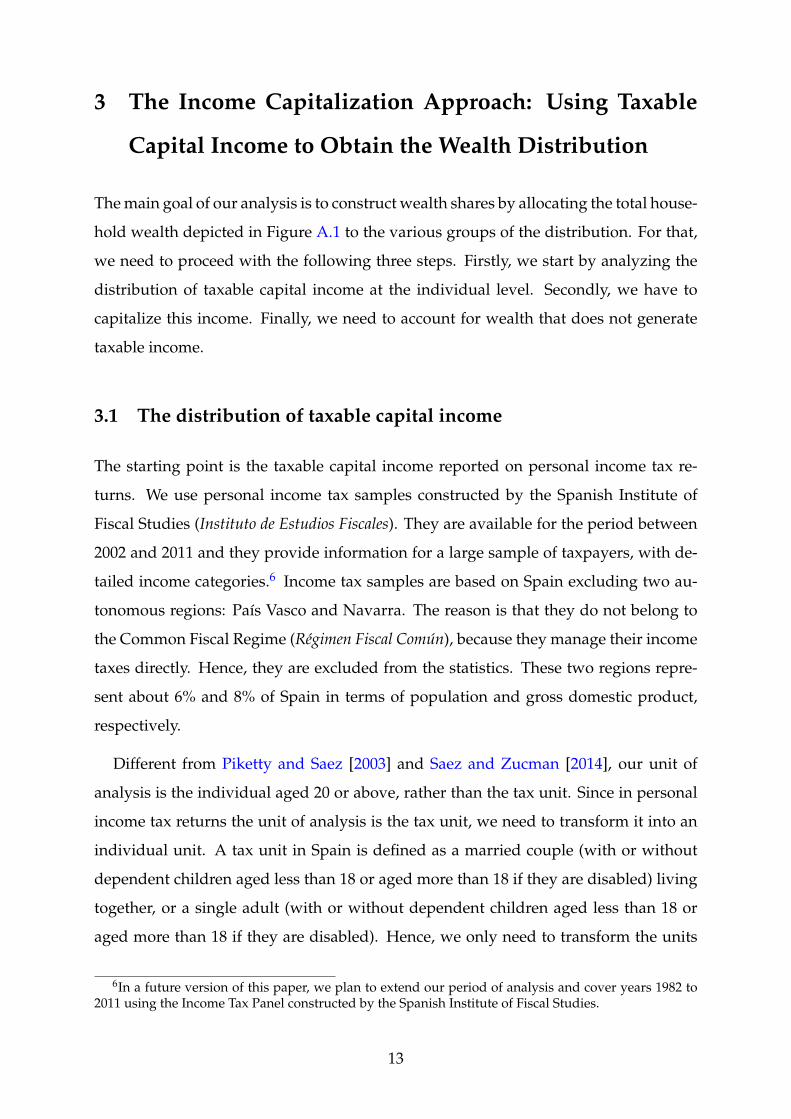
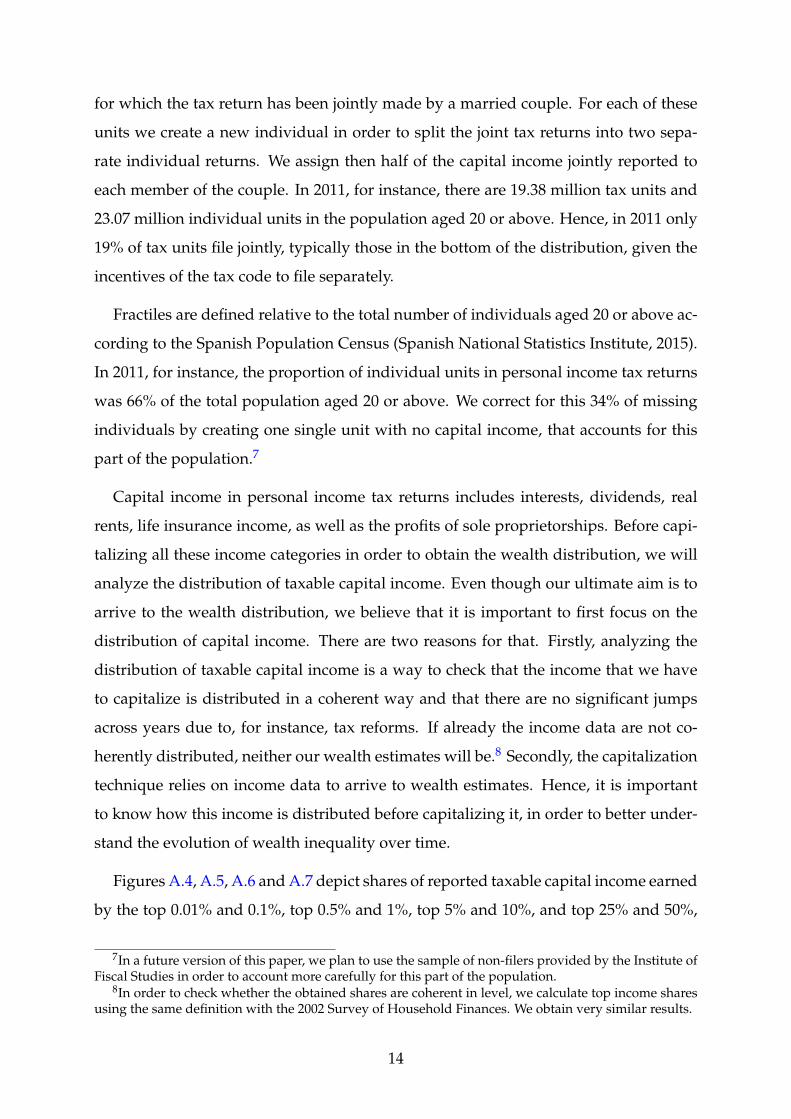
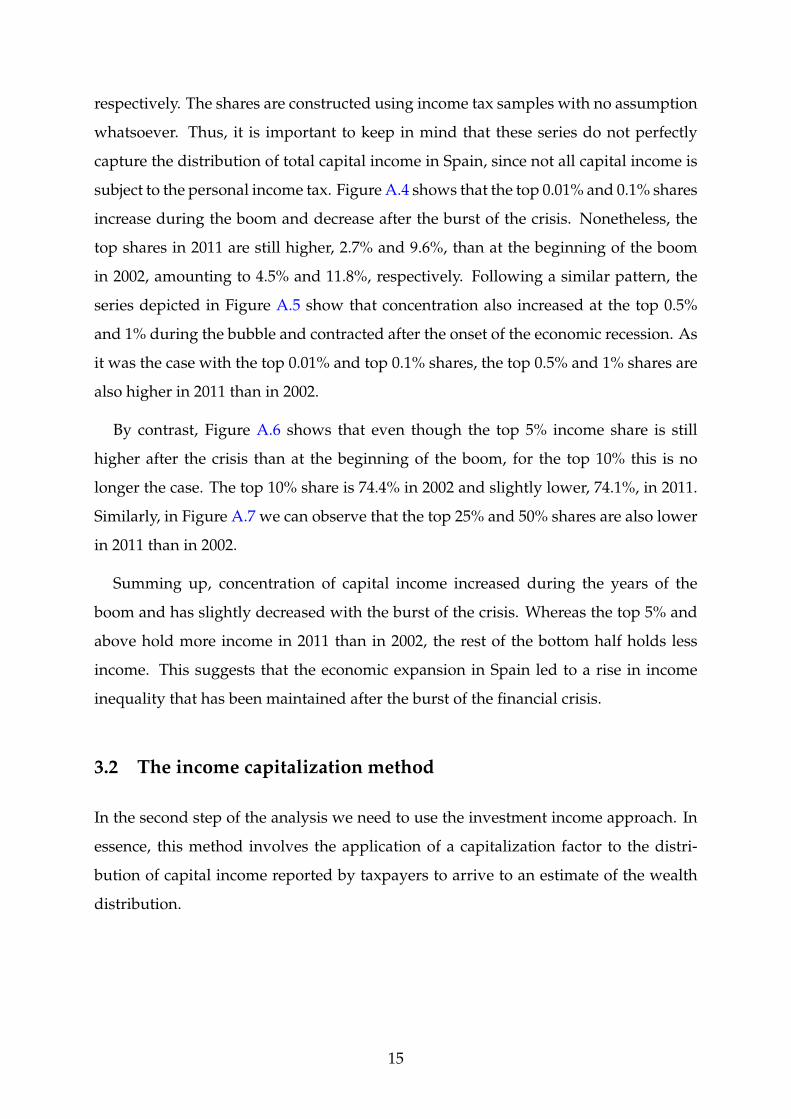
Figures A.4, A.5, A.6 and A.7 depict shares of reported taxable capital income earned
by the top 0.01% and 0.1%, top 0.5% and 1%, top 5% and 10%, and top 25% and 50%,
7In a future version of this paper, we plan to use the sample of non-filers provided by the Institute ofFiscal Studies in order to account more carefully for this part of the population.
8In order to check whether the obtained shares are coherent in level, we calculate top income sharesusing the same definition with the 2002 Survey of Household Finances. We obtain very similar results.
14
respectively. The shares are constructed using income tax samples with no assumption
whatsoever. Thus, it is important to keep in mind that these series do not perfectly
capture the distribution of total capital income in Spain, since not all capital income is
subject to the personal income tax. Figure A.4 shows that the top 0.01% and 0.1% shares
increase during the boom and decrease after the burst of the crisis. Nonetheless, the
top shares in 2011 are still higher, 2.7% and 9.6%, than at the beginning of the boom
in 2002, amounting to 4.5% and 11.8%, respectively. Following a similar pattern, the
series depicted in Figure A.5 show that concentration also increased at the top 0.5%
and 1% during the bubble and contracted after the onset of the economic recession. As
it was the case with the top 0.01% and top 0.1% shares, the top 0.5% and 1% shares are
also higher in 2011 than in 2002.
By contrast, Figure A.6 shows that even though the top 5% income share is still
higher after the crisis than at the beginning of the boom, for the top 10% this is no
longer the case. The top 10% share is 74.4% in 2002 and slightly lower, 74.1%, in 2011.
Similarly, in Figure A.7 we can observe that the top 25% and 50% shares are also lower
in 2011 than in 2002.
Summing up, concentration of capital income increased during the years of the
boom and has slightly decreased with the burst of the crisis. Whereas the top 5% and
above hold more income in 2011 than in 2002, the rest of the bottom half holds less
income. This suggests that the economic expansion in Spain led to a rise in income
inequality that has been maintained after the burst of the financial crisis.
3.2 The income capitalization method
In the second step of the analysis we need to use the investment income approach. In
essence, this method involves the application of a capitalization factor to the distri-
bution of capital income reported by taxpayers to arrive to an estimate of the wealth
distribution.
15
3.2.1 A formal setting
The income capitalization method used in this paper may be set out formally as fol-
lows. An individual i with wealth w invests an amount aij in assets of type j, where j is
an index of the asset classification (j = 1, .., J). If the return obtained by the individual
on asset type j is rj, his investment income by asset type is9:
yij = rj ∗ aij (1)
and his total investment income:
yi =J
∑j=1
rj ∗ aij (2)
Rearranging equation (1), we obtain that the wealth for each individual by asset
type is, thus, the following:
aij = yij/rij (3)
By rearranging equation (2), we get the total wealth for each individual which is:
wi =J
∑j=1
yij ∗ rj (4)
In the next subsection, we will exactly apply this formal setting to the Spanish case,
by capitalizing personal capital income to obtain the distribution of wealth.
3.2.2 How the capitalization technique works for the Spanish case
There are five categories of capital income in personal income tax data: real rental in-
come, business income from self-employment, interests, dividends10 and income from
9Note that we are making the assumption that the rate of return is constant for each asset type, thatis, it does not vary at the individual level.
10Since 2007, dividends are exempted up to 1,500 euros from Spanish personal income tax. We adjustthis exemption by adding 1,500 euros to each filer that declares dividends between 2007 and 2011.
16
life insurance. We weight tax return income for each category in order to match aggre-
gate national income from National Accounts. Once we have tax return income at the
level of National Accounts, we map each income category (e.g., dividends, business
income from self-employment) to a wealth category in the Financial Accounts from
the Bank of Spain (e.g., equities, business assets from self-employment).
As it was mentioned in Section 3.1, income tax data exclude the regions of País Vasco
and Navarra. Therefore, before mapping the taxable income to each wealth category,
we need to adjust wealth in Financial Accounts and national income in National Ac-
counts. Ideally, if we would know the amount of wealth and income in each category
by region, we could simply discount the wealth and income corresponding to País
Vasco and Navarra.
Unfortunately, neither the Bank of Spain nor the National Statistics Institute pro-
vide Financial Accounts and National Accounts for each category disaggregated at the
region level. Nonetheless, the National Statistics Institute provides the value of gross
domestic product at the region level. Hence, we assume that income in each category
excluding País Vasco and Navarra is proportional to total gross domestic product in
Spain excluding these two regions. Total gross domestic product in Spain excluding
País Vasco and Navarra amounts to approximately 92% of total gross domestic prod-
uct. For wealth, we rely on a report published by the financial institution La Caixa
(Caixa Catalunya [2004]). They provide the value of housing wealth by region. The
share of housing wealth excluding País Vasco and Navarra amounts on average for
the whole period of analysis (1995-2003) to 92%. We thus assume that the amount of
wealth in each category is proportional to the value of housing wealth.11
Once we have adjusted income and wealth accordingly, we compute for each cate-
gory a capitalization factor as the ratio of aggregate wealth to tax return income, every
year since 2002. This procedure ensures consistency with the Bank of Spain aggregate
wealth data by construction. In 2011, for instance, there is about 24 billion euros of
reported taxable income from business assets and 558 billion euros of business assets
from self-employees generating taxable income. Hence, the rate of return on taxable
11We plan to include País Vasco and Navarra in a future version of the paper, once we obtain theincome tax samples for these two regions.
17
business assets is 3.3% and the capitalization factor is equal to 24. Capitalization fac-
tors and thus rate of returns, vary across asset types, being for instance higher for rental
income than for debt assets.
As in Saez and Zucman [2014], we obtain our wealth estimates at the individual
level by assuming that within a given asset class, everybody has the same capitaliza-
tion factor. Computing wealth shares by capitalizing income consists of allocating the
wealth for each asset recorded in the Non-financial and Financial Accounts to each
group of the distribution based on how the income for this asset is distributed. Hence,
this method does not require us to know the exact rate of return for each asset type, as
long as the distribution of each capital income category is similar to the distribution of
its corresponding wealth category.
The capitalization method is well suited to estimating the Spanish wealth distribu-
tion because the Spanish income tax code is designed so that a large part of capital
income flows are taxable. However, as we have already mentioned, tax returns do not
include all income categories. In Section 3.3, we carefully account for the assets that do
not generate taxable income.
3.2.3 How we deal with capital gains
In this paper we present our main series focusing on capital income excluding capital
gains. There are two reasons for that. First, realized capital gains are not an annual flow
of income. Second, they are a very volatile component of income, with large aggregate
variations from year to year depending on stock price variations.12
3.3 Accounting for Wealth that Does not Generate Taxable Income
The third and last step consists of dealing with the assets that do not generate taxable
income. In Spain, there are four assets whose generated income is not subject to the
personal income tax: Main owner-occupied housing, investment funds, pensions and
some fixed-income securities.
12We plan to assess the sensitivity of our results to the treatment of capital gains constructing addi-tional series in the future.
18
Although these assets account for a large part of total household wealth, the fact
that they do not generate taxable income does not constitute a non-solvable problem
for one main reason. Spain has a high quality Survey of Household Finances (SHF) that
allows us to allocate all the previous assets on the basis of how they are distributed, in
such a way as to match the distribution of wealth for each of these assets in the SHF.
The Spanish Survey of Household Finances has been conducted by the Bank of
Spain for four waves: 2002, 2005, 2008 and 2011. It is the only statistical source in
Spain that allows the linking of incomes, assets, debts, and consumption at the house-
hold level.
There are two main reasons why this Survey is extremely suitable for our analy-
sis. First, it provides a representative picture of the structure of household incomes,
assets and debts at the household level. Second, it is constructed doing an oversam-
pling of wealthy households. This is achieved on the basis of the wealth tax through a
blind system of collaboration between the National Statistics Institute and the Tax Of-
fice which preserves stringent tax confidentiality. The distribution of wealth is heavily
skewed and some types of assets are held by only a small fraction of the population.
Therefore, unless one is prepared to collect very large samples, oversampling is impor-
tant to achieve representativeness of the population and of aggregate wealth and also,
to enable the study of financial behavior at the top of the wealth distribution.
The assets for which we account are: Net owner-occupied housing, wealth from in-
vestment funds and pensions. Even though some income generated from fixed-income
securities is not taxable, we decide not to account for it since a large part of the income
that fixed-income assets generate is already taxed in the form of interests and divi-
dends. For instance, 74% of total interests were declared in 2011.13
In Spain, the only part of housing that is not subject to the personal income tax is
main residence. The rest of dwellings, either rented or not rented, need to be declared.
In the case of dwellings that are not rented, taxpayers need to declare an imputed rent,
which is a proportion of the rateable value of the dwelling. For instance, in 2011 the
imputed rent that had to be declared was 1.1% of the rateable value of the property in
13See Table A33 in Data Appendix. We might decide to account for the fixed-income assets that arenot taxable in the future in order to assess the sensitivity of our results.
19
case the values were revised after 1 January 1994, and 2% of of the rateable value of the
property in the rest of cases.
The rateable values of properties are underestimated in Spain. For instance, in 2011
the aggregate rateable value of all urban dwellings was two times lower than the ag-
gregate market value provided by the Bank of Spain in the Housing Market Indica-
tors.14 Hence, we prefer not to use the underestimated imputed rents that appear in
personal income tax returns and we will account for both main residence and the rest
of non-rented dwellings using the SHF.
Our imputations are conducted using the 2002 Survey of Household Finances and
they are based on the methodology used by Garbinti et al. [2015] for France. We only
consider individuals aged 20 or above in order to be consistent with our population
of interest in the micro tax data, which are all individuals aged 20 or above. The unit
of analysis used in the SHF is the household. Since we rearrange the micro tax data
in order to have individuals as units of analysis, we proceed in the same way with
the survey in order to be as consistent as possible. If the head of the household is not
married, we assume that all capital income belongs to him. However, if the head of
the household is married, we create a new individual and we split the capital income
of the household among the two. The new individuals are the partners of the heads of
the households that are married and they become now head of households. As labor
income, we only take into account the one generated by each head of household.
The first step of our methodology of imputation consists of constructing groups of
individuals according to their labor and capital income. We first group individuals
by their labor income. We create 7 groups of percentiles: from 0 to 24, from 25 to
49, from 50 to 74, from 75 to 89, from 90 to 94, from 95 to 98, and from 99 to 100.
Secondly, we group individuals according to their capital income. In order for our
imputations to be consistent, we consider as capital income only the one that is subject
to the personal income tax. We create 6 groups of percentiles: from 0 to 24, from 25
to 49, from 50 to 74, from 75 to 89, from 90 to 94, from 95 to 98, and from 99 to 100.
Once we have the individuals sorted by labor and capital income, we combine them
and we end up with 49 different groups. We can then calculate which is the share of
14See Table B4 in Data Appendix.
20
total owner-occupied housing, that is, main residence and other properties that are not
rented, that corresponds to each group. We also construct the same shares for wealth
from investment funds and for pensions.
Our final aim is to impute the value of these assets that do not generate taxable
income to the capitalized distribution of income constructed with the micro tax sam-
ples in order to obtain the distribution of total net wealth. For that, we need to con-
struct with the micro tax data the same groups by age, labor and capital income. Once
we have the individuals in the tax data classified in groups, we can use the shares
that we have obtained with the survey in order to calculate which is the amount of
owner-occupied housing, wealth from investment funds and pensions from Financial
Accounts and Non-financial Accounts that corresponds to each group. Finally, within
each group we allocate the wealth from these assets to all individuals in an homoge-
neous way.
21
4 Trends in the Distribution of Wealth before and after
the Housing Bubble
Our new series of top wealth shares for years 2002 to 2011 reveal a generalized drop
in wealth concentration between 2002 and 2006, the years of the boom, followed by a
marked increase in wealth inequality in 2007, the year of the burst of the crisis, and
a subsequent slight decline in concentration until 2011. If we compare shares at the
beginning of the boom in 2002 and after the economic recession in 2011, we clearly
observe differences between the top 50% to 5% and the top 1% to 0.01% shares.
Figure A.8 displays top wealth shares for three groups within the top half of the
distribution: the top 50%, the top 25% and the top decile. As we can observe, in all
three groups concentration is higher in 2011 than in 2002. For instance, the top 10%
wealth share increases from 67.7% to 72.3% in 2011. Figure A.9 shows that this rise is
not due to the increase in concentration at the top 50-25% nor at the top 25-10%, since
shares are lower in both cases in 2011 as compared to 2002.
In order to understand the mechanisms behind this increase in wealth concentration
at the top 50%, 25% and 10%, we next turn to the analysis of the composition of the top
10%. Figure A.10 reveals that the increase in wealth inequality between 2002 and 2011
is mainly driven by the top 5-1% share and by the top 10-5% to a smaller extent. In
fact, these shares increase from 16.2% and 9.2% up to 22% and 10.4% for the top 5-1%
and 10-5%, respectively, during this period. On the contrary, the top 1% wealth share
decreased in 2011 as compared to 2002.
The reason for this decline can be found on Figures A.11 and A.12. The top 0.5-
0.1%, 0.1-0.01%, 0.1%, 0.1-0.01% and 0.01% shares are lower in 2011 than in 2002. Even
though the top 1-0.5% share increases during that period, the decrease in shares of the
upper part of the distribution is larger, thus, lowering the top 1% wealth share. Hence,
our results reveal that the increase in wealth concentration between 2002 and 2011 was
a phenomenon concentrated within the top 10 to 0.5%. One reasonable explanation for
this finding is that at the very top of the wealth distribution, the surge in stock prices
was not enough to compensate for the dramatic increase in real estate prices, which
benefits upper (but not very top) wealth holders.
22
If we focus on the years of the burst of the crisis, 2007 and 2008, we find a surprising
result. Even though wealth held in equities significantly dropped from 657 to 504 bil-
lion euros between 2007 and 2008, concentration at the top 1 and 10% increased. The
reason is that wealth held in all the other assets rose during these two years and this
increase concentrated on the top 10% almost entirely. Thus, the decrease in wealth held
in equities was more than compensated by the increase in the rest of all other assets.
Consequently, concentration rose between these two years.
Finally, it is important to mention that in Spain, as in many other countries, wealth
inequality is higher than income inequality. If we compare our series of top wealth
shares with the top income shares constructed by Alvaredo and Saez [2009], we find,
for instance, that the top 1% wealth share in 2005 is 33.2%, is more than three times
larger than the top 1% income share which is 8.7%. Similarly, the top 0.01% wealth
share is also higher than the top 0.01% income share. In 2005, these shares were 3.5%
and 0.9%, respectively.
23
5 Comparison of our Results with Previous Studies
5.1 Wealth Tax
The wealth tax in Spain was introduced for the first time in 1978 as by law 50/1977.
Initially, it was meant to be “transitory” and “exceptional”. The tax rate was relatively
small, with a maximum of 2%. The aim of the Spanish wealth tax was basically to com-
plement the Spanish personal income tax, which had limited redistributive goals. Tax
filing was done on an individual basis, with the exception of married couples under
joint tenancy. Since 1988, married couples can file individually.
In 1992, a major reform by the Law 19/1991 put an end to the transitory an excep-
tional character of the tax. It established a strictly individual filing and introduced
changes in some of the included components as well as in their valuation rules. In year
2008, the tax was not abolished but a bonus of 100% was introduced by law 4/2008.
Nevertheless, the economic crisis and the lack of funds of the Spanish Inland Revenue,
reactivated the wealth tax from exercise 2011 (payable in 2012) up to 2014 (payable in
2015).
Alvaredo and Saez [2009] use wealth tax returns and the Pareto interpolation method
to construct long run series of wealth concentration for the period 1982 to 2007. The
progressive wealth tax has high exemption levels and only the top 2% or 3% wealthiest
individuals file wealth tax returns. Thus, they limit their analysis of wealth concentra-
tion to the top 1% and above. They find that top wealth concentration decreases at
the top 1% from 19% in 1982 to 16% in 1992 and then increases to almost 20% in 2007.
However, in contrast to the top 1%, they obtain that the 0.1% falls substantially from
over 7% in 1982 to 5.6% in 2007.
In line with the trend observed by Alvaredo and Saez [2009] until 2007, our estimates
also reveal a fall in concentration at the very top and an increase in the upper (but not
very top) part of the distribution. Nevertheless, Figure A.13 shows that concentration
at the top 1% is much higher than what Alvaredo and Saez [2009] find. For instance,
whereas they obtain a top 1% wealth share of 18.9% in 2005, we find that the top 1%
wealth share in 2005 is 33.8%. Durán-Cabré and Esteller-Moré [2010] also use wealth
24
tax returns to analyze the distribution of wealth at the top and obtain similar results
to them. Their approach complements theirs by offering a more precise treatment of
the correction of fiscal underassessment and tax fraud in real estate, which is the main
asset in Spaniards’ portfolios.
One of the potential reasons why we obtain different results is because the definition
of wealth used by Alvaredo and Saez [2009] differs from our definition in the following
aspects. First, they consider the wealth of both households and non-profit institutions
serving households rather than only household wealth. Second, they exclude pensions
from the wealth denominator and they do not include business assets. Third, they use
real state declared, being for some individuals the cadastral value. By contrast, we
impute wealth from owner-occupied housing using the Survey of Household Finances
and the Housing Market Indicators using series at market prices. Another difference
with respect to our methodology is that they use the Pareto interpolation method in
order to obtain top wealth shares because they have aggregate data. Finally, one last
difference is that they use tax units as units of analysis and we use individual units
instead.15
5.2 The Survey of Household Finances
As we have seen in Section 3.3.1, the Survey of Household Finances can be used to
analyze the distribution of wealth because it is constructed doing an oversampling of
wealthy individuals. Azpitarte [2010] and Bover [2010] use the 2002 survey in order
to analyze the distribution of wealth at the top. Azpitarte [2010] presents results for
the top 10-5%, 5-1% and 1%. Bover [2010] provides shares for the top 50%, top 10%,
top 5% and top 1%. Their estimates for the top 1% are very similar, 13.6% and 13.2%,
respectively. However, they are lower than the results of Alvaredo and Saez [2009]
using wealth tax returns, who obtain that the top 1% holds 20% of total wealth. Besides,
they are much lower than our top 1% estimate for 2002, which is 42.3%.
The OECD has also published very recently a paper (OECD [2015]) in which they
15In a future version of the paper, we plan to compute top wealth shares using wealth tax returns atthe individual level. These results will provide more evidence to assess which of the sources works bestin order to analyze the wealth distribution in Spain.
25
construct top wealth shares using the 2011 SHF. They find that concentration at the
top is lower than the OECD average considering other 16 countries. Comparing their
results with the ones using tax data, we find that the top 1% is lower than in the case
wealth tax or capitalized income data are used. For instance, the top 1% in 2011 us-
ing capitalized income data is 39.9% and the one obtained by OECD [2015] is 15.2%.
Figure A.13 shows top 1% wealth shares for all the mentioned studies.
There are notable differences in terms of definitions and methodology between our
estimates and the studies using the SHF. First, we use individual units while the SHF
uses households to define each fractile. Second, they use a different definition of
wealth. Azpitarte [2010] includes collectibles, Bover [2010] also considers consumer
durables on top of collectibles, and OECD [2015] excludes pension wealth and incor-
porates collectibles and consumer durables to its definition of wealth as well.
As with all surveys, it is a challenge for the SHF to accurately capture wealthy in-
dividuals because of limited sample size and low response rates at the very top, so as
it is the case with income, wealth shares tend to be lower using survey data instead of
tax data. This is also the case in the US, as documented by Saez and Zucman [2014].
5.3 Spain versus US
In order to have an idea about the level of wealth concentration in a country, it is
always very interesting to make comparisons across nations. Saez and Zucman [2014]
estimate the distribution of wealth in the US using the income capitalization method.
They find that wealth concentration has followed a U-shaped evolution over the past
100 years. It was high in the beginning of the twentieth century, fell from 1929 to 1978,
and has continuously increased since then. Their series of wealth shares reveal that the
rise in wealth inequality is almost entirely due to the rise of the top 0.1% share.
All previous studies about wealth concentration in Spain found that wealth inequal-
ity was considerably lower than in the US. Surprisingly, our findings reveal that the
level of wealth concentration is Spain is similar to the US, even higher for some years
and groups of the distribution. As it can be observed in Figure A.14, the concentration
at the top 10% in Spain is only by 1 to 6% lower than in the US except for year 2008
26
in which Spain has a slightly higher level of concentration. If we look at the top 5%
wealth share in Figure A.15, we observe that it is higher is Spain for years 2002, 2003,
2008 and 2009 and lower for the rest of the period. The differences range again between
1 and 6%. Nevertheless, very top wealth holders in the US do not hold at any period
less wealth than Spanish top wealth holders. As it can be observed in Figure A.16,
whereas the top 0.01% is 10% for the US in 2011, it is 5% in Spain.
27
6 Conclusion
In this paper we have constructed wealth shares for the top half of the distribution for
the period 2002 and 2011 using the income capitalization method. Our results reveal
two striking facts. First, there was a generalized drop in wealth concentration between
2002 and 2006, the years of the boom, followed by a marked increase in wealth in-
equality in 2007, the year of the burst of the crisis, and a subsequent slight decline in
concentration until 2011. Second, the increase in wealth concentration between 2002
and 2011 was a phenomenon concentrated within the top 10 to 0.5%. The main reason
is that the dramatic increase in real estate prices that Spain experienced during this
period of time benefited upper (but not very top) wealth holders.
Surprisingly, there are important differences between our wealth shares and the se-
ries obtained by previous studies using wealth tax and household survey data. In fact,
our results reveal that wealth is much more concentrated, being close to the trends ob-
served by Saez and Zucman [2014] in the US. One of the reasons for these conflicting
results is that the definition of wealth and data used in previous studies are not the
same.
In a future version of the paper, we want to assess the robustness of our results by
carrying out the following three analyses. First, we would like to construct series of
shares with our same definition of wealth using the Survey of Household Finances
and wealth tax returns. This will allow us to understand whether the differences in
definitions are the reason for the conflicting results between the different methods.
Second, we would also like to construct individual rates of return for each asset type
using wealth tax returns, in order to assess the validity of the income capitalization
approach, the method we are using in this study. In fact, this technique relies on the
assumption that returns do not vary at the individual level by asset class. Third, we
also want to analyze the correlation between the distribution of income and wealth for
each category at the individual level using the SHF. As it was mentioned in Subsection
3.2.2, if both distributions behave similarly, the income capitalization approach works
very well.
Further research is needed about the evolution of wealth inequality over time. There
28

are conflicting results among studies that need to be better explained. Although some-
times it may be forgotten, how wealth is concentrated extremely matters from the pol-
icy point of view. It can help in the designing of policies aimed at achieving a more
equitable system that at the same time could create new sources of economic growth.
29
References
Facundo Alvaredo and Miguel Artola. Wealth Concentration at Death and Wealth
inequality in Spain, 1901-2010. Working paper, Paris School of Economics, 2015.
Facundo Alvaredo and Emmanuel Saez. Income and Wealth Concentration in Spain
from a Historical and Fiscal Perspective. Journal of the European Economic Association,
7(5):1140–1167, 2009.
Miguel Artola, Luis Estévez, and Clara Martínez-Toledano. Wealth in Spain, 1929-
2013: Historical trends and present macroeconomic implications. Working paper,
Paris School of Economics, 2015.
Francisco Azpitarte. The household wealth distribution in Spain: the role of housing
and financial wealth. Hacienda pública española, 194:65–90, 2010.
Olympia Bover. Wealth inequality and household structure: US vs. Spain. Review of
Income and Wealth, 56(2):259–290, 2010.
La Caixa Catalunya. Informe sobre el Consumo y la Economía Familiar, Report Mono-
gráfico: El Crecimiento del stock de riqueza de las familias españolas y su impacto
sobre el consumo en el período 1995-2003: Una versión territorial, 2004.
José Ma Durán-Cabré and Alejandro Esteller-Moré. Tax Data for Wealth Concentration
Analysis: an Application to Spanish Wealth Tax. Review of Income and Wealth, 56(3):
620–631, 2010.
Bertrand Garbinti, Jonathan Goupille, and Thomas Piketty. Wealth inequality in
France. Working paper, Paris School of Economics, 2015.
OECD. In It Together: Why Less Inequality Benefits All, 2015.
Thomas Piketty. Capital in the 21st Century. Harvard University Press, 2014.
Thomas Piketty and Emmanuel Saez. Income inequality in the United States: 1913-
1998. Quarterly Journal of Economics, 118:1–39, 2003.
Thomas Piketty and Gabriel Zucman. Capital is back: Wealth-income ratios in rich
countries, 1700-2010. Quarterly Journal of Economics, 129:1255–1310, 2014.
30
Emmanuel Saez and Gabriel Zucman. Wealth inequality in the United States since
1913. Working paper, 2014.
Gabriel Zucman. The Missing Wealth of Nations: Are Europe and the US net Debtors
or net Creditors?*. The Quarterly Journal of economics, 128(3):1321–1364, 2013.
Gabriel Zucman. Taxing across borders: Tracking personal wealth and corporate prof-
its. The Journal of Economic Perspectives, pages 121–148, 2014.
Gabriel Zucman. The Hidden Wealth of Nations. University of Chicago Press Economics
Books, 2015.
31
Appendices
Figure .1: The composition of household wealth to national income in SpainSource: Own elaboration with data from Bank of Spain
Figure .2: The composition of household wealth in SpainSource: Own elaboration with data from Bank of Spain (in billion of euros)
32
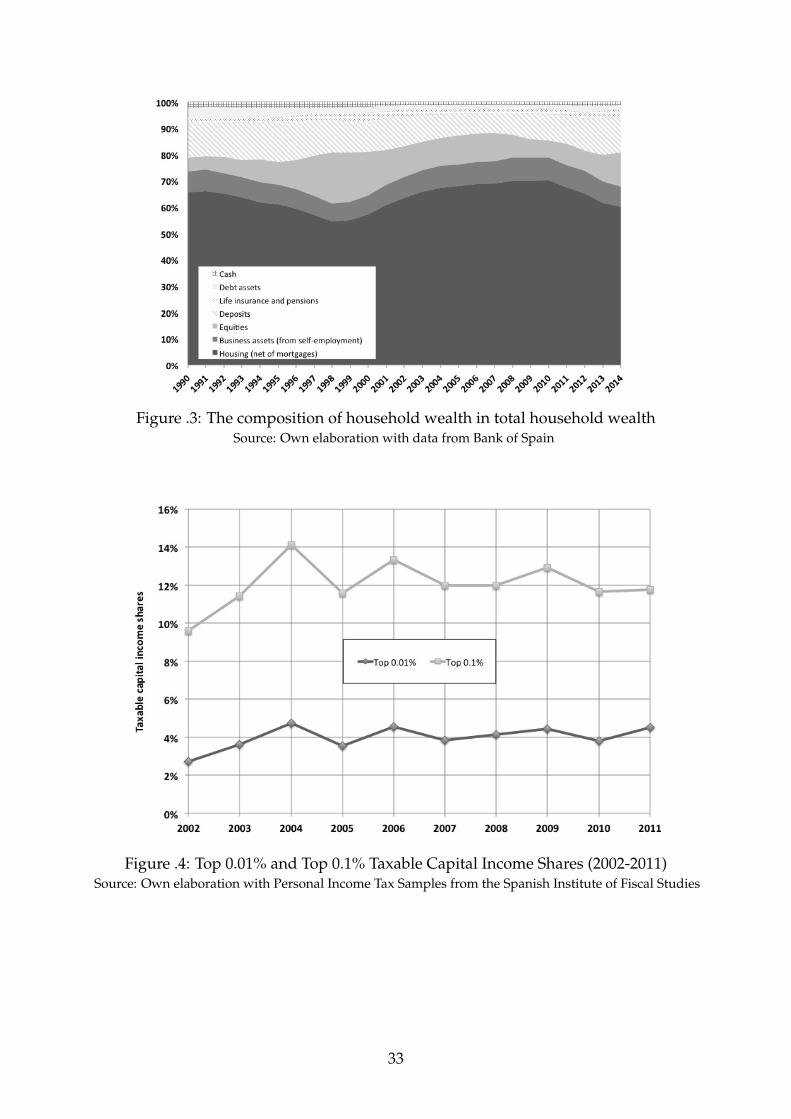
Figure .3: The composition of household wealth in total household wealthSource: Own elaboration with data from Bank of Spain
Figure .4: Top 0.01% and Top 0.1% Taxable Capital Income Shares (2002-2011)Source: Own elaboration with Personal Income Tax Samples from the Spanish Institute of Fiscal Studies
33
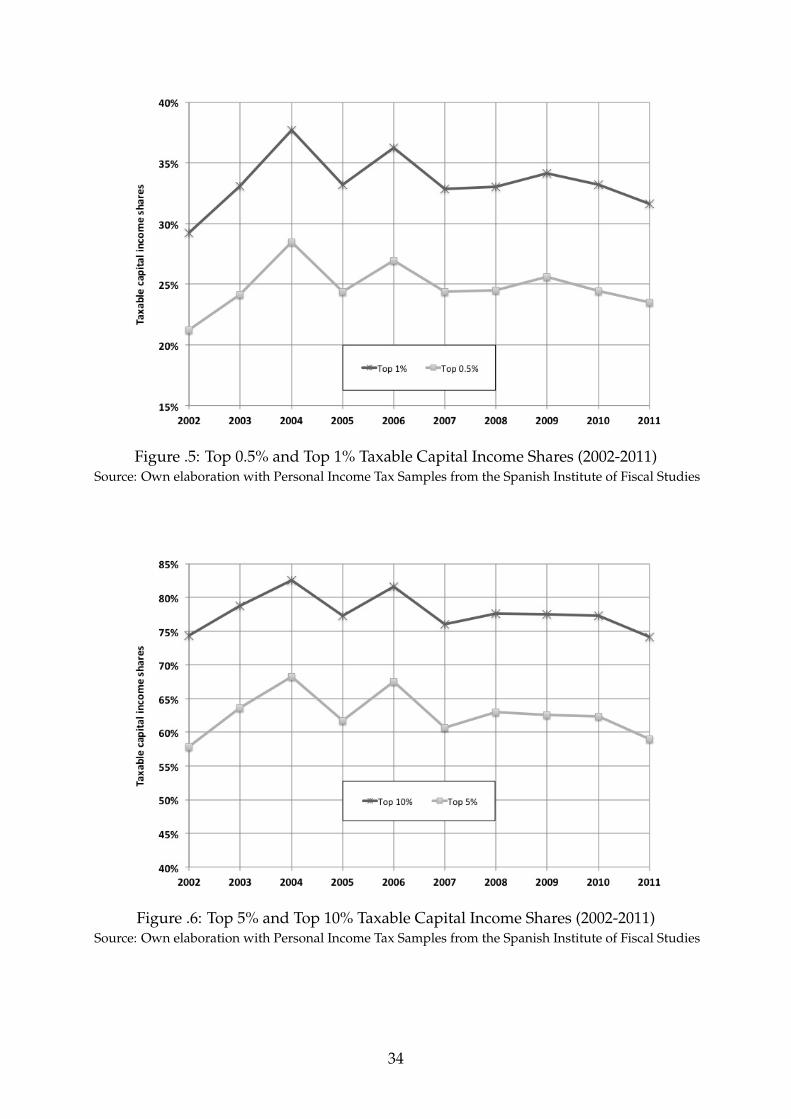
Figure .5: Top 0.5% and Top 1% Taxable Capital Income Shares (2002-2011)Source: Own elaboration with Personal Income Tax Samples from the Spanish Institute of Fiscal Studies
Figure .6: Top 5% and Top 10% Taxable Capital Income Shares (2002-2011)Source: Own elaboration with Personal Income Tax Samples from the Spanish Institute of Fiscal Studies
34
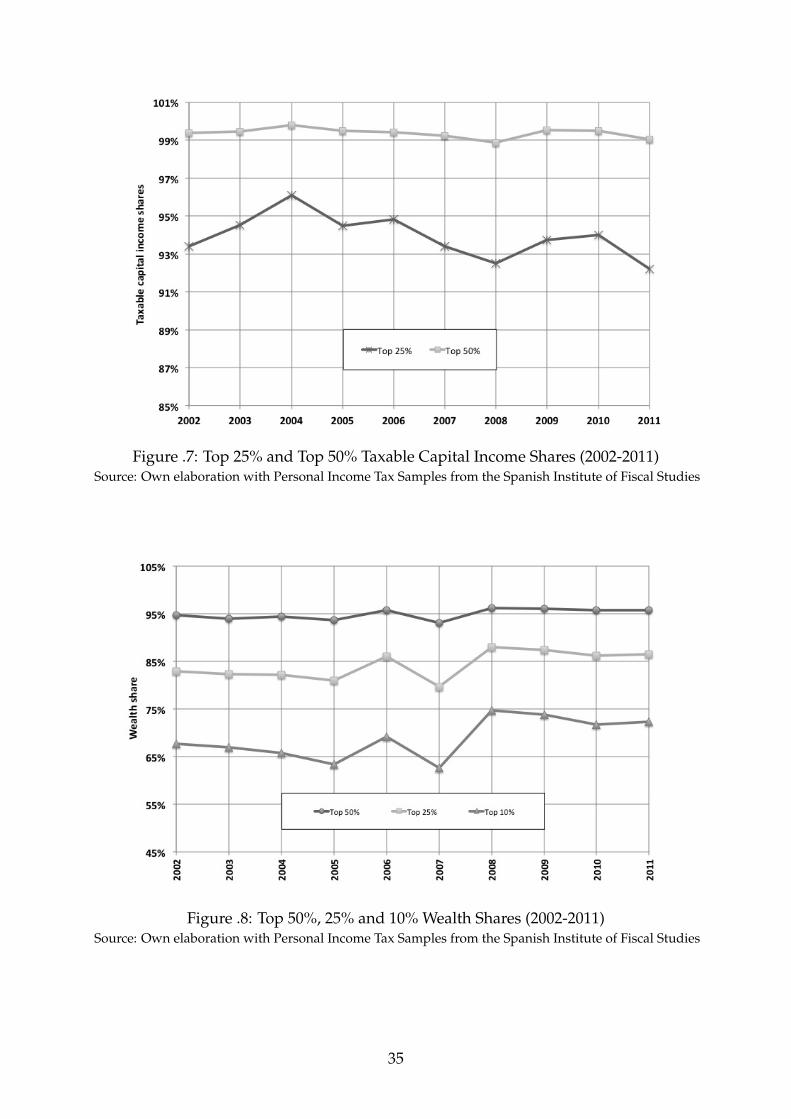
Figure .7: Top 25% and Top 50% Taxable Capital Income Shares (2002-2011)Source: Own elaboration with Personal Income Tax Samples from the Spanish Institute of Fiscal Studies
Figure .8: Top 50%, 25% and 10% Wealth Shares (2002-2011)Source: Own elaboration with Personal Income Tax Samples from the Spanish Institute of Fiscal Studies
35
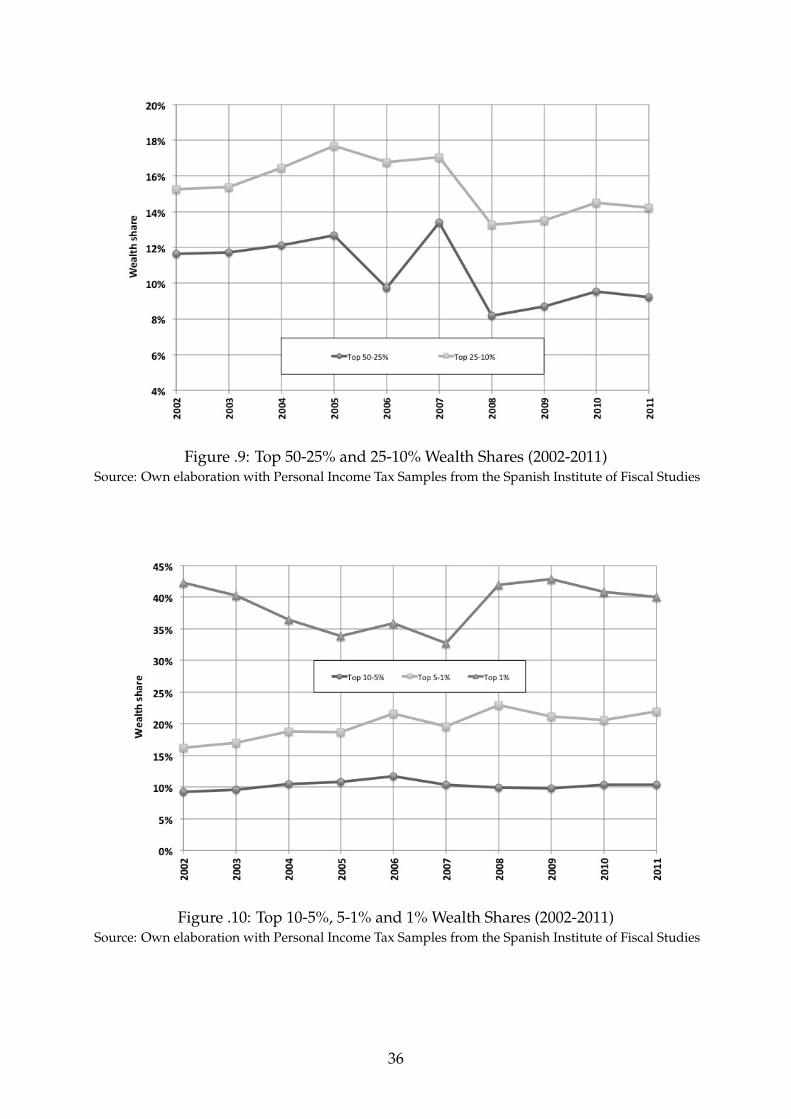
Figure .9: Top 50-25% and 25-10% Wealth Shares (2002-2011)Source: Own elaboration with Personal Income Tax Samples from the Spanish Institute of Fiscal Studies
Figure .10: Top 10-5%, 5-1% and 1% Wealth Shares (2002-2011)Source: Own elaboration with Personal Income Tax Samples from the Spanish Institute of Fiscal Studies
36
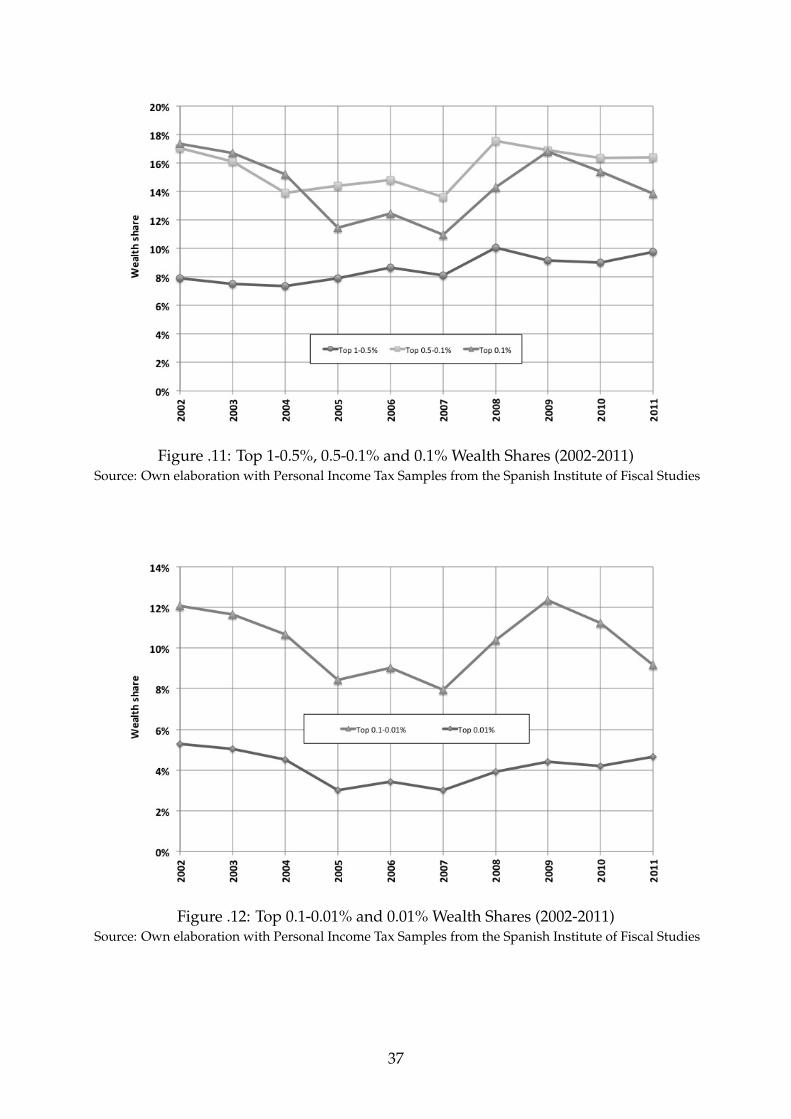
Figure .11: Top 1-0.5%, 0.5-0.1% and 0.1% Wealth Shares (2002-2011)Source: Own elaboration with Personal Income Tax Samples from the Spanish Institute of Fiscal Studies
Figure .12: Top 0.1-0.01% and 0.01% Wealth Shares (2002-2011)Source: Own elaboration with Personal Income Tax Samples from the Spanish Institute of Fiscal Studies
37
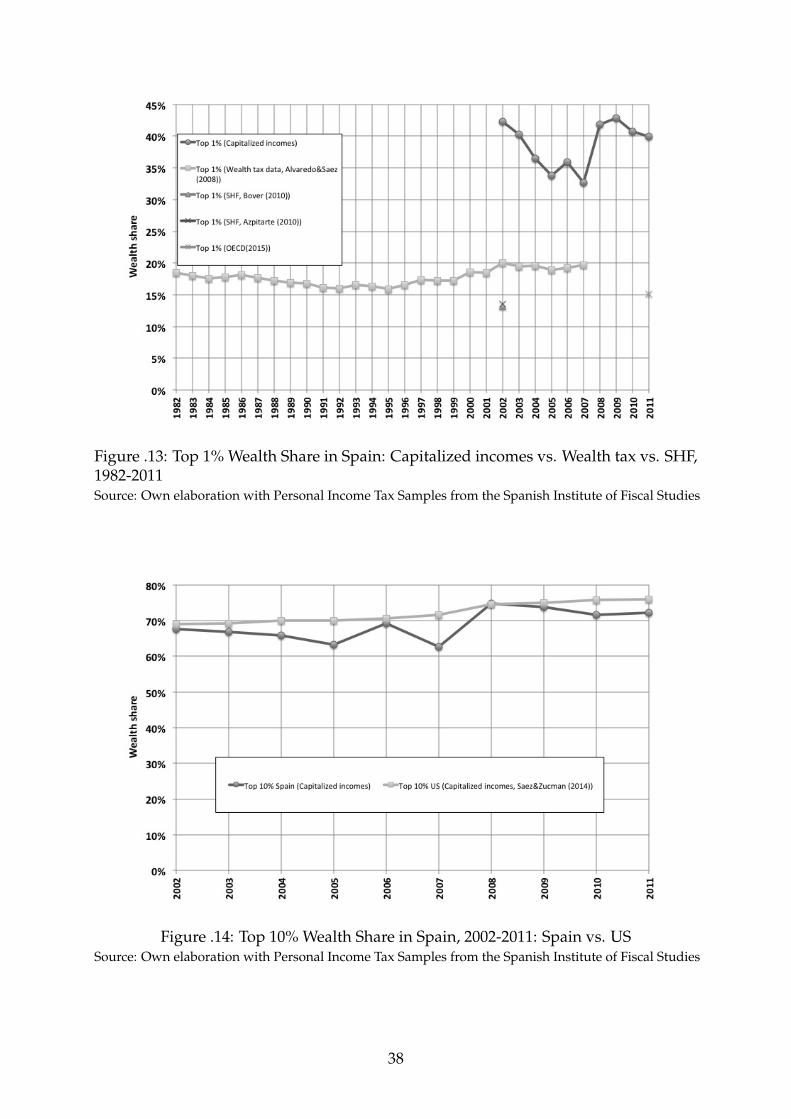
Figure .13: Top 1% Wealth Share in Spain: Capitalized incomes vs. Wealth tax vs. SHF,1982-2011Source: Own elaboration with Personal Income Tax Samples from the Spanish Institute of Fiscal Studies
Figure .14: Top 10% Wealth Share in Spain, 2002-2011: Spain vs. USSource: Own elaboration with Personal Income Tax Samples from the Spanish Institute of Fiscal Studies
38
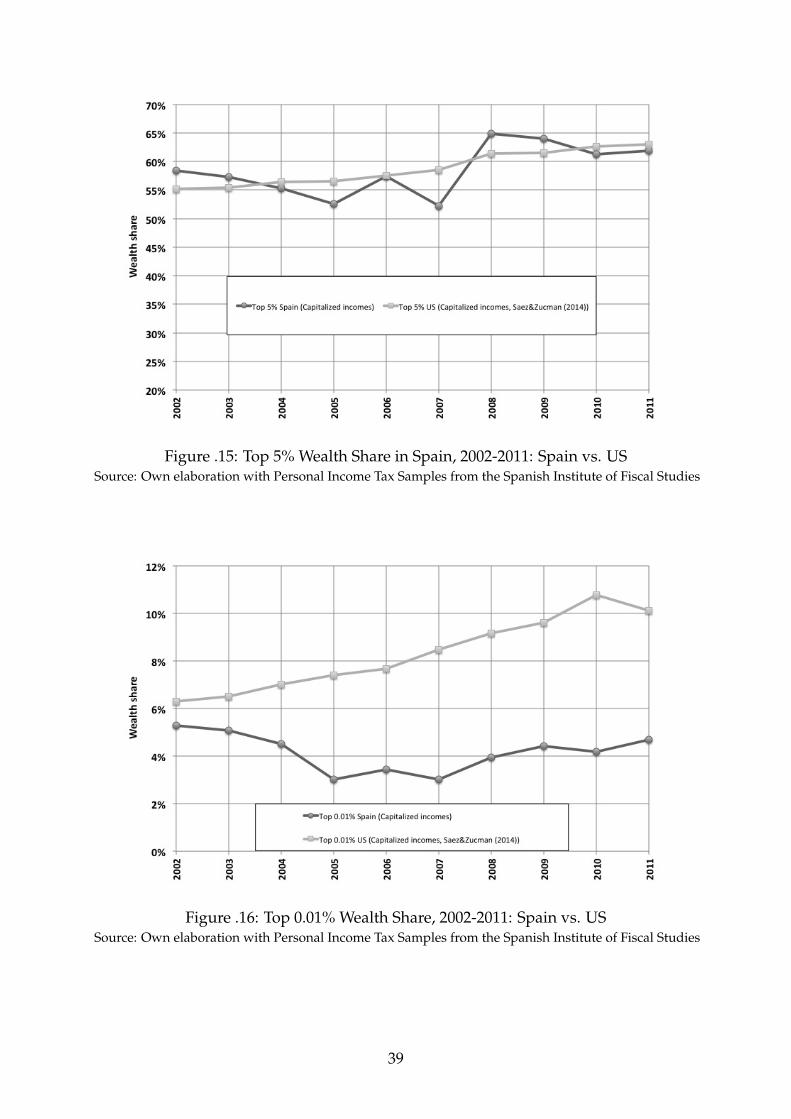
Figure .15: Top 5% Wealth Share in Spain, 2002-2011: Spain vs. USSource: Own elaboration with Personal Income Tax Samples from the Spanish Institute of Fiscal Studies
Figure .16: Top 0.01% Wealth Share, 2002-2011: Spain vs. USSource: Own elaboration with Personal Income Tax Samples from the Spanish Institute of Fiscal Studies
39
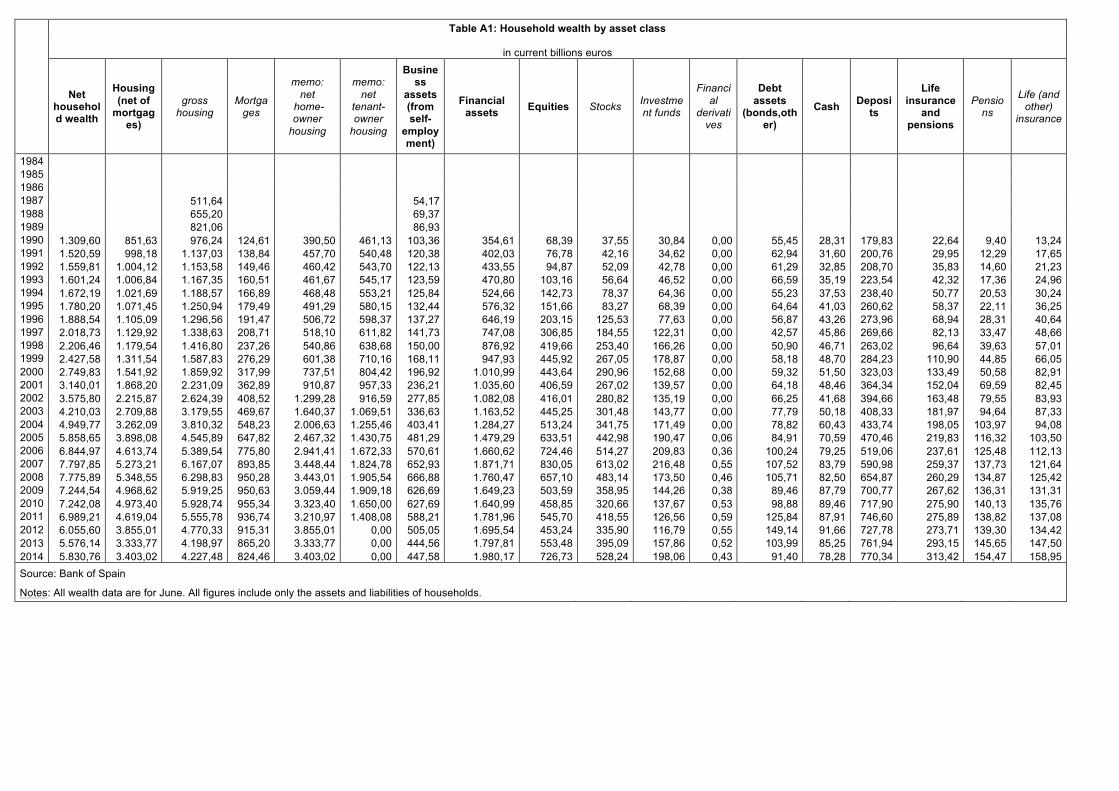
Table A1: Household wealth by asset class
in current billions euros
Net household wealth
Housing (net of
mortgages)
gross housing
Mortgages
memo: net
home-owner
housing
memo: net
tenant-owner
housing
Business
assets (from self-
employment)
Financial assets Equities Stocks Investme
nt funds
Financial
derivatives
Debt assets
(bonds,other)
Cash Deposits
Life insurance
and pensions
Pensions
Life (and other)
insurance
1984 1985 1986 1987 511,64 54,17 1988 655,20 69,37 1989 821,06 86,93 1990 1.309,60 851,63 976,24 124,61 390,50 461,13 103,36 354,61 68,39 37,55 30,84 0,00 55,45 28,31 179,83 22,64 9,40 13,24 1991 1.520,59 998,18 1.137,03 138,84 457,70 540,48 120,38 402,03 76,78 42,16 34,62 0,00 62,94 31,60 200,76 29,95 12,29 17,65 1992 1.559,81 1.004,12 1.153,58 149,46 460,42 543,70 122,13 433,55 94,87 52,09 42,78 0,00 61,29 32,85 208,70 35,83 14,60 21,23 1993 1.601,24 1.006,84 1.167,35 160,51 461,67 545,17 123,59 470,80 103,16 56,64 46,52 0,00 66,59 35,19 223,54 42,32 17,36 24,96 1994 1.672,19 1.021,69 1.188,57 166,89 468,48 553,21 125,84 524,66 142,73 78,37 64,36 0,00 55,23 37,53 238,40 50,77 20,53 30,24 1995 1.780,20 1.071,45 1.250,94 179,49 491,29 580,15 132,44 576,32 151,66 83,27 68,39 0,00 64,64 41,03 260,62 58,37 22,11 36,25 1996 1.888,54 1.105,09 1.296,56 191,47 506,72 598,37 137,27 646,19 203,15 125,53 77,63 0,00 56,87 43,26 273,96 68,94 28,31 40,64 1997 2.018,73 1.129,92 1.338,63 208,71 518,10 611,82 141,73 747,08 306,85 184,55 122,31 0,00 42,57 45,86 269,66 82,13 33,47 48,66 1998 2.206,46 1.179,54 1.416,80 237,26 540,86 638,68 150,00 876,92 419,66 253,40 166,26 0,00 50,90 46,71 263,02 96,64 39,63 57,01 1999 2.427,58 1.311,54 1.587,83 276,29 601,38 710,16 168,11 947,93 445,92 267,05 178,87 0,00 58,18 48,70 284,23 110,90 44,85 66,05 2000 2.749,83 1.541,92 1.859,92 317,99 737,51 804,42 196,92 1.010,99 443,64 290,96 152,68 0,00 59,32 51,50 323,03 133,49 50,58 82,91 2001 3.140,01 1.868,20 2.231,09 362,89 910,87 957,33 236,21 1.035,60 406,59 267,02 139,57 0,00 64,18 48,46 364,34 152,04 69,59 82,45 2002 3.575,80 2.215,87 2.624,39 408,52 1.299,28 916,59 277,85 1.082,08 416,01 280,82 135,19 0,00 66,25 41,68 394,66 163,48 79,55 83,93 2003 4.210,03 2.709,88 3.179,55 469,67 1.640,37 1.069,51 336,63 1.163,52 445,25 301,48 143,77 0,00 77,79 50,18 408,33 181,97 94,64 87,33 2004 4.949,77 3.262,09 3.810,32 548,23 2.006,63 1.255,46 403,41 1.284,27 513,24 341,75 171,49 0,00 78,82 60,43 433,74 198,05 103,97 94,08 2005 5.858,65 3.898,08 4.545,89 647,82 2.467,32 1.430,75 481,29 1.479,29 633,51 442,98 190,47 0,06 84,91 70,59 470,46 219,83 116,32 103,50 2006 6.844,97 4.613,74 5.389,54 775,80 2.941,41 1.672,33 570,61 1.660,62 724,46 514,27 209,83 0,36 100,24 79,25 519,06 237,61 125,48 112,13 2007 7.797,85 5.273,21 6.167,07 893,85 3.448,44 1.824,78 652,93 1.871,71 830,05 613,02 216,48 0,55 107,52 83,79 590,98 259,37 137,73 121,64 2008 7.775,89 5.348,55 6.298,83 950,28 3.443,01 1.905,54 666,88 1.760,47 657,10 483,14 173,50 0,46 105,71 82,50 654,87 260,29 134,87 125,42 2009 7.244,54 4.968,62 5.919,25 950,63 3.059,44 1.909,18 626,69 1.649,23 503,59 358,95 144,26 0,38 89,46 87,79 700,77 267,62 136,31 131,31 2010 7.242,08 4.973,40 5.928,74 955,34 3.323,40 1.650,00 627,69 1.640,99 458,85 320,66 137,67 0,53 98,88 89,46 717,90 275,90 140,13 135,76 2011 6.989,21 4.619,04 5.555,78 936,74 3.210,97 1.408,08 588,21 1.781,96 545,70 418,55 126,56 0,59 125,84 87,91 746,60 275,89 138,82 137,08 2012 6.055,60 3.855,01 4.770,33 915,31 3.855,01 0,00 505,05 1.695,54 453,24 335,90 116,79 0,55 149,14 91,66 727,78 273,71 139,30 134,42 2013 5.576,14 3.333,77 4.198,97 865,20 3.333,77 0,00 444,56 1.797,81 553,48 395,09 157,86 0,52 103,99 85,25 761,94 293,15 145,65 147,50 2014 5.830,76 3.403,02 4.227,48 824,46 3.403,02 0,00 447,58 1.980,17 726,73 528,24 198,06 0,43 91,40 78,28 770,34 313,42 154,47 158,95 Source: Bank of Spain
Notes: All wealth data are for June. All figures include only the assets and liabilities of households.

Table B1: Non-profit institutions serving households wealth by asset class
(in billions of current euros)
Net
Financial Wealth
Financial liabilities
Financial assets
Financial assets Equity assets Stocks Investment
funds Financial
Derivatives
Life (and other)
insurance Debt assets
Saving Accounts
(cash, deposits)
Cash Deposits
year
AF Pasivos Financieros
(AF.4 Préstamos
+ AF.7 Otras
cuentas pendientes de pago)
AF. Activos Financieros
AF.5 Participaciones en el capital y
fondos de inversión +
AF.7 Financial derivatives
Participaciones en el capital (Acciones
cotizadas, no cotizadas y
otras participaciones)
Participaciones en fondos de inversión y en sociedades de
inversión
AF.7 Derivados
Financieros
AF.6 Seguros, pensiones y
garantías estandarizadas
AF.3 Valores representativos de deuda+AF.4
Préstamos+AF.8 Otras cuentas pendientes de
cobro
AF.2 Efectivo
y depósitos
Efectivo
Depósitos (Depósitos
transferibles+Otros depósitos)
1984 1985 1986 1987 1988 1989 1990 1991 1992 1993 1994 1995 1996 7 2 9 1 1 1 0,00000 0 2 5 1 4 1997 7 2 9 2 1 1 0,00000 0 2 5 1 4 1998 8 2 10 2 1 1 0,00000 0 2 6 1 5 1999 8 2 11 2 1 1 0,00000 0 2 7 1 6 2000 10 3 13 4 2 1 0,00000 0 2 7 1 6 2001 11 3 14 4 2 1 0,00000 0 2 9 1 8 2002 12 2 15 4 3 1 0,00000 0 2 9 1 8 2003 12 3 15 4 3 1 0,00000 0 2 9 1 8 2004 14 3 17 4 3 1 0,00000 0 3 10 1 9 2005 14 4 18 4 3 1 0,00001 0 3 11 1 10 2006 16 5 21 6 4 2 0,00010 0 2 13 2 11 2007 18 6 24 7 5 2 0,00024 0 3 15 2 13 2008 19 6 25 5 4 1 0,00029 0 3 17 2 15 2009 17 5 23 3 2 1 0,00018 0 3 17 2 15 2010 16 6 22 3 2 1 0,00022 0 2 17 2 15 2011 16 6 22 3 2 1 0,00024 0 3 16 2 15 2012 14 7 21 3 2 1 0,00023 0 4 15 2 13 2013 14 7 21 3 2 1 0,00024 0 3 16 2 14 2014 32 6 38 20 15 6 0,00018 0 2 16 1 14 Notes: All wealth data are for June.
Source: Financial Accounts, Bank of Spain
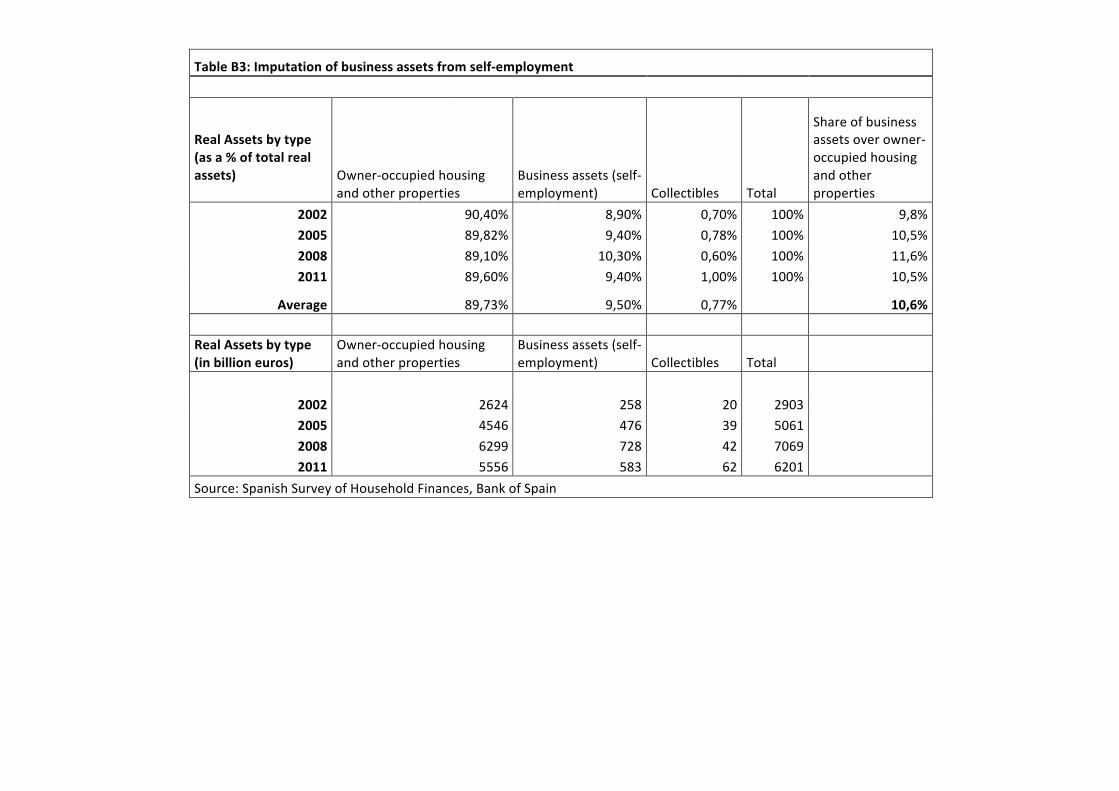
Table B3: Imputation of business assets from self-‐employment
Real Assets by type (as a % of total real assets)
Owner-‐occupied housing and other properties
Business assets (self-‐employment) Collectibles Total
Share of business assets over owner-‐occupied housing and other properties
2002 90,40% 8,90% 0,70% 100% 9,8% 2005 89,82% 9,40% 0,78% 100% 10,5% 2008 89,10% 10,30% 0,60% 100% 11,6% 2011 89,60% 9,40% 1,00% 100% 10,5%
Average 89,73% 9,50% 0,77% 10,6%
Real Assets by type (in billion euros)
Owner-‐occupied housing and other properties
Business assets (self-‐employment) Collectibles Total
2002 2624 258 20 2903 2005 4546 476 39 5061 2008 6299 728 42 7069 2011 5556 583 62 6201
Source: Spanish Survey of Household Finances, Bank of Spain
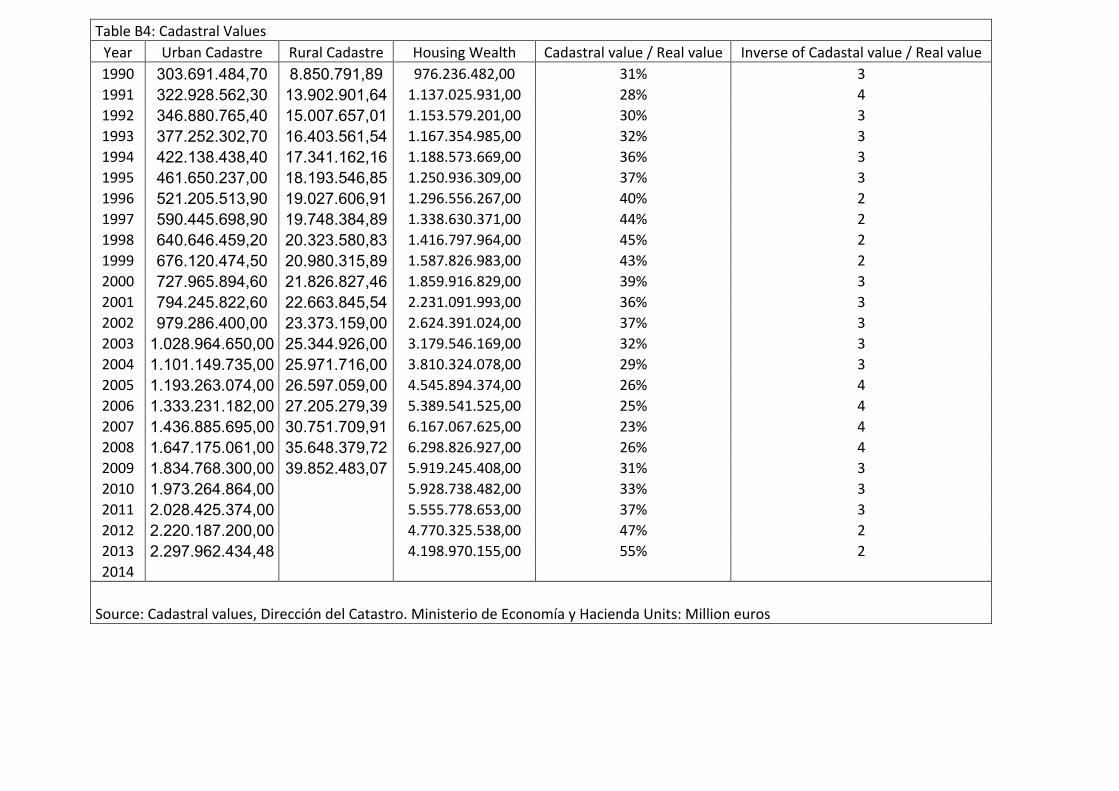
Table B4: Cadastral Values Year Urban Cadastre Rural Cadastre Housing Wealth Cadastral value / Real value Inverse of Cadastal value / Real value 1990 303.691.484,70 8.850.791,89 976.236.482,00 31% 3 1991 322.928.562,30 13.902.901,64 1.137.025.931,00 28% 4 1992 346.880.765,40 15.007.657,01 1.153.579.201,00 30% 3 1993 377.252.302,70 16.403.561,54 1.167.354.985,00 32% 3 1994 422.138.438,40 17.341.162,16 1.188.573.669,00 36% 3 1995 461.650.237,00 18.193.546,85 1.250.936.309,00 37% 3 1996 521.205.513,90 19.027.606,91 1.296.556.267,00 40% 2 1997 590.445.698,90 19.748.384,89 1.338.630.371,00 44% 2 1998 640.646.459,20 20.323.580,83 1.416.797.964,00 45% 2 1999 676.120.474,50 20.980.315,89 1.587.826.983,00 43% 2 2000 727.965.894,60 21.826.827,46 1.859.916.829,00 39% 3 2001 794.245.822,60 22.663.845,54 2.231.091.993,00 36% 3 2002 979.286.400,00 23.373.159,00 2.624.391.024,00 37% 3 2003 1.028.964.650,00 25.344.926,00 3.179.546.169,00 32% 3 2004 1.101.149.735,00 25.971.716,00 3.810.324.078,00 29% 3 2005 1.193.263.074,00 26.597.059,00 4.545.894.374,00 26% 4 2006 1.333.231.182,00 27.205.279,39 5.389.541.525,00 25% 4 2007 1.436.885.695,00 30.751.709,91 6.167.067.625,00 23% 4 2008 1.647.175.061,00 35.648.379,72 6.298.826.927,00 26% 4 2009 1.834.768.300,00 39.852.483,07 5.919.245.408,00 31% 3 2010 1.973.264.864,00 5.928.738.482,00 33% 3 2011 2.028.425.374,00 5.555.778.653,00 37% 3 2012 2.220.187.200,00 4.770.325.538,00 47% 2 2013 2.297.962.434,48 4.198.970.155,00 55% 2 2014
Source: Cadastral values, Dirección del Catastro. Ministerio de Economía y Hacienda Units: Million euros