Embed Size (px)
Citation preview
699
THE DISTRIBUTION OF VITAMIN C IN FOODSSOLD ON THE OPEN MARKET
BY GWENETH CHAPPELL, M.SC.
From King's College of Household and Social Science, London
(With 6 Figures in the Text)
CONTENTSPAGE
I n t r o d u c t i o n 6 9 9S c o p e o f t h e w o r k u n d e r t a k e n 7 0 0M e t h o d s 7 0 0T h e r e s u l t s o f e x a m i n a t i o n s o f c h e a p f o o d s . . . . . . . . . 7 0 1T h e r e s u l t s o f e x a m i n a t i o n s o f e x p e n s i v e f o o d s 7 0 4C o m p a r i s o n o f g a r d e n a n d m a r k e t p r o d u c e . . . . . . . . . 7 0 8E f f e c t o f s t o r a g e i n t h e h o m e 7 1 0E x p e r i m e n t s o n t h e loss o f v i t a m i n C i n c u t f r u i t s o n s t o r a g e 7 1 4D i s t r i b u t i o n o f a s c o r b i c a c i d i n v a r i o u s p o r t i o n s o f p l a n t t i s s u e . . . . . 7 1 9T h e v i t a m i n C r a t i o n f r o m c h e a p a n d e x p e n s i v e m a r k e t s . . . . . . . 7 2 1T h e v i t a m i n C c o n t e n t o f c a n n e d f r u i t s a n d v e g e t a b l e s . . . . . . . 7 2 3C o m p a r i s o n o f t h e q u a n t i t y a n d c o s t o f c h e a p a n d e x p e n s i v e r a w a n d c a n n e d p l a n t f o o d s
r e q u i r e d t o y i e l d 3 0 m g . o f v i t a m i n C 7 2 6S u m m a r y 7 2 9R e f e r e n c e s 7 3 0
INTRODUCTION
As early as the thirteenth century cases of scurvy were recorded amongstCrusaders. Although scurvy was thought to be peculiarly a disease of seafaringmen, it was, for centuries, of common occurrence amongst civil populationsin northern Europe (Harris, 1938).
As early as 1639 "the excellence of juyce of lemmons" as a cure for scurvywas remarked on in a work on military and domestic surgery published byJohn Woodall. The incidence of scurvy became much diminished after thediscovery by Kramer, in 1720, that "three or four ounces of orange or limejuice will cure this dreadful disease without other help".
Despite advances in the diagnosis, prevention and treatment of scurvy, andinstructions through the popular press and other media as to protective dietaries,there are still persons who suffer from a lack of ascorbic acid. In 1937 caseswere reported in Copenhagen by Lazarus, and in 1939 four were reported byKark & Lozner in Boston City Hospital. In 1937 also seven cases in adultswere reported in Manchuria by Kobayashi & Doi. It has been recognized thatdyspeptic people who adhere for long periods to special diets may suffer fromvitamin deficiency. Cases of this kind have been described by Archer &<7raaam (ISSffj, Ffatt (1936), Kawksley (1939), and others. Bruce Young (1938)
available at https://www.cambridge.org/core/terms. https://doi.org/10.1017/S0022172400028187Downloaded from https://www.cambridge.org/core. IP address: 65.21.228.167, on 05 Dec 2021 at 14:44:43, subject to the Cambridge Core terms of use,
700 Vitamin C in foods sold on the open market
described a case of scurvy which was admitted to the National TemperanceHospital in August 1934. He states that "poverty is another common causeof faulty diets but ignorance of food values may cause even the well-to-do tosuffer from vitamin deficiency".
Practically all recent cases of vitamin C deficiency have occurred amongstmen and women living alone and catering for themselves at a low cost. Thedeficiency in such cases may be due either to an improper dietary or to a lowcontent of vitamin C in the foods purchased. It has been demonstrated bymany workers (Olliver, 1940; Paech, 1938; Thornton, 1938; and others) thatthe antiscorbutic vitamin is rapidly destroyed when foods containing it arestored, particularly when they are in contact with air. These observationssuggested that foods exposed for sale in poor districts might be more stale thanthose sold in expensive stores, and therefore that the vitamin C content ofthese cheaper foods might be insufficient to maintain health on an averageconsumption, especially as persons living on a minimal food supply tend to eatbut little fresh fruit and raw vegetables. E. F. Armstrong went so far as to tellthe Society of Chemical Industry at its Pittsburg meeting in 1936 that "greenvegetables exposed for sale in the East End of London three or four days afterpicking are found to be almost completely devoid of vitamin". In view of theexperimental results described in this paper this statement is too sweeping.
SCOPE OF THE WORK UNDERTAKEN
This work was undertaken to discover whether foods sold in street marketsand cheap stores in England actually have sufficient vitamin C in them, whenpurchased, to furnish the daily requirement of 19-27 mg. of vitamin C for anadult of 60 kg. (Gothlin) when average quantities of them are consumed.
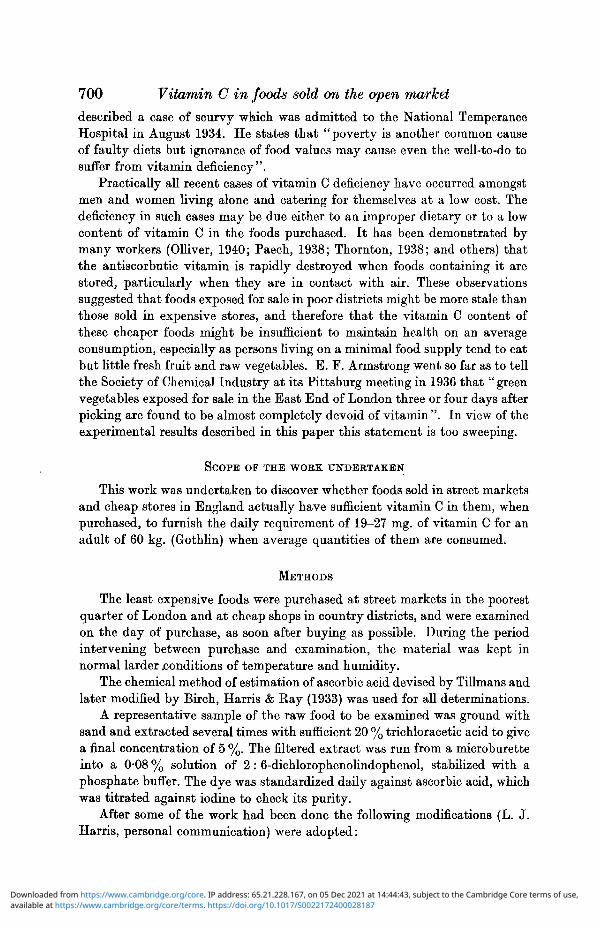
METHODS
The least expensive foods were purchased at street markets in the poorestquarter of London and at cheap shops in country districts, and were examinedon the day of purchase, as soon after buying as possible. During the periodintervening between purchase and examination, the material was kept innormal larder .conditions of temperature and humidity.
The chemical method of estimation of ascorbic acid devised by Tillmans andlater modified by Birch, Harris & Eay (1933) was used for all determinations.
A representative sample of the raw food to be examined was ground withsand and extracted several times with sufficient 20 % trichloracetic acid to givea final concentration of 5 %. The filtered extract was run from a microburetteinto a 0-08 % solution of 2: 6-dichlorophenolindophenol, stabilized with aphosphate buffer. The dye was standardized daily against ascorbic acid, whichwas titrated against iodine to check its purity.
After some of the work had been done the following modifications (L. J.Harris, personal communication) were adopted:
available at https://www.cambridge.org/core/terms. https://doi.org/10.1017/S0022172400028187Downloaded from https://www.cambridge.org/core. IP address: 65.21.228.167, on 05 Dec 2021 at 14:44:43, subject to the Cambridge Core terms of use,

GwENETH CHAPPELL 701A 20% solution of trichloracetic acid was mixed with a 20% solution of metaphosphoric
acid and used for extraction. The quantities of each solution taken were adjusted to give aconcentration of 5% trichloracetic acid and 2 % metaphosphoric acid in the final extract.The food sample was ground with 5-10 g. of sand and approximately one-fifth of the totalacid to be used. Grinding was completed after the addition of half of the remaining acid.The mixture was rapidly filtered through fine muslin, extraction being aided by pressurewith a glass rod. The residue was then returned to the mortar and extraction repeated withthe remaining acid. The residue was next washed with recently boiled, copper-free, cold,distilled water, and the solution made up to the required volume. This solution was filteredthrough a no. 1 Whatman filter paper and titrated within 10 min. of the preliminary grindingwith sand. Not more than 20 g. of material were used for an estimation, as complete extrac-tion is difficult when the concentration of the material is high, and some oxidation ofascorbic acid may occur during the longer time required for grinding a larger sample. Incases of a low ascorbic acid content in tissues, the strength of the indicator was adjusted.As an alternative, a back titration was made. If more than 2 c.c. of food solution wererequired to decolorize the dye the titrations were completed with orange juice (made up intrichloracetic acid to 20%) from a third burette. The vitamin value of the juice was deter-mined by separate titration, and the amount of ascorbic acid in the sample of food wasestimated from the resultant titrations.
For deeply coloured extracts, a rough estimate of the vitamin C content of the materialwas obtained by direct titration and the use of a control tube. After this preliminarydetermination, an accurate estimate was made, using a modification of the method ofMcHenry & Graham. Two ml. of a freshly prepared filtered extract of the material wereplaced in a long-pointed centrifuge tube with 2 ml. of chloroform. The 2 : 6-dichloro-phenolindophenol was introduced at once into the upper extract layer which was agitatedby a constant stream of oxygen-free carbon dioxide. The 0-08% indicator was added towithin 0-02-0-05 ml. of the necessary volume (calculated approximately from the directtitration). The two layers were then mixed by introducing the inlet tube of the CO2 into thelower layer. The indicator was added until the chloroform layer developed a definite pinkcolour after mixing with the aqueous layer. If the indicator is allowed to come into directcontact with the chloroform, a pink colour, not discharged by ascorbic acid, may develop,and it is therefore essential that the indicator and extract be well mixed before the chloro-form and extract layers are allowed to mix.
Since all vitamin C in growing plants is in the reduced form, the omissionof H2S treatment was considered permissible.
In the case of liver, which contains proteins, these substances were pre-cipitated by mercuric acetate before testing for vitamin C.
THE RESULTS OP EXAMINATIONS OF CHEAP FOODS
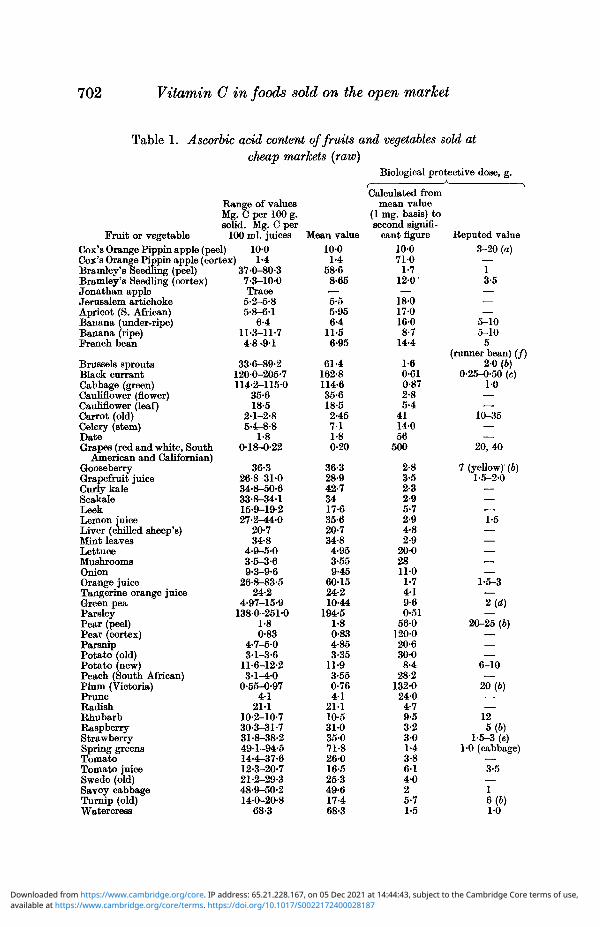
The results given in Table 1 are those for the cheapest foods obtained.All reputed biological values were taken from the results of Harris & Ray
(1933) except (a) from Eddy et al. (1926 b) and Bracewell et al. (1930); (b) fromHahn & Scheunert (1932); (c) from Bukin & Povolotzkaya (1935); (d) fromKohman et al. (1925); (e) from Kohman et al. (1928); and (/) from Campbell &Chick (1919).
All fruit juices were tested at their natural pS. value from several varietiesof each fruit.
It may be that the results found for banana are lower than those whichactually obtain in that fruit, since Thornton (1938) states that enzymes presentin banana tissue will cause a 50 % reduction in the ascorbic acid present in a
available at https://www.cambridge.org/core/terms. https://doi.org/10.1017/S0022172400028187Downloaded from https://www.cambridge.org/core. IP address: 65.21.228.167, on 05 Dec 2021 at 14:44:43, subject to the Cambridge Core terms of use,
702 Vitamin C in foods sold on the open market
Table 1. Ascorbic acid content of fruits and vegetables sold atcheap markets (raw)
Biological protective dose, g.
Fruit or vegetable
Range of valuesMg. C per 100 g.solid. Mg. C per
100 ml. juicesCox's Orange Pippin apple (peel) 10-0Cox's Orange Pippin apple (cortex) 1 -4Bramley's Seedling (peel)Bramley's Seedling (cortex)Jonathan appleJerusalem artichokeApricot (S. African)Banana (under-ripe)Banana (ripe)French bean
Brussels sproutsBlack currantCabbage (green)Cauliflower (flower)Cauliflower (leaf)Carrot (old)Celery (stem)DateGrapes (red and white, South
American and Californian)GooseberryGrapefruit juiceCurly kaleSeakaleLeekLemon juiceLiver (chilled sheep's)Mint leavesLettuceMushroomsOnionOrange juiceTangerine orange juiceGreen peaParsleyPear (peel)Pear (cortex)ParsnipPotato (old)Potato (new)Peach (South African)Plum (Victoria)PruneRadishRhubarbRaspberryStrawberrySpring greensTomatoTomato juiceSwede (old)Savoy cabbageTurnip (old)Watercress
37-0-80-37-3-10-0Trace
5-2-5-85-8-6-1
6-411-3-11-74-8-9-1
33-6-89-21200-205-7114-2-115-0
35-618-5
2-1-2-85-4-8-8
1-80-18-0-22
36-326-8-31-034-8-50-633-8-34115-9-19-227-2-44-0
20-734-8
4-9-5-03-5-3-69-3-9-6
26-8-83-524-2
4-97-15-91380-2510
1-80-83
4-7-5-03-1-3-6
11-6-12-23-1-4-0
0-55-0-974-1
21110-2-10-730-3-31-731-8-38-249-1-94-514-4-37-612-3-20-721-2-29-348-9-50-214-0-20-8
68-3
Mean value1001-4
58-68-65—5-55-956-4
11-56-95
61-4162-8114-635-618-52-457 11-80-20
36-328-942-73417-635-620-734-84-953-559-45
60-1524-210-44
194-51-80-834-853-35
11-93-550-764 1
21-110-531-035071-826-016-525-349-617-468-3
i
Calculated frommean value
(1 mg. basis) tosecond signifi-
cant figure10071-0
1-7120—
18-017-016-08-7
14-4
1-60-610-872-85-4
4114056
500
2-83-52-32-95-72-94-82-9
20-02811-01-74 19-60-51
56-0120-020-630-08-4
28-2132024-04-79-53-23 01-43-86 14-025-71-5
Reputed value3-20 (a)—13-5—.——
5-105-10
5(runner bean) (/)
2-0 (6)0-25-0-50 (c)
10——
10-35——
20,40
7 (yellow)'(6)1-5-2-0
—
1-5————
1-5-3—2(d)
20-25 (6)———
6-10—
20(6)
—125(6)
1-5-3 (e)1-0 (cabbage)
—3-5—16(6)10
available at https://www.cambridge.org/core/terms. https://doi.org/10.1017/S0022172400028187Downloaded from https://www.cambridge.org/core. IP address: 65.21.228.167, on 05 Dec 2021 at 14:44:43, subject to the Cambridge Core terms of use,
GWENETH CHAPPELL 703
period of 1 min. if 8 % CC13COOH and 2 % HP03 are used in extraction. Hesuggests that only acids as strong as 1, 2 or 3iV H SC^ or 0-25N HP03 willinactivate the enzyme.
The results given in Table 1 are unexpectedly high in view of Armstrong'sassertion and the high figures given by M. Olliver (1936) for the percentageloss of vitamin C in stored green vegetables. The results obtained from foodsbought at inexpensive markets indicate that the poorer classes need suffer novitamin C deficiency.
It must be admitted that in a few instances the amount of ascorbic acidcontained in the food examined was less than the present accepted minimum,taking the tables compiled by Boas Fixsen & Roscoe (1938-40), and by Daniel& Munsell (1937) as a basis for comparison.
Brussels sprouts were found to contain as little as 33-6 mg. vitamin C per100 g.,leaf on the day of purchase. .Previous records gave figures from 70 mg.upwards. This low result may well be due to the destruction of the vitaminwhile the food was exposed for sale. Similarly, cauliflower leaf was found tohave 18-5 mg. vitamin C per 100g., and Boas Fixsen etal. (1938-40) give 113 mg.vitamin C per 100 g. Old parsnip roots gave a result as low as 4-7 mg. ascorbicacid per 100 g., but as this was only 0-3 mg.% lower than the previousminimum figure it is of no importance and would make a very insignificantalteration in the biological protective dose.
Strawberries from cheap markets contained from 31-8 mg. vitamin C per100 g., and the figures usually accepted are from 46 mg. C per 100 g. This resultmay be accounted for either by a long period of exposure for sale, during whichtime the vitamin is slowly oxidized, or by the natural decline in the ascorbicacid content of fully matured soft berries. Turnip roots gave values of 14-0,15-5 and 16-9 mg. vitamin C per 100 g., as well as higher ones of approximately20 mg. ascorbic acid. The lower figures were obtained from large old roots, andit may be that the natural vitamin content of the old vegetable is frequentlylower than the 17 mg. given by Rudra (1936).
It will be seen, therefore, that these results do not warrant alarm as to thesufficiency of the antiscorbutic factor in cheap foods, and some of them con-tained very large amounts of vitamin C, notably parsley with 251 mg. per100 g., black currant with 205-7 mg. per 100 g., and cabbage with 115 mg. per100 g.
Attention is called tothe figures for peas and tomatoes, both of which arewithin the limiting values previously set down for these foods, because of theview put forward by Kohman & Sanborn(1937) that the estimation of vitamin Cby the dye method is complicated for these two vegetables by the presence ofother reducing bodies. If this view is correct the true vitamin content will belower than the figures obtained, but throughout this work all samples of peasand tomatoes were examined in an identical manner, so that for purposes ofcomparison the results may be considered satisfactory.
The higher vitamin content of ripe bananas as opposed to that of under-
available at https://www.cambridge.org/core/terms. https://doi.org/10.1017/S0022172400028187Downloaded from https://www.cambridge.org/core. IP address: 65.21.228.167, on 05 Dec 2021 at 14:44:43, subject to the Cambridge Core terms of use,
704 Vitamin C in foods sold on the open market
ripe fruit is in keeping with results obtained by Leverton (1937), although thereverse appears to be true of tomatoes. The soft, over-ripe tomatoes had alower ascorbic acid content than the firm, ripe ones, values ranging from 11-93,14-4, 15-5 and 20-19 mg. C per 100 g. for very ripe, and 22-46 to 37-6 mg. forfirm examples. Average results for 100 ml. of expressed juice gave 15-5 and20-7 mg. vitamin C respectively. Tripp, Satterfield & Holmes (1937) record
' similar observations, though Maclinn, Fellers & Buck (1937) found no correla-tion between the degree of ripeness and vitamin C content. As there was noinformation as to whether the tomatoes tested had been picked before or atthe time of full maturity, it may be that the over-ripe fruit was picked whenfirm and suffered a subsequent decline in vitamin content by exposure for sale.
THE RESULTS OF EXAMINATIONS OP EXPENSIVE FOODS
It was considered of interest to examine foods exposed for sale at fashion-able, expensive markets, in order to ascertain whether their content of vitaminC is notably higher than that of cheap vegetables. Representative sampleswere purchased and examined as before, as soon after purchase as possible.When foods were kept any period of time before use they were stored in normallarder conditions. For purposes of comparison, the most expensive foods werechosen.
Table 2 gives the ascorbic acid content of raw foods from expensivemarkets.
It is interesting to note that the mean value for the vitamin C content ofswedes was as high as 33-6 mg. per 100 g. on the expensive market. The highestexperimental value obtained was 36-9 mg. 3 per 100 g., which is as high as thatof some samples of orange juice. As far as can be discovered, no earlier estima-tion of the vitamin C content of the swede has been made. Hopkins used swedejuice in his classical experiments on accessory factors in diet, but that wasbefore the vitamins had been differentiated and, in any case, rats do not needvitamin C.
It has been suggested that the production of vitamin C is associated withthe presence of plant pigments and this may be an illustration of that point.If the yellow pigment in swedes is carotene, it may be that its reducingproperties prevent the oxidation of ascorbic acid (Garrett et al. 1938) andpreserve a high content of the vitamin even in an old vegetable.
In Table 2 there are some foods which containedf less ascorbic acid than isnormally found, for example, brussels sprouts contained from 62-5 mg. C per100 g., the reputed value being from 70 mg. C per 100 g.; cauliflower leavesfrom 35-0 mg. C per 100 g., the reputed value being from 113 mg. C per 100 g.;endive from 5-7 mg. C per 100 g., the reputed value being from 19-0 mg. par100 g.; parsley from 63 mg. C per 100 g., the reputed value being from 140 mg.C per 100 g.; strawberry from 42 mg. C per 100 g., the reputed value beingfrom 46 mg. per 100 g., and turnip from 10-8 mg. C per 100 g., the reputedvalue being from 17 mg. per 100 g.
available at https://www.cambridge.org/core/terms. https://doi.org/10.1017/S0022172400028187Downloaded from https://www.cambridge.org/core. IP address: 65.21.228.167, on 05 Dec 2021 at 14:44:43, subject to the Cambridge Core terms of use,
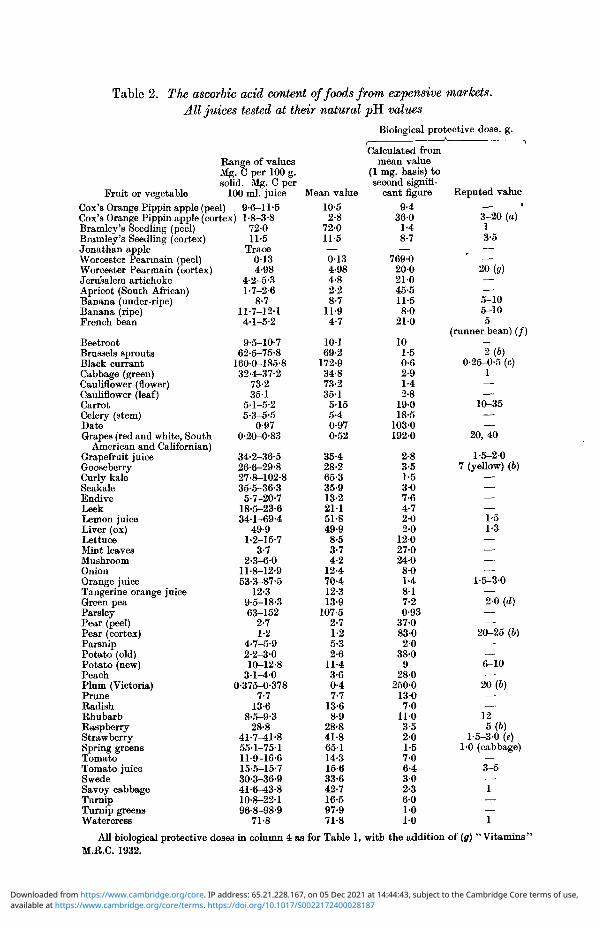
Table 2. The ascorbic acid content of foods from expensive markets.All juices tested at their natural pR values
Biological protective dose, g.
Fruit or vegetable
Range of valuesMg. C per 100 g.solid. Mg. C per
100 ml. juiceCox's Orange Pippin apple (peel) 9-6-11 -5Cox's Orange Pippin apple (cortex) 1-8-3-8Bramley's Seedling (peel)Bramley's Seedling (cortex)Jonathan appleWorcester Pearmain (peel)Worcester Pearmain (cortex)Jerusalem artichokeApricot (South African)Banana (under-ripe)Banana (ripe)French bean
BeetrootBrussels sproutsBlack currantCabbage (green)Cauliflower (flower)Cauliflower (leaf)CarrotCelery (stem)DateGrapes (red and white, South
American and Californian)Grapefruit juiceGooseberryCurly kaleSeakaleEndiveLeekLemon juiceLiver (ox)LettuceMint leavesMushroomOnionOrange juiceTangerine orange juiceGreen peaParsleyPear (peel)Pear (cortex)ParsnipPotato (old)Potato (new)PeachPlum (Victoria)PruneRadishRhubarbRaspberryStrawberrySpring greensTomatoTomato juiceSwedeSavoy cabbageTurnipTurnip greensWatercress
72-011-5
Trace0134-98
4-2-5-31-7-2-6
8-711-7-12-14-1-5-2
9-5-10-762-5-75-8
160-0-185-832-4-37-2
73-2351
5-1-5-25-3-5-5
0-970-20-0-83
34-2-36-526-6-29-827-8-102-835-5-36-3
5-7-20-718-5-23-634-1-69-4
49-91-2-15-7
3-72-3-6-0
11-8-12-953-3-87-5
12-39-5-18-363-152
2-71-2
4-7-5-92-2-3-010-12-8
3-1-4-00-375-0-378
7-713-6
8-5-9-328-8
41-7^1-855-1-75-111-9-16-615-5-15-730-3-36-941-6^3-810-8-22-196-8-98-9
71-8
Mean value10-52-8
72-011-5—0134-984-82-28-7
11-94-7
10169-2
172-934-873-2351
5155-40-970-52
35-428-265-335-913-221151-849-9
8-53-74-2
12-470-412-313-9
107-52-71-25-32-6
11-43-60-47-7
13-68-9
28-841-865-114-315-633-642-716-597-971-8
Calculated frommean value
(1 mg. basis) tosecond signifi-
cant figure9-4
3601-48-7—
769-020-021045-511-58-0
210
101-50-62-91-42-8
19-018-5
1030192-0
2-83-51-53 07-64-72-02-0
12027-024-08-01-48-17-20-93
37-08302 0
38-09
28-0250-0
1307-0
1103-52-01-57-06-43 02-36-01 01-0
Reputed value, i
3-20 (o)13-5——
20(?)
•—5-105-105
(runner bean) (/)•—2(6)
0-25-0-5 (c)1——
10-35—— •
20, 40
1-5-2-07 (yellow) (6)
————1-51-3————
1-5-3-0—2-0 (d)——
20-25 (6)——6-10—
20(6)——
125(6)
1-5-3-0 (e)1-0 (cabbage)
—3-5—1——1
All biological protective doses in column 4 as for Table 1, with the addition of (g) "Vitamins"M.R.C. 1932.
available at https://www.cambridge.org/core/terms. https://doi.org/10.1017/S0022172400028187Downloaded from https://www.cambridge.org/core. IP address: 65.21.228.167, on 05 Dec 2021 at 14:44:43, subject to the Cambridge Core terms of use,
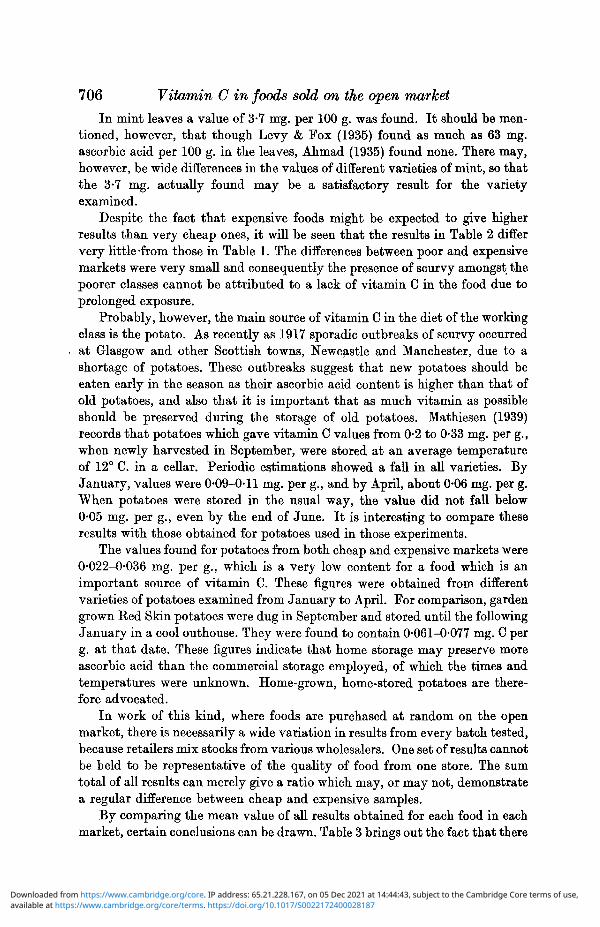
706 Vitamin C in foods sold on the open market
In mint leaves a value of 3-7 mg. per 100 g. was found. It should be men-tioned, however, that though Levy & Fox (1935) found as much as 63 mg.ascorbic acid per 100 g. in the leaves, Ahmad (1935) found none. There may,however, be wide differences in the values of different varieties of mint, so thatthe 3-7 mg. actually found may be a satisfactory result for the varietyexamined.
Despite the fact that expensive foods might be expected to give higherresults than very cheap ones, it will be seen that the results in Table 2 differvery little-from those in Table 1. The differences between poor and expensivemarkets were very small and consequently the presence of scurvy amongst thepoorer classes cannot be attributed to a lack of vitamin C in the food due toprolonged exposure.
Probably, however, the main source of vitamin C in the diet of the workingclass is the potato. As recently as 1917 sporadic outbreaks of scurvy occurredat Glasgow and other Scottish towns, Newcastle and Manchester, due to ashortage of potatoes. These outbreaks suggest that new potatoes should beeaten early in the season as their ascorbic acid content is higher than that ofold potatoes, and also that it is important that as much vitamin as possibleshould be preserved during the storage of old potatoes. Mathiesen (1939)records that potatoes which gave vitamin C values from 0-2 to 0-33 mg. per g.,when newly harvested in September, were stored at an average temperatureof 12° C. in a cellar. Periodic estimations showed a fall in all varieties. ByJanuary, values were 0*09-0-11 mg. per g., and by April, about 0-06 mg. per g.When potatoes were stored in the usual way, the value did not fall below0-05 mg. per g., even by the end of June. It is interesting to compare theseresults with those obtained for potatoes used in those experiments.
The values found for potatoes from both cheap and expensive markets were0-022-0-036 mg. per g., which is a very low content for a food which is animportant source of vitamin C. These figures were obtained from differentvarieties of potatoes examined from January to April. For comparison, gardengrown Red Skin potatoes were dug in September and stored until the followingJanuary in a cool outhouse. They were found to contain 0-061-0-077 mg. C perg. at that date. These figures indicate that home storage may preserve moreascorbic acid than the commercial storage employed, of which the times andtemperatures were unknown. Home-grown, home-stored potatoes are there-fore advocated.
In work of this kind, where foods are purchased at random on the openmarket, there is necessarily a wide variation in results from every batch tested,because retailers mix stocks from various wholesalers. One set of results cannotbe held to be representative of the quality of food from one store. The sumtotal of all results can merely give a ratio which may, or may not, demonstratea regular difference between cheap and expensive samples.
By comparing the mean value of all results obtained for each food in eachmarket, certain conclusions can be drawn. Table 3 brings out the fact that there
available at https://www.cambridge.org/core/terms. https://doi.org/10.1017/S0022172400028187Downloaded from https://www.cambridge.org/core. IP address: 65.21.228.167, on 05 Dec 2021 at 14:44:43, subject to the Cambridge Core terms of use,
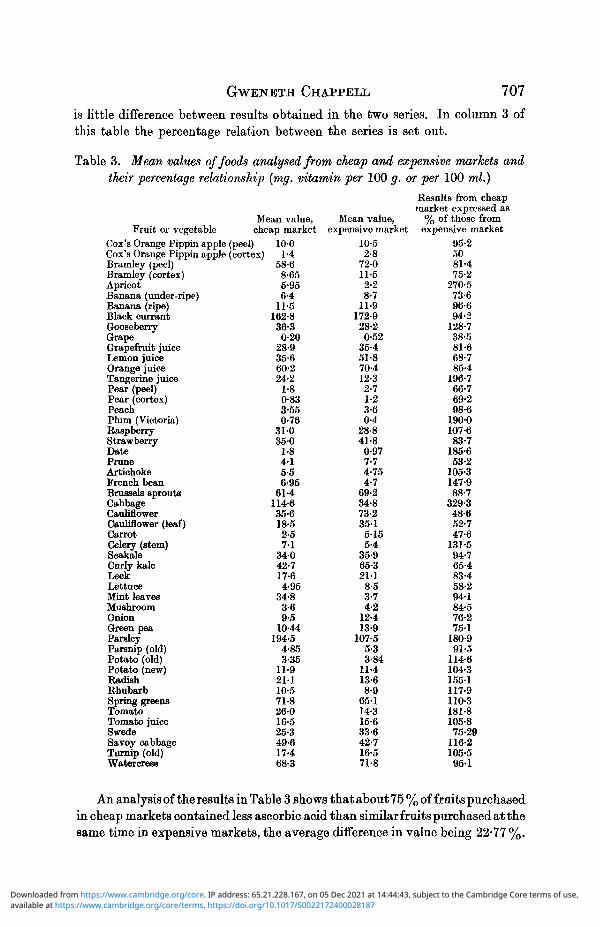
G W E N B T H CHAPPELL 707
is little difference between results obtained in the two series. In column 3 ofthis table the percentage relation between the series is set out.
Table 3. Mean values of foods analysed from cheap and expensive markets andtheir percentage relationship (mg. vitamin per 100 g. or per 100 ml.)
Fruit or vegetableMean value,
cheap marketCox's Orange Pippin apple (peel) 100Cox's Orange Pippin apple (cortex) 1-4Bramley (peel)Bramley (cortex)ApricotBanana (under-ripe)Banana (ripe)Black currantGooseberryGrapeGrapefruit juiceLemon juiceOrange juiceTangerine juicePear (peel)Pear (cortex)PeachPlum (Victoria)RaspberryStrawberryDatePruneArtichokeFrench beanBrussels sproutsCabbageCauliflowerCauliflower (leaf)CarrotCelery (stem)SeakaleCurly kaleLeekLettuceMint leavesMushroomOnionGreen peaParsleyParsnip (old)Potato (old)Potato (new)RadishRhubarbSpring greensTomatoTomato juiceSwedeSavoy cabbageTurnip (old)Watercress
58-68-655-956-4
11-5162-836-30-20
28-935-660-224-2
1-80-833-550-76
31035-0
1-84 15-56-95
61-4114-635-618-52-57 1
34042-717-64-95
34-83-69-5
10-44194-5
4-853-35
11-921-110-571-826-016-525-349-617-468-3
Mean value,expensive market
10-52-8
72-011-52-28-7
11-9172-928-20-52
35-451-870-412-32-71-23-60-4
28-841-80-977-74-754-7
69-234-873-2351
5155-4
35-965-32118-53-74-2
12-413-9
107-55-33-84
11-413-68-9
65114-315-633-642-716-571-8
Results from cheapmarket expressed as
% of those fromexpensive market
95-25081-475-2
270-573-696-694-2
128-738-581-668-785-4
196-766-769-298-6
190-0107-683-7
185-653-2
105-3147-988-7
329-348-652-747-6
131-594-765-483-458-294-184-576-2751
180-991-5
114-6104-31551117-9110-3181-8105-875-29
116-2105-595-1
An analysis of the results in Table 3 shows that about 75 % of fruits purchasedin cheap markets contained less ascorbic acid than similarfruits purchased at thesame time in expensive markets, the average difference in value being 22-77 %.
available at https://www.cambridge.org/core/terms. https://doi.org/10.1017/S0022172400028187Downloaded from https://www.cambridge.org/core. IP address: 65.21.228.167, on 05 Dec 2021 at 14:44:43, subject to the Cambridge Core terms of use,
708 Vitamin C in foods sold on the open market
51-73 % of cheap vegetables had less vitamin than their expensive counter-parts, with an average difference of 24-59%.
50% dried fruits had less and 50% had more vitamin than the productfrom the expensive market.
Of the cheap fruits 25 % had more vitamin than those from the expensivemarket, the average difference being 78-7 %. Of the vegetables 48-27 % hadmore vitamin than those from the expensive market, the average difference inthis being 43-31 %.
It seems therefore that expensive fruits and vegetables contain a greateramount of vitamin C than very inexpensive ones, though the latter containsufficient amounts of ascorbic acid to maintain health when a well-balancedaverage dietary is taken.
If, for purposes of comparison, the figure given in Table 3 for the ascorbicacid content of each expensive fruit or vegetable is taken as 100%, it will beseen that 7/10ths of the cheap fruits contain 75 % or over and another 2-5/10thscontain 50 % or over. In the case of vegetables, the corresponding figures showthat8/10ths contain over 75% and 1/I0thover50%. In both categories,9/lOthsof the cheap material examined had more than half the vitamin content of itsexpensive counterpart, and these figures refute statements to the effect thatvegetables sold in the East End of London contain no vitamin.
It was noted that green vegetables purchased from stalls in slum streetshad a good vitamin content. This was almost invariably greater than that offoods from small shops and, occasionally, greater than that of foods fromfashionable stores. A plausible explanation is that stalls have to be sold outalmost each night, whereas large stores and small shops can keep their stocksfor long periods and expose them for sale each day. The market stall usuallyhas a ready sale, necessitating frequent replacements with fresh vegetables,and from the results obtained it seems that exposure on the stall does not causea serious depletion of the vitamin C content.
COMPARISON OF GARDEN AND MARKET PRODUCE
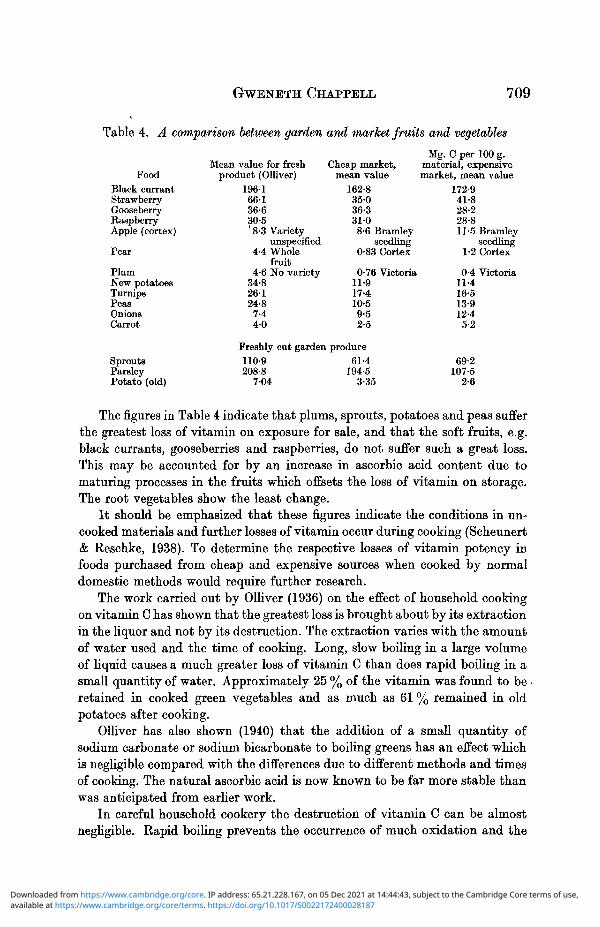
As any food, sold in large or small shops or on stalls, may stand about forsome time before purchase, neither cheap nor expensive foods from the openmarket can be considered perfectly fresh. If this is the case, they will givelower results, when tested for ascorbic acid, than fresh field and gardenproduce. In support of this statement the mean values obtained for somefoods are compared in Table 4 either with those obtained for garden grownvegetables or with the results of Olliver (1936) for fresh field and garden fruitsand vegetables.
With the exception of carrots (expensive market), onions (both markets)and apples (for which Olliver names no variety), the market results are alllower than those given by fresh garden produce. The different varieties ofcarrots and onions tested by Olliver may explain this discrepancy in results.
available at https://www.cambridge.org/core/terms. https://doi.org/10.1017/S0022172400028187Downloaded from https://www.cambridge.org/core. IP address: 65.21.228.167, on 05 Dec 2021 at 14:44:43, subject to the Cambridge Core terms of use,
GWENETH CHAPPELL 709
Table 4. A comparison between garden and market fruits and vegetables
FoodBlack currantStrawberryGooseberryRaspberryApple (cortex)
Pear
PlumNew potatoesTurnipsPeasOnionsCarrot
SproutsParsleyPotato (old)
Mean value for freshproduct (Olliver)
196166-136-630-5' 8-3 Variety
unspecified4-4 Whole
fruit4-6 No variety
34-826-124-8
7-44 0
Cheap market,mean value
162-835-036-33108-6 Bramley
seedling0-83 Cortex
0-76 Victoria11-917-410-59-52-5
Freshly cut garden produce110-9208-8
704
61-4194-5
3-35
Mg. C per 100 g.material, expensivemarket, mean value
172-941-828-228-811-5 Bramley
seedling1-2 Cortex
0-4 Victoria11-416-513-912-45-2
69-2107-5
2-6
The figures in Table 4 indicate that plums, sprouts, potatoes and peas sufferthe greatest loss of vitamin on exposure for sale, and that the soft fruits, e.g.black currants, gooseberries and raspberries, do not suffer such a great loss.This may be accounted for by an increase in ascorbic acid content due tomaturing processes in the fruits which offsets the loss of vitamin on storage.The root vegetables show the least change.
It should be emphasized that these figures indicate the conditions in un-cooked materials and further losses of vitamin occur during cooking (Scheunert& Reschke, 1938). To determine the respective losses of vitamin potency infoods purchased from cheap and expensive sources when cooked by normaldomestic methods would require further research.
The work carried out by Olliver (1936) on the effect of household cookingon vitamin C has shown that the greatest loss is brought about by its extractionin the liquor and not by its destruction. The extraction varies with the amountof water used and the time of cooking. Long, slow boiling in a large volumeof liquid causes a much greater loss of vitamin C than does rapid boiling in asmall quantity of water. Approximately 25 % of the vitamin was found to be •retained in cooked green vegetables and as much as 61 % remained in oldpotatoes after cooking.
Olliver has also shown (1940) that the addition of a small quantity ofsodium carbonate or sodium bicarbonate to boiling greens has an effect whichis negligible compared with the differences due to different methods and timesof cooking. The natural ascorbic acid is now known to be far more stable thanwas anticipated from earlier work.
In careful household cookery the destruction of vitamin C can be almostnegligible. Rapid boiling prevents the occurrence of much oxidation and the
available at https://www.cambridge.org/core/terms. https://doi.org/10.1017/S0022172400028187Downloaded from https://www.cambridge.org/core. IP address: 65.21.228.167, on 05 Dec 2021 at 14:44:43, subject to the Cambridge Core terms of use,
710 Vitamin C in foods sold on the open market
use of small volumes of liquid reduces the amount of vitamin which is extractedfrom the vegetable. Leaving the lid off is no longer considered necessary.
It is evident, therefore, that greater use should be made of raw vegetablesin order that the destruction of natural ascorbic acid by cooking should beavoided. Many root and green vegetables, which are usually served aftercooking, may be grated and used in salads.
EFFECT OF STORAGE IN THE HOME
Further losses of vitamin C may occur when foods are stored for any lengthof time between purchase and consumption. In a few experiments the observa-tions of other workers (Olliver, 1936,1940; Paech, 1938 a, b) on the destructionof vitamin C on storage were confirmed.
In investigations on practical points it is necessary to arrange the ex-periments so that their results may be applicable to the smallest households.For this reason, in my investigations, all foods stored were kept at roomtemperature in a larder communicating with a kitchen where cooking wasdone. As the communicating door was opened, the warm, moist air from thekitchen caused fluctuations in the larder temperature. Losses of vitamin C atdifferent temperatures were not studied because it is impossible or impracticableto control such temperatures in the majority of houses where cheap foodsmust be used. For the same reason no food was refrigerated during storage.
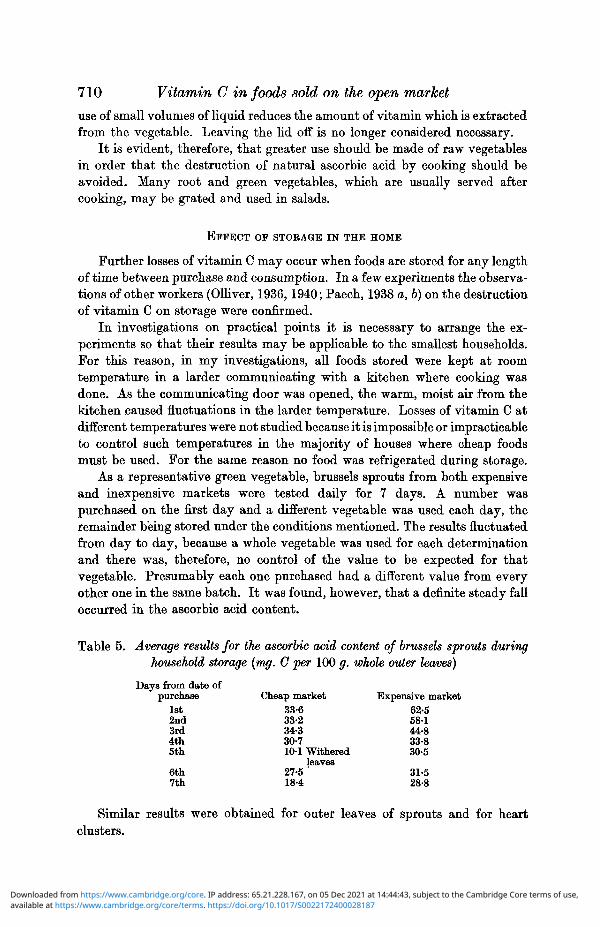
As a representative green vegetable, brussels sprouts from both expensiveand inexpensive markets were tested daily for 7 days. A number waspurchased on the first day and a different vegetable was used each day, theremainder being stored under the conditions mentioned. The results fluctuatedfrom day to day, because a whole vegetable was used for each determinationand there was, therefore, no control of the value to be expected for thatvegetable. Presumably each one purchased had a different value from everyother one in the same batch. It was found, however, that a definite steady falloccurred in the ascorbic acid content.
Table 5. Average results for the ascorbic acid content of brussels sprouts duringhousehold storage {mg. C per 100 g. whole outer leaves)
Days from date ofpurchase
1st2nd3rd4th5th
6th7th
Cheap market33-633-234-330-7101 Withered
leaves27-5 '18-4
Expensive market62-558-144-833-830-5
31-528-8
Similar results were obtained for outer leaves of sprouts and for heartclusters.
available at https://www.cambridge.org/core/terms. https://doi.org/10.1017/S0022172400028187Downloaded from https://www.cambridge.org/core. IP address: 65.21.228.167, on 05 Dec 2021 at 14:44:43, subject to the Cambridge Core terms of use,
GWENETH CHAPPELL 711
65
6 0 -
50 -
40
o 30.S
20
10
Key:- -expensive vegetables——--= cheap vegetables
I I I I I J_1 2 3 4 5 6
Days storage
Fig. 1. Brussels sprouts. Outer leaves. Loss of vitamin C on storage.
Days from date ofpurchase
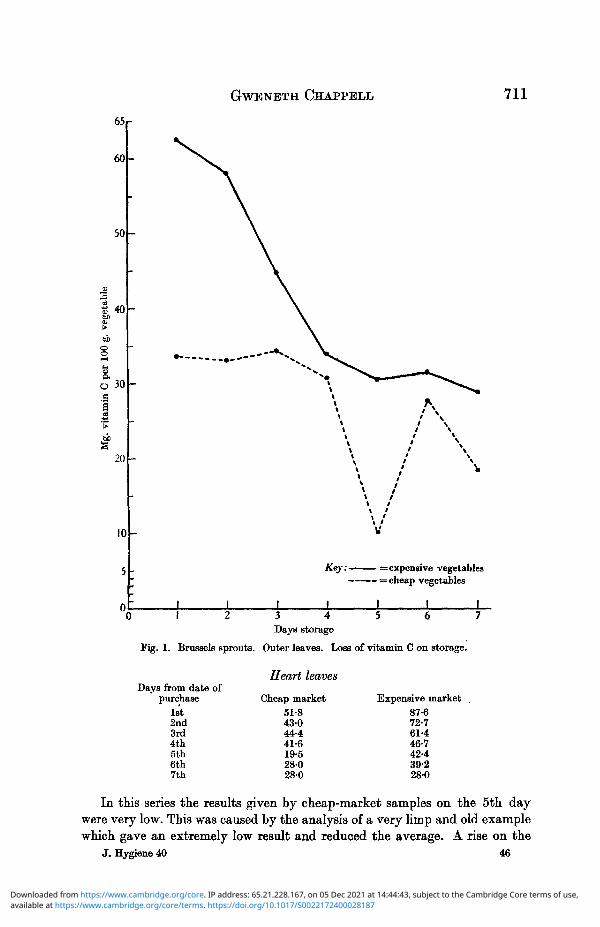
1st2nd3rd4th5th6th7th
Heart leaves
Cheap market51-843044-441-619-528-028-0
Expensive market87-672-761-446-742-439-228-0
In this series the results given by cheap-market samples on the 5th daywere very low. This was caused by the analysis of a very limp and old examplewhich gave an extremely low result and reduced the average. A rise on the
J. Hygiene 40 46
available at https://www.cambridge.org/core/terms. https://doi.org/10.1017/S0022172400028187Downloaded from https://www.cambridge.org/core. IP address: 65.21.228.167, on 05 Dec 2021 at 14:44:43, subject to the Cambridge Core terms of use,
712 Vitamin C in foods sold on the open market
6th and 7th days, in spite of the fact that the material had been stored longer,was considered proof that the low result of the 5th day was exceptional.Percentage losses of vitamin C were therefore determined between the resultsfound on the day of purchase and the last day of storage.
90 r
80
70
« 60
ti 50
40
20
10 -
5Key:- • = expensive vegetables
•=cheap vegetables
I I I
0 1 2 3 4 5 6Days storage
Fig. 2. Brussels sprouts.JHeart leaves. Loss of vitamin C on storage.
Cheap market, outer leavesExpensive market, outer leavesCheap market, heart leavesExpensive market, heart leaves
% loss between1st and last days
45-2353-9245-9467-12
The percentage loss in both cases was higher in food purchased on theexpensive market, and was higher in heart leaves than outer leaves in bothsets of experiments. At the date of purchase the vegetables appeared equallyfresh, though those from the cheaper store were more bruised and wider open.
available at https://www.cambridge.org/core/terms. https://doi.org/10.1017/S0022172400028187Downloaded from https://www.cambridge.org/core. IP address: 65.21.228.167, on 05 Dec 2021 at 14:44:43, subject to the Cambridge Core terms of use,
GWENETH CHAPPELL 713
The latter lost less of their vitamin on storage, but their original content waslower than that of the former. The final vitamin contents of sprouts from bothmarkets were in comparatively close agreement.
The biological protective dose (1 mg. basis) of the leaves after 7 days'storage was as follows:
Heart leaf, cheap market ... ... 3-7Outer leaf, cheap market ... ... 5-7Heart leaf, expensive market ... ... 3-7Outer leaf, expensive market ... ... 3-7
It will be seen that the expensive vegetables showed a sharp initial fallwhile the cheap showed a slower and more even fall throughout the period ofstorage. It may be that the cheap were less fresh when purchased and hadalready suffered a sharp decline in their ascorbic acid content, and that withthe progress of time a low level is reached asymptotically. Both samples ofsprouts were grown in the same country locality and probably under closelyrelated conditions of culture. After 7 days the vegetables were too witheredfor human consumption. The loss of ascorbic acid was greater from the heartleaves than from the outer leaves, which caused a more even final distributionof vitamin throughout the plant. The degree of metabolic activity in thedeveloping tissue of heart leaves was evidently smaller than the destructionof vitamin on storage. The withholding of the plant food supply would retardthe metabolic changes in the cells of heart leaves and cause a diminution inthe production of ascorbic acid. A tentative explanation of these results isthat the oxidase which converts ascorbic acid to dehydro-ascorbic acid in thecut cabbage plant (Stone, 1937) is also present in sprouts, though no reference toits presence can be traced. Fujita & Ebihara (1939), however, claim that oxidizedascorbic acid exists in the green parts of plants. If this is the case, there may bereversibly oxidized ascorbic acid which would, on reduction with H2S, increasethe result obtained for vitamin C in sprouts. It was considered, however, thatsuch reversibly oxidized acid would be converted into the irreversibly oxidizedform after 7 days' storage, and only reduced ascorbic acid was tested.
Parsley and mushrooms were also stored in larder temperatures betweentests for vitamin C content.
ParsleyCheap market Day of purchase 2-51 mg. C per g.Cheap market 2 days later 1-38 mg. C per g.
Percentage loss 45-0.Expensive market Day of purchase 1-52 mg. C per g.Expensive market 2 days later 0-63 mg. C per g.
Percentage loss 58-6.
MushroomsClose, button mushrooms tested on the day of purchase and on the 3rd
and 5th days. Cheap market Expensive market1st day 0-023 mg. C per g. 0-024 mg. C per g.3rd day 0-059 mg. C per g. 0-06 mg. C per g.5th day 0-033 mg. C per g. 0-037 mg. C per g.
46-2
available at https://www.cambridge.org/core/terms. https://doi.org/10.1017/S0022172400028187Downloaded from https://www.cambridge.org/core. IP address: 65.21.228.167, on 05 Dec 2021 at 14:44:43, subject to the Cambridge Core terms of use,
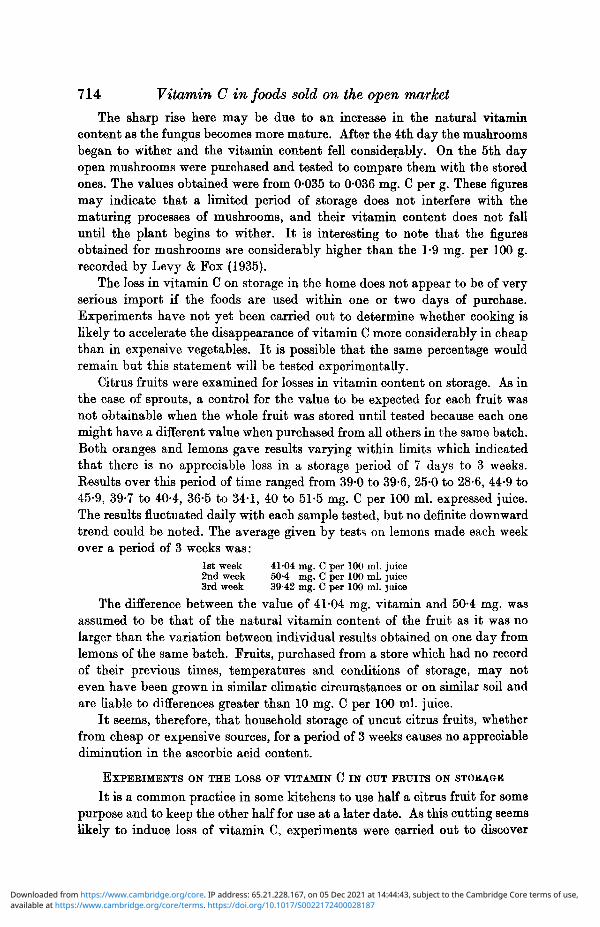
714 Vitamin C in foods sold on the open market
The sharp rise here may be due to an increase in the natural vitamincontent as the fungus becomes more mature. After the 4th day the mushroomsbegan to wither and the vitamin content fell considerably. On the 5th dayopen mushrooms were purchased and tested to compare them with the storedones. The values obtained were from 0*035 to 0-036 mg. C per g. These figuresmay indicate that a limited period of storage does not interfere with thematuring processes of mushrooms, and their vitamin content does not falluntil the plant begins to wither. It is interesting to note that the figuresobtained for mushrooms are considerably higher than the 1-9 mg. per 100 g.recorded by Levy & Fox (1935).
The loss in vitamin C on storage in the home does not appear to be of veryserious import if the foods are used within one or two days of purchase.Experiments have not yet been carried out to determine whether cooking islikely to accelerate the disappearance of vitamin C more considerably in cheapthan in expensive vegetables. It is possible that the same percentage wouldremain but this statement will be tested experimentally.
Citrus fruits were examined for losses in vitamin content on storage. As inthe case of sprouts, a control for the value to be expected for each fruit wasnot obtainable when the whole fruit was stored until tested because each onemight have a different value when purchased from all others in the same batch.Both oranges and lemons gave results varying within limits which indicatedthat there is no appreciable loss in a storage period of 7 days to 3 weeks.Results over this period of time ranged from 39-0 to 39-6, 25-0 to 28-6, 44-9 to45-9, 39-7 to 40-4, 36-5 to 34-1, 40 to 51-5 mg. C per 100 ml. expressed juice.The results fluctuated daily with each sample tested, but no definite downwardtrend could be noted. The average given by tests on lemons made each weekover a period of 3 weeks was:
1st week 41-04 mg. C per 100 ml. juice2nd week 50-4 mg. C per 100 ml. juice3rd week 39-42 mg. C per 100 ml. juice
The difference between the value of 41-04 mg. vitamin and 50-4 mg. wasassumed to be that of the natural vitamin content of the fruit as it was nolarger than the variation between individual results obtained on one day fromlemons of the same batch. Fruits, purchased from a store which had no recordof their previous times, temperatures and conditions of storage, may noteven have been grown in similar climatic circumstances or on similar soil andare liable to differences greater than 10 mg. C per 100 ml. juice.
It seems, therefore, that household storage of uncut citrus fruits, whetherfrom cheap or expensive sources, for a period of 3 weeks causes no appreciablediminution in the ascorbic acid content.
EXPERIMENTS ON THE LOSS OF VITAMIN C IN CUT FRUITS ON STORAGE
It is a common practice in some kitchens to use half a citrus fruit for somepurpose and to keep the other half for use at a later date. As this cutting seemslikely to induce loss of vitamin C, experiments were carried out to discover
available at https://www.cambridge.org/core/terms. https://doi.org/10.1017/S0022172400028187Downloaded from https://www.cambridge.org/core. IP address: 65.21.228.167, on 05 Dec 2021 at 14:44:43, subject to the Cambridge Core terms of use,
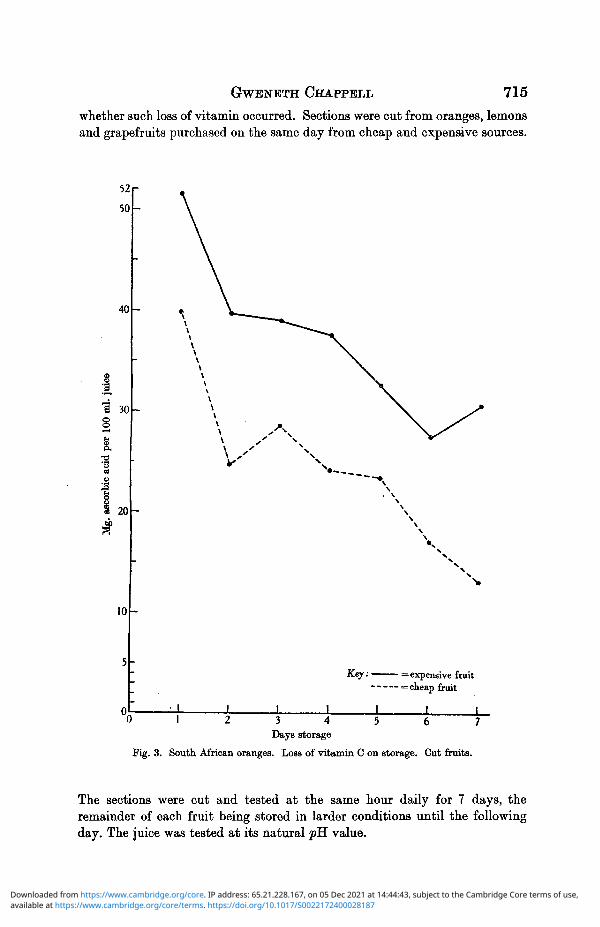
GWENETH CHAPPELL 715whether such loss of vitamin occurred. Sections were cut from oranges, lemonsand grapefruits purchased on the same day from cheap and expensive sources.
40
'.E"a 30
20
10
_L
Key: = expensive 6uit- ~ = cheap fruit
1 I I,0 1 2 3 4 5
Days storage
Fig. 3. South African oranges. Loss of vitamin C on storage. Cut fruits.
The sections were cut and tested at the same hour daily for 7 days, theremainder of each fruit being stored in larder conditions until the followingday. The juice was tested at its natural pH. value.
available at https://www.cambridge.org/core/terms. https://doi.org/10.1017/S0022172400028187Downloaded from https://www.cambridge.org/core. IP address: 65.21.228.167, on 05 Dec 2021 at 14:44:43, subject to the Cambridge Core terms of use,

Table
Cut fruitday1st2nd3rd4th5th6th7th
6. South Africanmg. C per 100
.Cheap market
39-824-728-624123-417113-1
oranges. Average results inml. expressed juiceExpensive
market51-539-639037-632-627-530-6
NotesBoth batches of oranges
were ripe and juicy,with firm flesh andskin. Fruits of similarsizes and weights werecompared.
Large Cyprus grapefruits were tested in the same manner.
Table 7. Cyprus grapefruits. Average results inmg. C per 100 ml. expressed juice
Cut fruitday1st2nd3rd4th5th6th7th
Cheap market31029-026-826-225-421-9210
Expensivemarket
36-534-236-526-034-726-229-6
NotesLarge, firm fruits of
similar size and weightwere compared witheach other.
401-
30
8,20o.Sa3
10
Key:-
_L _L _L _L
• = expensive fruit• = cheap fruit
I I3 4 5Days storage
Fig. 4. Cyprus grapefruits. Loss of vitamin C on storage. Cut fruits.
available at https://www.cambridge.org/core/terms. https://doi.org/10.1017/S0022172400028187Downloaded from https://www.cambridge.org/core. IP address: 65.21.228.167, on 05 Dec 2021 at 14:44:43, subject to the Cambridge Core terms of use,
GWENETH CHAPPELL
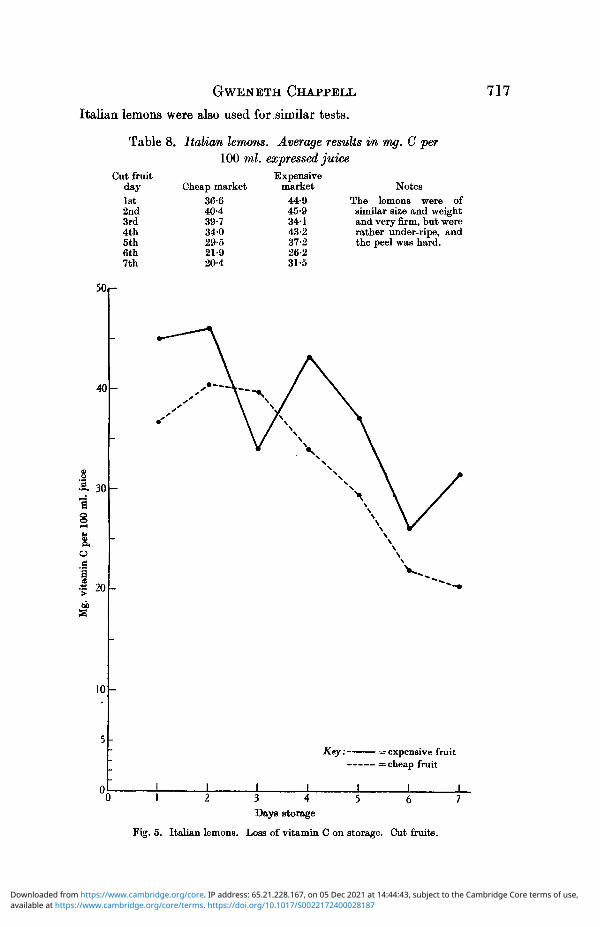
Italian lemons were also used for .similar tests.
Table 8. Italian lemons. Average results in mg. C per100 ml. expressed juice
NotesThe lemons were ofsimilar size and weightand very firm, but wererather under-ripe, andthe peel was hard.
50r-
717
Cut fruitday
1st2nd3rd4th5th6th7th
Cheap market36-640-439-734-029-521-920-4
Expensivemarket
44-945-934143-237-226-231-5
40
£301g
o.S
I 20
10
Key:- • = expensive fruit• = cheap fruit
II 2 3 4 5 6
Days storage
Fig. 5. Italian lemons. Loss of vitamin C on storage. Cut fruits.
available at https://www.cambridge.org/core/terms. https://doi.org/10.1017/S0022172400028187Downloaded from https://www.cambridge.org/core. IP address: 65.21.228.167, on 05 Dec 2021 at 14:44:43, subject to the Cambridge Core terms of use,
718 Vitamin C in foods sold on the open market
The loss of vitamin in every case was very irregular and did not appear tobe governed by the size, weight or original content of juice of each fruit, norto any great extent by the species. Variations in the ascorbic acid content offruits of one species occur when plants are grown on different soil and indifferent climates, under varying conditions of culture. The loss of vitamin Cin these experiments was largely peculiar to each fruit.
Maximum percentage losses in ascorbic acid
Cheap orangeExpensive orangeCheap lemonExpensive lemonCiheap grapefruitExpensive grapefruit
67-0946-649-542-932-2628-21
In some instances the value obtained on the 7th day was not the lowestof the series, so the percentages have also been calculated for the loss ofvitamin C between the 1st and 7th days.
Percentage loss between 1st and 1th daysCheap orangeExpensive orangeCheap lemonExpensive lemonCheap grapefruit...Expensive grapefruit
67-0940-5844-2629-8432-2618-90
In contradistinction to parsley and to brussels sprouts, the loss in all caseswas greater in the fruits from cheap sources which contained a smaller initialamount of available vitamin. At the end of 7 days there was only 13-1 mg.vitamin C %, in the orange from an inexpensive source, as compared with39-8 mg. on the day of purchase.
In all fruits examined the loss of antiscorbutic potency at the end of 7 dayswas great, and in the case of oranges the initial loss was rapid. Such food,therefore, should not be prepared for table by cutting or peeling until immedi-ately before serving. On exposure to air, the cut surfaces cause a loss of ascorbicacid by oxidation. Grapefruits appeared to lose less vitamin than oranges orlemons, which may be due to the larger volume of juice (used for estimation)in comparison with the exposed, cut surface of the section. Klodt & Stieb(1938) point out that the systems of stabilizers and oxidases affecting vitaminC vary widely in different species of fruits and vegetables and, therefore, thestability of the vitamin in such materials varies accordingly. Destruction isaccelerated by the presence of traces of copper in fruits and vegetables.
Oskima et al. (1937) make an interesting claim that after-ripened lemonsare richer in vitamin C than those ripened on the tree. This may have greatpractical value.
Some of the fruits tested in these experiments did not show a consistentfall in vitamin value and on some days there was an apparent rise, which mayhave been due to uneven ripening of the fruit or to variations in the distribution
available at https://www.cambridge.org/core/terms. https://doi.org/10.1017/S0022172400028187Downloaded from https://www.cambridge.org/core. IP address: 65.21.228.167, on 05 Dec 2021 at 14:44:43, subject to the Cambridge Core terms of use,
G W E N E T H CHAPPELL 719
of ascprbic acid throughout the parts of a plant or individual fruit. It wasconsidered important to investigate the cause of this variation.
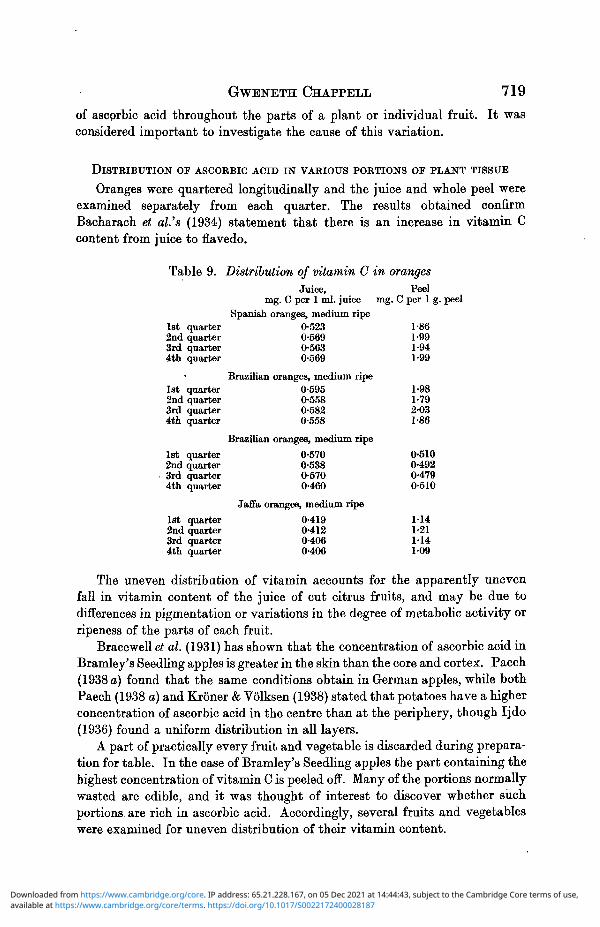
DISTRIBUTION OF ASCORBIC ACID IN VARIOUS PORTIONS OF PLANT TISSUE
Oranges were quartered longitudinally and the juice and whole peel wereexamined separately from each quarter. The results obtained confirmBacharach et al.'s (1934) statement that there is an increase in vitamin Ccontent from juice to flavedo.
Table 9. Distribution of vitamin C in orangesJuice, Peel
mg. C per 1 ml. juice mg. C per 1 g. peelSpanish oranges, medium ripe
1st quarter 0-523 1-862nd quarter 0-569 1-993rd quarter 0-563 1-944th quarter 0-569 1-99
Brazilian oranges, medium ripe1st quarter 0-595 1-982nd quarter 0-558 1-793rd quarter 0-582 2-034th quarter 0-558 1-86
Brazilian oranges, medium ripe1st quarter 0-570 0-5102nd quarter 0-538 0-4923rd quarter 0-570 0-4794th quarter 0-460 0-510
Jaffa oranges, medium ripe1st quarter 0-419 1-142nd quarter 0-412 1-213rd quarter 0-406 1-144th quarter 0-406 1-09
The uneven distribution of vitamin accounts for the apparently unevenfall in vitamin content of the juice of cut citrus fruits, and may be due todifferences in pigmentation or variations in the degree of metabolic activity orripeness of the parts of each fruit.
Brace well et al. (1931) has shown that the concentration of ascorbic acid inBramley's Seedling apples is greater in the skin than the core and cortex. Paech(1938 a) found that the same conditions obtain in German apples, while bothPaech (1938 a) and Kroner & Volksen (1938) stated that potatoes have a higherconcentration of ascorbic acid in the centre than at the periphery, though Ijdo(1936) found a uniform distribution in all layers.
A part of practically every fruit and vegetable is discarded during prepara-tion for table. In the case of Bramley's Seedling apples the part containing thehighest concentration of vitamin C is peeled off. Many of the portions normallywasted are edible, and it was thought of interest to discover whether suchportions, are rich in ascorbic acid. Accordingly, several fruits and vegetableswere examined for uneven distribution of their vitamin content.
available at https://www.cambridge.org/core/terms. https://doi.org/10.1017/S0022172400028187Downloaded from https://www.cambridge.org/core. IP address: 65.21.228.167, on 05 Dec 2021 at 14:44:43, subject to the Cambridge Core terms of use,
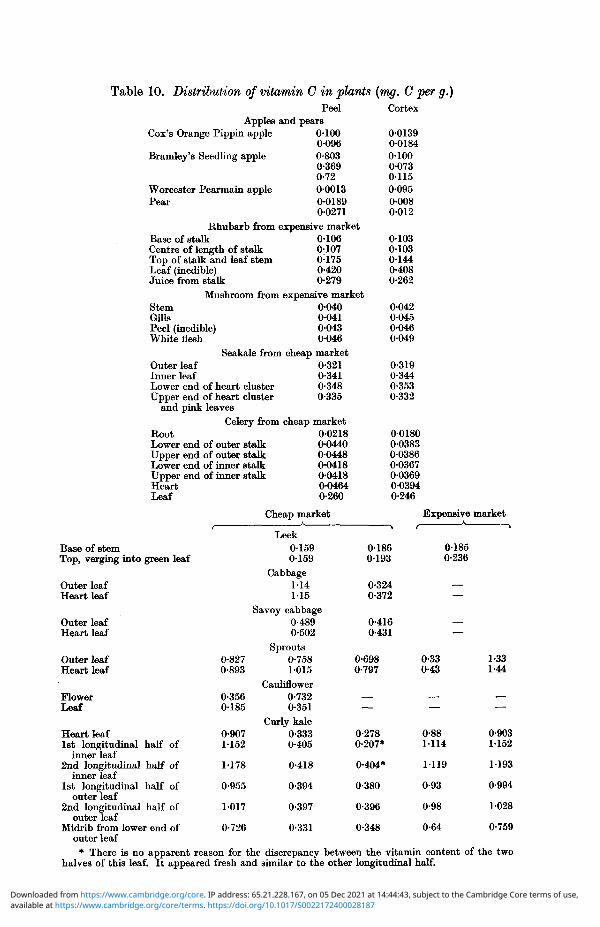
Table 10. Distribution of vitamin C in plants (mg. C per g.)Cortex
Cox's Orange Pippin apple
Bramley's Seedling apple
Worcester Pearmain applePear
PeelApples and pears
0-1000-0960-8030-3690-72000130-01890-0271
Rhubarb from expensive marketBase of stalk 0-106Centre of length of stalk 0-107Top of stalk and leaf stem 0-175Leaf (inedible) 0-420Juice from stalk 0-279
Mushroom from expensive marketStem 0-040Gills 0-041Peel (inedible) 0-043White flesh 0-046
Outer leafInner leafLower end of heart clusterUpper end of heart cluster
and pink leavesCelery from
RootLower end of outer stalkUpper end of outer stalkLower end of inner stalkUpper end of inner stalkHeartLeaf
Seakale from cheap market0-3210-3410-3480-335
cheap market0-02180-04400-04480-04180-0418004640-260
001390-01840-1000-0730-1150-0950-0080-012
0103010301440-4080-262
0-0420-0450-0460-049
0-3190-3440-3530-332
00180003830-03860-03670-0369003940-246
Cheap market
Base of stemTop, verging into green leaf
Outer leafHeart leaf
Outer leafHeart leaf
Outer leafHeart leaf
FlowerLeaf
0-8270-893
0-3560-185
0-9071152
1178
0-955
1017
0-726
Leek01590-159
Cabbage114115
Savoy cabbage0-4890-502
Sprouts0-7581015
Cauliflower0-7320-351
Curly kale0-3330-405
0-418
0-394
0-397
0-331
0-1860193
0-3240-372
0-4160-431
Expensive market
0-1850-236
0-6980-797
0-330-43
1-331-44
Heart leaf1st longitudinal half of
inner leaf2nd longitudinal half of
inner leaf1st longitudinal half of
outer leaf2nd longitudinal half of
outer leafMidrib from lower end of
outer leaf* There is no apparent reason for the discrepancy between the vitamin content of the two
halves of this leaf. It appeared fresh and similar to the other longitudinal half.
0-2780-207*
0-404*
0-380
0-396
0-348
0-881114
1119
0-93
0-98
0-64
0-9031-152
1193
0-994
1028
0-759
available at https://www.cambridge.org/core/terms. https://doi.org/10.1017/S0022172400028187Downloaded from https://www.cambridge.org/core. IP address: 65.21.228.167, on 05 Dec 2021 at 14:44:43, subject to the Cambridge Core terms of use,
GWENETH CHAPPELL 721
All the foods examined were used immediately after purchase. Widevariations in the results for curly kale can be explained by the variations infreshness of the different batches purchased at different sources.
The figures for celery are interesting in that the amounts of vitamin in theroot, stem and leaves are in the proportion of 1 : 2 : 12. The leaf is usuallydiscarded in preparation but is a good source of ascorbic acid.
The results for green vegetables emphasize the hypotheses that the in-fluencing factor in the amount of ascorbic acid found is the degree of metabolicactivity in the tissue. All heart stems, leaves and developing tissue gave higherresults than outer stems or leaves.
The experimental results indicate that there is a higher vitamin content inthe meristematic parts of the plants examined than in the older tissues.A belief is held in some laboratories that the outer leaves of lettuce or cabbageare richer in antiscorbutic factors than the inner leaves. This is true forvitamin A in cabbage, but the findings as regards vitamin C are ambiguous(Boas Fixsen & Boscoe, 1939-40); therefore the experimental results obtained areheld to be true for the foods analysed after purchase on the open market.
The two longitudinal halves of one leaf appear to contain almost identicalamounts of vitamin.
New Cyprus potatoes, purchased in January, were also examined. Fiveseparate tubers were cut so that a thin, transverse section (including skin)was obtained. The results for these sections were 0-127, 1-109, 0-102, 0-101,0-110 mg. vitamin C per g., which shows a close correlation between separatevegetables in one batch. Each potato was then cut for analysis.
Mean results, mg.ascorbic acid per g.
Thin transverse section, plus peel 0-1096Thin longitudinal section, plus peel 0-1096Peel, cut thinly 0-1177Flesh immediately under peel 0-1126Flesh from centre of potato 0-1069
These results differ a little from the previously reputed values, there beinga slightly higher concentration of vitamin C at the periphery than in the centre.The difference is small, though the usual statement that the best part of thepotato is immediately under the skin should be modified, at any rate regardingvitamin C and the "new" Cyprus potato, to which such a distribution may bepeculiar.
THE VITAMIN C RATION FROM CHEAP AND EXPENSIVE MARKETS
As so much value is laid on orange juice as an antiscorbutic, it was con-sidered of interest to compare the juices of different varieties in order todetermine which of these varieties gave the richest yield of available ascorbicacid.
Oranges were purchased from cheap and expensive sources and testedimmediately at their natural pH value.
available at https://www.cambridge.org/core/terms. https://doi.org/10.1017/S0022172400028187Downloaded from https://www.cambridge.org/core. IP address: 65.21.228.167, on 05 Dec 2021 at 14:44:43, subject to the Cambridge Core terms of use,
722 Vitamin C in foods sold on the open market
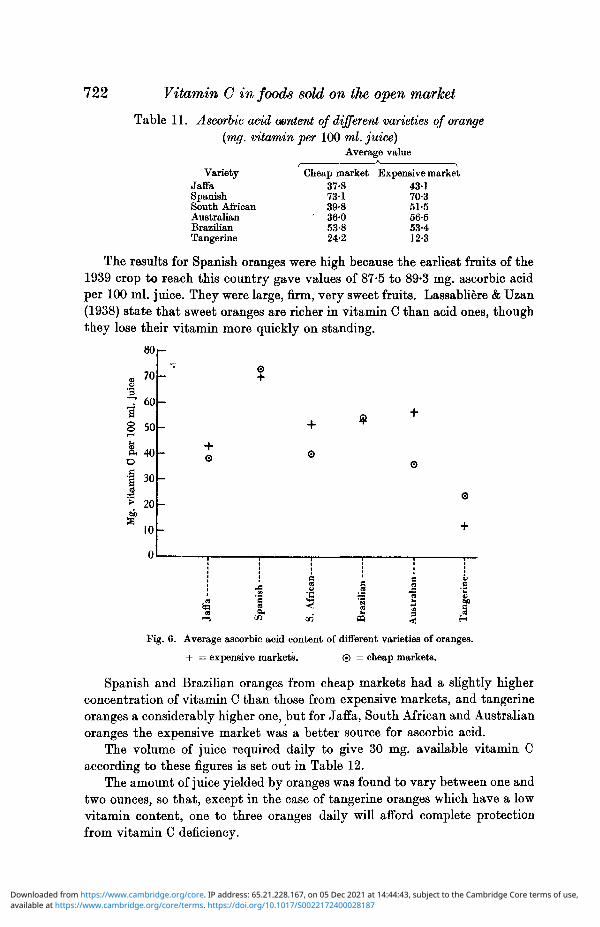
Table 11. Ascorbic acid oontent of different varieties of orange(mg. vitamin per 100 ml. juice)
Average value
Variety Cheap market Expensive marketJaffa 37-8 43-1Spanish 73-1 70-3South African 39-8 51-5Australian " 36-0 56-5Brazilian 53-8 53-4Tangerine 24-2 12-3
The results for Spanish oranges were high because the earliest fruits of the1939 crop to reach this country gave values of 87-5 to 89*3 mg. ascorbic acidper 100 ml. juice. They were large, firm, very sweet fruits. Lassabliere & Uzan(1938) state that sweet oranges are richer in vitamin C than acid ones, thoughthey lose their vitamin more quickly on standing.
80 r-
1°8 50
40
30J
20
1?10
©
.a
Afr
i
03 s
Fig. 6. Average ascorbic acid content of different varieties of oranges.
+ = expensive markets. ® = cheap markets.
Spanish and Brazilian oranges from cheap markets had a slightly higherconcentration of vitamin C than those from expensive markets, and tangerineoranges a considerably higher one, but for Jaffa, South African and Australianoranges the expensive market was a better source for ascorbic acid.
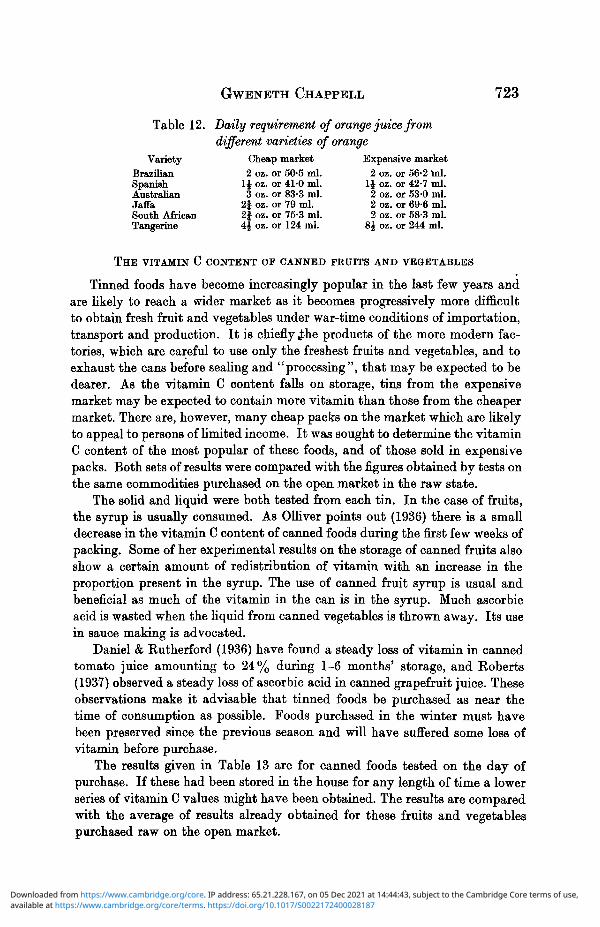
The volume of juice required daily to give 30 mg. available vitamin Caccording to these figures is set out in Table 12.
The amount of juice yielded by oranges was found to vary between one andtwo ounces, so that, except in the case of tangerine oranges which have a lowvitamin content, one to three oranges daily will afford complete protectionfrom vitamin C deficiency.
available at https://www.cambridge.org/core/terms. https://doi.org/10.1017/S0022172400028187Downloaded from https://www.cambridge.org/core. IP address: 65.21.228.167, on 05 Dec 2021 at 14:44:43, subject to the Cambridge Core terms of use,
GWENETH CHAPPELL 723
Table 12. Daily requirement of orange juice fromdifferent varieties of orange
VarietyBrazilianSpanishAustralianJaffaSouth AfricanTangerine
Cheap market2 oz. or 50-5 ml.
1J oz. or 41-0 ml.3 oz. or 83-3 ml.
2J oz. or 79 ml.2f oz. or 75-3 ml.4J oz. or 124 ml.
Expensive market2 oz. or 56-2 ml.
1J oz. or 42-7 ml.2 oz. or 53-0 ml.2 oz. or 69-6 ml.2 oz. or 58-3 ml.
8J oz. or 244 ml.
THE VITAMIN C CONTENT OF CANNED FRUITS AND VEGETABLES
Tinned foods have become increasingly popular in the last few years andare likely to reach a wider market as it becomes progressively more difficultto obtain fresh fruit and vegetables under war-time conditions of importation,transport and production. It is chiefly ,£he products of the more modern fac-tories, which are careful to use only the freshest fruits and vegetables, and toexhaust the cans before sealing and "processing", that may be expected to bedearer. As the vitamin C content falls on storage, tins from the expensivemarket may be expected to contain more vitamin than those from the cheapermarket. There are, however, many cheap packs on the market which are likelyto appeal to persons of limited income. It was sought to determine the vitaminC content of the most popular of these foods, and of those sold in expensivepacks. Both sets of results were compared with the figures obtained by tests onthe same commodities purchased on the open market in the raw state.
The solid and liquid were both tested from each tin. In the case of fruits,the syrup is usually consumed. As Olliver points out (1936) there is a smalldecrease in the vitamin C content of canned foods during the first few weeks ofpacking. Some of her experimental results on the storage of canned fruits alsoshow a certain amount of redistribution of vitamin with an increase in theproportion present in the syrup. The use of canned fruit syrup is usual andbeneficial as much of the vitamin in the can is in the syrup. Much ascorbicacid is wasted when the liquid from canned vegetables is thrown away. Its usein sauce making is advocated.
Daniel & Rutherford (1936) have found a steady loss of vitamin in cannedtomato juice amounting to 24% during 1-6 months' storage, and Roberts(1937) observed a steady loss of ascorbic acid in canned grapefruit juice. Theseobservations make it advisable that tinned foods be purchased as near thetime of consumption as possible. Foods purchased in the winter must havebeen preserved since the previous season and will have suffered some loss ofvitamin before purchase.
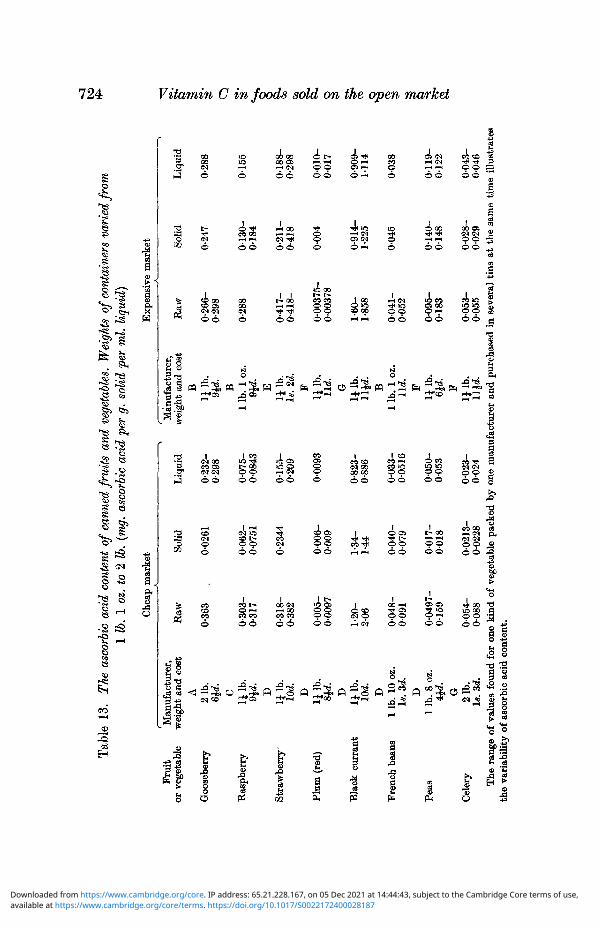
The results given in Table 13 are for canned foods tested on the day ofpurchase. If these had been stored in the house for any length of time a lowerseries of vitamin C values might have been obtained. The results are comparedwith the average of results already obtained for these fruits and vegetablespurchased raw on the open market.
available at https://www.cambridge.org/core/terms. https://doi.org/10.1017/S0022172400028187Downloaded from https://www.cambridge.org/core. IP address: 65.21.228.167, on 05 Dec 2021 at 14:44:43, subject to the Cambridge Core terms of use,
Tab
le 1
3.
The
asc
orbi
c ac
id c
onte
nt o
f ca
nned
frui
ts
and
vege
tabl
es. W
eigh
ts o
f co
ntai
ners
var
ied
from
1 lb
. 1
oz.
to
2 lb
. (m
g. a
scor
bic
acid
per
g.
soli
d pe
r m
l. li
quid
)
Fru
itor
veg
etab
le
Goo
sebe
rry
Ras
pber
ry
Str
awb
erry
Plu
m (
red)
Bla
ck c
urra
nt
Fre
nch
bean
s
Pea
s
Cel
ery
Man
ufac
ture
r,w
eigh
t an
d co
stA
2 1b
.6£
d. Cli
lb.
9Jd. D
lilb
.lO
d. Dli
lb.
T\ 1)
lilb
.lO
d. D1
lb.
10 o
z.Is
. 3d
.D
1 lb
. 8
oz.
4Jd. /-* G
21b.
1«. 3
d.
Che
ap
Raw
0-36
3
0-30
3-0-
317
0-31
8-0-
382
0-00
5-00
097
1-20
-2
06
0-04
8-0
09
1
0-04
97-
01
59
0-05
4-0-
088
mar
ket S
olid
0-02
61
0-06
2-0
07
51
0-23
44
00
06
-0-
009
1-34
-1-
44
0-04
0-0-
079
0-01
7-0
01
8
00
21
3-
0-02
28
Liq
uid
0-23
2-0-
298
0-07
5-0-
0843
0-15
5-0-
209
0009
3
0-82
3-0-
886
0-03
3-00
516
0-05
0-0-
053
0-02
3-0
02
4
Man
ufac
ture
r,w
eigh
t an
d co
stB
lilb
.9J
d. B1
lb.
1 oz
.9£
d. Eli
lb.
Is.
2d.
Fli
lb.
lid.
lilb
.H
id.
B1
lb.
1 oz
.li
d.
Fli
lb.
rli
lb.
Hid
.
Exp
ensi
ve m
arke
t
Raw
0-26
6-0-
298
0-28
8
0-41
7-0-
418-
0-00
375-
0-00
378
1-60
-1-
858
00
41
-0-
052
00
95
-0
18
3
0-05
3-0-
055
Sol
id
0-24
7
0-13
0-0-
184
0-21
1-0-
418
0-00
4
0-91
4-1-
225
0-04
5
0-14
0-0-
148
0-02
8-0
02
9
Liq
uid
0-28
8
01
55
0-18
8-0-
298
0-01
0-0
01
7
0-90
9-11
14
0-03
8
0-11
9-0
12
2
00
43
-0
04
6
•§ 2- a.
The
ran
ge o
f va
lues
fou
nd f
or
one
kind
of
vege
tabl
e pa
cked
by
one
man
ufac
ture
r an
d pu
rcha
sed
in s
ever
al t
ins
at
the
sam
e ti
me
illu
stra
tes
the
vari
abil
ity
of
asco
rbic
aci
d co
nten
t.
available at https://www.cambridge.org/core/terms. https://doi.org/10.1017/S0022172400028187Downloaded from https://www.cambridge.org/core. IP address: 65.21.228.167, on 05 Dec 2021 at 14:44:43, subject to the Cambridge Core terms of use,
G W E N E T H CHAPPELL 725
The amount of vitamin available to the consumer is greatly reduced whenthe liquid from canned vegetables is discarded. Even allowing for the wastageof all liquid there is still an appreciable amount of vitamin in French beans.The values for the vegetable purchased raw in the market ranged from 0-041to 0-091 mg. per g., while those of the canned vegetable were 0-04-0-079 mg.per g. It should be noted, however, that most canned vegetables are reheatedbefore serving which will result in a further, though small, loss of vitamin C.
In green peas of an expensive pack there were 0-14-0-148 mg. vitamin Cper g., whilst raw green peas bought from the market gave from 0-095-0-183mg. per g. The value found for green peas of a cheap pack was exceptionallylow, being only 0-017-0-018 mg. vitamin per g. It was noted, however, thatthe vegetables in those tins were old and husky and gave every appearance ofbeing soaked dried peas. This value would agree with such an assumption, asFixsen and Roscoe quote figures from 0-2-7 mg. ascorbic acid % for driedpeas.
Celery of an expensive pack retained approximately 25-53% of the valuefor celery. The ratio between the vitamin content of solid and liquid was1:1-6, and this liquid is particularly suited for sauce making.
With the exception of cheap raspberries, which contained only 0-062-0-075 mg. vitamin C per g. fruit and 0-75-0-084 mg. per ml. syrup as opposedto 0-303-0-317 mg. per g. of fresh fruit, the vitamin available to the consumerfrom both solid and syrup together was higher than that from the same quantityof raw fruit purchased on the open market. This may be because selected freshfield or orchard produce in optimum condition is chosen for canning, and there-fore its initial ascorbic acid content is probably considerably higher than thatof the same product after exposure for sale on the open market. It may also bethat the result of heating the plant tissues in canning processes is to soften thecells so that the cell contents are more readily and completely extracted.
If the last suggestion is correct raw foods, though containing higheramounts of vitamin C than cooked ones, may yet have less available vitaminand a greater part of it may be excreted unabsorbed in undigested foodresidues.
That there is an apparent increase in the vitamin C content of some foodson heating has been demonstrated by several workers (McHenry & Graham,1935 a, b; Van Eekelen, 1935; Guha & Sen-Gupta, 1938) and suggestions havebeen made to explain this phenomenon. Guha & Sen-Gupta put forward thesuggestion that vitamin C is present in a combined form which they call"ascorbigen" from which it is released on heating. The "ester" hypothesis ofMcHenry & Graham is a possible reason, though Mack (1936) rejects this viewand offer what would appear to be a more probable one. They claim that anapparent increase is due to the inhibition of the action of ascorbic acid oxidasein the cooked vegetable, while in the raw vegetable it remains fully active andcauses progressive destruction of the vitamin throughout the process ofextraction. Ascorbic acid oxidases have been found in a number of fruits and
available at https://www.cambridge.org/core/terms. https://doi.org/10.1017/S0022172400028187Downloaded from https://www.cambridge.org/core. IP address: 65.21.228.167, on 05 Dec 2021 at 14:44:43, subject to the Cambridge Core terms of use,
726 Vitamin C in foods sold on the open market
vegetables such as apples, bananas, peaches, squash, cabbage, carrot, cauli-flower, French beans, lettuce, watercress, beet tops, spinach, parsnip, pea,marrow, cucumber and potato. Stone (1937) denies their existence in peas,lettuce, spinach, lucerne and onions, while Tauber (1936) finds none in lemons,oranges, tangerine-oranges and grapefruits. The oxidase is inactivated by atemperature of 100° C. maintained for one minute.
Kohman et al. (1928), using biological methods, found that canningcaused no appreciable loss in the vitamin C content of cabbages, apples,spinach, pears, peas and strawberries. Vitamin C has also been added to runnerbeans and apples, and Zilva, Morris & Perry (1935) found that canningdestroyed approximately 25 % of the added acid.
From the standpoint of the average housewife it would appear satisfactoryto use canned fruits and vegetables where poor material only is available,though fresh garden produce is preferable. Experimental results also indicatethat the cheap packs are on an average as good a source of ascorbic acid as themore expensive ones, though in isolated cases abnormally low results may beobtained.
COMPARISON OF THE QUANTITY AND COST OF CHEAP AND EXPENSIVE RAW
AND CANNED PLANT FOODS REQUIRED TO YIELD 30 MG. OF VITAMIN C
The economic consideration is important to the housewife catering on a lowbudget, and a reference to the table of results will show that a 2 lb. tin ofgooseberries at %\d. contains 0-261 mg. vitamin C per g. solid and 0-298 mg.per ml. syrup, while a tin weighing \\ lb. and costing 9|d. contains 0-247 mg.vitamin C per g. solid and 0-288 mg. per ml. syrup. The cost of a day's rationof 30 mg. vitamin C from these fruits would be Id. and 2d. respectively.
The percentage results of the tins tested shows that 60% of the cheapfruits contain more vitamin than the expensive ones, and 33^% of thevegetables contain more ascorbic acid than their expensive equivalents.
Throughout the course of this work, the cost of all foods was carefully notedin order that due comparison might be made of the price of the average dailyprotective requirement of the adult body, from cheap and expensive sources.
Many values have been obtained for the vitamin C content of foods fromvarious sources on the open market, and these have been tabulated to show theamounts of each required to furnish 30 mg. vitamin C. Gothlin (1934) con-siders 19-27 mg. ascorbic acid daily is necessary to protect an adult of 60 kg.from scurvy. 30 mg. was therefore taken as the maximum requirement of anyadult.
To this table is appended the cost of this quantity of food, using the meanof the prices ruling when each sample of food was purchased. The effects of thesevere weather in early 1940, and of the war, caused a steep rise in the marketprice level of certain fruits and vegetables. The value given for canned foodsis for solid material only.
available at https://www.cambridge.org/core/terms. https://doi.org/10.1017/S0022172400028187Downloaded from https://www.cambridge.org/core. IP address: 65.21.228.167, on 05 Dec 2021 at 14:44:43, subject to the Cambridge Core terms of use,

Tab
le 1
4.
Tab
le o
f am
ount
s of
raw
and
can
ned
plan
t ti
ssue
req
uire
d t
o g
ive
30 m
g.
of a
scorb
ic a
cid
and t
he
cost
of
that
am
ount
g
Frui
t or
vege
tabl
eC
ox's
Ora
nge
Pipp
inap
ple
(cor
tex)
Bra
mle
y's
Seed
ling
(cor
tex)
Wor
cest
er P
earm
ain
(cor
tex)
Jeru
sale
m a
rtic
hoke
Apr
icot
Ban
ana
(und
er-r
ipe)
Ban
ana
(rip
e)Fr
ench
bea
nsB
eetr
oot
Bru
ssel
s sp
rout
sB
lack
curr
ant
Cab
bage
Cau
liflo
wer
Car
rot
Cel
ery
(ste
m)
Dat
eG
rape
s (S
. Am
eric
an)
Gra
pefr
uit
juic
eSe
akal
eC
urly
kal
eE
ndiv
eL
eek
Goo
sebe
rry
Lem
on ju
ice
Liv
erL
ettu
ce
Che
apm
arke
t,ra
w (
tabl
e)oz
.75
10J-
14
18-2
017
-18
16 9-l J|
11-2
2
1-3
i-l i 3
28-5
012
-19$
483-
585
3$-4 3 2-3
—5$
-6$
32
M 5 21
Cos
t of
that
quan
tity
2*. i
d.
— _
2id.
-2id
.li
d.
3d. id.
<id
.-id
.id
.-fr
l.<
id.
Id.
lid.
-3d.
3d.-
5d.
id.
Of}
.
id.-
ld.
2\d
.\d
.-\d
.—
ld.-
lid
.id
.id
.-hd
.5d
.is
. 2d.
Che
apm
arke
t,ca
nned
oz.
—
, .
13i-
26i
1-1
46£-
49£
.
— —.
— 4 —
Exp
ensi
vem
arke
t,C
ost
of th
at
raw
(tab
le)
quan
tity
oz
.27
J—58
$
—
9i
—
21
—
20-2
5—
40
$-62
- 12
—
8f-
9li
d.-l
s.
4\d.
20
£-25
J—
9
J-1
1
$f/.
|_J
2J_3
Jji
—
20J-
20J
ls.9
id.-
ls.U
id.
19-1
9Jl
nai
—
126|
-526
3—
2
J-3
1-3*
—
5-18
$—
. 4i
-5f
Id.
• 3
$-4
—
1J-3
—
2—
6|
-87f
Exp
ensi
vem
arke
t,C
ost
of th
at
cann
edqu
antit
y oz
.10
id.-
ls.
lOd.
—
2d.
—
6$d.
—
3d.—
id.
2s. l
lid.
-4s.
6W
.U
. -
lid.
—
Is.
2d.-
ls.
6d.
231
id.-
id.
\d.-
\d.
1-l
iid
. —
2$d,
iid.
~5d
. 3o\
l\JS
. D
jCt.
—•
Id.
—2\
d.
—
§d.-
ls.
9$d.
ld.-
lid
. —
lid.—
1$<2
. 4
$id
.—id
.3d
. —
8d.-
1s. l
OiJ
. —
Cos
t of
that
quan
tity
—
Is.
4Jrf
.
Is. 9
d. z —
o % IS H bd Q K r1 tr1 to
available at https://www.cambridge.org/core/terms. https://doi.org/10.1017/S0022172400028187Downloaded from https://www.cambridge.org/core. IP address: 65.21.228.167, on 05 Dec 2021 at 14:44:43, subject to the Cambridge Core terms of use,
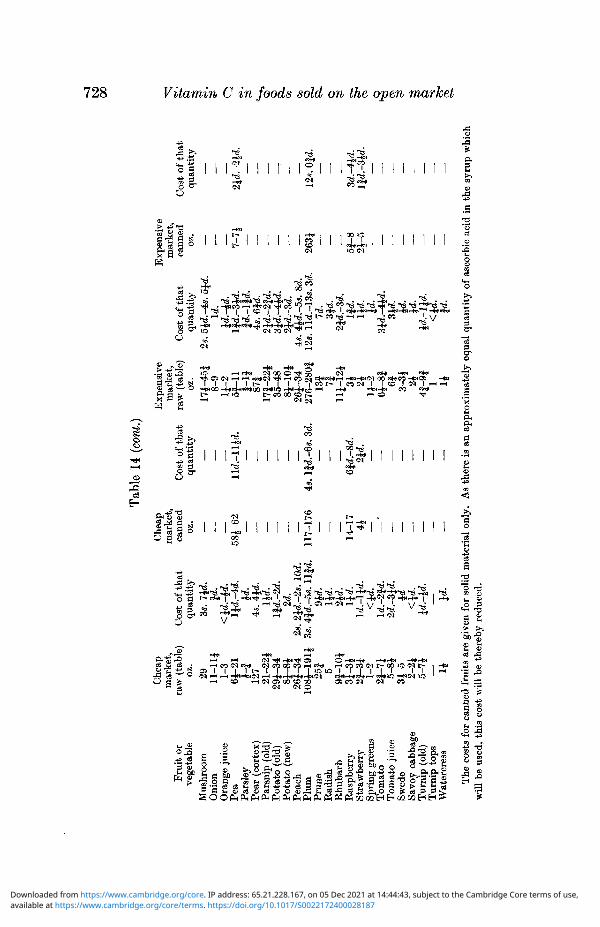
00
Frui
t or
vege
tabl
eM
ushr
oom
Oni
onO
rang
e ju
ice
Pea
Pars
ley
Pear
(co
rtex)
Pars
nip
(old
)P
otat
o (o
ld)
Pota
to (
new
)Pe
ach
Plum
Prun
eR
adis
hR
huba
rbR
aspb
erry
Stra
wbe
rry
Sprin
g gr
eens
Tom
ato
Tom
ato
juic
eSw
ede
Savo
y ca
bbag
eT
urni
p (o
ld)
Tur
nip
tops
Wat
ercr
ess
127
21-2
2i29
J-34
26J-
34
9I-1
0J3
i-3
i
1-2
2f-7
J5-
8J3J
-5 2-2J
5-7J H
Tab
le 1
4 (c
ont.
)
Che
apm
arke
t,ra
w (
tabl
e)oz
.29 11
- lli
1-3
Cos
t of
that
quan
tity
3s. '
Che
apm
arke
t,ca
nned
C
ost
of th
atoz
. qu
antit
y
<ld
.-td
.58
^-62
lld.-
llid
.
4.s.
lid.
id.
2s. 2
id.-
2s. l
Od.
3s. 4
Jd.-
5s.
Hid
.
lid-
2id.
lid.
Id.-
lid.
ld.-
2f'd
.2d
.-3i
d.id
117-
176
4s.
14-1
7
. 3d
.
2id.
id.-
id.
"id.
Exp
ensi
vem
arke
t,ra
w (
tabl
e)oz
.
8-9
li-2
Cos
t of
that
quan
tity
2s. 5
£d.-4
s. S
icId
.
1-1!
17f-
22i
35-4
88J
-10J
26J-
34
Jd.-
lid
.4s
. 6f
d.2i
d.-2
|d.
Exp
ensi
vem
arke
t,ca
nned
7-7J
2Jd.
-3d.
4*. 4
id.-
5s. 8
d.27
6-28
0|
12s.
lld.
-13s
. 3d
.7d
.
lli-
12*
3*
li-2
lid.
lid. id
.
4f-
9f
1*
id.
id.-
lid
.Kid
.
Cos
t of
that
quan
tity
263i
5|-8
12s.
0|d
.
lid
.Sid
.
aT
he c
osts
for
can
ned
frui
ts a
re g
iven
for
sol
id m
ater
ial
only
. A
a th
ere
is a
n ap
prox
imat
ely
equa
l qu
anti
ty o
f as
corb
ic a
cid
in th
e sy
rup
whi
chw
ill b
e us
ed, t
his
cost
will
be
ther
eby
redu
ced.
available at https://www.cambridge.org/core/terms. https://doi.org/10.1017/S0022172400028187Downloaded from https://www.cambridge.org/core. IP address: 65.21.228.167, on 05 Dec 2021 at 14:44:43, subject to the Cambridge Core terms of use,
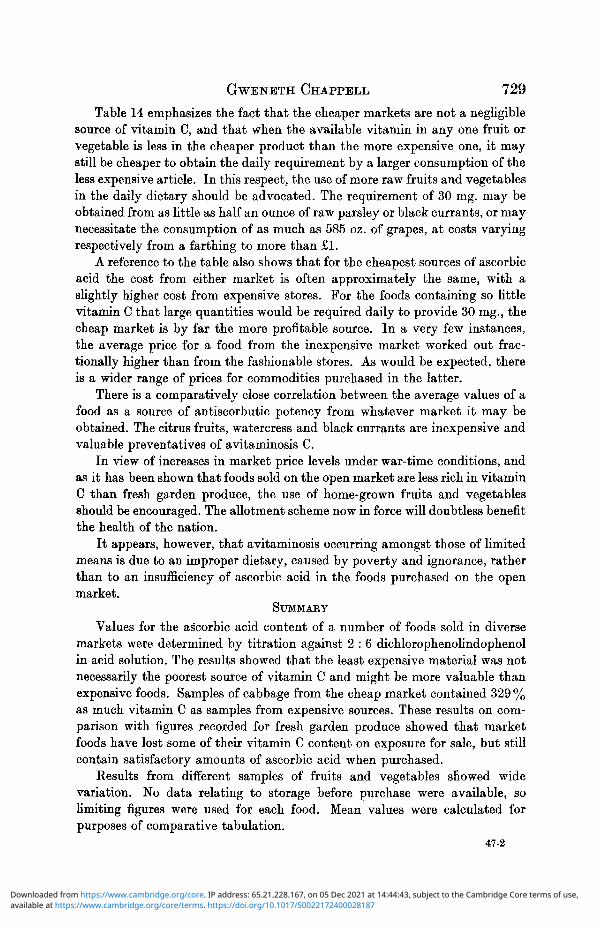
GWENETH CHAPPELL, 729
Table 14 emphasizes the fact that the cheaper markets are not a negligiblesource of vitamin C, and that when the available vitamin in any one fruit orvegetable is less in the cheaper product than the more expensive one, it maystill be cheaper to obtain the daily requirement by a larger consumption of theless expensive article. In this respect, the use of more raw fruits and vegetablesin the daily dietary should be advocated. The requirement of 30 mg. may beobtained from as little as half an ounce of raw parsley or black currants, or maynecessitate the consumption of as much as 585 oz. of grapes, at costs varyingrespectively from a farthing to more than £1.
A reference to the table also shows that for the cheapest sources of ascorbicacid the cost from either market is often approximately the same, with aslightly higher cost from expensive stores. For the foods containing so littlevitamin C that large quantities would be required daily to provide 30 mg., thecheap market is by far the more profitable source. In a very few instances,the average price for a food from the inexpensive market worked out frac-tionally higher than from the fashionable stores. As would be expected, thereis a wider range of prices for commodities purchased in the latter.
There is a comparatively close correlation between the average values of afood as a source of antiscorbutic potency from whatever market it may beobtained. The citrus fruits, watercress and black currants are inexpensive andvaluable preventatives of avitaminosis C.
In view of increases in market price levels under war-time conditions, andas it has been shown that foods sold on the open market are less rich in vitaminG than fresh garden produce, the use of home-grown fruits and vegetablesshould be encouraged. The allotment scheme now in force will doubtless benefitthe health of the nation.
It appears, however, that avitaminosis occurring amongst those of limitedmeans is due to an improper dietary, caused by poverty and ignorance, ratherthan to an insufficiency of ascorbic acid in the foods purchased on the openmarket.
SUMMARY
Values for the ascorbic acid content of a number of foods sold in diversemarkets were determined by titration against 2 : 6 dichlorophenolindophenolin acid solution. The results showed that the least expensive material was notnecessarily the poorest source of vitamin C and might be more valuable thanexpensive foods. Samples of cabbage from the cheap market contained 329 %as much vitamin C as samples from expensive sources. These results on com-parison with figures recorded for fresh garden produce showed that marketfoods have lost some of their vitamin C content on exposure for sale, but stillcontain satisfactory amounts of ascorbic acid when purchased.
Results from different samples of fruits and vegetables showed widevariation. No data relating to storage before purchase were available, solimiting figures were used for each food. Mean values were calculated forpurposes of comparative tabulation.
47-2
available at https://www.cambridge.org/core/terms. https://doi.org/10.1017/S0022172400028187Downloaded from https://www.cambridge.org/core. IP address: 65.21.228.167, on 05 Dec 2021 at 14:44:43, subject to the Cambridge Core terms of use,
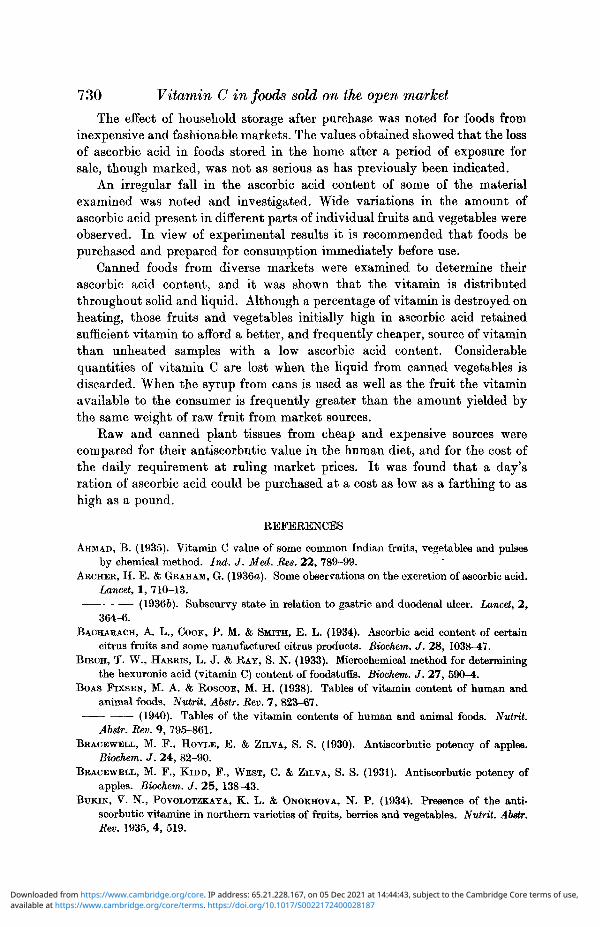
730 Vitamin C in foods sold on the open market
The effect of household storage after purchase was noted for foods frominexpensive and fashionable markets. The values obtained showed that the lossof ascorbic acid in foods stored in the home after a period of exposure forsale, though marked, was not as serious as has previously been indicated.
An irregular fall in the ascorbic acid content of some of the materialexamined was noted and investigated. Wide variations in the amount ofascorbic acid present in different parts of individual fruits and vegetables wereobserved. In view of experimental results it is recommended that foods bepurchased and prepared for consumption immediately before use.
Canned foods from diverse markets were examined to determine theirascorbic acid content, and it was shown that the vitamin is distributedthroughout solid and liquid. Although a percentage of vitamin is destroyed onheating, those fruits and vegetables initially high in ascorbic acid retainedsufficient vitamin to afford a better, and frequently cheaper, source of vitaminthan unheated samples with a low ascorbic acid content. Considerablequantities of vitamin C are lost when the liquid from canned vegetables isdiscarded. When the syrup from cans is used as well as the fruit the vitaminavailable to the consumer is frequently greater than the amount yielded bythe same weight of raw fruit from market sources.
Eaw and canned plant tissues from cheap and expensive sources werecompared for their antiscorbutic value in the human diet, and for the cost ofthe daily requirement at ruling market prices. It was found that a day'sration of ascorbic acid could be purchased at a cost as low as a farthing to ashigh as a pound.
REFERENCES
AHMAD, B. (1935). Vitamin C value of some common Indian fruits, vegetables and pulsesby chemical method. Ind. J. Med. Res. 22, 789-99.
ARCHER, H. E. & GRAHAM, G. (1936a). Some observations on the excretion of ascorbic acid.Lancet, 1, 710-13.
(19366). Subscurvy state in relation to gastric and duodenal ulcer. Lancet, 2,364-6.
BACHARACH, A. L., COOK, P. M. & SMITH, E. L. (1934). Ascorbic acid content of certaincitrus fruits and some manufactured citrus products. Biochem. J. 28, 1038-47.
BIRCH, T. W., HARRIS, L. J. & RAY, S. N. (1933). Microchemical method for determiningthe hexuronic acid (vitamin C) content of foodstuffs. Biochem. J. 27, 590-4.
BOAS FTXSEN, M. A. & ROSCOE, M. H. (1938). Tables of vitamin content of human andanimal foods. Nutrit. Abstr. Rev. 7, 823-67.
(1940). Tables of the vitamin contents of human and animal foods. Nutrit.Abstr. Rev. 9, 795-861.
BRAOEWELL, M. F., HOYLE, E. & ZILVA, S. S. (1930). Antiscorbutic potency of apples.Biochem. J. 24, 82-90.
BRACEWKLL, M. F., KIDD, F., WEST, C. & ZILVA, S. S. (1931). Antiscorbutic potency ofapples. Biochem. J. 25, 138^3.
BTJKIN, V. N., POVOLOTZKAYA, K. L. & ONOKHOVA, N. P. (1934). Presence of the anti-scorbutic vitamine in northern varieties of fruits, berries and vegetables. Nutrit. Abgtr.Rev. 1935, 4, 519.
available at https://www.cambridge.org/core/terms. https://doi.org/10.1017/S0022172400028187Downloaded from https://www.cambridge.org/core. IP address: 65.21.228.167, on 05 Dec 2021 at 14:44:43, subject to the Cambridge Core terms of use,
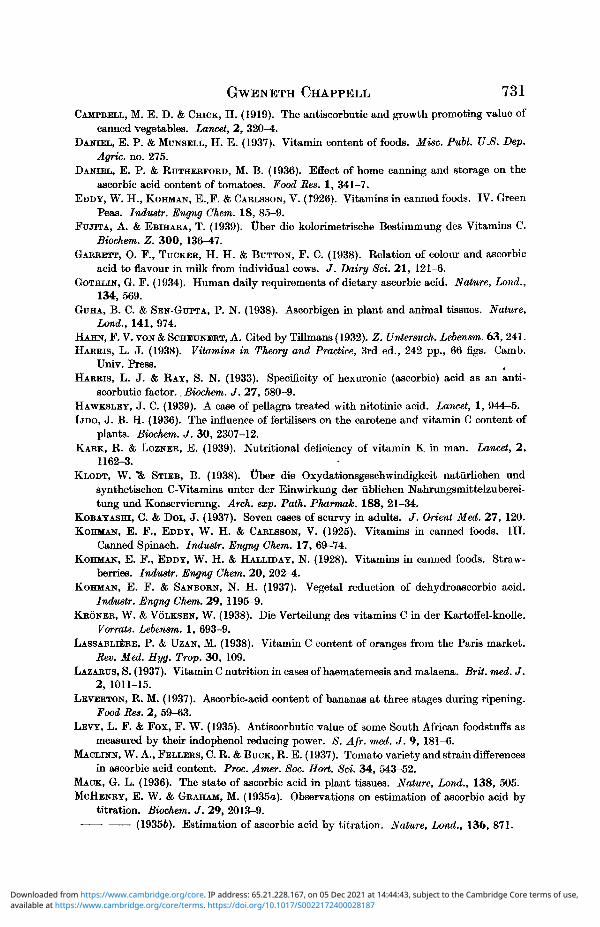
GWENETH CHAPPELL 731
CAMPBELL, M. E. D. & CHICK, H. (1919). The antiscorbutic and growth promoting value ofcanned vegetables. Lancet, 2, 320-4.
DANIEL, E. P. & MUNSELL, H. E. (1937). Vitamin content of foods. Misc. Publ. U.8. Dep.Agric. no. 275.
DANIEL, E. P. & RUTHERFORD, M. B. (1936). Effect of home canning and storage on theascorbic acid content of tomatoes. Food Res. 1, 341-7.
EDDY, W. H., KOHMAN, E..F. & CARLSSON, V. (1926). Vitamins in canned foods. IV. GreenPeas. Industr. Engng Chem. 18, 85-9.
FUJTTA, A. & EBIHARA, T. (1939). Uber die kolorimetrische Bestimmung des Vitamins C.Biochem. Z. 300, 136-47.
GARRETT, O. P., TUCKER, H. H. & BUTTON, P. C. (1938). Relation of colour and ascorbicacid to flavour in milk from individual cows. J. Dairy Sci. 21 , 121—6.
GOTHLIN, G. P. (1934). Human daily requirements of dietary ascorbic acid. Nature, Lond.,134, 569.
GUHA, B. C. & SEN-GUPTA, P. N. (1938). Ascorbigen in plant and animal tissues. Nature,Land., 141, 974.
HAHN, P. V. VON & SCHEUNERT, A. Cited by Tillmans (1932). Z. Untersuch. Lebensm. 63, 241.HARRIS, L. J. (1938). Vitamins in Theory and Practice, 3rd ed., 242 pp., 66 figs. Camb.
Univ. Press.HARRIS, L. J. & RAY, S. N. (1933). Specificity of hexuronic (ascorbic) acid as an anti-
scorbutic factor.. Biochem. J. 27, 580-9.HAWKSLEY, J. C. (1939). A case of pellagra treated with nitotinic acid. Lancet, 1, 944-5.LJDO, J. B. H. (1936). The influence of fertilisers on the carotene and vitamin C content of
plants. Biochem. J. 30, 2307-12.KARK, R. & LOZNER, E. (1939). Nutritional deficiency of vitamin K in man. Lancet, 2,
1162-3.KLODT, W. *& STIEB, B. (1938). Uber die Oxydationsgeschwindigkeit nattirlichen und
synthetischen C-Vitamins unter der Einwirkung der iiblichen Nahrungsmittelzuberei-tung und Konservierung. Arch. exp. Path. Pharmak. 188, 21-34.
KOBAYASHI, C. & Doi, J. (1937). Seven cases of scurvy in adults. J. Orient Med. 27, 120.KOHMAN, E. F., EDDY, W. H. & CARLSSON, V. (1925). Vitamins in canned foods. III.
Canned Spinach. Industr. Engng Chem. 17, 69-74.KOHMAN, E. P., EDDY, W. H. & HALLIDAY, N. (1928). Vitamins in canned foods. Straw-
berries. Industr. Engng Chem. 20, 202—4.KOHMAN, E. P. & SANBORN, N. H. (1937). Vegetal reduction of dehydroascorbic acid.
Industr. Engng Chem. 29, 1195-9.KRONER, W. & VOLKSEN, W. (1938). Die Verteilung des vitamins C in der Kartoffel-knolle.
Vorrats. Lebensm. 1, 693-9.LASSABLIERE, P. & UZAN, M. (1938). Vitamin C content of oranges from the Paris market.
Rev. Med. Hyg. Trop. 30, 109.LAZARUS, S. (1937). Vitamin C nutrition in cases of haematemesis and malaena. Brit. med. J.
2, 1011-15.LEVERTON, R. M. (1937). Ascorbic-acid content of bananas at three stages during ripening.
Food Res. 2, 59-63.LEVY, L. P. & Pox, P. W. (1935). Antiscorbutic value of some South African foodstuffs as
measured by their indophenol reducing power. S. Afr. med. J. 9, 181-6.MACLINN, W. A., FELLERS, C. R. & BUCK, R. E. (1937). Tomato variety and strain differences
in ascorbic acid content. Proc. Amer. Soc. Hort. Sci. 34, 543-52.MACK, G. L. (1936). The state of ascorbic acid in plant tissues. Nature, Lond., 138, 505.MCHENRY, E. W. & GRAHAM, M. (1935a). Observations on estimation of ascorbic acid by
titration. Biochem. J. 29, 2013-9.(19356). Estimation of ascorbic acid by titration. Nature, Lond., 136, 871.
available at https://www.cambridge.org/core/terms. https://doi.org/10.1017/S0022172400028187Downloaded from https://www.cambridge.org/core. IP address: 65.21.228.167, on 05 Dec 2021 at 14:44:43, subject to the Cambridge Core terms of use,
732 Vitamin C in foods sold on the open marketMATHIESEN, E. (1939). Variations in vitamin C content of potatoes. Nord. Med. 1, 42-4.OLLIVER, M. (1936). The ascorbic acid content of fruits and vegetables with special reference
to the effect of cooking and canning. J. Soc. Chem. Industr. 55, 156.(1940). Antiscorbutic values of fruits and vegetables. Lancet, 2, 190-3.
OSKHMA, Y., YAMAMOTO, B. & FUKUZAKI, T. (1937). Vitamin C contents of some fruits andvegetables of Formosa. J. Soc. Trop. Agric. 9, 156-61.
PAECH, K. (1938a). Die Verteilung der Ascorbinsaure in der Kartoffelknolle. Biochem. Z.298, 307-11.
(19386). Uber den vitamin C-Gehalt deutscher Apfel. Z. Untersuch. Lebensm. 76,234-9.
PLATT, R. (1936). Scurvy as the result of dietetic treatment. Lancet, 2, 366-7.ROBERTS, J. A. (1937). Vitamin C in citrus-juice beverages and canned grape-fruit juice.
Food Res. 2, 331-7.RUDRA, M. N. (1936). Distribution of vitamin C in different parts of common Indian food-
stuffs. Biochem. J. 30, 701-3.SCHETTNERT, A. & RESCHKE, J. (1938). Effect of method of preparation and use of cooking
box on vitamin C content of some vegetables. Vorrats. Lebensm. 1, 238^43.STONE, W. (1937). Ascorbic acid oxidase and state of ascorbic acid in vegetable tissues.
, Biochem. J. 31, 508-12.TAUBER, H. (1936). Stability of vitamin C, and absence of ascorbic acid oxidase in citrous
fruits and milk. Proc. Soc. exp. Biol, N. Y., 35, 422-3.THORNTON, N. C. (1938). Extraction and determination of vitamin C in plant tissues. Contr.
Boyce Thompson Inst. 9, 273.TILLMANS, J., HIRSCH, P. & JACKISCH, J. (1932). Das Reduktionsvermogen pflanzlicher
Lebensmittel und seine Beziehung zum Vitamin C. 3. Der Gehalt der verschiedenenObst- und Gemiisearten an reduzierendem Stoff. Z. Untersuch. Lebens. 63, 241-67.
TRIPP, F., SATTERFIELD, G. H. & HOLMES, A. D. (1937). Varietal differences in the vitamin C(ascorbic acid) content of tomatoes. J. Home Econ. 29, 258-62.
VAN EEKELEN, M. (1935). Estimation of ascorbic acid by titration. Nature, Lond., 136,144.YOUNG, J. BRUCE (1938). Adult scurvy associated with vitamin Bj deficiency. Lancet, 1,
1385-7.ZILVA, S. S., MORRIS, T. N. & PERRY, E. O. V. (1935). The preservation of vitamin C in
canning fruits and vegetables. Rep. Food Invest. Bdfor 1934, pp. 203-5.
(MS. received far publication 3. x. 40.—Ed.)
available at https://www.cambridge.org/core/terms. https://doi.org/10.1017/S0022172400028187Downloaded from https://www.cambridge.org/core. IP address: 65.21.228.167, on 05 Dec 2021 at 14:44:43, subject to the Cambridge Core terms of use,