Embed Size (px)
Citation preview
JOURNAL OF CATALYSIS 2, 380-396 (1963)
The Distribution of Reaction Rates and Activation Energies
on Catalytic Surfaces:
Exchange Reaction between Gaseous Benzene and
Benzene Adsorbed on Platinum
J. A. BRUNDEGE* AXD G. PARRAVANO
From the Department of Chemical an.d hletallrcrgical Engineering, Unieersity of Michigan, Ann Arbor, Alichigan
A mathematical derivation for the calculation of the distribution function of rate constants and activation energies for an isotopic exchange reaction between chemical species adsorbed on a solid surface and in the surrounding gas phase is presented. Starting from experimental kinetic isotherms, giving the rate of exchange as a function of time at various temperatures, it is shown how it is possible to derive the distribution functions of the rate constants and activation energies. The technique is applied to the exchange reaction between benzene molecules adsorbed on Pt black and molecules present in the gas phase. Experimental results on the rate of this exchange, obtained by means of C-14 labeled benzene, have been collected at 40”, 60”, 80”, and 100” C, at constant surface coverage. The range of activation energies for the exchange reaction was found to be from about 10 to 35 kcal/mole, while the pre-exponential factor varied from about 10’ to 10°C min+. Additional observations on the chemisorption of benzene on Pt black are presented. The effects of various pretreatments of the Pt surface and of aging of the chemisorbed benzene on the exchange rate are discussed.
INTRODUCTION
Extensive studies have been carried out in the past on the nature of the energy distribution at catalytic surfaces, and the interest of the investigators has been particu- larly attracted by those surfaces which have clearly shown a nonuniform? localization of the energy. The deviations of adsorption isotherms and isobars of many solid-gas systems from the “ideal” Langmuir be- havior, the variations of adsorption heat effects with the amount of surface covered, and the results on adsorption kinetics have served as the experimental basis for theo- retical deductions on chemisorption proc- esses at nonuniform surfaces (I). In general the measurements underlying these methods suffer from the fact that the possible influ- ence of interactions among adsorbate mole-
* Present Address: Monsanto Chemical Com- pany, St. Louis, Missouri.
t In th’ IS communication, the terms nonuniform and heterogeneous when applied to a solid surface are considered synonyms.
cules is superimposed on the effect of the nonuniform distribution of the energy on the surface of the adsorbent. Since interaction phenomena are dependent upon the degree of surface coverage, observations on surface heterogeneity are best carried out at con- stant surface coverage. In this direction the use of isotopic molecules has proved to be an invaluable tool to establish the heterogene- ous nature of several solid surfaces. In the kinetic isotopic method (3), which involves measurements on the rate of isotopic ex- change reactions between adsorbed and gas phase species, each labeled molecule leaving the surface is replaced by a chemically identical molecule. Thus the surface cover- age, and hence the interactions among adsorbed molecules remain constant.
This method has already been used to gather information on catalytic surfaces including the adsorption of CO on Fe (.2), of Hz on Ni-SiOl (4), of CO on Ni films (5), and of Hz on Pt (6). In the first three studies cited the method was used only to demon- strate qualitatively the heterogeneity of the
380
REACTION RATES AND ACTIVATION ENERGIES ON CATALYTIC SURFACES 381
surface, while in the latter instance, the relation between the activation energy of the Hs-Dz reaction and the extent of conversion was obtained by comparing the rate of reac- tion at different temperatures for the same extent of conversion. This procedure implies that molecules adsorbed on surface regions, corresponding to a value of the activation energy of reaction lower than a fixed quan- tity, will all have reacted, while the opposite will occur to molecules adsorbed on surface sites possessing a higher value of the reaction activation energy. This, of course, is not strictly valid, since adsorbed species from all regions of the surface contribute to the observed rate. The activation energy of the exchange reaction cannot be shown as a function of the fraction reacted, but can be represented as a function of the fraction of surface sites having activation energies less than or equal to a certain value.
In the present study the kinetic isotopic method was applied to the exchange reaction :
Ca*H&ds) + C&(g) ---) ~s*H&) + CXbWe)
where C&H6(ads) and CeHe(g) represent a benzene molecule adsorbed on a solid surface and one in the gas phase, respectively. Pt was chosen as the adsorbent. The adsorption of benzene on Pt and other transition metals is known to occur with varying degrees of bonding strength and involving different numbers of surface atoms per molecule adsorbed (7, 8). It was hoped that this situation would be of interest in discussions on the nature of the energy distribution at solid surfaces. A molecular orbital theory calculation of the heat of adsorption of benzene on platinum has given the value of 108 kcal/mole (IO), thus pointing to large irreversible adsorption effects.
These effects have been confirmed by the present study. We have found that benzene was adsorbed on platinum black at first very rapidly at temperatures up to 150°C even at pressures below 0.1 mm Hg. This was followed by a slow disappearance of gas phase benzene which, however, did not have appreciable effect on the reactivity or amount of the initially adsorbed benzene. On supported Pt there is a similar trend (8), and a strong irreversible adsorption of benzene corresponding to 0.22 molecules of
benzene/atom of Ft has been reported to take place at temperatures up to 250%. It is also known that the adsorption of benzene on Pt at 83°K lowers the work function of the metal, indicating that d electrons are displaced to the metal surface (11). Further evidence of this effect was gathered by measuring the changes in elec- trical conductivity of Ft upon chemisorption of benzene (Id).
DERIVATION OF THE EXCHANGE KINETICS ON A HETEROGENEOUS SURFACE
In this work the heterogeneity of a solid surface is described by the distribution of activation energies for the exchange reaction between gaseous and chemisorbed molecules. The distribution, p(E), is defined in such a manner that p(E)dE is the fraction of ad- sorption sites having an activation energy between E and E + dE. It is assumed that for each value of the activation energy, E, there exists at any given temperature a corresponding value of the exchange reac- tion rate constant, k.
k = ,&+IRT (1)
This a.ssumption is correct if 4 is either a constant or a function of T and E only:
ko = f@,T) w
Lo is assumed to be a constant by most investigators. In this instance Eq. (2) be- comes the Arrhenius equation. Since k is a function of E and T, at a given temperature there must exist a corresponding rate con- stant distribution function, p(k), related to P(E) by
p(k)dk = -p(E)dE (3)
The minus sign in the above equation results from the fact that the activation energy and the rate constant are antibatically related.
Let us now consider an isotopic exchange reaction between gaseous molecules and molecules chemisorbed on a uniform surface (or a uniform portion of a nonuniform sur- face). Let the initially chemisorbed molecules be labeled and let the conditions of the reaction be such that the concentration of labeled molecules in the gas phase is negli- gible at all times. This condition is easily achieved in a flom--type reactor in which the
382 BRUNDEGE AND PARRAVANO
gas containing the unlabeled molecules makes a single pass through the reactor. Under these conditions the exchange reac- tion must be first order and the reaction rate of the labeled molecules is proportional to the fraction of labeled molecules still chemisorbed on the surface, 0:
7-(t) = -de/dt = ke (4)
Integration of the above equation from time zero to time t and substitution gives:
r(t) = keekt (5)
On a nonuniform surface Eq. (5) applies only to a differential portion of the surface:
h(t) = ke-ktp(k)dk (6)
and the reaction rate for the entire surface is obtained by integrating Eq. (6) over all values of the reaction rate constant:
r(t) = f:r kp(k)e-kfdk (7)
The minimum rate constant may be taken as zero, while the maximum should cor- respond to an activation energy of zero so that Ic,,, = ko. Since ko is known to be very large, the upper limit may be taken as infinity with negligible error:
r(t) = km kp(k)e-ktdk (8)
Equation (8) gives an expression for the kinetic isotherm for a given rate constant distribution. In this work the reaction rates were measured as a function of time and the problem is to solve Eq. (8) for the distribu- tion function p(k). It may be seen that Eq. (8) is the Laplace transform of kp(k) so that
P(k) = (w)C-‘{ r(t) 1 (9)
In order to compute p(k) it is necessary to express the rate as a function of time in a mathematical form whose inverse transform can be computed. Since there exists no ade- quate theory of nonuniform surfaces the rate data must be expressed in a mathe- matical form which is necessarily arbitrary. It can be shown (1s) that the inverse Laplace transform of a function, r(t), is unique. Therefore, a given kinetic isotherm can be the result of only one rate constant distribution.
In order to obtain the distribution of the activation energy, p(E), the relation (3) may be written
p(E) = -p(k)dk/dE
and from the relation (1)
(10)
dbkd dE 1 01)
so that
~6% = kp(k)WRT - 0)
where @ = d(lnk,,)/dE.
(12)
If ko were the same for all surface sites then 0 would be zero and the calculation of p(E) would be greatly simplified. This pro- cedure has been followed in the past (1, 14). It will be shown later that such an assump- tion is not justified, at least in the case of reaction (1) on Pt. If the values of /3 were known, one could calculate from Eq. (12) the values of the function p(E) correspond- ing to each value of k; but there would still remain the problem of finding the corre- sponding values of E. In order to obtain the value of E for a nonuniform surface it is necessary to compare the rate constants of similar portions of the surface at various temperatures. Under the assumption con- tained in Eq. (2) the relation between ad- sorption sites and their rate constants (and also their activation energies) remains un- changed during variations in temperature. The relative positions of the adsorption sites with respect to ascending values of their activation energies (or descending values of their rate constants) are given by the integral distribution function, S(E), which is defined by:
S(E) = r p(E’)dE’ (13)
where h” is a dummy variable used in place of E. This function may also be expressed in terms of k as:
X(E) 7 h” p(k’)dk’ (14)
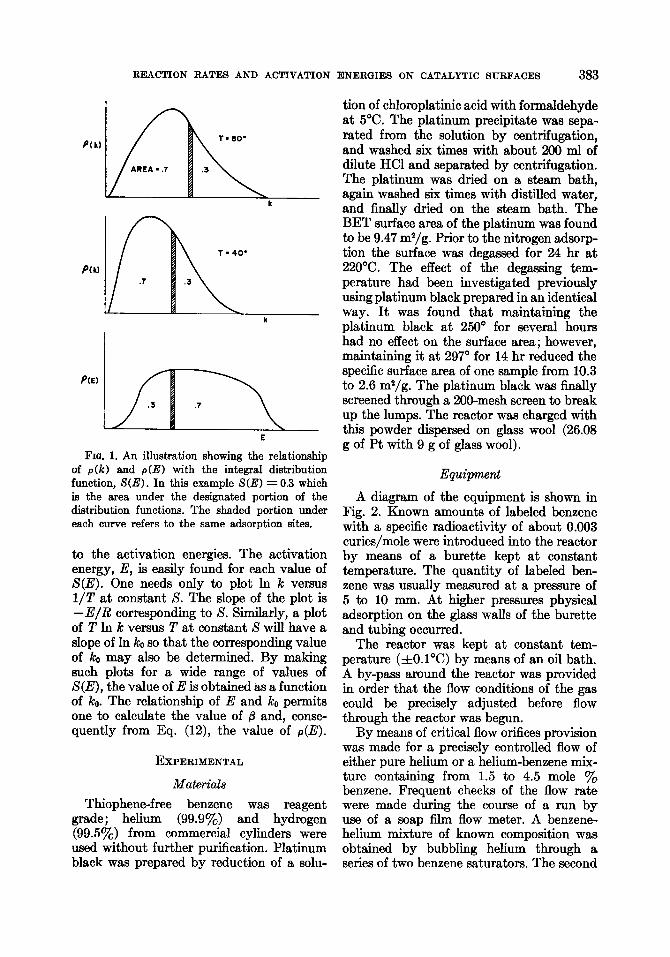
where k is the rate constant corresponding to E. Figure 1 illustrates the relationship of the integral distribution function to the rate constants at different temperatures and
REACTION RATES AND ACTIVATION
k
L .3
E
FIQ. 1. An illustration showing the relationship of p(k) and p(E) with the integral distribution function, S(E). In this example S(E) = 0.3 which is the area under the designated portion of the distribution functions. The shaded portion under each curve refers to the same adsorption sites.
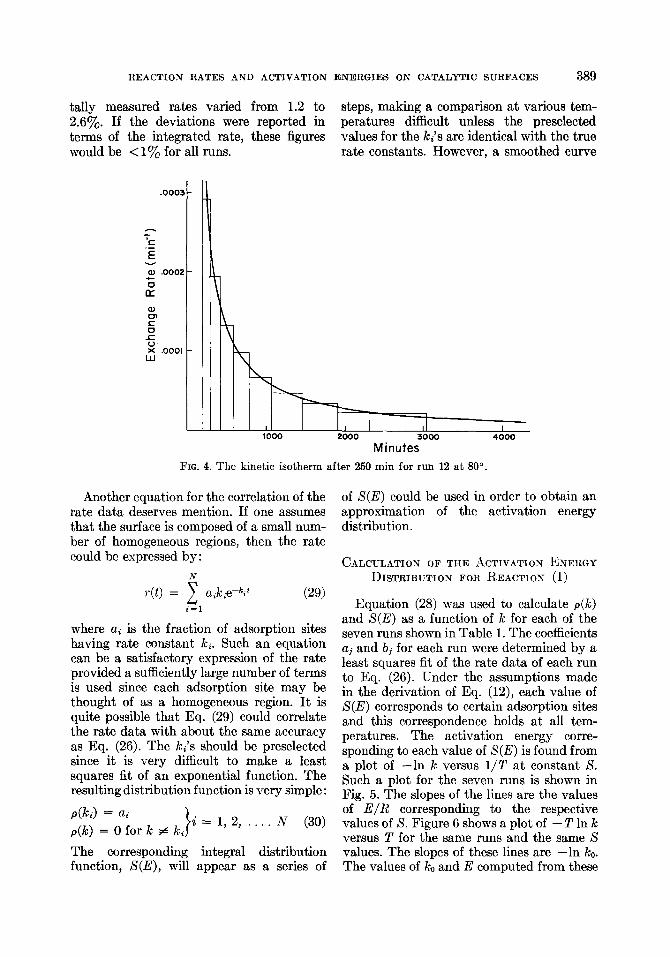
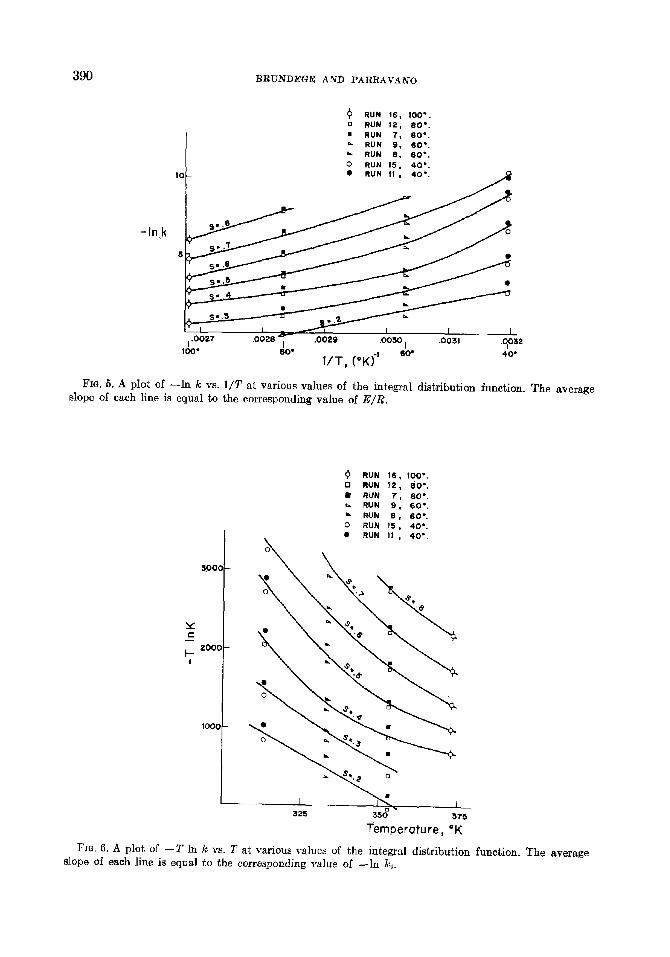
to the activation energies. The activation energy, E, is easily found for each value of S(E). One needs only to plot In k versus l/T at constant S. The slope of the plot is -E/R corresponding to S. Similarly, a plot of T In k versus T at constant S will have a slope of In ko so that the corresponding value of k. may also be determined. By making such plots for a wide range of values of S(E), the value of E is obtained as a function of ko. The relationship of E and k. permits one to calculate the value of /3 and, conse- quently from Eq. (12), the value of p(E).
EXPERIMENTAL
Materials
Thiophene-free benzene was reagent grade; helium (99.9%) and hydrogen (99.5%) from commercial cylinders were used without further purification. Platinum black was prepared by reduction of a solu-
ENERGIES ON CATALYTIC SURFACES 383
tion of chloroplatinic acid with formaldehyde at 5°C. The platinum precipitate was sepa- rated from the solution by centrifugation, and washed six times with about 200 ml of dilute HCl and separated by centrifugation. The platinum was dried on a steam bath, again washed six times with distilled water, and finally dried on the steam bath. The BET surface area of the platinum was found to be 9.47 m2/g. Prior to the nitrogen adsorp- tion the surface was degas& for 24 hr at 220°C. The effect of the degassing tem- perature had been investigated previously using platinum black prepared in an identical way. It was found that maintaining the platinum black at 250” for several hours had no effect on the surface area; however, maintaining it at 297” for 14 hr reduced the specific surface area of one sample from 10.3 to 2.6 m2/g. The platinum black was finally screened through a 200-mesh screen to break up the lumps. The reactor was charged with this powder dispersed on glass wool (26.08 g of Pt with 9 g of glass wool).
Equipment
A diagram of the equipment is shown in Fig. 2. Known amounts of labeled benzene with a specific radioactivity of about 0.003 curies/mole were introduced into the reactor by means of a burette kept at constant temperature. The quantity of labeled ben- zene was usually measured at a pressure of 5 to 10 mm. At higher pressures physical adsorption on the glass walls of the burette and tubing occurred.
The reactor was kept at constant tem- perature (&O.l”C) by means of an oil bath. A by-pass around the reactor was provided in order that the flow conditions of the gas could be precisely adjusted before flow through the reactor was begun.
By means of critical flow orifices provision was made for a precisely controlled flow of either pure helium or a helium-benzene mix- ture containing from 1.5 to 4.5 mole y0 benzene. Frequent checks of the flow rate were made during the course of a run by use of a soap film flow meter. A benzene- helium mixture of known composition was obtained by bubbling helium through a series of two benzene saturators. The second
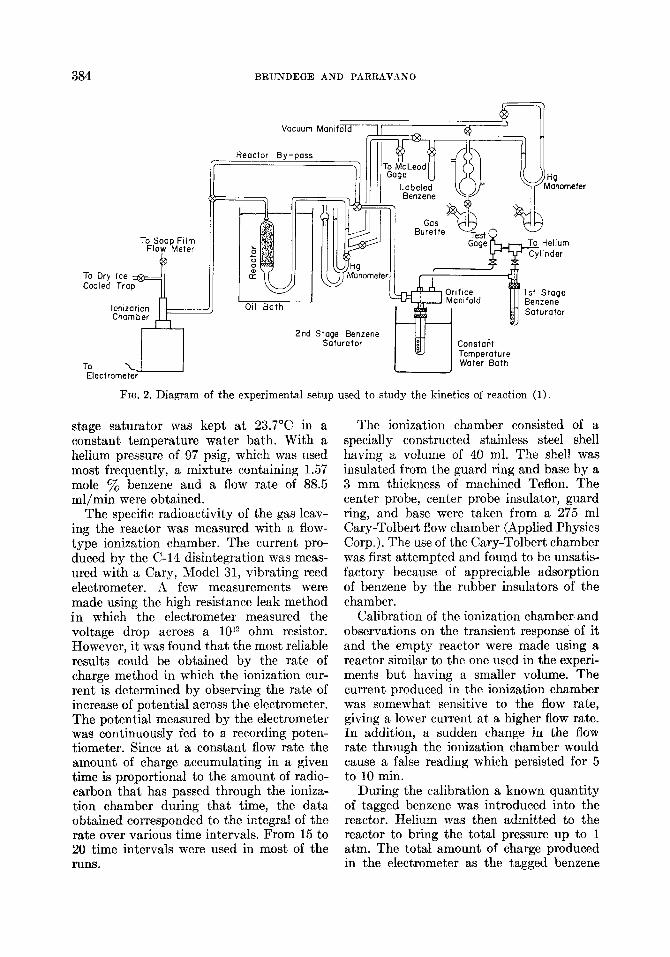
384 BRUNDEGE AND PARRAVANO
Vacuum Monif
To Soap Film Flow Meter
A
IfIce amfold
1st Stage Benzene Soturotor
2nd Stage Benzene Soturotor Constar?
Temperature Water Bath
FIG. 2. Diagram of the experimental setup used to study the kinetics of reaction (1)
stage saturator was kept at 23.7”C in a constant temperature water bath. With a helium pressure of 97 psig, which was used most frequently, a mixture containing 1.57 mole y0 benzene and a flow rate of 88.5 ml/min were obtained.
The specific radioactivity of the gas leav- ing the reactor was measured with a flow- type ionization chamber. The current pro- duced by the C-14 disintegration was meas- ured with a Gary, Model 31, vibrating reed electrometer. A few measurements were made using the high resistance leak method in which the electrometer measured the voltage drop across a 10’” ohm resistor. However, it was found that the most reliable results could be obtained by the rate of charge method in which the ionization cur- rent is determined by observing the rate of increase of potential across the electrometer. The potential measured by the electrometer was continuously fed to a recording poten- tiometer. Since at a constant flow rate the amount of charge accumulating in a given time is proportional to the amount of radio- carbon that has passed through the ioniza- tion chamber during that time, the data obtained corresponded to the integral of the rate over various time intervals. From 15 to 20 time intervals were used in most of the runs.
The ionization chamber consisted of a specially constructed stainless steel shell having a volume of 40 ml. The shell was insulated from the guard ring and base by a 3 mm thickness of machined Teflon. The center probe, center probe insulator, guard ring, and base were taken from a 275 ml Cary-Tolbert flow chamber (Applied Physics Corp.). The use of the Cary-Tolbert chamber was first attempted and found to be unsatis- factory because of appreciable adsorption of benzene by the rubber insulators of the chamber.
Calibration of the ionization chamber and observations on the transient response of it and the empty reactor were made using a reactor similar to the one used in the experi- ments but having a smaller volume. The current produced in the ionization chamber was somewhat sensitive to the flow rate, giving a lower current at a higher flow rate. In addition, a sudden change in the flow rate through the ionization chamber would cause a false reading which persisted for 5 to 10 min.
During the calibration a known quantity of tagged benzene was introduced into the reactor. Helium was then admitted to the reactor to bring the total pressure up to 1 atm. The total amount of charge produced in the electrometer as the tagged benzene
REACTION RATES AND ACTIVATION ENERGIES ON CATALYTIC SURFACES 385
was swept out of the reactor and through the ionization chamber was measured. For a flow rate of 140 ml/min the calibration factor was 3.06 X 1O-4 ~moles/(ml/min)/(% of 30 mv scale), while for a flow rate of 87.3 ml/min the calibration factor was 2.94 X 10-d.
When pure helium was used to sweep the tagged benzene out of the reactor about 85y0 would be swept out during the first 30 min and about 99% would be swept out in 4 hr. When a helium-benzene mixture containing about 1.5% benzene was used to sweep the tagged benzene out of the reactor, 99% of the tagged benzene would be swept out during the first 60 min.
Procedure Prior to each run the platinum surface
was cleaned, reactivated, and covered with chemisorbed labeled benzene by the follow- ing procedure:
1. The reactor was purged with hydrogen for 1 hr at a temperature of 120”. This treatment removed all of the previous ben- zene from the platinum surface.
2. Subsequently the reactor was evacu- ated for about l/2 hr; air was admitted slowly and flowed through the reactor for a few seconds. This treatment oxidized the chemisorbed hydrogen and reactivated the surface. Elimination of this step resulted in a surface with a greatly reduced adsorptive capacity.
3. Then the reactor was evacuated for about l/2 hour in order to remove all of the gas phase oxygen. Then hydrogen was ad- mitted slowly to remove chemisorbed oxy- gen.
4. Next the reactor was evacuated, heated to 150”, and kept under vacuum at 150’ for 20 hr. At the end of the 20 hr period the reactor pressure was about 10eB mm. This treatment removed most of the adsorbed hydrogen.
5. The reactor was cooled to 120” and labeled benzene vapor was admitted to the reactor in one or more measured portions. Usually benzene would be admitted until a sharp rise in pressure was observed. It was found that an “equilibrium” pressure of 0.05 mm represented about a 10% excess of benzene over that required to completely
fill the strong adsorption sites. In general, this corresponded to a surface coverage of the Pt of about 0.09, varying between 0.11 at the beginning of the series of runs and 0.06 at the end.
6. Helium was admitted to the reactor to bring it to atmospheric pressure and helium flowed through the reactor at a measured rate. The amount of labeled benzene swept out of the reactor and flowing through the ionization chamber was measured. The helium purge was continued until no labeled benzene was detectable in the reactor effluent.
7. Twenty-four hours after the labeled benzene was first admitted to the reactor, the latter was quickly cooled from 120” to the desired exchange reaction temperature. Adsorption at 120” and aging for 24 hr at this temperature was the standard condition- ing the system received before each run. The longer the aging period and the higher the aging temperature the slower the exchange reaction rate was found to be. By aging the chemisorbed benzene for 24 hr at a tem- perature substantially above the reaction temperature, a negligible amount of aging occurred during the course of the exchange reaction, which generally lasted from 2 to 5 days. The amount of aging that the system received was the same for all runs regardless of the run temperature.
After the reactor had cooled to the desired temperature and the exchange reaction was begun, the concentration of labeled benzene in the reactor effluent was measured in the ionization chamber. After several days of measurements, the rate of the exchange reaction became exceedingly slow, and the reaction was stopped by purging all gas phase benzene from the reactor with pure helium. The reactor was then heated to a higher temperature while continuing the helium purge, the exchange reaction re- started, and the rates measured as described in the preceding paragraph. This step was repeated again at a higher temperature. The last and highest temperature used in each experiment was 120’.
RESULTS
The experimental technique described above was evolved through a series of experi-
386 BRUNDEGE AND P,4RRAVANO
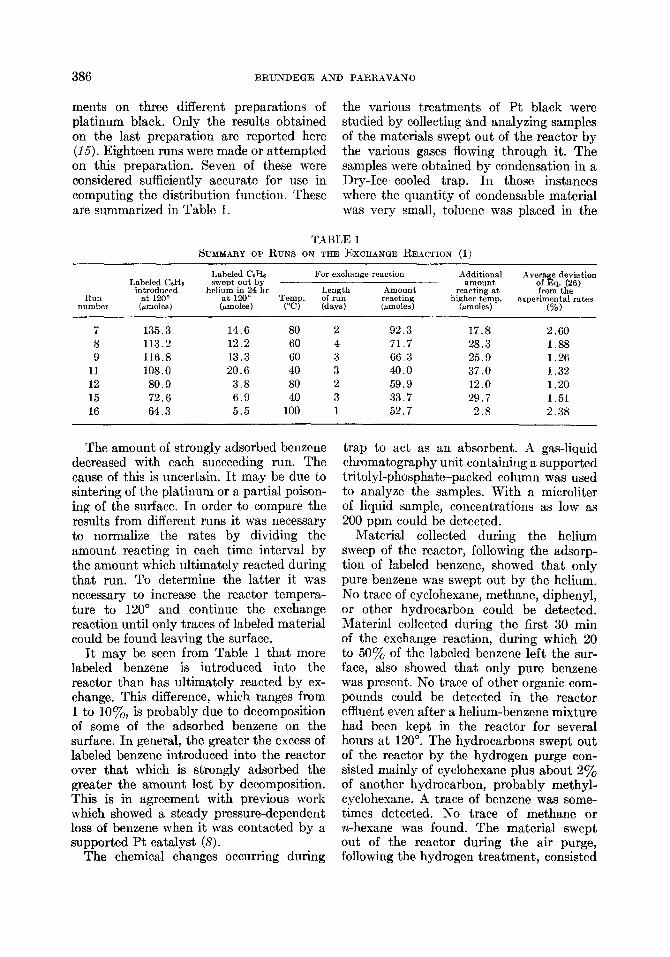
ments on three different preparations of platinum black. Only the results obtained on the last preparation are reported here (15). Eighteen runs were made or attempted on this preparation. Seven of these were considered sufficiently accurate for use in computing the distribution function. These are summarized in Table 1.
the various treatments of Pt black were studied by collecting and analyzing samples of the materials swept out of the reactor by the various gases flowing through it. The samples were obtained by condensation in a Dry-Ice-cooled trap. In those instances where the quantity of condensable material was very small, toluene was placed in the
TABLE 1 SUMMARY OF RUNS ON THE EXCHANGE REACTION (1)
RUIl number
Labeled CsHs introduced
at 120” (pmoles)
Labeled CaHs swept put by
For exchange reaction Additional amount
Average deviation
heli;~lm$4 hr Temp.
T;f”“wx;h Amount ;;,“m”;i$)
reacting reacting at
(/nImles) (“a (days) (jmmles) higher temp.
(rmoles) experimental rates
(%)
7 135.3 14.6 80 2 92.3 17.8 2.60 8 113.2 12.2 60 4 71.7 28.3 1.88 9 116.8 13.3 60 3 66.3 25.9 1.26
11 108.0 20.6 40 3 40.0 37.0 1.32 12 80.9 3.8 80 2 59.9 12.0 1.20 15 72.6 6.9 40 3 33.7 29.7 1.51 16 64.3 5.5 100 1 52.7 2.8 2.38
The amount of strongly adsorbed benzene decreased with each succeeding run. The cause of this is uncertain. It may be due to sintering of the platinum or a partial poison- ing of the surface. In order to compare the results from different runs it was necessary to normalize the rates by dividing the amount reacting in each time interval by the amount which ultimately reacted during that run. To determine the latter it was necessary to increase the reactor tempera- ture to 120’ and continue the exchange reaction until only traces of labeled material could be found leaving the surface.
It may be seen from Table 1 that more labeled benzene is introduced into the reactor than has ultimately reacted by ex- change. This difference, which ranges from 1 to lo%, is probably due to decomposition of some of the adsorbed benzene on the surface. In general, the greater the excess of labeled benzene introduced into the reactor over that which is strongly adsorbed the greater the amount lost by decomposition. This is in agreement with previous work which showed a steady pressure-dependent loss of benzene when it was contacted by a supported Pt catalyst (8).
The chemical changes occurring during
trap to act as an absorbent. A gas-liquid chromatography unit containing a supported tritolyl-phosphate-packed column was used to analyze the samples. With a microliter of liquid sample, concentrations as low as 200 ppm could be detected.
Material collected during the helium sweep of the reactor, following the adsorp- tion of labeled benzene, showed that only pure benzene was swept out by the helium. No trace of cyclohexane, methane, diphenyl, or other hydrocarbon could be detected. Material collected during the first 30 min of the exchange reaction, during which 20 to 50y0 of the labeled benzene left the sur- face, also showed that only pure benzene was present. No trace of other organic com- pounds could be detected in the reactor effluent even after a helium-benzene mixture had been kept in the reactor for several hours at 120’. The hydrocarbons swept out of the reactor by the hydrogen purge con- sisted mainly of cyclohexane plus about 2% of another hydrocarbon, probably methyl- cyclohexane. A trace of benzene was some- times detected. No trace of methane or n-hexane was found. The material swept out of the reactor during the air purge, following the hydrogen treatment, consisted
REACTION RATES AND ACTIVATION ENERGIES ON CATALYTIC SURFACES 387
mostly of water vapor and possibly some carbon dioxide. No hydrocarbons were detected.
There are many conditions which must be specified in order to completely define the system of benzene chemisorbed on Pt. They are not all known. The surface pretreatment used in the runs of Table 1 consisted of exposure to hydrogen, then air, then hydro- gen again, and finally degassing under vacuum for 20 hr at 150’. Variations of this pretreatment gave different results but this effect was not studied quantitatively. Like- wise, the temperature of chemisorption and the time and temperature of aging of the system after adsorption were found to have a large effect on the exchange reaction rate but were not studied quantitatively. One run was made by adsorbing and aging at 150’ instead of the usual 120’. The rate was about one-third as fast as during run 16.
The concentration of ordinary benzene in the gas phase was 1.57% for the runs in Table 1. Benzene concentrations as high as 3.5oj, were used in some of the early runs. The higher benzene concentrations appeared to give a slightly higher reaction rate but the increase was not significantly greater than the reproducibility of these runs.
CORREL.~TION OF THE EXPERIMENTAL RESULTS
In order to calculate the distribution function from the reaction rate measure- ments the rate results must be put into some mathematical form whose inverse Laplace transform can be calculated. In addition, there are certain physical requirements which a rate equation for this type of reac- tion must conform to. These are
r(0) = finite number (15)
I ()- r(t)dt = 1.0 (16)
dr/dt < 0 for 0 6 t < co (17) d2r/dP > 0 for 0 < t < co (18)
r = dr/dt = d2r/dt2 = 0 at t = CQ (19)
Conditions (15), (16), and (19) are obvious. Conditions (17) and (18) arise from the fact that an isotopic exchange of the type
used in this work is kinetically first order. The heterogeneity of the surface does not alter this conclusion, but may be simply thought of as producing a series of a large number of simultaneous first order reactions.
In addition to the above conditions for the rate, p(k), which is calculated from the rate expression, must satisfy the following conditions :
I ow p(k)dk = 1.0 (20)
p(k) > 0 for 0 < k w (21)
PC-J) = 0 (22)
/J(O) = 0 (23)
Condition (20) is similar to condition (15) and both result from the use of normalized rates and distributions. Conditions (21), (22), and (23) are obvious.
A frequently used empirical equation for solid-gas reactions, especially adsorption and desorption, is the Elovich equation
4 = al@ + to) (24)
Quite obviously, this equation fails to satisfy conditions (15) and (20) and must, there- fore, be rejected. In the literature, the following equation is mentioned as a possible correlation function for desorption data (lb) :
q(t) = f 40 + w j=l
where to and ais are constants and q(t) is the fraction desorbed in time t. The corre- sponding rate equation is
r(t) = f jaj/(t + to)j+l (25) j=l
This equation meets every condition except (23), provided to > 0. If the summation were started at j = 2, condition (23) would also be satisfied. However, the aj’s would have to be positive if conditions (16) and (17) are to be satisfied at all values of t. In principle these requirements can be satisfied even with a few negative aj’s provided a sufficiently large number of terms are used. The principal practical difficulty of Eq. (25) is that, at the larger values of j, one
388 BRUNDEGE AND PARRAVANO
would have to dealzwith extremely large numbers.
The equation which was finally used for the correlation of the rate data was the following:
7-(t) = f aj/(t + bj)3 (26) j=l
where the aj’s and hi’s are positive constants. This is very similar to Eq. (25), and satisfies all of the conditions (15) through (23) pro- vided that
N
c ai/2bj2 = 1.0 (27)
j=l
The inverse Laplace transform of (26) is
J.Y{r(t) 1 = kp(k) = (k2/2) ,f ajecblk (28) j=l
A good fit of the experimental data could be obtained with Eq. (26). It was necessary to preselect arbitrarily the values of bj. The aj’s were then fit to the experimental data by least squares. It was found that the values arbitrarily chosen for the bj’s had
very little effect on either the goodness of fit or the resulting distribution function, provided the chosen values covered a wide range. All of the data processing and calcula- tions were made on an IBM 709 computer (15). The results of the data correlation were immediately used by the computer to cal- culate p(k), k, -In k, and -T In k for a wide range of values of S(E). In addition, the reaction rate and amount reacted were calculated for 23 values to time. Thus, Eq. (26) was used entirely as an internal computation device by the computer to facilitate the calculation of the inverse Laplace transform of the rate, other func- tions derivable from the inverse Laplace transform, and smoothed values of the reaction rate.
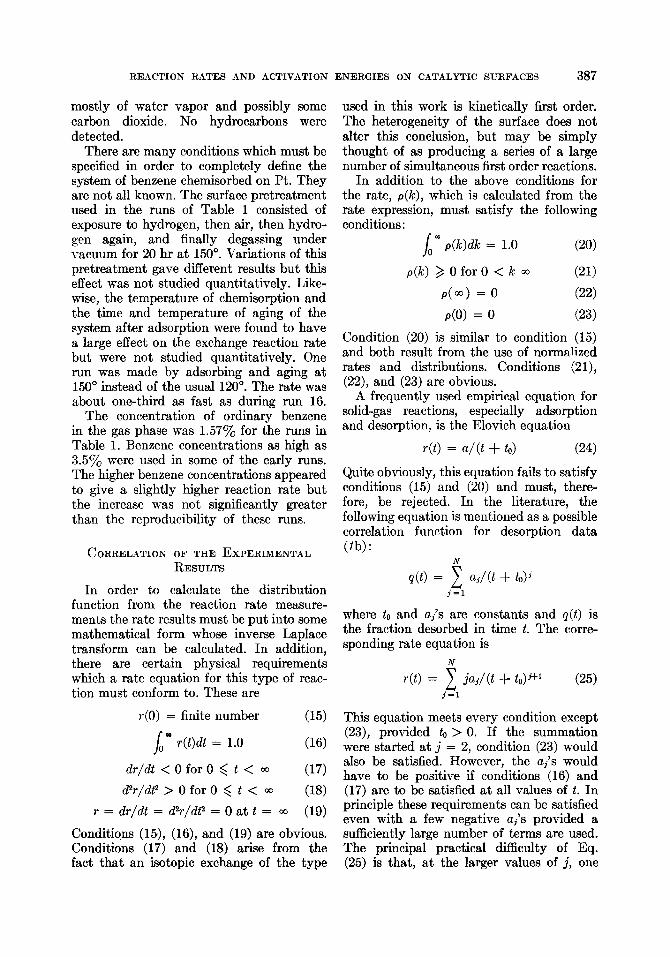
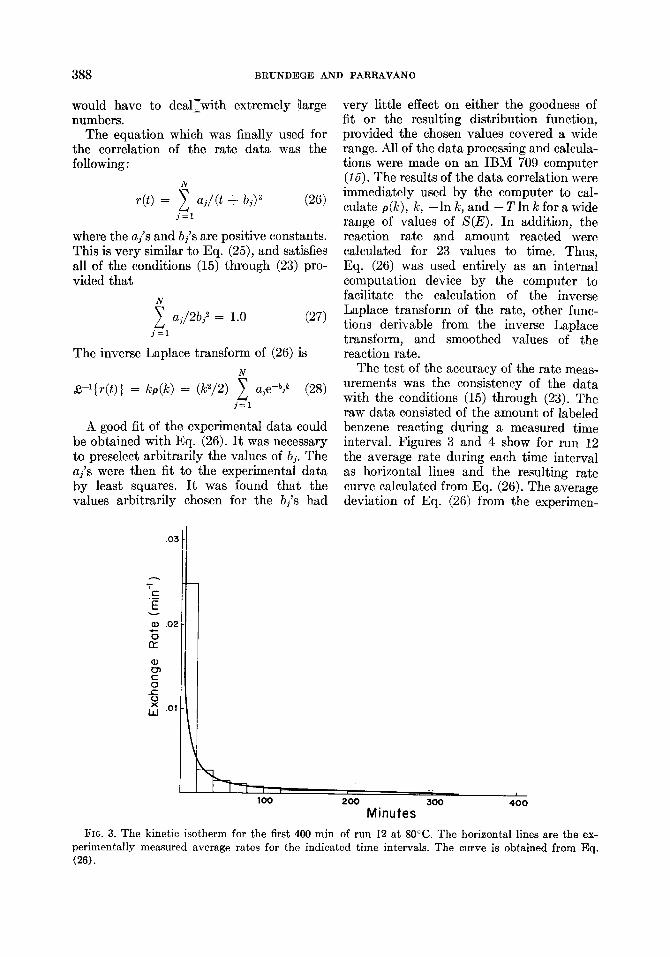
The test of the accuracy of the rate meas- urements was the consistency of the data with the conditions (15) through (23). The raw data consisted of the amount of labeled benzene reacting during a measured time interval. Figures 3 and 4 show for run 12 the average rate during each time interval as horizontal lines and the resulting rate curve calculated from Eq. (26). The average deviation of Eq. (26) from the experimen-
I I
100 200 300 400
Minutes
FIG. 3. The kinetic isotherm for the first 400 min of run 12 at 80°C. The horizontal lines are the ex- perimentally measured average rates for the indicated time intervals. The curve is obtained from Eq. Cm).
REACTION RATES AND ACTIVATION ENERGIES ON CATALYTIC SURFACES 389
tally measured rates varied from 1.2 to steps, making a comparison at various tem- 2.6%. If the deviations were reported in peratures difficult unless the preselected terms of the integrated rate, these figures values for the ki’s are identical with the true would be < 1% for all runs. rate constants. However, a smoothed curve
1000 2000 3000 4000
Minutes
FIG. 4. The kinetic isotherm after 250 min for run 12 at SO”.
Another equation for the correlation of the rate data deserves mention. If one assumes that the surface is composed of a small num- ber of homogeneous regions, then the rate could be expressed by:
r(L) = 2 c&e-ki~ (29) i=l
where ai is the fraction of adsorption sites having rate constant ki. Such an equation can be a satisfactory expression of the rate provided a sufficiently large number of terms is used since each adsorption site may be thought of as a homogeneous region. It is quite possible that Eq. (29) could correlate the rate data with about the same accuracy as Eq. (26). The ki’s should be preselected since it is very difficult to make a least squares fit of an exponential function. The resulting distribution function is very simple :
p(k) = ai p(k) = 0 for lC # ki >
i = 1, 2, . . . N (30)
The corresponding integral distribution function, S(E), will appear as a series of
of S(E) could be used in order to obtain an approximation of the activation energy distribution.
CALCULATION OF THE ACTIVATION ENERGY DISTRIBUTION FOR REACTION (1)
Equation (28) was used to calculate p(k) and S(E) as a function of k for each of the seven runs shown in Table 1. The coefficients aj and bj for each run were determined by a least squares fit of the rate data of each run to Eq. (26). Under the assumptions made in the derivation of Eq. (12), each value of S(E) corresponds to certain adsorption sites and this correspondence holds at all tem- peratures. The activation energy corre- sponding to each value of S(E) is found from a plot of -In k versus l/T at constant S. Such a plot for the seven runs is shown in Fig. 5. The slopes of the lines are the values of E/R corresponding to the respective values of S. Figure 6 shows a plot of - T In k versus T for the same runs and the same S values. The slopes of these lines are -In ko. The values of k. and E computed from these
390 BRUNDEGE AND PARRAVANO
0 RUN 16, 100’. D RUN 12. 80’. . RUN 7. 60.. L RUN 9. 60’. . RUN 6. 60’. 0 RUN IS. 40’.
10 RUN II, 40’.
-1n.k
5
FIG. 5. A plot of slope of each line
--In k VS. l/T at various values of the integral distribution function. The average is equal to the corresponding value of E/R.
3poo-
Y c
- eooo- l-
I
1000-
+ RUN 16, 100’. 0 RUN 12, do=. m RUN 7, 80.. b RUN 9, 60..
. RUN 6, 60’. 0 RUN 16, 40’. 9
\ RUN I1 , 40’.
I I 326 358 375
Temperature, “K
FIG. 6. A plot of -T ln k vs. T at various values of the integral distribution function. The average slope of each line is equal to the corresponding value of ---In k,.
REACTION RATES AND ACTIVATION ENERGIES ON CATALYTIC SURFACES 391
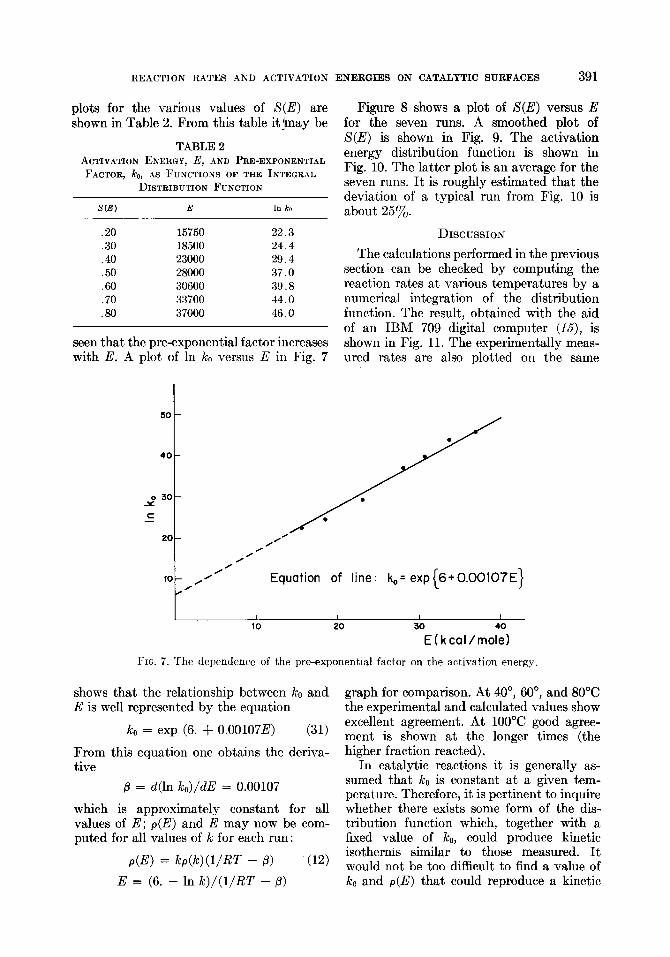
plots for the various values of S(E) are shown in Table 2. From this table it jmay be
TABLE 2 ACTIVATION ENERGY, E, AND PRE-EXPONENTIAL
FACTOR, PC,,, AS FUNCTIONS OF THE INTEGRAL DISTRIBUTION FUNCTION
S(E) E In ko
.20 15750 22.3
.30 18500 24.4
.40 23000 29.4
.50 28000 37.0
.60 30600 39.8
.70 33700 44.0
.80 37000 46.0
seen that the pre-exponential factor increases with E. A plot of In ko versus E in Fig. 7
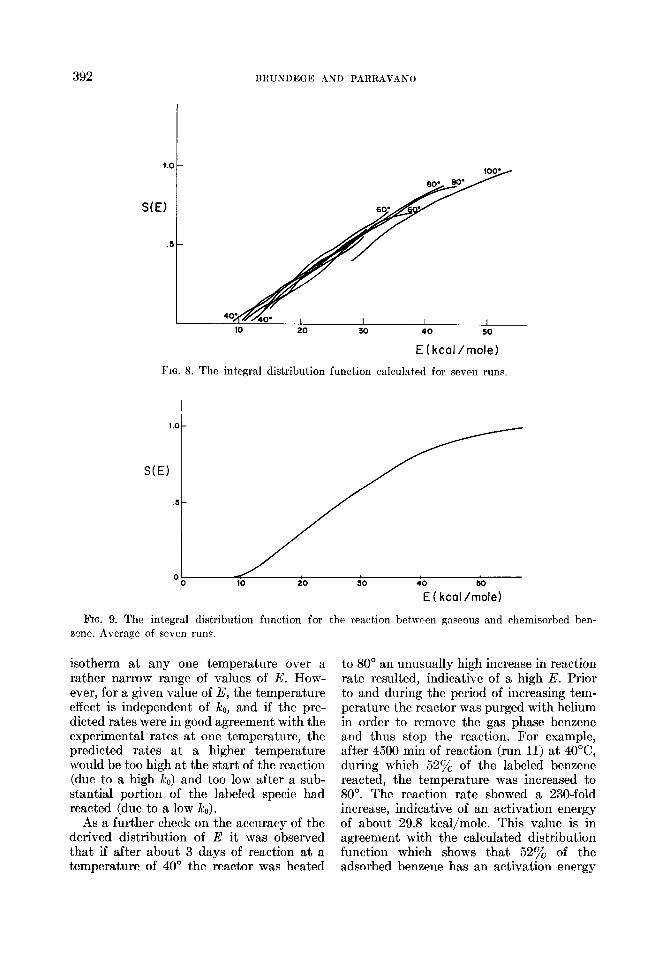
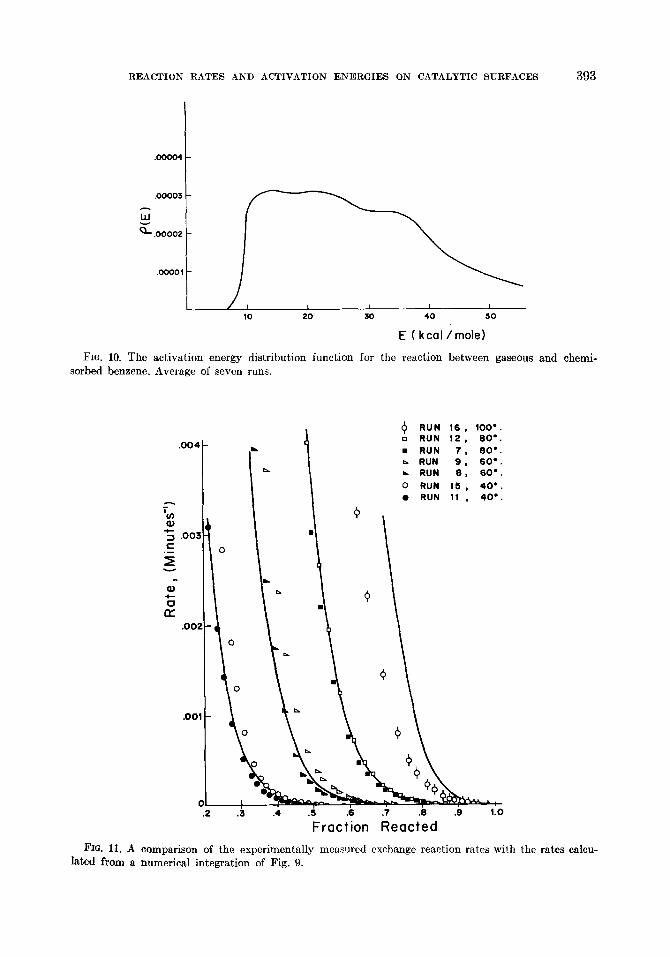
Figure 8 shows a plot of S(E) versus E for the seven runs. A smoothed plot of S(E) is shown in Fig. 9. The activation energy distribution function is shown in Fig. 10. The latter plot is an average for the seven runs. It is roughly estimated that the deviation of a typical run from Fig. 10 is about 25y0.
DISCUSSION
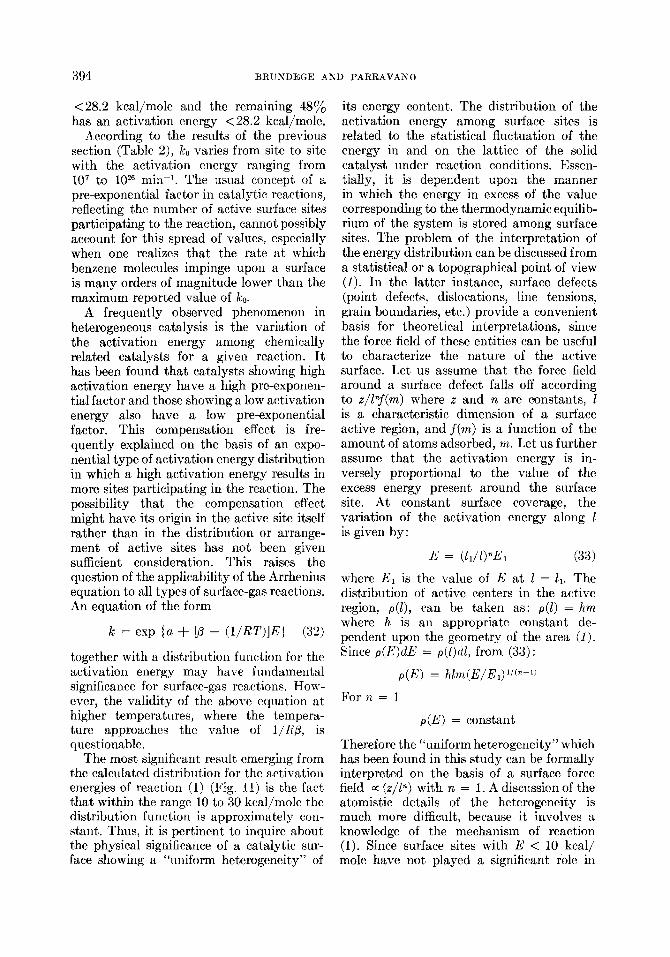
The calculations performed in the previous section can be checked by computing the reaction rates at various temperatures by a numerical integration of the distribution function. The result, obtained with the aid of an IBM 709 digital computer (15), is shown in Fig. 11. The experimentally meas- ured rates are also plotted on the same
10 20 30
E~kcal/rno:~~
FIG. 7. The dependence of the pre-exponential factor on the activation energ)
shows that the relationship between Ice and graph for comparison. At 40”, 60”, and 80°C E is well represented by the equation the experimental and calculated values show
k. = exp (6. + 0.00107E) (31) excellent agreement. At 100°C good agree- ment is shown at the longer times (the higher fraction reacted). From this equation one obtains the deriva-
tive
fi = d(ln ko)/dE = 0.00107
which is approximately constant for all values of E; p(E) and E may now be com- puted for all values of k for each run:
P(E) = h-G)UIRT - 0) (12)
E = (6. - In Ic)/(l/RT - ,L?)
In catalytic reactions it is generally as- sumed that ko is constant at a given tem- perature. Therefore, it is pertinent to inquire whether there exists some form of the dis- tribution function which, together with a fixed value of ko, could produce kinetic isotherms similar to those measured. It would not be too difficult to find a value of ko and p(E) that could reproduce a kinetic
392 BRUILIDEGE AND PARRAVANO
E (kcal /mole)
FIG. 8. The integral distribution function calculated for seven runs.
l.O-
S(E)
.5-
E ( kcal /mole)
FIG. 9. The integral distribution function for the reaction between gaseous and chemisorbed brn- znne. Average of seven runs.
isotherm at any one temperature over a rather narrow range of values of E. How- ever, for a given value of E, the temperature effect is independent of k,,, and if the pre- dicted rates were in good agreement with the experimental rates at one temperature, the predicted rates at a higher temperature would be too high at the start of the reaction (due to a high k,) and too low after a sub- stantial portion of the labeled specie had reacted (due to a low i&J.
As a further check on the accuracy of the derived distribution of E it was observed that if after about 3 days of reaction at a temperature of 40” the reactor was heated
to 80” an unusually high increase in reaction rate resulted, indicative of a high E. Prior to and during the period of increasing tem- perature the reactor was purged with helium in order to remove the gas phase benzene and thus stop the reaction. For example, after 4500 min of reaction (run 11) at 4O”C, during which 52y0 of the labeled benzene reacted, the temperature was increased to 80”. The reaction rate showed a 230-fold increase, indicative of an activation energy of about 29.8 kcal/mole. This value is in agreement with the calculated distribution function which shows that 52% of the adsorbed benzene has an activation energy
REACTION RATES AND ACTIVATION ENERGIES ON CATALYTIC SURFACES 393
30 40 50
E (kcal /mole)
FIG. 10. The activation energy distribution function for the reaction between gaseous and chemi- sorbed benzene. Average of seven runs.
FIG. 11. A comparison of the experimentally measured exchange reaction rates with lated from a numerical integration of Fig. 9.
i
z ‘; .oa
.- ;
. Q)
+
z .oc
+ RUN 16, 100’. o RUN 12, 80’. . RUN 7. 60’. L RUN 9, 60’. . RUN 6. 60’.
0 RUN 15, 40.. l RUN 11 , 40’.
0
0
Fraction Reacted the rates calcu-
394 BRUNDEGE ARD PARRAVANO
<28.2 kcal/mole and the remaining 48a/n has an activation energy <28.2 kcal/mole.
A.ccording to the results of the previous section (Table 2), IcO varies from site to site with the activation energy ranging from 10’ to 102’j mini. The usual concept of a pre-exponential factor in catalytic reactions, reflecting the number of active surface sites participating to the reaction, cannot possibly account for this spread of values, especially when one realizes that the rate at which benzene molecules impinge upon a surface is many orders of magnitude lower than the maximum reported value of ko.
A frequently observed phenomenon in heterogeneous catalysis is the variation of the activation energy among chemically related catalysts for a given reaction. It has been found that catalysts showing high activation energy have a high pre-exponen- tialfactor and those showing a low activation energy also have a low pre-exponential factor. This compensation effect is fre- quently explained on the basis of an expo- nential type of activation energy distribution in which a high activation energy results in more sites participating in the reaction. The possibility that the compensation effect might have its origin in the active site itself rather than in the distribution or arrange- ment of active sites has not been given sufficient consideration. This raises the question of the applicability of the Arrhenius equation to all types of surface-gas reactions. An equation of the form
k = exp {a + [p - (l/RT)]E] (32)
together with a distribution function for the activation energy may have fundamental significance for surface-gas reactions. How- ever, the validity of the above equation at higher temperatures, where the tempera- ture approaches the value of l/X/3, is questionable.
The most significant result emerging from the calculated distribution for the activation energies of reaction (1) (Fig. 11) is the fact that within the range 10 to 30 kcal/mole the distribution function is approximately con-
stant. Thus, it is pertinent to inquire about the physical significance of a catalytic sur- face showing a “uniform heterogeneity” of
its energy content. The distribution of the activation energy among surface sites is related to the statistical fluctuation of the energy in and on the lattice of the solid catalyst under reaction conditions. Essen- tially, it is dependent upon the manner in which the energy in excess of the value corresponding to the thermodynamic equilib- rium of the system is stored among surface sites. The problem of the interpretation of the energy distribution can be discussed from a statistical or a topographical point of view (1). In the latter instance, surface defects (point defects, dislocations, line tensions, grain boundaries, etc.) provide a convenient basis for theoretical interpretations, since the force field of these entities can be useful to characterize the nature of the active surface. Let us assume that the force field around a surface defect falls off according to x/Znf(m) where x and n are constants, 1 is a characteristic dimension of a surface active region, and f(m) is a function of the amount of atoms adsorbed, m. Let us further assume that the activation energy is in- versely proportional to the value of the excess energy present around the surface site. At constant surface coverage, the variation of the activation energy along 1 is given by:
Ii = (11/Z)“E’1 (33)
where &I is the value of E’ at 1 = ll. The distribution of active centers in the active region, p(Z), can be taken as: p(Z) = hm where h is an appropriate constant de- pendent upon the geometry of the area (1). Since p(E)d& = p(l)dl, from (33):
p(E) = hZm(E/EI) lib-‘)
For 1~ = 1
p(E) = constant
Therefore the “uniform heterogeneity” which has been found in this study can be formally interpreted on the basis of a surface force fieId Q (x/P) with n = 1. A discussion of the atomistic details of the heterogeneity is much more difficult, because it involves a knowledge of the mechanism of reaction (1). Since surface sites with h’ < 10 kcal/ mole have not played a significant role in
REACTION RATES AND ACTIVATION ENERGIES ON CSTALYTIC SURFhCE3 395
the exchange reaction studied, adsorption processes could not possibly have had a significant role as kinetically controlling steps. Probably the surface interaction be- tween benzene and Pt was a more important contributing factor. There is evidence that metals with vacant inner cl shell orbitals can interact with the * electrons of a double bond to form r-bonded complexes (1B), which have been used to explain the mecha- nism of several hydrocarbon reactions (17’).
Electrons in ?r bonds in benzene exist initially in the field of 6 carbon atoms but the system can achieve greater stabilization if the number of atoms involved is increased as a result of chemisorption. Thus, assuming that each surface atom contributes one electron to the chemisorption bond, there will be initially 12 pairs of neighboring atoms and 24 electrons to be considered. The bond- ing will extend over 24/12 = 2 atom cores, and it will be exactly localized. If, however, each adsorption site contributes more than one electron, the bond will extend over >2 atom cores and delocalization will set in. In this view, surface heterogeneity will be the result of different electronic states within the same surface site. The process of delocalization requires an activation energy, since electrons must be supplied from the Brillouin zone of the metal. Thus, a slow activated change of the electronic state of some adsorption sites could be invoked for the interpretation of the reported laging effects of the benzene.
CONCLUSIONS
1. It has been demonstrated that the rates of isotopic exchange between gaseous and chemisorbed molecules can provide a means of determining the distribution of activation energies with respect to this reaction. The mathematical procedure was discussed and a technique was developed for calculating the activation energy dis- tribution from the kinetic isotherms.
2. For the reaction between gaseous benzene and benzene chemisorbed on plati- num black the reaction rates were measured at 40”, 60”, 80”, and 100°C and from these measurements the activation energy dis- tribution was calculated. The range of acti-
vation energies for this reaction was found to be from below 10,000 to beyond 50,000 Cal/mole.
3. It has been shown that for this reaction the pre-exponential factor in the Arrhenius equation is not a constant, as is usually assumed, but varies with the activation energy according to the relation
k. = exp (6. + 0.00107E)
The range of pre-exponential factors was found to be from about 10’ to 1O26 min-I. Because of this the applicability of the Arrhenius equation to surface-gas reactions is questioned.
4. As a check on the activation energy distribution and the above relationship for the pre-exponential factor, the kinetic isotherms at several different temperatures were calculated by a numerical integration of the activation energy distribution. These calculated rates showed good agreement with the experimentally measured rates.
ACKNOWLEDGMENT
This research was supported in part by a grant from the Esso Research and Engineering Company. We wish to express our gratitude for this support.
R,EFEREKCES
la. ROGIXSKY, S. Z., “Adsorption und Katalyse an Inhomogenen Oberflachen. Akademie-Verlag, Berlin, 1958. (First published in USSR in 1948.)
lb. LEVIN, V. I., Problemy Kinetiki i Kataliza Akad Nauk S.S.S.R. 7, 297-335 (1949).
2. EISCHENS, R. P., J. Am. Chem. Sot. 74, 6167- 6171 (1952).
S. ROGINSKY, S. Z., Problemy Kinetiki i Kataliza Akad Nauk S.S.S.R. 9, 5-30 (1957); Zhur. Piz. Khim. 32, 737-745 (1958).
4. SCHUIT, G. C. A., DEBOER, N. H., DORGELO, G. J. H., AND VAN REIJN, L. L., in “Chemi- sorption” (W. E. Garner, ed.), p. 39. Aca- demic Press, New York, 1957.
5. SUHRMANN, R., HEYNE, H. J., WEDLER, G., J.
Catalysis 1, 208 (1962). 6. BORESKOV, G. K., VASSILEVITCH, A. A., in
“Actes du Deuxieme Congress International de Catalyse, p. 1095. Editions Technip, Paris, 1961.
Y. SELWOOD, P. W., J. Am. Chem. Sot. 79, 4637 (1957); and in “Actes du Deuxieme Con- gress International de Catalyse,” pp. MO- 1811. Editions Technip, Paris, 1961.
396 URUNDEGE AND PARRAVAK0
S. PITKETHLY, R. C., AND GOBLE, A. G., i?z “A&es du Deuxieme Congress International de Catalyse,” pp. 1851-1859. Editions Technip, Paris, 1961.
9. For a review see “Catalysis” by G. C. Bond. Academic Press, New York, 1962.
10. BRENNER, J. G. M., Disc. Faraday Sot., p. 79 (1950).
11. SUHRMANN, R., Adv. in Catalysis 7, 303-352 (1955).
22. GRYAZNOV, V. M., SHEEMOLIS, V. I., AND YAGODOVSKY, V. D., Doklady Akad. Nauk SSSR 132, 1132-1135 (1960).
13. CHURCHILL, R. V., “Operational Mathematics,” p. 183, 2nd ed. McGraw-Hill, New York, 1958.
l/,a. ROGINSKY, S. Z., Acta Phys. Chim. 20, 227 (1945).
l/,b. LEVIN, V. I., Ploblemy Kinctiki i Katalian Akad Nauk S.S.S.R. 7, 279-335 (1949).
15. For further details see: BRUNDEGE, J. A., Ph.D. Thesis, University of Michigan, 1962.
16. FISCHER, E. O., Intern. Conf. Coordination Chemistry, Chemical Society (London) p. 73 (1959).
17. ROONEY, J. J., J. Catalysis 2, 53 (1963).


![UNIMOLECULAR REACTION DYNAMICS IN HELIUM … · the unimolecular reaction rate 18 ... 2.9 Surface excitations energies for the droplets of different sizes. [8]. The ... not undergo](https://img.pdfslide.us/doc/110x75/5eaec9ae3b35ab541a3802f4/unimolecular-reaction-dynamics-in-helium-the-unimolecular-reaction-rate-18-29.jpg)