Embed Size (px)
Citation preview
60
70
30
50
20
10
40
0
Shares of Before-Tax Income and Federal Taxes, by Income Group, 2010
Before-Tax Income
Federal Taxes
LowestQuintile
MiddleQuintile
SecondQuintile
FourthQuintile
Highest Quintile
Top 1 Percent
81st to 99thPercentiles
Percent
CONGRESS OF THE UNITED STATESCONGRESSIONAL BUDGET OFFICE
CBOThe Distribution of
Household Income and Federal Taxes, 2010
DECEMBER 2013
CBO
Notes and Definitions
Numbers in the text, tables, and figures may not add up to totals because of rounding.
Unless otherwise indicated, all years referred to in this study are calendar years. Federal fiscal years run from October 1 to September 30.
Some of the figures have white vertical bars that indicate the duration of recessions. (A recession extends from the peak of a business cycle to its trough.)
Market income consists of labor income, business income, capital gains (profits realized from the sale of assets), capital income (excluding capital gains), income received in retirement for past services, and other sources of income.
Before-tax income is the sum of market income and government transfers.
After-tax income is the sum of market income and government transfers, minus federal tax liabilities.
Government transfers include cash payments and in-kind benefits from social insurance and other government assistance programs.
Federal tax liabilities are the amount a household owes on the basis of income received in a year, regardless of when taxes are paid. Individual income taxes are allocated directly to the households that pay those taxes. Social insurance, or payroll, taxes are allocated to the households that pay those taxes either directly or indirectly through employers. Excise taxes are allocated to households according to their consumption of the taxed goods or services. Corporate income taxes are allocated to households according to their shares of capital and labor income. Specifically, 75 percent of corporate income taxes is allocated to owners of capital in proportion to their income from interest, dividends, adjusted capital gains, and rents. (Capital gains are scaled to a long-term historical amount, given the size of the economy and the applicable tax rate, so as to smooth out large year-to-year variations in the total amount of gains realized.) The remaining 25 percent of corporate income taxes is allocated to workers in proportion to their labor income.
Average federal tax rates are calculated by dividing federal tax liabilities by before-tax income. When refundable tax credits, such as the earned income tax credit and the child tax credit, exceed the other federal tax liabilities of the households in an income group, those households are said to have a negative average tax rate. (Refundable tax credits are not limited to the amount of income tax owed before the credits are applied.)
Income groups are defined by ranking all people by income, adjusted for household size—that is, divided by the square root of the number of people in a household, which consists of the people who share a housing unit, regardless of relationship. Quintiles, or fifths, contain equal numbers of people, as do percentiles, or hundredths. If a household has negative income (that is, if its business or investment losses are larger than its other income), it is excluded from the lowest income category but included in totals.
Income is adjusted for inflation using the personal consumption expenditure price index, which is calculated by the Bureau of Economic Analysis.
Pub. No. 4613
Contents
Summary 1
How Were Federal Taxes Distributed in 2010? 1
How Did Federal Taxes Affect the Distribution of Income in 2010? 1
How Did the Distribution of Income and Federal Taxes Change From 2009 to 2010? 1
What Are the Longer-Term Trends in the Distribution of Federal Taxes? 2
How Will Changes in Tax Rules Between 2010 and 2013 Affect Average Federal Tax Rates? 2
Data and Methods 3
Estimates for 2010 4
Households’ Before-Tax Income 5
Average Federal Tax Rates 5
BOX: THE DISTRIBUTION OF MARKET INCOME, TRANSFERS, AND FEDERAL TAXES 6
Distribution of Federal Taxes Across the Income Scale 10
Households’ After-Tax Income 14
Trends Since 1979 15
Average Federal Tax Rates by Source 16
Average Federal Tax Rates by Income Group 17
After-Tax Income 18
Developments Since 2010 18
Overall Income Growth 19
Changes in the Distribution of Income 19
Average Federal Tax Rates for 2011 and 2012 19
Changes in Tax Rules for 2013 19
Average Federal Tax Rates Under 2013 Tax Rules 20
Appendix A: Methodology 23
Appendix B: Variation Within Income Groups 27
List of Tables and Figures 31
About This Document 32
CBO

The Distribution of Household Income andFederal Taxes, 2010
SummaryThe increase in the nation’s economic activity in 2010 affected households’ income, federal tax liabilities, and federal tax rates. In this report, the Congressional Budget Office (CBO) presents its estimates of the distribution of household income and federal taxes in 2010, and it com-pares those estimates with estimates for the preceding three decades. The report also discusses the effects of changes in tax rules on the distribution of federal taxes in 2013.
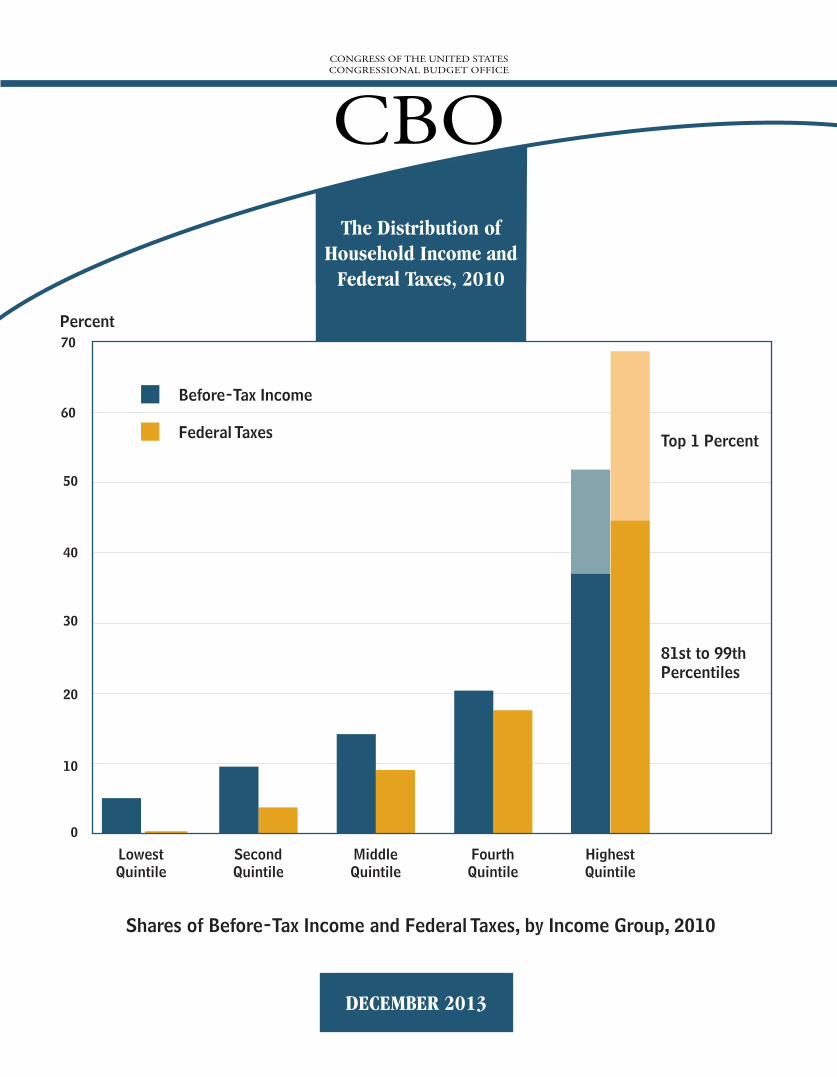
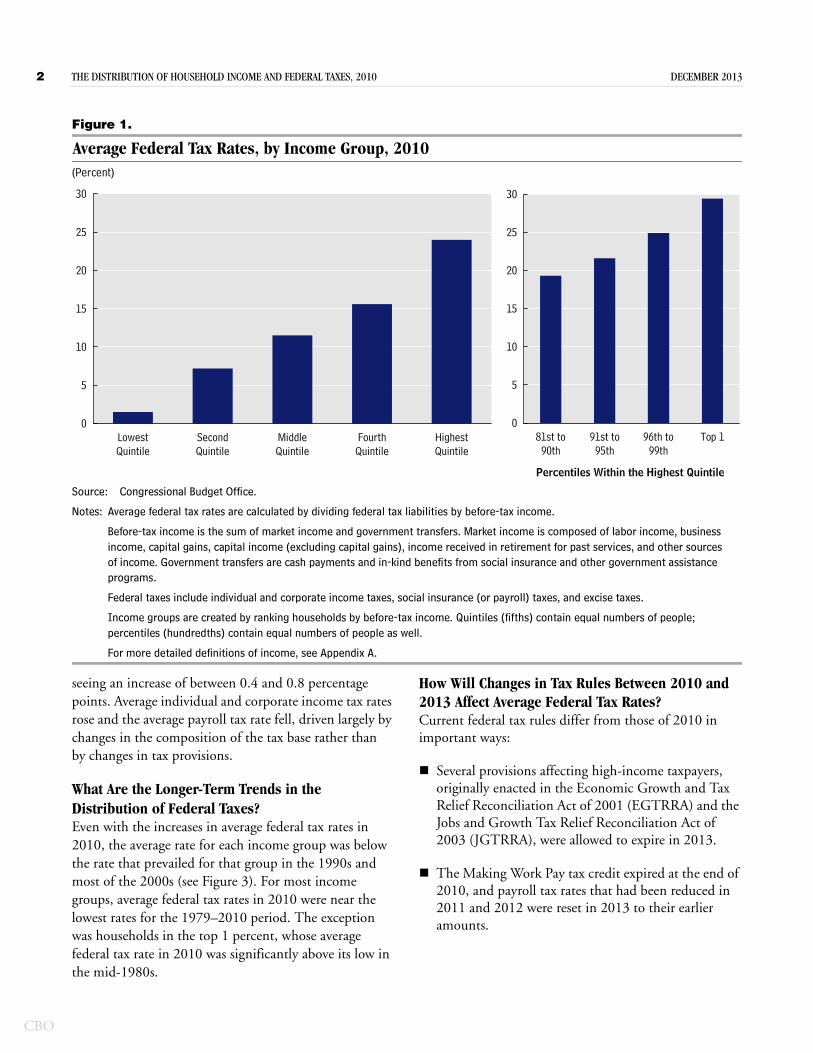
How Were Federal Taxes Distributed in 2010?The average federal tax rate for all households in 2010—that is, tax liabilities divided by income (including gov-ernment transfer payments) before taxes—was 18.1 per-cent. To examine the effect of taxes on households with different amounts of income, CBO divided the nation’s households into five groups of equal size, arrayed by before-tax income. In 2010, the federal tax rate for the bottom quintile of the income distribution was 1.5 per-cent and that for the top quintile was 24.0 percent (see Figure 1). The top 1 percent of all households in the United States had an average federal tax rate of 29.4 percent in 2010.1
Higher-income households pay much more in federal taxes than do their lower-income counterparts: They have a much greater share of the nation’s before-tax income, and they pay a much larger proportion of that income in taxes. Households in the top quintile (including the top percentile) paid 68.8 percent of all federal taxes, households in the middle quintile paid 9.1 percent, and those in the bottom quintile paid 0.4 percent of federal taxes.
1. Information on definitions of income, the allocation of taxes, and the ranking of households is in “Notes and Definitions” at the front of this report.
How Did Federal Taxes Affect the Distribution of Income in 2010? Federal taxes caused the distribution of after-tax income in 2010 to be slightly more even among quintiles than was the distribution of before-tax income. Households in the bottom four quintiles received shares of after-tax income that were about 1 percentage point greater than their shares of before-tax income. For example, house-holds in the bottom quintile received 5.1 percent of before-tax income and 6.2 percent of after-tax income, and those in the middle quintile received 14.2 percent of before-tax income and 15.4 percent of after-tax income. In contrast, households in the highest quintile received 51.9 percent of before-tax income and 48.1 percent of after-tax income.
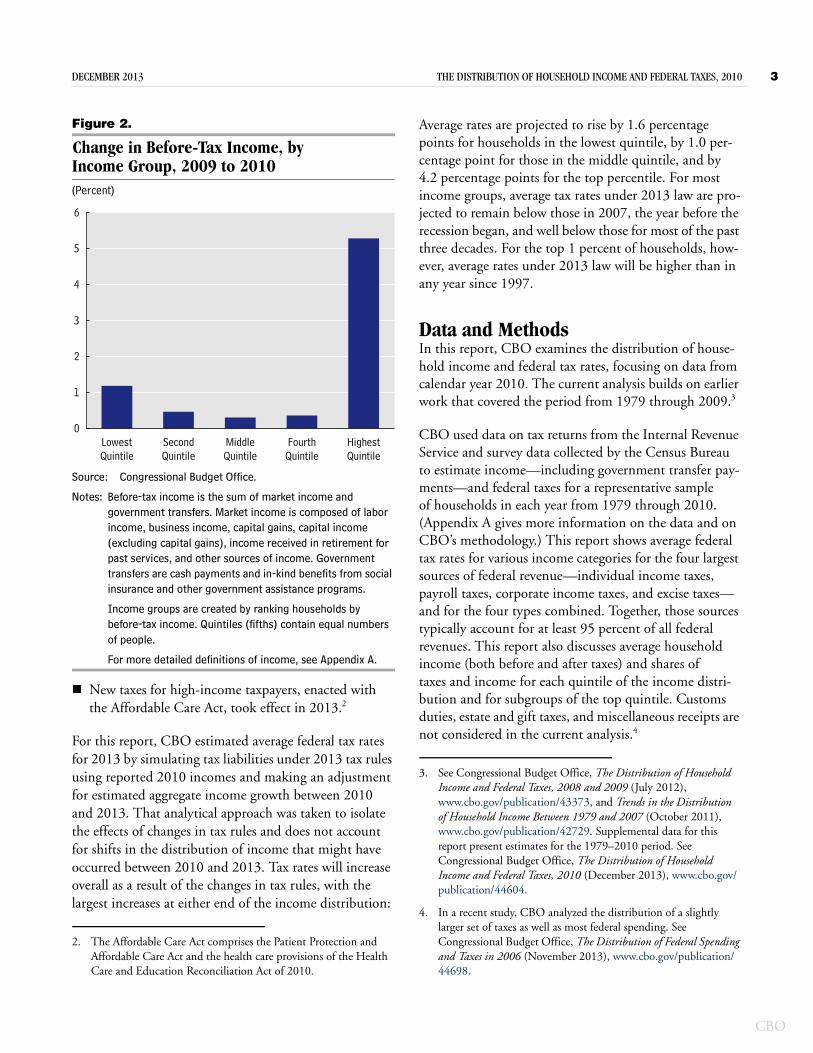
How Did the Distribution of Income and Federal Taxes Change From 2009 to 2010?Average before-tax income rose by 2.7 percent from 2009 to 2010 in real (inflation-adjusted) terms, but the increase was uneven. Income rose by about 1 percent for households in the lowest quintile and by less than 1 percent for households in each of the three middle quintiles (see Figure 2). In contrast, income grew by about 5 percent for households in the top quintile and by about 16 percent for households in the top percentile. Those increases recouped some of the steep declines that occurred from 2007 to 2009 for the highest-income taxpayers, although it left their incomes well below the prerecession peaks. As a result of the uneven growth from 2009 to 2010, the share of income for the top 1 percent increased by 1.6 percentage points, and the share for the middle three quintiles taken together fell by 1.3 percentage points.
The average federal tax rate for all households rose by 0.8 percentage points from 2009 to 2010. The increases were fairly even across income groups, with each quintile
CBO
2 THE DISTRIBUTION OF HOUSEHOLD INCOME AND FEDERAL TAXES, 2010 DECEMBER 2013
CBO
Figure 1.
Average Federal Tax Rates, by Income Group, 2010(Percent)
Source: Congressional Budget Office.
Notes: Average federal tax rates are calculated by dividing federal tax liabilities by before-tax income.
Before-tax income is the sum of market income and government transfers. Market income is composed of labor income, business income, capital gains, capital income (excluding capital gains), income received in retirement for past services, and other sources of income. Government transfers are cash payments and in-kind benefits from social insurance and other government assistance programs.
Federal taxes include individual and corporate income taxes, social insurance (or payroll) taxes, and excise taxes.
Income groups are created by ranking households by before-tax income. Quintiles (fifths) contain equal numbers of people; percentiles (hundredths) contain equal numbers of people as well.
For more detailed definitions of income, see Appendix A.
81st to90th
91st to95th
96th to99th
Top 10
5
10
15
20
25
30
LowestQuintile
SecondQuintile
MiddleQuintile
FourthQuintile
HighestQuintile
0
5
10
15
20
25
30
Percentiles Within the Highest Quintile
seeing an increase of between 0.4 and 0.8 percentage points. Average individual and corporate income tax rates rose and the average payroll tax rate fell, driven largely by changes in the composition of the tax base rather than by changes in tax provisions.
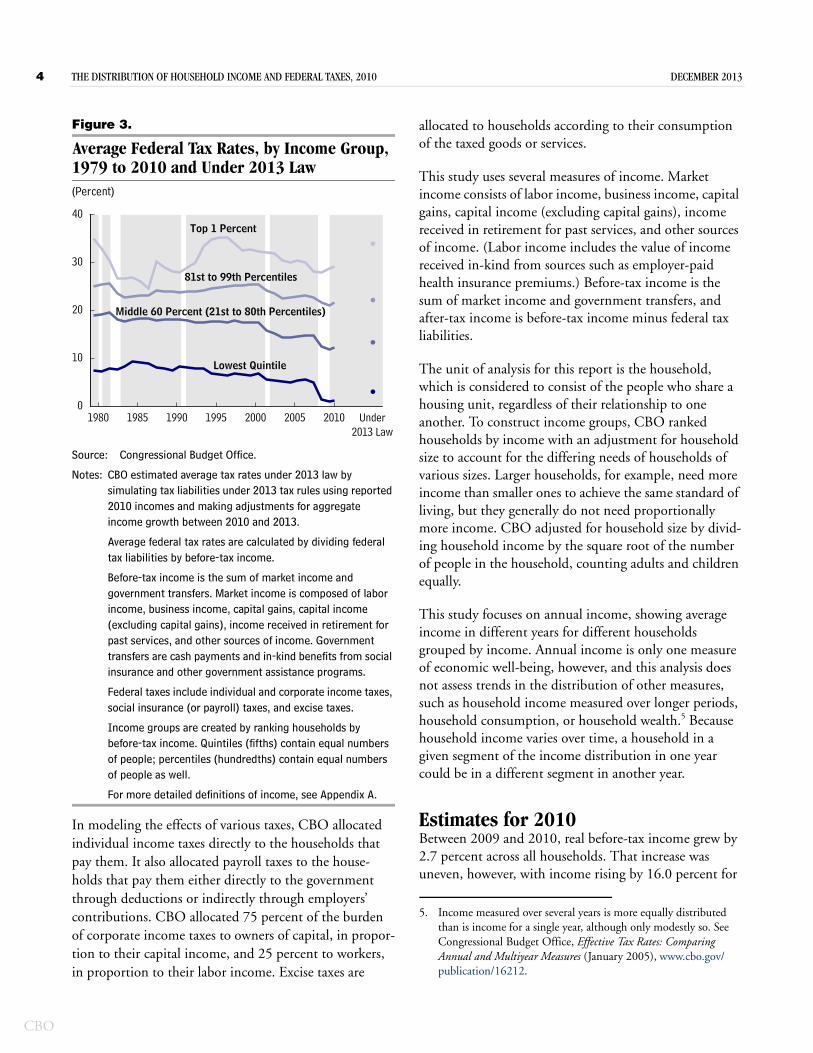
What Are the Longer-Term Trends in the Distribution of Federal Taxes?Even with the increases in average federal tax rates in 2010, the average rate for each income group was below the rate that prevailed for that group in the 1990s and most of the 2000s (see Figure 3). For most income groups, average federal tax rates in 2010 were near the lowest rates for the 1979–2010 period. The exception was households in the top 1 percent, whose average federal tax rate in 2010 was significantly above its low in the mid-1980s.
How Will Changes in Tax Rules Between 2010 and 2013 Affect Average Federal Tax Rates?Current federal tax rules differ from those of 2010 in important ways:
Several provisions affecting high-income taxpayers, originally enacted in the Economic Growth and Tax Relief Reconciliation Act of 2001 (EGTRRA) and the Jobs and Growth Tax Relief Reconciliation Act of 2003 (JGTRRA), were allowed to expire in 2013.
The Making Work Pay tax credit expired at the end of 2010, and payroll tax rates that had been reduced in 2011 and 2012 were reset in 2013 to their earlier amounts.
DECEMBER 2013 THE DISTRIBUTION OF HOUSEHOLD INCOME AND FEDERAL TAXES, 2010 3
Figure 2.
Change in Before-Tax Income, by Income Group, 2009 to 2010(Percent)
Source: Congressional Budget Office.
Notes: Before-tax income is the sum of market income and government transfers. Market income is composed of labor income, business income, capital gains, capital income (excluding capital gains), income received in retirement for past services, and other sources of income. Government transfers are cash payments and in-kind benefits from social insurance and other government assistance programs.
Income groups are created by ranking households by before-tax income. Quintiles (fifths) contain equal numbers of people.
For more detailed definitions of income, see Appendix A.
New taxes for high-income taxpayers, enacted with the Affordable Care Act, took effect in 2013.2
For this report, CBO estimated average federal tax rates for 2013 by simulating tax liabilities under 2013 tax rules using reported 2010 incomes and making an adjustment for estimated aggregate income growth between 2010 and 2013. That analytical approach was taken to isolate the effects of changes in tax rules and does not account for shifts in the distribution of income that might have occurred between 2010 and 2013. Tax rates will increase overall as a result of the changes in tax rules, with the largest increases at either end of the income distribution:
2. The Affordable Care Act comprises the Patient Protection and Affordable Care Act and the health care provisions of the Health Care and Education Reconciliation Act of 2010.
LowestQuintile
SecondQuintile
MiddleQuintile
FourthQuintile
HighestQuintile
0
1
2
3
4
5
6
Average rates are projected to rise by 1.6 percentage points for households in the lowest quintile, by 1.0 per-centage point for those in the middle quintile, and by 4.2 percentage points for the top percentile. For most income groups, average tax rates under 2013 law are pro-jected to remain below those in 2007, the year before the recession began, and well below those for most of the past three decades. For the top 1 percent of households, how-ever, average rates under 2013 law will be higher than in any year since 1997.
Data and MethodsIn this report, CBO examines the distribution of house-hold income and federal tax rates, focusing on data from calendar year 2010. The current analysis builds on earlier work that covered the period from 1979 through 2009.3
CBO used data on tax returns from the Internal Revenue Service and survey data collected by the Census Bureau to estimate income—including government transfer pay-ments—and federal taxes for a representative sample of households in each year from 1979 through 2010. (Appendix A gives more information on the data and on CBO’s methodology.) This report shows average federal tax rates for various income categories for the four largest sources of federal revenue—individual income taxes, payroll taxes, corporate income taxes, and excise taxes—and for the four types combined. Together, those sources typically account for at least 95 percent of all federal revenues. This report also discusses average household income (both before and after taxes) and shares of taxes and income for each quintile of the income distri-bution and for subgroups of the top quintile. Customs duties, estate and gift taxes, and miscellaneous receipts are not considered in the current analysis.4
3. See Congressional Budget Office, The Distribution of Household Income and Federal Taxes, 2008 and 2009 (July 2012), www.cbo.gov/publication/43373, and Trends in the Distribution of Household Income Between 1979 and 2007 (October 2011), www.cbo.gov/publication/42729. Supplemental data for this report present estimates for the 1979–2010 period. See Congressional Budget Office, The Distribution of Household Income and Federal Taxes, 2010 (December 2013), www.cbo.gov/publication/44604.
4. In a recent study, CBO analyzed the distribution of a slightly larger set of taxes as well as most federal spending. See Congressional Budget Office, The Distribution of Federal Spending and Taxes in 2006 (November 2013), www.cbo.gov/publication/44698.
CBO
4 THE DISTRIBUTION OF HOUSEHOLD INCOME AND FEDERAL TAXES, 2010 DECEMBER 2013
CBO
Figure 3.
Average Federal Tax Rates, by Income Group, 1979 to 2010 and Under 2013 Law(Percent)
Source: Congressional Budget Office.
Notes: CBO estimated average tax rates under 2013 law by simulating tax liabilities under 2013 tax rules using reported 2010 incomes and making adjustments for aggregate income growth between 2010 and 2013.
Average federal tax rates are calculated by dividing federal tax liabilities by before-tax income.
Before-tax income is the sum of market income and government transfers. Market income is composed of labor income, business income, capital gains, capital income (excluding capital gains), income received in retirement for past services, and other sources of income. Government transfers are cash payments and in-kind benefits from social insurance and other government assistance programs.
Federal taxes include individual and corporate income taxes, social insurance (or payroll) taxes, and excise taxes.
Income groups are created by ranking households by before-tax income. Quintiles (fifths) contain equal numbers of people; percentiles (hundredths) contain equal numbers of people as well.
For more detailed definitions of income, see Appendix A.
In modeling the effects of various taxes, CBO allocated individual income taxes directly to the households that pay them. It also allocated payroll taxes to the house-holds that pay them either directly to the government through deductions or indirectly through employers’ contributions. CBO allocated 75 percent of the burden of corporate income taxes to owners of capital, in propor-tion to their capital income, and 25 percent to workers, in proportion to their labor income. Excise taxes are
0
10
20
30
40
1980 1985 1990 1995 2000 2005 2010 Under2013 Law
Lowest Quintile
81st to 99th Percentiles
Top 1 Percent
Middle 60 Percent (21st to 80th Percentiles)
allocated to households according to their consumption of the taxed goods or services.
This study uses several measures of income. Market income consists of labor income, business income, capital gains, capital income (excluding capital gains), income received in retirement for past services, and other sources of income. (Labor income includes the value of income received in-kind from sources such as employer-paid health insurance premiums.) Before-tax income is the sum of market income and government transfers, and after-tax income is before-tax income minus federal tax liabilities.
The unit of analysis for this report is the household, which is considered to consist of the people who share a housing unit, regardless of their relationship to one another. To construct income groups, CBO ranked households by income with an adjustment for household size to account for the differing needs of households of various sizes. Larger households, for example, need more income than smaller ones to achieve the same standard of living, but they generally do not need proportionally more income. CBO adjusted for household size by divid-ing household income by the square root of the number of people in the household, counting adults and children equally.
This study focuses on annual income, showing average income in different years for different households grouped by income. Annual income is only one measure of economic well-being, however, and this analysis does not assess trends in the distribution of other measures, such as household income measured over longer periods, household consumption, or household wealth.5 Because household income varies over time, a household in a given segment of the income distribution in one year could be in a different segment in another year.
Estimates for 2010Between 2009 and 2010, real before-tax income grew by 2.7 percent across all households. That increase was uneven, however, with income rising by 16.0 percent for
5. Income measured over several years is more equally distributed than is income for a single year, although only modestly so. See Congressional Budget Office, Effective Tax Rates: Comparing Annual and Multiyear Measures (January 2005), www.cbo.gov/publication/16212.
DECEMBER 2013 THE DISTRIBUTION OF HOUSEHOLD INCOME AND FEDERAL TAXES, 2010 5
households in the top income percentile but by less than 1 percent for households in the bottom four quintiles. The share of income accruing to households in the top 1 percent rose, but it fell for most other income groups. Average tax rates rose for all income quintiles (and the top percentile) by less than 1 percentage point, primarily because individual and corporate income taxes increased. Increases in after-tax income were smaller than increases in before-tax income because of the rise in average tax rates.
Households’ Before-Tax IncomeBefore-tax income, the sum of market income and gov-ernment transfers, is distributed very unevenly because of the very uneven distribution of market income, which is partially equalized through government transfers (see Box 1). In 2010, households in the lowest quintile received 5.1 percent of all before-tax income, or about $24,100 per household (see Table 1 on page 8). Those in the middle fifth received 14.2 percent, or $65,400 per household. Households in the top quintile received 51.9 percent, or about $239,100 per household.
Real average before-tax income grew by 2.7 percent from 2009 to 2010 across all households, but that growth was not uniform across the income distribution. Households in the bottom income quintile in 2010 had income that was 1.2 percentage points higher than those in the same group in 2009 (the households in the various groups in 2010, however, were not necessarily the same as those a year before). Households in the middle three income quintiles, and in the 81st through 90th percentiles, in 2010 had income that was less than a percentage point higher than in 2009. Income grew by 1.8 percent for households in the 91st through 95th percentiles, by 3.5 percent for households in the 96th through 99th percentiles, and by 16.0 percent for households in the top 1 percent of the income distribution. That increase for taxpayers with the highest income recouped some of the steep declines that occurred from 2007 to 2009, although among the top 1 percent, income remained well below its prerecession peak. As a result of the uneven growth, the share of before-tax income received by the top 1 percent grew from 13.3 percent to 14.9 percent, and the share received by all income groups below the 96th percentile fell.
That uneven pattern reflects substantially different growth rates for various sources of income as the econ-omy began to recover from the recession, with little
change in the distribution of each type. Several income sources that accrue predominantly to higher-income households declined steeply from 2007 to 2009 but then rebounded somewhat in 2010. For example, real capital gains income rose by 55 percent from 2009 to 2010, although it was still 60 percent below the peak reached in 2007, and dividends and business income also grew rapidly from 2009 to 2010, by 10 percent and 12 per-cent, respectively. In contrast, wage income, the most important source for households in the lower 80 percent of the distribution, grew by less than 1 percent in real terms from 2009 to 2010. Transfer income, which is quite important to the lower income quintiles, grew by less than 2 percent in real terms.
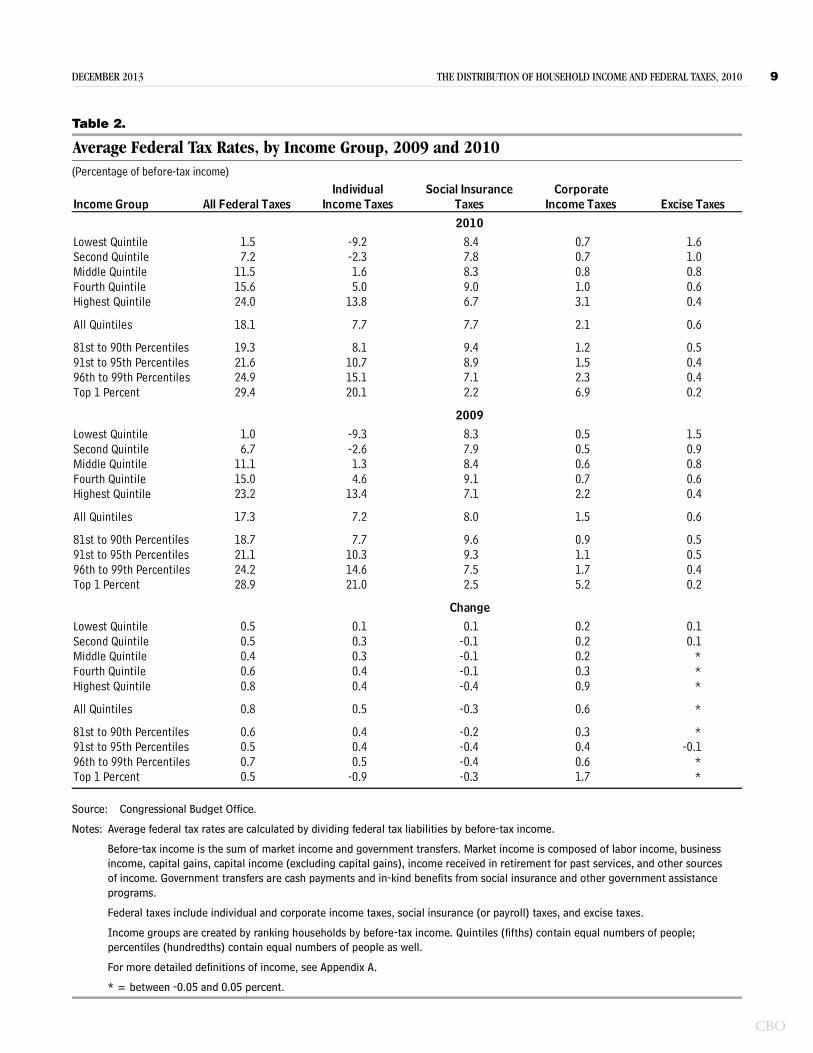
Average Federal Tax RatesAverage tax rates depend both on tax laws and on eco-nomic conditions. The overall average federal tax rate (federal tax liabilities divided by before-tax household income) was 18.1 percent in 2010 (see Table 2 on page 9). And of that overall rate, the rates for individual income taxes and payroll taxes were 7.7 percent of house-hold income each, the corporate income tax rate was 2.1 percent, and the excise tax rate was 0.6 percent.
Although the average individual income tax rate histori-cally has been higher than the payroll tax rate, in 2010 the two were equal. Two factors explain that unusual circumstance. First, nonwage income (such as interest, dividends, and capital gains) declined much more than wage income did in the recent recession. Despite a partial recovery in 2010, nonwage income was still low, thus reducing income taxes but not payroll taxes. Second, the American Recovery and Reinvestment Act of 2009 (ARRA) introduced new refundable income tax credits and expanded some existing credits, which reduced indi-vidual income taxes in 2009 and 2010. In its analysis, CBO measured individual income taxes net of refundable credits.6 In 2011, some components of ARRA expired, and a reduction in the payroll tax rate took effect, so average income tax rates probably rose in that year while average payroll tax rates declined.
6. In the federal budget, the refundable portion of income tax credits is counted as an outlay. In fiscal year 2010, the revenues collected from individual income taxes (which do not count the refundable portion of those tax credits) constituted a slightly larger share of gross domestic product (6.1 percent) than the revenues collected from payroll taxes (5.8 percent).
CBO
6 THE DISTRIBUTION OF HOUSEHOLD INCOME AND FEDERAL TAXES, 2010 DECEMBER 2013
CBO
Continued
Box 1.
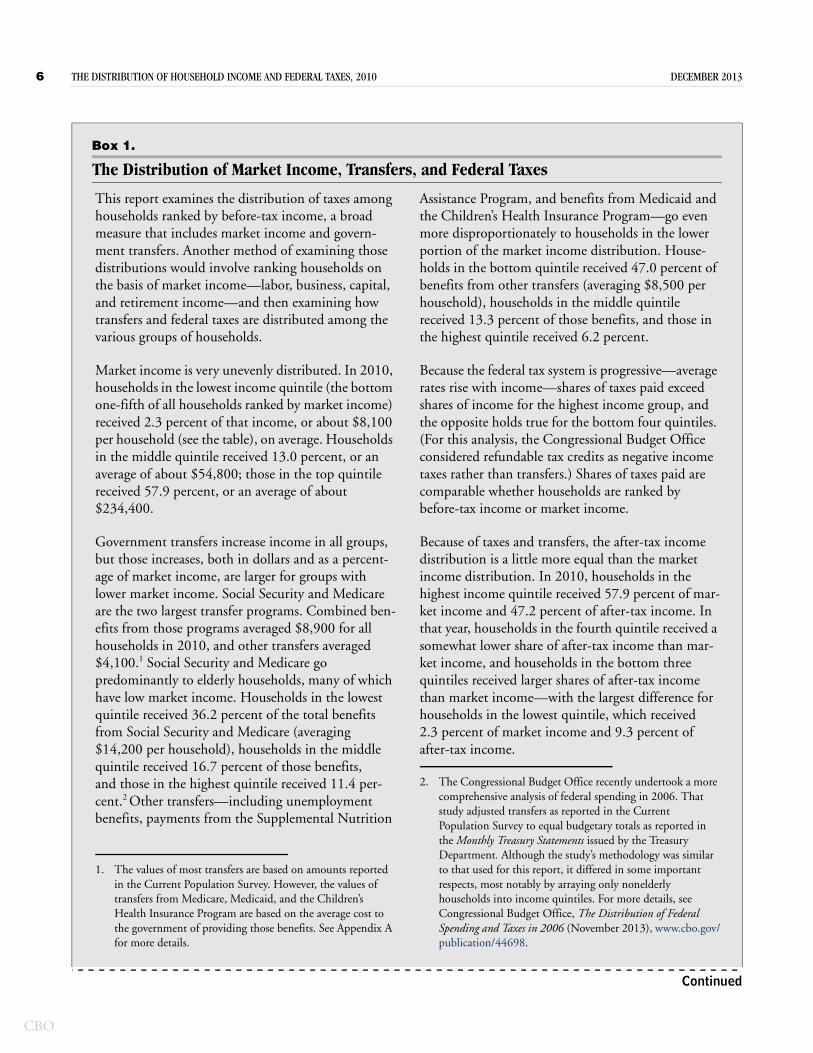
The Distribution of Market Income, Transfers, and Federal Taxes
This report examines the distribution of taxes among households ranked by before-tax income, a broad measure that includes market income and govern-ment transfers. Another method of examining those distributions would involve ranking households on the basis of market income—labor, business, capital, and retirement income—and then examining how transfers and federal taxes are distributed among the various groups of households.
Market income is very unevenly distributed. In 2010, households in the lowest income quintile (the bottom one-fifth of all households ranked by market income) received 2.3 percent of that income, or about $8,100 per household (see the table), on average. Households in the middle quintile received 13.0 percent, or an average of about $54,800; those in the top quintile received 57.9 percent, or an average of about $234,400.
Government transfers increase income in all groups, but those increases, both in dollars and as a percent-age of market income, are larger for groups with lower market income. Social Security and Medicare are the two largest transfer programs. Combined ben-efits from those programs averaged $8,900 for all households in 2010, and other transfers averaged $4,100.1 Social Security and Medicare go predominantly to elderly households, many of which have low market income. Households in the lowest quintile received 36.2 percent of the total benefits from Social Security and Medicare (averaging $14,200 per household), households in the middle quintile received 16.7 percent of those benefits, and those in the highest quintile received 11.4 per-cent.2 Other transfers—including unemployment benefits, payments from the Supplemental Nutrition
Assistance Program, and benefits from Medicaid and the Children’s Health Insurance Program—go even more disproportionately to households in the lower portion of the market income distribution. House-holds in the bottom quintile received 47.0 percent of benefits from other transfers (averaging $8,500 per household), households in the middle quintile received 13.3 percent of those benefits, and those in the highest quintile received 6.2 percent.
Because the federal tax system is progressive—average rates rise with income—shares of taxes paid exceed shares of income for the highest income group, and the opposite holds true for the bottom four quintiles. (For this analysis, the Congressional Budget Office considered refundable tax credits as negative income taxes rather than transfers.) Shares of taxes paid are comparable whether households are ranked by before-tax income or market income.
Because of taxes and transfers, the after-tax income distribution is a little more equal than the market income distribution. In 2010, households in the highest income quintile received 57.9 percent of mar-ket income and 47.2 percent of after-tax income. In that year, households in the fourth quintile received a somewhat lower share of after-tax income than mar-ket income, and households in the bottom three quintiles received larger shares of after-tax income than market income—with the largest difference for households in the lowest quintile, which received 2.3 percent of market income and 9.3 percent of after-tax income.
1. The values of most transfers are based on amounts reported in the Current Population Survey. However, the values of transfers from Medicare, Medicaid, and the Children’s Health Insurance Program are based on the average cost to the government of providing those benefits. See Appendix A for more details.
2. The Congressional Budget Office recently undertook a more comprehensive analysis of federal spending in 2006. That study adjusted transfers as reported in the Current Population Survey to equal budgetary totals as reported in the Monthly Treasury Statements issued by the Treasury Department. Although the study’s methodology was similar to that used for this report, it differed in some important respects, most notably by arraying only nonelderly households into income quintiles. For more details, see Congressional Budget Office, The Distribution of Federal Spending and Taxes in 2006 (November 2013), www.cbo.gov/publication/44698.
DECEMBER 2013 THE DISTRIBUTION OF HOUSEHOLD INCOME AND FEDERAL TAXES, 2010 7
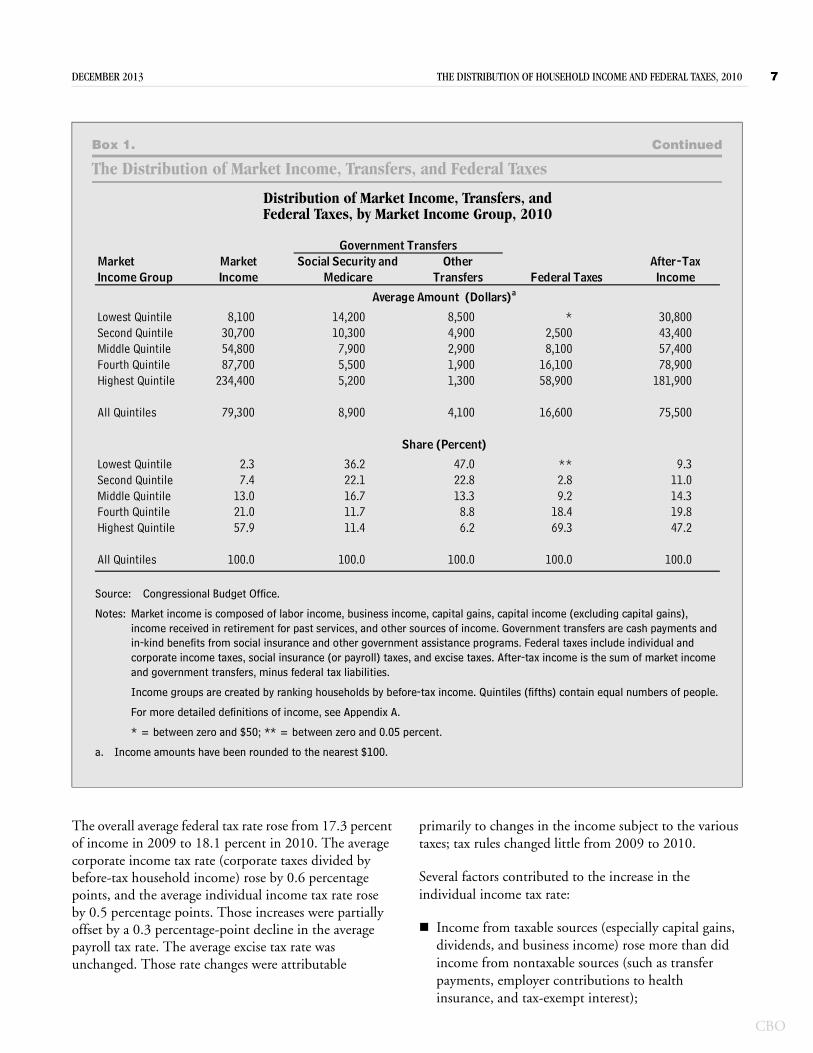
Box 1. Continued
The Distribution of Market Income, Transfers, and Federal Taxes
Distribution of Market Income, Transfers, andFederal Taxes, by Market Income Group, 2010
Source: Congressional Budget Office.
Notes: Market income is composed of labor income, business income, capital gains, capital income (excluding capital gains), income received in retirement for past services, and other sources of income. Government transfers are cash payments and in-kind benefits from social insurance and other government assistance programs. Federal taxes include individual and corporate income taxes, social insurance (or payroll) taxes, and excise taxes. After-tax income is the sum of market income and government transfers, minus federal tax liabilities.
Income groups are created by ranking households by before-tax income. Quintiles (fifths) contain equal numbers of people.
For more detailed definitions of income, see Appendix A.
* = between zero and $50; ** = between zero and 0.05 percent.
a. Income amounts have been rounded to the nearest $100.
MarketIncome Group
Lowest Quintile 8,100 14,200 8,500 * 30,800Second Quintile 30,700 10,300 4,900 2,500 43,400Middle Quintile 54,800 7,900 2,900 8,100 57,400Fourth Quintile 87,700 5,500 1,900 16,100 78,900Highest Quintile 234,400 5,200 1,300 58,900 181,900
All Quintiles 79,300 8,900 4,100 16,600 75,500
Lowest Quintile 2.3 36.2 47.0 ** 9.3Second Quintile 7.4 22.1 22.8 2.8 11.0Middle Quintile 13.0 16.7 13.3 9.2 14.3Fourth Quintile 21.0 11.7 8.8 18.4 19.8Highest Quintile 57.9 11.4 6.2 69.3 47.2
All Quintiles 100.0 100.0 100.0 100.0 100.0
Federal Taxes
Average Amount (Dollars)a
Share (Percent)
IncomeAfter-Tax
IncomeMarket
MedicareSocial Security and
TransfersOther
Government Transfers
The overall average federal tax rate rose from 17.3 percent of income in 2009 to 18.1 percent in 2010. The average corporate income tax rate (corporate taxes divided by before-tax household income) rose by 0.6 percentage points, and the average individual income tax rate rose by 0.5 percentage points. Those increases were partially offset by a 0.3 percentage-point decline in the average payroll tax rate. The average excise tax rate was unchanged. Those rate changes were attributable
primarily to changes in the income subject to the various taxes; tax rules changed little from 2009 to 2010.
Several factors contributed to the increase in the individual income tax rate:
Income from taxable sources (especially capital gains, dividends, and business income) rose more than did income from nontaxable sources (such as transfer payments, employer contributions to health insurance, and tax-exempt interest);
CBO
8 THE DISTRIBUTION OF HOUSEHOLD INCOME AND FEDERAL TAXES, 2010 DECEMBER 2013
CBO
Table 1.
Distribution of Before- and After-Tax Income, by Income Group, 2009 and 2010
Source: Congressional Budget Office.
Notes: Average federal tax rates are calculated by dividing federal tax liabilities by before-tax income.
Before-tax income is the sum of market income and government transfers. Market income is composed of labor income, business income, capital gains, capital income (excluding capital gains), income received in retirement for past services, and other sources of income. Government transfers are cash payments and in-kind benefits from social insurance and other government assistance programs.
After-tax income is the sum of market income and government transfers, minus federal tax liabilities.
Federal taxes include individual and corporate income taxes, social insurance (or payroll) taxes, and excise taxes.
Income groups are created by ranking households by before-tax income. Quintiles (fifths) contain equal numbers of people; percentiles (hundredths) contain equal numbers of people as well.
For more detailed definitions of income, see Appendix A.
* = between -0.05 and 0.05 percentage points; n.a. = not applicable.
a. Income amounts have been rounded to the nearest $100.
Income Group
Lowest Quintile 23,800 24,100 1.2 5.1 5.1 *Second Quintile 44,000 44,200 0.5 9.8 9.6 -0.2Middle Quintile 65,200 65,400 0.3 14.6 14.2 -0.4Fourth Quintile 95,100 95,500 0.4 21.1 20.4 -0.7Highest Quintile 227,100 239,100 5.3 50.8 51.9 1.1
All Quintiles 89,800 92,200 2.7 100.0 100.0 n.a.
81st to 90th Percentiles 134,000 134,600 0.5 14.9 14.6 -0.391st to 95th Percentiles 178,400 181,600 1.8 10.1 9.9 -0.296th to 99th Percentiles 276,700 286,400 3.5 12.5 12.5 *Top 1 Percent 1,237,300 1,434,900 16.0 13.3 14.9 1.6
Lowest Quintile 23,600 23,700 0.7 6.1 6.2 0.1Second Quintile 41,000 41,000 0 11.1 10.9 -0.2Middle Quintile 58,000 57,900 -0.1 15.7 15.4 -0.3Fourth Quintile 80,800 80,600 -0.3 21.6 21.0 -0.6Highest Quintile 174,500 181,800 4.2 47.2 48.1 0.9
All Quintiles 74,200 75,500 1.8 100.0 100.0 n.a.
81st to 90th Percentiles 109,000 108,700 -0.3 14.7 14.3 -0.491st to 95th Percentiles 140,700 142,400 1.2 9.6 9.5 -0.196th to 99th Percentiles 209,900 215,200 2.6 11.4 11.5 0.1Top 1 Percent 879,800 1,013,100 15.1 11.5 12.8 1.3
Change2009 2010 (Percent) 2009 2010 (Percentage points)
Before-Tax Income
Share of Income (Percent)Average Income (2010 Dollars)a
After-Tax Income
Change
Growth in itemized deductions was outstripped by growth in income;
The distribution of taxable income shifted upward, so more income was taxed in higher tax brackets; and
Tax credits grew more slowly than income did, in large part because many credits have fixed dollar caps.
The average corporate income tax rate (again, defined for this analysis as corporate taxes divided by before-tax household income) rose from 1.5 percent in 2009 to 2.1 percent in 2010. Corporate tax liabilities rose by
DECEMBER 2013 THE DISTRIBUTION OF HOUSEHOLD INCOME AND FEDERAL TAXES, 2010 9
Table 2.
Average Federal Tax Rates, by Income Group, 2009 and 2010(Percentage of before-tax income)
Source: Congressional Budget Office.
Notes: Average federal tax rates are calculated by dividing federal tax liabilities by before-tax income.
Before-tax income is the sum of market income and government transfers. Market income is composed of labor income, business income, capital gains, capital income (excluding capital gains), income received in retirement for past services, and other sources of income. Government transfers are cash payments and in-kind benefits from social insurance and other government assistance programs.
Federal taxes include individual and corporate income taxes, social insurance (or payroll) taxes, and excise taxes.
Income groups are created by ranking households by before-tax income. Quintiles (fifths) contain equal numbers of people; percentiles (hundredths) contain equal numbers of people as well.
For more detailed definitions of income, see Appendix A.
* = between -0.05 and 0.05 percent.
Income Group
Lowest Quintile 1.5 -9.2 8.4 0.7 1.6Second Quintile 7.2 -2.3 7.8 0.7 1.0Middle Quintile 11.5 1.6 8.3 0.8 0.8Fourth Quintile 15.6 5.0 9.0 1.0 0.6Highest Quintile 24.0 13.8 6.7 3.1 0.4
All Quintiles 18.1 7.7 7.7 2.1 0.6
81st to 90th Percentiles 19.3 8.1 9.4 1.2 0.591st to 95th Percentiles 21.6 10.7 8.9 1.5 0.496th to 99th Percentiles 24.9 15.1 7.1 2.3 0.4Top 1 Percent 29.4 20.1 2.2 6.9 0.2
Lowest Quintile 1.0 -9.3 8.3 0.5 1.5Second Quintile 6.7 -2.6 7.9 0.5 0.9Middle Quintile 11.1 1.3 8.4 0.6 0.8Fourth Quintile 15.0 4.6 9.1 0.7 0.6Highest Quintile 23.2 13.4 7.1 2.2 0.4
All Quintiles 17.3 7.2 8.0 1.5 0.6
81st to 90th Percentiles 18.7 7.7 9.6 0.9 0.591st to 95th Percentiles 21.1 10.3 9.3 1.1 0.596th to 99th Percentiles 24.2 14.6 7.5 1.7 0.4Top 1 Percent 28.9 21.0 2.5 5.2 0.2
Lowest Quintile 0.5 0.1 0.1 0.2 0.1Second Quintile 0.5 0.3 -0.1 0.2 0.1Middle Quintile 0.4 0.3 -0.1 0.2 *Fourth Quintile 0.6 0.4 -0.1 0.3 *Highest Quintile 0.8 0.4 -0.4 0.9 *
All Quintiles 0.8 0.5 -0.3 0.6 *
81st to 90th Percentiles 0.6 0.4 -0.2 0.3 *91st to 95th Percentiles 0.5 0.4 -0.4 0.4 -0.196th to 99th Percentiles 0.7 0.5 -0.4 0.6 *Top 1 Percent 0.5 -0.9 -0.3 1.7 *
All Federal Taxes Income Taxes Taxes Income Taxes Excise Taxes
2010
2009
Change
Individual Social Insurance Corporate
CBO
10 THE DISTRIBUTION OF HOUSEHOLD INCOME AND FEDERAL TAXES, 2010 DECEMBER 2013
CBO
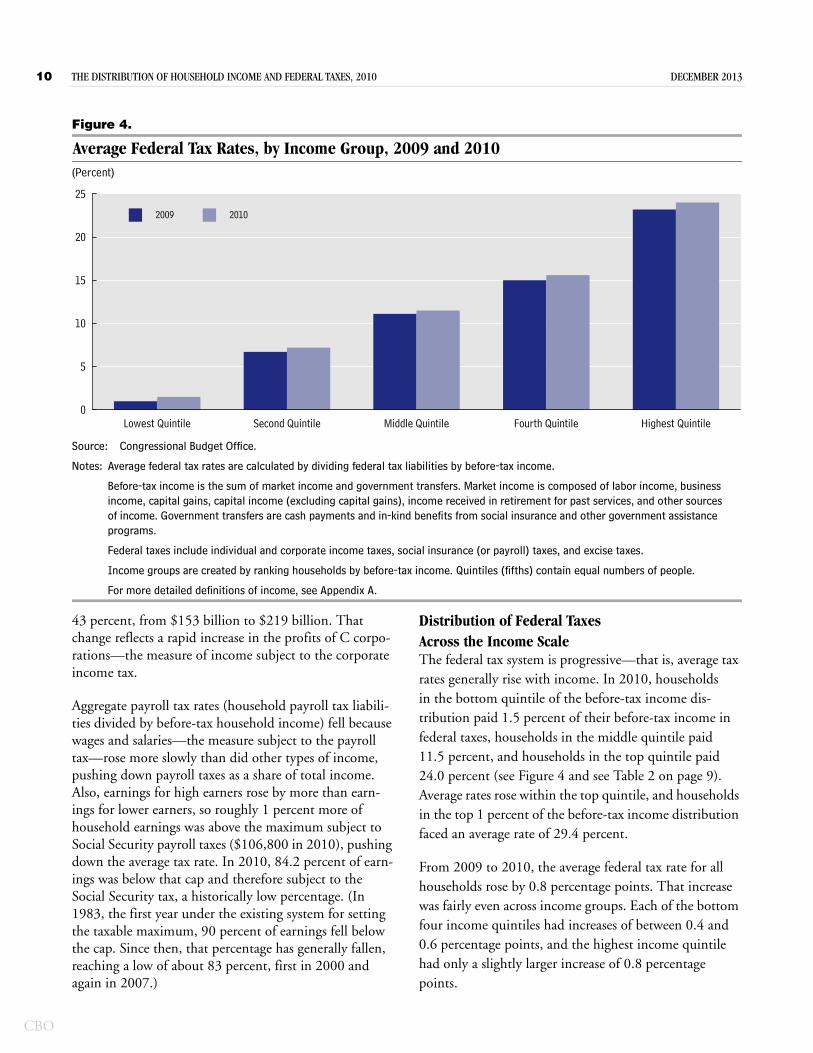
Figure 4.
Average Federal Tax Rates, by Income Group, 2009 and 2010(Percent)
Source: Congressional Budget Office.
Notes: Average federal tax rates are calculated by dividing federal tax liabilities by before-tax income.
Before-tax income is the sum of market income and government transfers. Market income is composed of labor income, business income, capital gains, capital income (excluding capital gains), income received in retirement for past services, and other sources of income. Government transfers are cash payments and in-kind benefits from social insurance and other government assistance programs.
Federal taxes include individual and corporate income taxes, social insurance (or payroll) taxes, and excise taxes.
Income groups are created by ranking households by before-tax income. Quintiles (fifths) contain equal numbers of people.
For more detailed definitions of income, see Appendix A.
Lowest Quintile Second Quintile Middle Quintile Fourth Quintile Highest Quintile0
5
10
15
20
25
2009 2010
43 percent, from $153 billion to $219 billion. That change reflects a rapid increase in the profits of C corpo-rations—the measure of income subject to the corporate income tax.
Aggregate payroll tax rates (household payroll tax liabili-ties divided by before-tax household income) fell because wages and salaries—the measure subject to the payroll tax—rose more slowly than did other types of income, pushing down payroll taxes as a share of total income. Also, earnings for high earners rose by more than earn-ings for lower earners, so roughly 1 percent more of household earnings was above the maximum subject to Social Security payroll taxes ($106,800 in 2010), pushing down the average tax rate. In 2010, 84.2 percent of earn-ings was below that cap and therefore subject to the Social Security tax, a historically low percentage. (In 1983, the first year under the existing system for setting the taxable maximum, 90 percent of earnings fell below the cap. Since then, that percentage has generally fallen, reaching a low of about 83 percent, first in 2000 and again in 2007.)
Distribution of Federal Taxes Across the Income ScaleThe federal tax system is progressive—that is, average tax rates generally rise with income. In 2010, households in the bottom quintile of the before-tax income dis-tribution paid 1.5 percent of their before-tax income in federal taxes, households in the middle quintile paid 11.5 percent, and households in the top quintile paid 24.0 percent (see Figure 4 and see Table 2 on page 9). Average rates rose within the top quintile, and households in the top 1 percent of the before-tax income distribution faced an average rate of 29.4 percent.
From 2009 to 2010, the average federal tax rate for all households rose by 0.8 percentage points. That increase was fairly even across income groups. Each of the bottom four income quintiles had increases of between 0.4 and 0.6 percentage points, and the highest income quintile had only a slightly larger increase of 0.8 percentage points.
DECEMBER 2013 THE DISTRIBUTION OF HOUSEHOLD INCOME AND FEDERAL TAXES, 2010 11
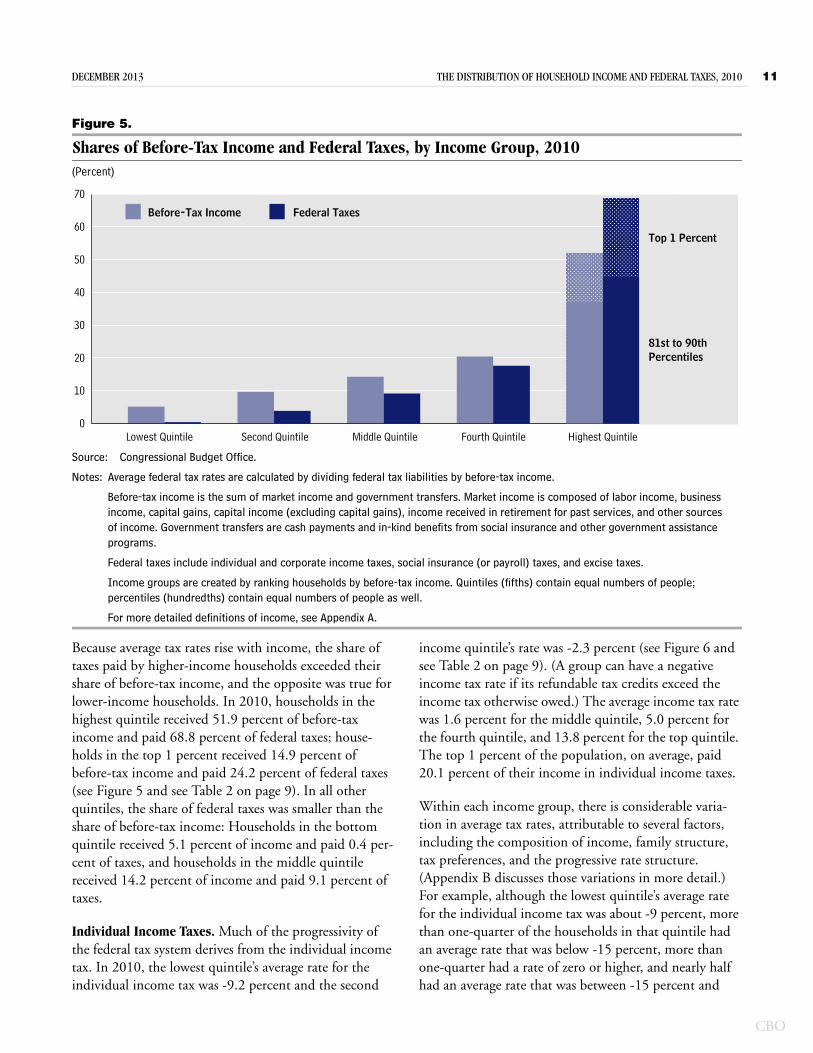
Figure 5.
Shares of Before-Tax Income and Federal Taxes, by Income Group, 2010(Percent)
Source: Congressional Budget Office.
Notes: Average federal tax rates are calculated by dividing federal tax liabilities by before-tax income.
Before-tax income is the sum of market income and government transfers. Market income is composed of labor income, business income, capital gains, capital income (excluding capital gains), income received in retirement for past services, and other sources of income. Government transfers are cash payments and in-kind benefits from social insurance and other government assistance programs.
Federal taxes include individual and corporate income taxes, social insurance (or payroll) taxes, and excise taxes.
Income groups are created by ranking households by before-tax income. Quintiles (fifths) contain equal numbers of people; percentiles (hundredths) contain equal numbers of people as well.
For more detailed definitions of income, see Appendix A.
0
10
20
30
40
50
60
70
Top 1 Percent
81st to 90thPercentiles
Lowest Quintile Second Quintile Middle Quintile Fourth Quintile Highest Quintile
Before-Tax Income Federal Taxes
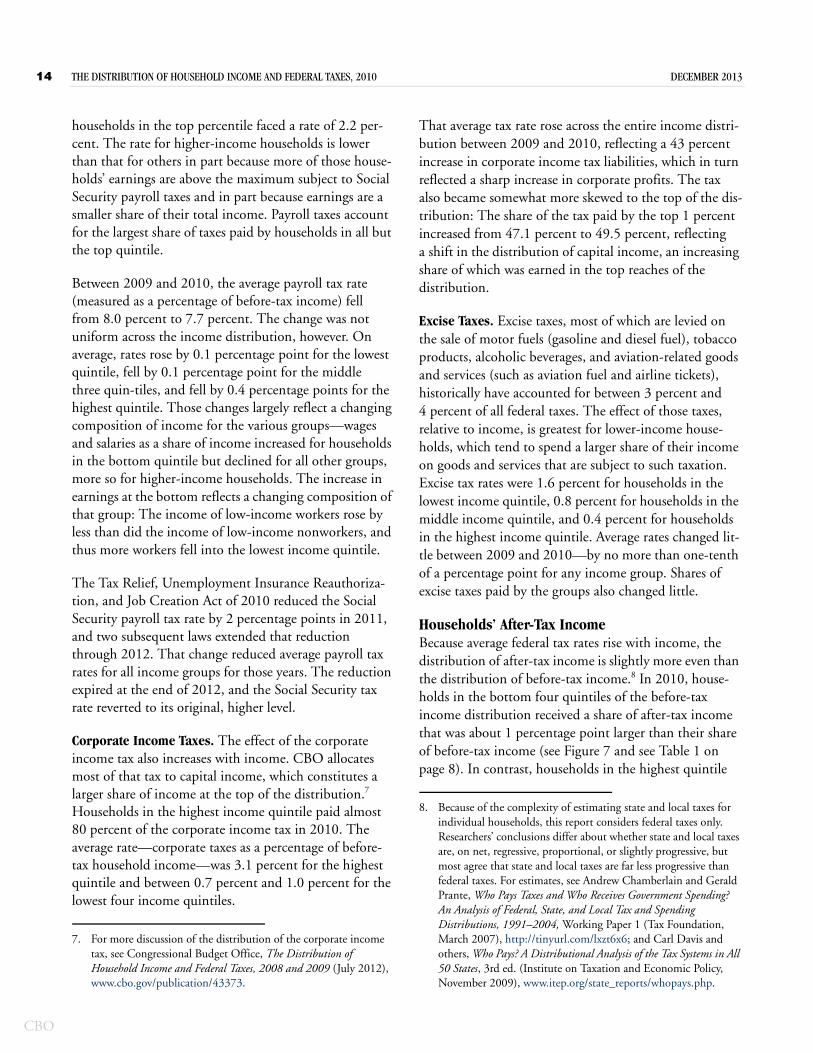
Because average tax rates rise with income, the share of taxes paid by higher-income households exceeded their share of before-tax income, and the opposite was true for lower-income households. In 2010, households in the highest quintile received 51.9 percent of before-tax income and paid 68.8 percent of federal taxes; house-holds in the top 1 percent received 14.9 percent of before-tax income and paid 24.2 percent of federal taxes (see Figure 5 and see Table 2 on page 9). In all other quintiles, the share of federal taxes was smaller than the share of before-tax income: Households in the bottom quintile received 5.1 percent of income and paid 0.4 per-cent of taxes, and households in the middle quintile received 14.2 percent of income and paid 9.1 percent of taxes.
Individual Income Taxes. Much of the progressivity of the federal tax system derives from the individual income tax. In 2010, the lowest quintile’s average rate for the individual income tax was -9.2 percent and the second
income quintile’s rate was -2.3 percent (see Figure 6 and see Table 2 on page 9). (A group can have a negative income tax rate if its refundable tax credits exceed the income tax otherwise owed.) The average income tax rate was 1.6 percent for the middle quintile, 5.0 percent for the fourth quintile, and 13.8 percent for the top quintile. The top 1 percent of the population, on average, paid 20.1 percent of their income in individual income taxes.
Within each income group, there is considerable varia-tion in average tax rates, attributable to several factors, including the composition of income, family structure, tax preferences, and the progressive rate structure. (Appendix B discusses those variations in more detail.) For example, although the lowest quintile’s average rate for the individual income tax was about -9 percent, more than one-quarter of the households in that quintile had an average rate that was below -15 percent, more than one-quarter had a rate of zero or higher, and nearly half had an average rate that was between -15 percent and
CBO
12 THE DISTRIBUTION OF HOUSEHOLD INCOME AND FEDERAL TAXES, 2010 DECEMBER 2013
CBO
Figure 6.
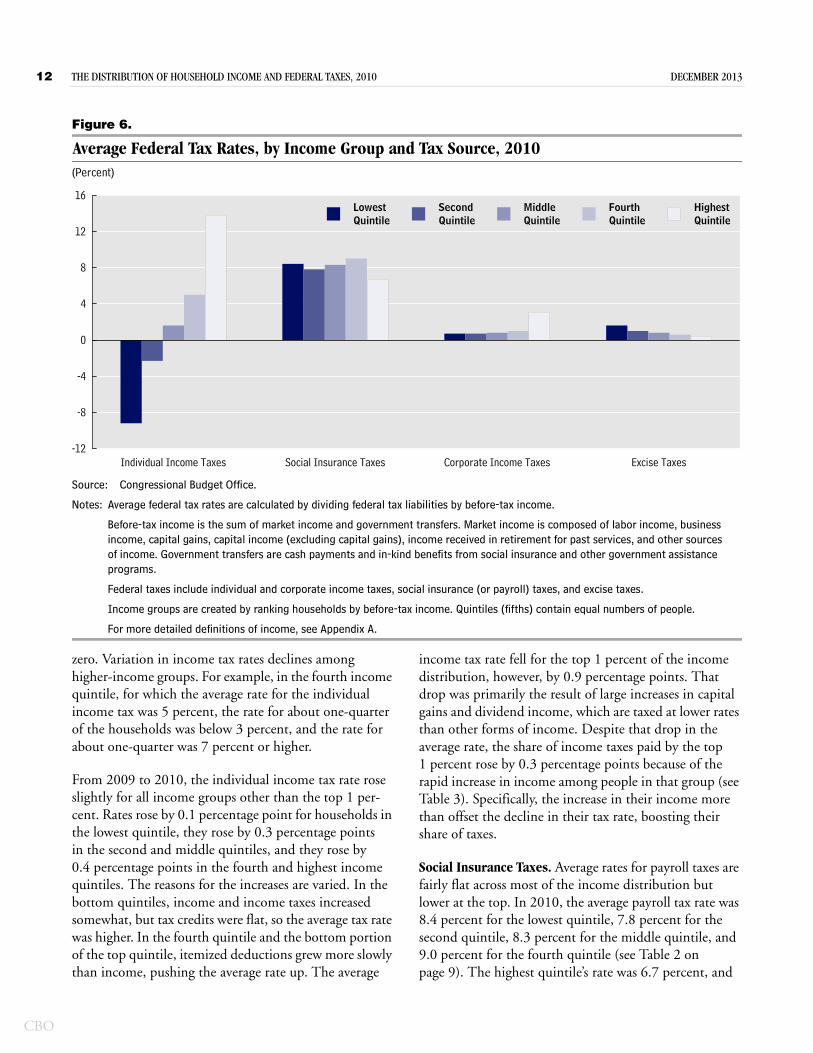
Average Federal Tax Rates, by Income Group and Tax Source, 2010(Percent)
Source: Congressional Budget Office.
Notes: Average federal tax rates are calculated by dividing federal tax liabilities by before-tax income.
Before-tax income is the sum of market income and government transfers. Market income is composed of labor income, business income, capital gains, capital income (excluding capital gains), income received in retirement for past services, and other sources of income. Government transfers are cash payments and in-kind benefits from social insurance and other government assistance programs.
Federal taxes include individual and corporate income taxes, social insurance (or payroll) taxes, and excise taxes.
Income groups are created by ranking households by before-tax income. Quintiles (fifths) contain equal numbers of people.
For more detailed definitions of income, see Appendix A.
Individual Income Taxes Social Insurance Taxes Corporate Income Taxes Excise Taxes-12
-8
-4
0
4
8
12
16LowestQuintile
SecondQuintile
MiddleQuintile
FourthQuintile
HighestQuintile
zero. Variation in income tax rates declines among higher-income groups. For example, in the fourth income quintile, for which the average rate for the individual income tax was 5 percent, the rate for about one-quarter of the households was below 3 percent, and the rate for about one-quarter was 7 percent or higher.
From 2009 to 2010, the individual income tax rate rose slightly for all income groups other than the top 1 per-cent. Rates rose by 0.1 percentage point for households in the lowest quintile, they rose by 0.3 percentage points in the second and middle quintiles, and they rose by 0.4 percentage points in the fourth and highest income quintiles. The reasons for the increases are varied. In the bottom quintiles, income and income taxes increased somewhat, but tax credits were flat, so the average tax rate was higher. In the fourth quintile and the bottom portion of the top quintile, itemized deductions grew more slowly than income, pushing the average rate up. The average
income tax rate fell for the top 1 percent of the income distribution, however, by 0.9 percentage points. That drop was primarily the result of large increases in capital gains and dividend income, which are taxed at lower rates than other forms of income. Despite that drop in the average rate, the share of income taxes paid by the top 1 percent rose by 0.3 percentage points because of the rapid increase in income among people in that group (see Table 3). Specifically, the increase in their income more than offset the decline in their tax rate, boosting their share of taxes.
Social Insurance Taxes. Average rates for payroll taxes are fairly flat across most of the income distribution but lower at the top. In 2010, the average payroll tax rate was 8.4 percent for the lowest quintile, 7.8 percent for the second quintile, 8.3 percent for the middle quintile, and 9.0 percent for the fourth quintile (see Table 2 on page 9). The highest quintile’s rate was 6.7 percent, and
DECEMBER 2013 THE DISTRIBUTION OF HOUSEHOLD INCOME AND FEDERAL TAXES, 2010 13
Table 3.
Shares of Federal Taxes, by Income Group, 2009 and 2010(Percent)
Source: Congressional Budget Office.
Notes: Income groups are created by ranking households by before-tax income. Quintiles (fifths) contain equal numbers of people; percentiles (hundredths) contain equal numbers of people as well.
Before-tax income is the sum of market income and government transfers. Market income is composed of labor income, business income, capital gains, capital income (excluding capital gains), income received in retirement for past services, and other sources of income. Government transfers are cash payments and in-kind benefits from social insurance and other government assistance programs.
Federal taxes include individual and corporate income taxes, social insurance (or payroll) taxes, and excise taxes.
For more detailed definitions of income, see Appendix A.
* = between -0.05 and 0.05 percent.
Income Group
Lowest Quintile 0.4 -6.2 5.6 1.7 13.4Second Quintile 3.8 -2.9 9.8 3.1 15.4Middle Quintile 9.1 2.9 15.4 5.5 18.7Fourth Quintile 17.6 13.3 23.9 9.5 20.6Highest Quintile 68.8 92.9 45.1 78.8 31.5
All Quintiles 100.0 100.0 100.0 100.0 100.0
81st to 90th Percentiles 15.5 15.4 17.8 8.4 12.091st to 95th Percentiles 11.9 13.8 11.5 7.1 7.196th to 99th Percentiles 17.2 24.6 11.5 13.7 7.5Top 1 Percent 24.2 39.0 4.2 49.5 4.9
Lowest Quintile 0.3 -6.6 5.3 1.8 12.2Second Quintile 3.8 -3.5 9.6 3.2 15.2Middle Quintile 9.4 2.7 15.4 5.8 18.9Fourth Quintile 18.3 13.4 24.0 10.1 21.3Highest Quintile 68.0 94.1 45.4 77.2 31.9
All Quintiles 100.0 100.0 100.0 100.0 100.0
81st to 90th Percentiles 16.0 15.9 17.8 8.7 12.591st to 95th Percentiles 12.3 14.4 11.7 7.3 7.596th to 99th Percentiles 17.4 25.2 11.7 14.0 7.6Top 1 Percent 22.2 38.7 4.2 47.1 4.4
Lowest Quintile 0.1 0.4 0.3 -0.1 1.2Second Quintile * 0.6 0.2 -0.1 0.2Middle Quintile -0.3 0.2 * -0.3 -0.2Fourth Quintile -0.7 -0.1 -0.1 -0.6 -0.7Highest Quintile 0.8 -1.2 -0.3 1.6 -0.4
81st to 90th Percentiles -0.5 -0.5 * -0.3 -0.591st to 95th Percentiles -0.4 -0.6 -0.2 -0.2 -0.496th to 99th Percentiles -0.2 -0.6 -0.2 -0.3 -0.1Top 1 Percent 2.0 0.3 * 2.4 0.5
2010
2009
Change
Individual Social Insurance CorporateAll Federal Taxes Income Taxes Taxes Income Taxes Excise Taxes
CBO
14 THE DISTRIBUTION OF HOUSEHOLD INCOME AND FEDERAL TAXES, 2010 DECEMBER 2013
CBO
households in the top percentile faced a rate of 2.2 per-cent. The rate for higher-income households is lower than that for others in part because more of those house-holds’ earnings are above the maximum subject to Social Security payroll taxes and in part because earnings are a smaller share of their total income. Payroll taxes account for the largest share of taxes paid by households in all but the top quintile.
Between 2009 and 2010, the average payroll tax rate (measured as a percentage of before-tax income) fell from 8.0 percent to 7.7 percent. The change was not uniform across the income distribution, however. On average, rates rose by 0.1 percentage point for the lowest quintile, fell by 0.1 percentage point for the middle three quin-tiles, and fell by 0.4 percentage points for the highest quintile. Those changes largely reflect a changing composition of income for the various groups—wages and salaries as a share of income increased for households in the bottom quintile but declined for all other groups, more so for higher-income households. The increase in earnings at the bottom reflects a changing composition of that group: The income of low-income workers rose by less than did the income of low-income nonworkers, and thus more workers fell into the lowest income quintile.
The Tax Relief, Unemployment Insurance Reauthoriza-tion, and Job Creation Act of 2010 reduced the Social Security payroll tax rate by 2 percentage points in 2011, and two subsequent laws extended that reduction through 2012. That change reduced average payroll tax rates for all income groups for those years. The reduction expired at the end of 2012, and the Social Security tax rate reverted to its original, higher level.
Corporate Income Taxes. The effect of the corporate income tax also increases with income. CBO allocates most of that tax to capital income, which constitutes a larger share of income at the top of the distribution.7 Households in the highest income quintile paid almost 80 percent of the corporate income tax in 2010. The average rate—corporate taxes as a percentage of before-tax household income—was 3.1 percent for the highest quintile and between 0.7 percent and 1.0 percent for the lowest four income quintiles.
7. For more discussion of the distribution of the corporate income tax, see Congressional Budget Office, The Distribution of Household Income and Federal Taxes, 2008 and 2009 (July 2012), www.cbo.gov/publication/43373.
That average tax rate rose across the entire income distri-bution between 2009 and 2010, reflecting a 43 percent increase in corporate income tax liabilities, which in turn reflected a sharp increase in corporate profits. The tax also became somewhat more skewed to the top of the dis-tribution: The share of the tax paid by the top 1 percent increased from 47.1 percent to 49.5 percent, reflecting a shift in the distribution of capital income, an increasing share of which was earned in the top reaches of the distribution.
Excise Taxes. Excise taxes, most of which are levied on the sale of motor fuels (gasoline and diesel fuel), tobacco products, alcoholic beverages, and aviation-related goods and services (such as aviation fuel and airline tickets), historically have accounted for between 3 percent and 4 percent of all federal taxes. The effect of those taxes, relative to income, is greatest for lower-income house-holds, which tend to spend a larger share of their income on goods and services that are subject to such taxation. Excise tax rates were 1.6 percent for households in the lowest income quintile, 0.8 percent for households in the middle income quintile, and 0.4 percent for households in the highest income quintile. Average rates changed lit-tle between 2009 and 2010—by no more than one-tenth of a percentage point for any income group. Shares of excise taxes paid by the groups also changed little.
Households’ After-Tax IncomeBecause average federal tax rates rise with income, the distribution of after-tax income is slightly more even than the distribution of before-tax income.8 In 2010, house-holds in the bottom four quintiles of the before-tax income distribution received a share of after-tax income that was about 1 percentage point larger than their share of before-tax income (see Figure 7 and see Table 1 on page 8). In contrast, households in the highest quintile
8. Because of the complexity of estimating state and local taxes for individual households, this report considers federal taxes only. Researchers’ conclusions differ about whether state and local taxes are, on net, regressive, proportional, or slightly progressive, but most agree that state and local taxes are far less progressive than federal taxes. For estimates, see Andrew Chamberlain and Gerald Prante, Who Pays Taxes and Who Receives Government Spending? An Analysis of Federal, State, and Local Tax and Spending Distributions, 1991–2004, Working Paper 1 (Tax Foundation, March 2007), http://tinyurl.com/lxzt6x6; and Carl Davis and others, Who Pays? A Distributional Analysis of the Tax Systems in All 50 States, 3rd ed. (Institute on Taxation and Economic Policy, November 2009), www.itep.org/state_reports/whopays.php.
DECEMBER 2013 THE DISTRIBUTION OF HOUSEHOLD INCOME AND FEDERAL TAXES, 2010 15
Figure 7.
Shares of Before- and After-Tax Income, by Income Group, 2010(Percent)
Source: Congressional Budget Office.
Notes: Average federal tax rates are calculated by dividing federal tax liabilities by before-tax income.
Before-tax income is the sum of market income and government transfers. Market income is composed of labor income, business income, capital gains, capital income (excluding capital gains), income received in retirement for past services, and other sources of income. Government transfers are cash payments and in-kind benefits from social insurance and other government assistance programs.
Federal taxes include individual and corporate income taxes, social insurance (or payroll) taxes, and excise taxes.
After-tax income is the sum of market income and government transfers, minus federal tax liabilities.
Income groups are created by ranking households by before-tax income. Quintiles (fifths) contain equal numbers of people; percentiles (hundredths) contain equal numbers of people as well.
For more detailed definitions of income, see Appendix A.
0
10
20
30
40
50
60
Lowest Quintile Second Quintile Middle Quintile Fourth Quintile Highest Quintile
Top 1 Percent
81st to 99thPercentiles
Before-Tax Income After-Tax Income
received 51.9 percent of before-tax income and 48.1 percent of after-tax income.
Increases in after-tax income between 2009 and 2010 were heavily concentrated at the top of the income distri-bution, largely because of changes in the before-tax income distribution. After-tax income rose by 15.1 per-cent for the top 1 percent of households and by about 1.9 percent for households in the 91st to 99th percen-tiles. Households in the bottom four income quintiles saw changes in their after-tax income that ranged from an increase of 0.7 percent in the lowest quintile to a drop of 0.3 percent in the fourth quintile. As a consequence, the share of after-tax income accruing to the top percentile of the distribution rose by 1.3 percentage points, and the share earned by most other groups fell.
Trends Since 1979Viewed from a longer historical perspective, notable fea-tures of the distribution of income and taxes in 2010 include the following:
The overall average federal tax rate remained near its lowest rate in the 1979–2010 period, despite an increase in 2010.9 The average rate was lower in 2008, 2009, and 2010 than in all other years in that period, and the 2010 rate of 18.1 percent was well below the period’s average rate of 20.9 percent. Although the
9. CBO chose 1979 as a starting point for the analysis because it is the earliest year for which the Census Bureau provides consistent estimates for some measures of income. However, the beginning and end points of the analysis, 1979 and 2010, were quite different in terms of overall economic activity; 1979 was an economic peak year right before a recession, whereas in 2010 a slow economic recovery had just begun.
CBO
16 THE DISTRIBUTION OF HOUSEHOLD INCOME AND FEDERAL TAXES, 2010 DECEMBER 2013
CBO
average individual income tax rate rebounded slightly in 2010 from its low point in 2009, that rate also remained near its low for the period.
For all income groups apart from the top 1 percent, average federal tax rates in 2010 remained near their lowest rates in the 1979–2010 period, despite small increases in 2010. For the top percentile, however, the 2010 tax rate was near the average rate for the period.
The marked increase in 2010 in the after-tax income of households in the top 1 percent of the population reversed only a portion of the decline that accompanied the recession.
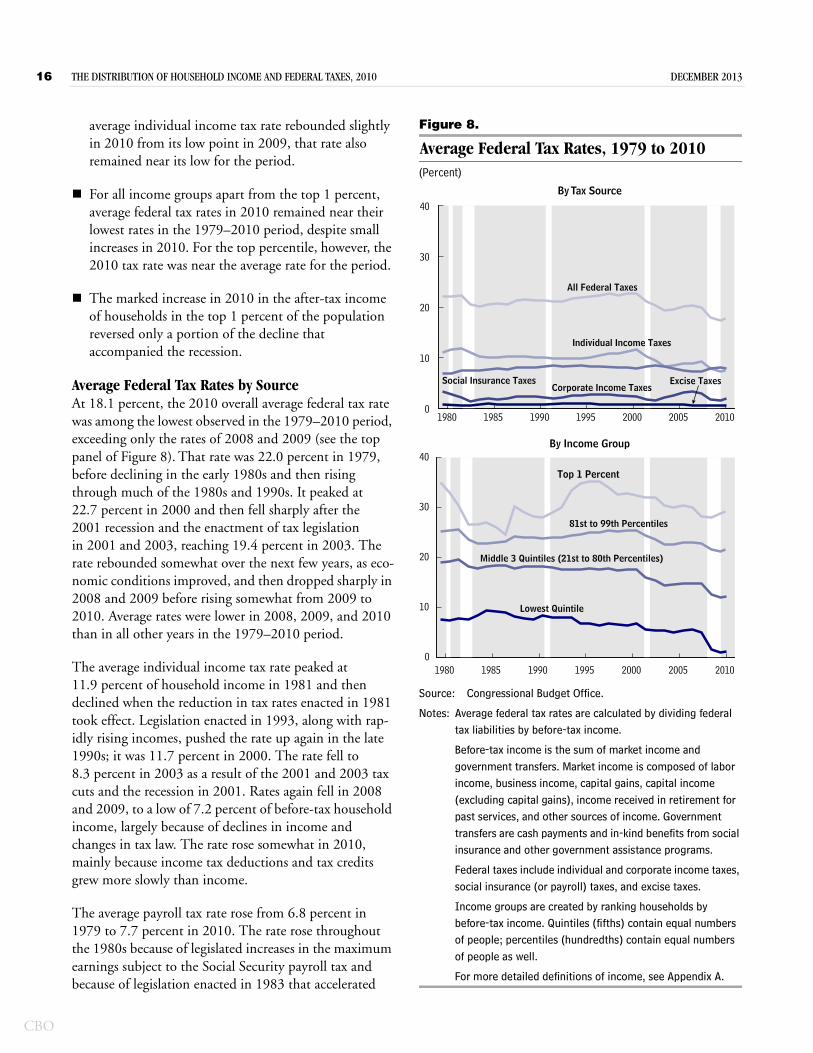
Average Federal Tax Rates by SourceAt 18.1 percent, the 2010 overall average federal tax rate was among the lowest observed in the 1979–2010 period, exceeding only the rates of 2008 and 2009 (see the top panel of Figure 8). That rate was 22.0 percent in 1979, before declining in the early 1980s and then rising through much of the 1980s and 1990s. It peaked at 22.7 percent in 2000 and then fell sharply after the 2001 recession and the enactment of tax legislation in 2001 and 2003, reaching 19.4 percent in 2003. The rate rebounded somewhat over the next few years, as eco-nomic conditions improved, and then dropped sharply in 2008 and 2009 before rising somewhat from 2009 to 2010. Average rates were lower in 2008, 2009, and 2010 than in all other years in the 1979–2010 period.
The average individual income tax rate peaked at 11.9 percent of household income in 1981 and then declined when the reduction in tax rates enacted in 1981 took effect. Legislation enacted in 1993, along with rap-idly rising incomes, pushed the rate up again in the late 1990s; it was 11.7 percent in 2000. The rate fell to 8.3 percent in 2003 as a result of the 2001 and 2003 tax cuts and the recession in 2001. Rates again fell in 2008 and 2009, to a low of 7.2 percent of before-tax household income, largely because of declines in income and changes in tax law. The rate rose somewhat in 2010, mainly because income tax deductions and tax credits grew more slowly than income.
The average payroll tax rate rose from 6.8 percent in 1979 to 7.7 percent in 2010. The rate rose throughout the 1980s because of legislated increases in the maximum earnings subject to the Social Security payroll tax and because of legislation enacted in 1983 that accelerated
Figure 8.
Average Federal Tax Rates, 1979 to 2010(Percent)
Source: Congressional Budget Office.
Notes: Average federal tax rates are calculated by dividing federal tax liabilities by before-tax income.
Before-tax income is the sum of market income and government transfers. Market income is composed of labor income, business income, capital gains, capital income (excluding capital gains), income received in retirement for past services, and other sources of income. Government transfers are cash payments and in-kind benefits from social insurance and other government assistance programs.
Federal taxes include individual and corporate income taxes, social insurance (or payroll) taxes, and excise taxes.
Income groups are created by ranking households by before-tax income. Quintiles (fifths) contain equal numbers of people; percentiles (hundredths) contain equal numbers of people as well.
For more detailed definitions of income, see Appendix A.
0
10
20
30
40
1980 1985 1990 1995 2000 2005 2010
Excise TaxesSocial Insurance Taxes
Individual Income Taxes
Corporate Income Taxes
All Federal Taxes
By Tax Source
By Income Group
0
10
20
30
40
1980 1985 1990 1995 2000 2005 2010
Lowest Quintile
81st to 99th Percentiles
Top 1 Percent
Middle 3 Quintiles (21st to 80th Percentiles)
DECEMBER 2013 THE DISTRIBUTION OF HOUSEHOLD INCOME AND FEDERAL TAXES, 2010 17
previously scheduled increases in the Social Security pay-roll tax rate. Subsequent legislation in the early 1990s first increased and then eliminated the cap on earnings subject to the Hospital Insurance payroll tax (which is used to finance a portion of Medicare). The payroll tax rate declined in the late 1990s as labor income grew more slowly than other income sources and as earnings above the maximum subject to Social Security taxes grew more rapidly than earnings below that amount. The recession of 2001–2002 reversed those trends, causing the payroll tax rate to rise in the early 2000s. The payroll tax rate resumed its decline in the mid-2000s, as economic growth picked up, before rising in 2008 and 2009, when the recession caused nonlabor income to decline more sharply than labor income and caused wages to decline more for taxpayers with earnings above than below the maximum subject to Social Security taxes. Those trends reversed yet again in 2010, pushing down the average payroll tax rate.
Average Federal Tax Rates by Income GroupFor most income groups, the 2009 average federal tax rate was the lowest observed during the period from 1979 to 2010 (see the bottom panel of Figure 8). Those rates increased somewhat for all income groups in 2010, but they remained near their low points. The pattern in the intervening years is more varied, reflecting the interaction of numerous changes to tax law with changes in the composition and distribution of income.
For households in the lowest income group, the average rate fell from 7.5 percent in 1979 to 1.5 percent in 2010. Almost two-thirds of that decline came between 2007 and 2008, largely as a result of ARRA, which created the Making Work Pay tax credit and expanded the earned income tax credit and the child tax credit. The average rate for that group was lower in 2008, 2009, and 2010 than in any other year in the 1979–2010 period. Declines in earlier years were caused mainly by increases in the earned income tax credit, especially in the 1990s. Payroll tax rates rose steadily for households in the lowest income group, offsetting some of the decline in their individual income tax rate.
Households in the middle three income quintiles saw their average tax rates fall by 6.6 percentage points over the period, from 19.1 percent in 1979 to 12.5 percent in 2010. That decline was primarily attributable to a decline in individual income taxes. The average tax rate for the group fell somewhat in the early 1980s and then
fluctuated within a fairly narrow range throughout the 1980s and 1990s. Over the 2000–2003 period, the rate declined by 3.1 percentage points, reflecting numerous changes in law enacted in 2001 (notably the expansion of the child tax credit, reductions in tax rates, and increases in the standard deduction for married couples) that low-ered taxes for households in the middle quintiles. The average tax rate for those groups rose slightly over the 2003–2007 period before falling by 2.8 percentage points from 2007 to 2009 and then edging up in 2010. The average rate was lower in 2008, 2009, and 2010 than at any other time during the 1979–2010 period.
The average tax rate for households in the 81st to 99th percentiles of the income distribution also reached a low point in 2009—about 4 percentage points below that in 1979—before rising slightly in 2010. That rate fell in the early 1980s and then crept up over the rest of that decade and through the 1990s, so that by 2000 it was slightly above the 1979 rate. The rate fell by 2.9 percentage points between 2000 and 2003, rose modestly from 2003 to 2007, and then fell by another 1.7 percentage points from 2007 to 2009, before rising by 0.7 percentage points in 2010. The average rate was lower in 2008, 2009, and 2010 than at any other time in the 1979–2010 period.
In contrast, in 2010, the average tax rate for households in the top 1 percent of the before-tax income distribution was well above the low point it reached in the early 1980s. The average tax rate for those households fell in the early 1980s and then rose as a result of the enactment of the Tax Reform Act of 1986. The rate for that group then fell somewhat again in the latter half of the 1980s before rising in the 1990s. That climb reflected both the changes in law that boosted tax rates and the group’s rapidly increasing income, which caused their average tax rate to rise as more income was taxed in higher tax brackets. The tax rate for households in the top percentile declined after 2000, notably in 2003, when a reduction in the rate for the top tax bracket enacted in 2001 took effect and as further changes in law reduced tax rates on dividends and realized capital gains. The tax rate fell again in 2007, mostly because of declines in corporate income taxes, and then rose somewhat from 2007 to 2009, as sharp declines in capital gains income subjected a larger portion of the income of that group to the tax rates on other income. Their tax rate continued to rise in 2010 because of higher corporate income taxes, muted somewhat by declining rates for the individual income
CBO
18 THE DISTRIBUTION OF HOUSEHOLD INCOME AND FEDERAL TAXES, 2010 DECEMBER 2013
CBO
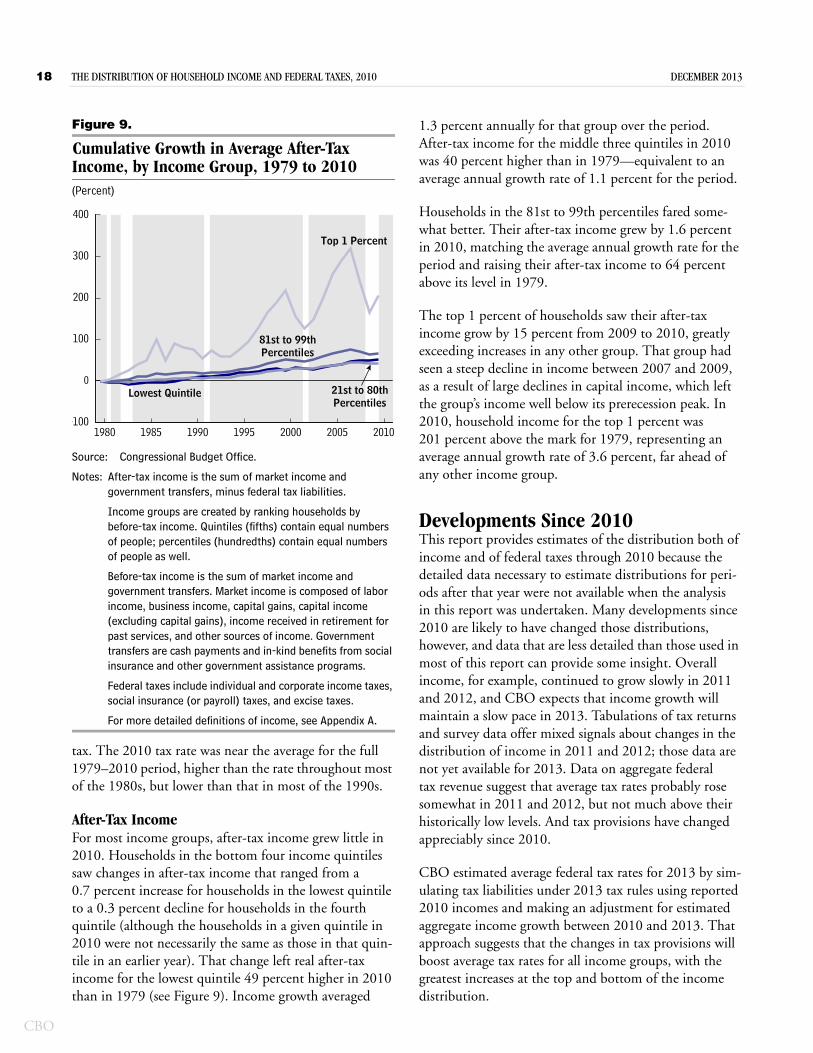
Figure 9.
Cumulative Growth in Average After-Tax Income, by Income Group, 1979 to 2010(Percent)
Source: Congressional Budget Office.
Notes: After-tax income is the sum of market income and government transfers, minus federal tax liabilities.
Income groups are created by ranking households by before-tax income. Quintiles (fifths) contain equal numbers of people; percentiles (hundredths) contain equal numbers of people as well.
Before-tax income is the sum of market income and government transfers. Market income is composed of labor income, business income, capital gains, capital income (excluding capital gains), income received in retirement for past services, and other sources of income. Government transfers are cash payments and in-kind benefits from social insurance and other government assistance programs.
Federal taxes include individual and corporate income taxes, social insurance (or payroll) taxes, and excise taxes.
For more detailed definitions of income, see Appendix A.
tax. The 2010 tax rate was near the average for the full 1979–2010 period, higher than the rate throughout most of the 1980s, but lower than that in most of the 1990s.
After-Tax IncomeFor most income groups, after-tax income grew little in 2010. Households in the bottom four income quintiles saw changes in after-tax income that ranged from a 0.7 percent increase for households in the lowest quintile to a 0.3 percent decline for households in the fourth quintile (although the households in a given quintile in 2010 were not necessarily the same as those in that quin-tile in an earlier year). That change left real after-tax income for the lowest quintile 49 percent higher in 2010 than in 1979 (see Figure 9). Income growth averaged
-100
0
100
200
300
400
1980 1985 1990 1995 2000 2005 2010
Lowest Quintile
81st to 99thPercentiles
Top 1 Percent
21st to 80thPercentiles
1.3 percent annually for that group over the period. After-tax income for the middle three quintiles in 2010 was 40 percent higher than in 1979—equivalent to an average annual growth rate of 1.1 percent for the period.
Households in the 81st to 99th percentiles fared some-what better. Their after-tax income grew by 1.6 percent in 2010, matching the average annual growth rate for the period and raising their after-tax income to 64 percent above its level in 1979.
The top 1 percent of households saw their after-tax income grow by 15 percent from 2009 to 2010, greatly exceeding increases in any other group. That group had seen a steep decline in income between 2007 and 2009, as a result of large declines in capital income, which left the group’s income well below its prerecession peak. In 2010, household income for the top 1 percent was 201 percent above the mark for 1979, representing an average annual growth rate of 3.6 percent, far ahead of any other income group.
Developments Since 2010This report provides estimates of the distribution both of income and of federal taxes through 2010 because the detailed data necessary to estimate distributions for peri-ods after that year were not available when the analysis in this report was undertaken. Many developments since 2010 are likely to have changed those distributions, however, and data that are less detailed than those used in most of this report can provide some insight. Overall income, for example, continued to grow slowly in 2011 and 2012, and CBO expects that income growth will maintain a slow pace in 2013. Tabulations of tax returns and survey data offer mixed signals about changes in the distribution of income in 2011 and 2012; those data are not yet available for 2013. Data on aggregate federal tax revenue suggest that average tax rates probably rose somewhat in 2011 and 2012, but not much above their historically low levels. And tax provisions have changed appreciably since 2010.
CBO estimated average federal tax rates for 2013 by sim-ulating tax liabilities under 2013 tax rules using reported 2010 incomes and making an adjustment for estimated aggregate income growth between 2010 and 2013. That approach suggests that the changes in tax provisions will boost average tax rates for all income groups, with the greatest increases at the top and bottom of the income distribution.
DECEMBER 2013 THE DISTRIBUTION OF HOUSEHOLD INCOME AND FEDERAL TAXES, 2010 19
Overall Income GrowthThe U.S. economy expanded modestly in 2011 and 2012, continuing the slow recovery since the recession ended in mid-2009. The Bureau of Economic Analysis (BEA) estimates that real per capita personal income grew by 2.8 percent in 2011 and by 1.6 percent in 2012, leav-ing that income measure below its 2008 peak.10 CBO expects that economic activity will continue to expand slowly in 2013 with growth in real gross domestic prod-uct (GDP) of just 1.4 percent, suggesting that sluggish growth in real per capita income will continue in 2013.
Changes in the Distribution of IncomeThe Census Bureau provides estimates, on the basis of data from the Current Population Survey (CPS), of what is called household money income. That income measure differs both from CBO’s measure of before-tax income and from BEA’s measure of personal income. The Census Bureau estimates that real mean household money income rose by 0.2 percent in both 2011 and 2012. The CPS data indicate that there was a decline in household income for all groups other than households in the top quintile.11 Consequently, income as measured in the CPS became more unequal, with the share of income going to households in the top quintile rising by 0.7 percentage points. That shift mostly occurred in 2011; the distribu-tion of income was little changed from 2011 to 2012.
The tabulations of individual income tax returns filed for 2011 and 2012 tell a different story. In contrast to the small increase in real mean household money income reported in the CPS, real mean adjusted gross income on tax returns declined by 1.4 percent from 2010 to 2011 but rose by 3.3 percent from 2011 to 2012, based on pre-liminary tabulations of tax returns filed in 2013.12 The distribution of that income was little changed between 2010 and 2011, but in 2012 the share of income going to the top percentile rose appreciably, again based on preliminary tabulations of tax returns filed in 2013. However, in anticipation of higher tax rates potentially
10. BEA’s measures of income are different from those used by CBO. Personal income, as defined by BEA, is the income that people receive in return for their provision of labor, land, and capital used in current production plus net current transfer payments that they receive from business and government.
11. See Carmen DeNavas-Wilt, Bernadette D. Proctor, and Jessica C. Smith, Income, Poverty, and Health Insurance Coverage in the United States: 2012 (Census Bureau, September 2013), Table A-2, http://go.usa.gov/WpJh.
taking effect in 2013, higher-income taxpayers probably shifted significant amounts of income from 2013 into 2012, thus providing a temporary boost to the reported income of higher-income taxpayers in 2012. That boost for 2012 would come at the expense of income to be reported in 2013 and would give the appearance of rapid growth in income in 2012 followed by slow growth or by a decline in 2013, with all else being equal.
Average Federal Tax Rates for 2011 and 2012Aggregate federal tax receipts can provide some indica-tion of average federal tax rates, although there is not a direct correlation. In particular, CBO’s measure of aver-age tax rates is based on tax liabilities accrued in a year, regardless of when those liabilities are paid; by contrast, federal receipts measure taxes paid to the government in a year, regardless of when those liabilities are incurred.
Total federal tax revenue grew slowly relative to the size of the economy in 2011 and 2012. Receipts in fiscal year 2010 were 15.1 percent of GDP, matching the mark set in 2009 for the smallest share of GDP since 1950. They rebounded slightly in fiscal year 2011, to 15.4 percent of GDP, and rose further in fiscal year 2012, to 15.8 percent of GDP. Those increases were largely attributable to indi-vidual income taxes, partially offset by declines in payroll taxes (mainly because of the temporary 2 percentage-point reduction in the statutory Social Security tax rate). Those figures imply that average tax rates probably remained quite low by historical standards in 2011 and 2012.
Changes in Tax Rules for 2013Tax rules in 2013 differ from those of 2010 in important ways:
Several provisions affecting high-income taxpayers, originally enacted in EGTRRA and JGTRRA, were allowed to expire in 2013;
12. Estimates for 2012 are based on a tabulation of tax returns processed through the end of July 2013 (see Internal Revenue Service, “Filing Season Statistics” [November 12, 2013], www.irs.gov/uac/Filing-Season-Statistics). Income is measured in the tabulations as adjusted gross income, but that measure omits several nontaxable sources of income—such as employment-based health insurance and payments from the Supplemental Nutrition Assistance Program—that CBO includes in its measure of before-tax income.
CBO
20 THE DISTRIBUTION OF HOUSEHOLD INCOME AND FEDERAL TAXES, 2010 DECEMBER 2013
CBO
The Making Work Pay tax credit expired at the end of 2010, and payroll tax rates that had been reduced in 2011 and 2012 were reset to their earlier levels in 2013; and
New taxes for high-income taxpayers enacted in the Affordable Care Act took effect in 2013.
Tax rules in 2010 reflected the changes made in EGTRRA and in JGTRRA. The tax rules enacted in those laws, originally scheduled to expire at the end of 2010, involved lower tax rates on ordinary income, lower tax rates on capital gains realizations and dividends, an expanded 15 percent tax bracket and larger standard deduction for married couples, a larger exemption from the alternative minimum tax, and a larger child tax credit. Several provisions of ARRA that held down taxes also were in effect in 2010 and originally scheduled to expire at the end of that year: the Making Work Pay tax credit, the American Opportunity Tax Credit (a refundable credit for postsecondary education expenses), a lower earnings threshold for the refundability of the child tax credit, and expansions to the earned income credit.
The Tax Relief, Unemployment Insurance Reauthoriza-tion, and Job Creation Act of 2010 extended the provi-sions of EGTRRA and JGTRRA through 2012. It also extended most of the credits enacted by ARRA for two years, although the Making Work Pay tax credit was allowed to expire. For 2011, the law provided a one-year reduction in the employee’s share of the Social Security payroll tax. That reduction—from 6.2 percent to 4.2 per-cent—was extended through 2012 by two subsequent laws, but it was not extended into 2013. The 2010 tax act also increased the exemption for the alternative minimum tax.
The American Taxpayer Relief Act of 2012, which was enacted in early January 2013, made permanent most of the major provisions of EGTRRA and JGTRRA—with some exceptions for higher-income taxpayers. Specifically, for taxable income in excess of $400,000 (individual filers) and $450,000 (married people filing jointly), the lower tax rates originally enacted in 2001 expired as scheduled and the top statutory tax rate of 39.6 percent was reinstated. The tax rate for long-term capital gains and dividends increased from 15 percent to 20 percent for those same high-income taxpayers, and the act reinstated limitations on the use of personal exemptions and itemized deductions for individual taxpayers whose adjusted gross income was above
$250,000 ($300,000 for joint filers). The act also perma-nently limited the reach of the alternative minimum tax and extended through 2017 the ARRA tax credits that were in effect in 2012. The law did not extend the payroll tax rate reduction.
The Affordable Care Act contained two new surtaxes on high-income taxpayers that also took effect in 2013. The Medicare payroll tax rate was increased by 0.9 percent for earnings above $200,000 for individual filers ($250,000 for joint filers). In addition, a new 3.8 percent surtax was imposed on the lesser of a taxpayer’s investment income (consisting of interest, dividends, capital gains, and cer-tain passive business activity) and total income over a threshold ($200,000 for individual filers and $250,000 for joint filers). The act also created new subsidies for the purchase of health insurance through exchanges and an excise tax on certain health insurance plans with high pre-miums; however, because those provisions take effect in 2014 and 2018, respectively, they are not considered here.
Average Federal Tax Rates Under 2013 Tax RulesCBO estimated the effects of the new tax provisions on average federal tax rates by simulating tax liabilities under 2013 tax rules using reported 2010 incomes and making an adjustment for estimated aggregate income growth between 2010 and 2013.13
Two important caveats apply to interpretation of the analysis. First, the analysis does not account for shifts in the distribution of income that might occur between 2010 and 2013; they will not be known for some time. The further recovery of the economy might result in uneven income growth, which could affect the distribu-tion both of income and of federal taxes. Additionally, taxpayers probably changed their behavior in various ways in response to the changes in tax rules in 2013. For example, higher-income taxpayers probably shifted income from 2013 to 2012 in anticipation of the sched-uled tax increases. Such shifts represent temporary
13. The analysis simulated taxes under 2013 tax rules by deflating tax parameters in 2013 by the estimated nominal rate of per capita income growth between 2010 and 2013 (approximately 7 percent). CBO then applied those adjusted tax parameters to 2010 incomes. The observed changes in tax rates thus capture both the effects of changes in tax law and a small amount of “bracket creep” to the extent that incomes were estimated to grow faster than inflation-indexed tax parameters.
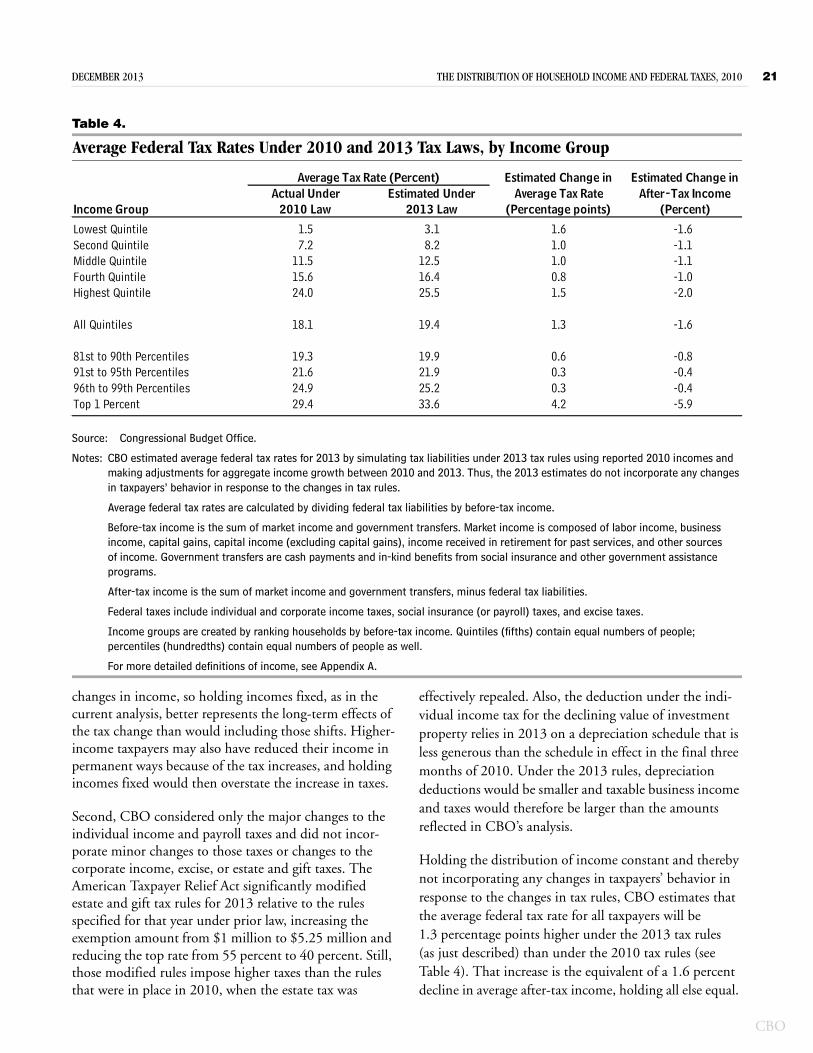
DECEMBER 2013 THE DISTRIBUTION OF HOUSEHOLD INCOME AND FEDERAL TAXES, 2010 21
Table 4.
Average Federal Tax Rates Under 2010 and 2013 Tax Laws, by Income Group
Source: Congressional Budget Office.
Notes: CBO estimated average federal tax rates for 2013 by simulating tax liabilities under 2013 tax rules using reported 2010 incomes and making adjustments for aggregate income growth between 2010 and 2013. Thus, the 2013 estimates do not incorporate any changes in taxpayers’ behavior in response to the changes in tax rules.
Average federal tax rates are calculated by dividing federal tax liabilities by before-tax income.
Before-tax income is the sum of market income and government transfers. Market income is composed of labor income, business income, capital gains, capital income (excluding capital gains), income received in retirement for past services, and other sources of income. Government transfers are cash payments and in-kind benefits from social insurance and other government assistance programs.
After-tax income is the sum of market income and government transfers, minus federal tax liabilities.
Federal taxes include individual and corporate income taxes, social insurance (or payroll) taxes, and excise taxes.
Income groups are created by ranking households by before-tax income. Quintiles (fifths) contain equal numbers of people; percentiles (hundredths) contain equal numbers of people as well.
For more detailed definitions of income, see Appendix A.
Income Group
Lowest Quintile 1.5 3.1 1.6 -1.6Second Quintile 7.2 8.2 1.0 -1.1Middle Quintile 11.5 12.5 1.0 -1.1Fourth Quintile 15.6 16.4 0.8 -1.0Highest Quintile 24.0 25.5 1.5 -2.0
All Quintiles 18.1 19.4 1.3 -1.6
81st to 90th Percentiles 19.3 19.9 0.6 -0.891st to 95th Percentiles 21.6 21.9 0.3 -0.496th to 99th Percentiles 24.9 25.2 0.3 -0.4Top 1 Percent 29.4 33.6 4.2 -5.9
(Percentage points) (Percent)2013 Law2010 LawActual Under Estimated Under Average Tax Rate
Estimated Change inAfter-Tax Income
Estimated Change inAverage Tax Rate (Percent)
changes in income, so holding incomes fixed, as in the current analysis, better represents the long-term effects of the tax change than would including those shifts. Higher-income taxpayers may also have reduced their income in permanent ways because of the tax increases, and holding incomes fixed would then overstate the increase in taxes.
Second, CBO considered only the major changes to the individual income and payroll taxes and did not incor-porate minor changes to those taxes or changes to the corporate income, excise, or estate and gift taxes. The American Taxpayer Relief Act significantly modified estate and gift tax rules for 2013 relative to the rules specified for that year under prior law, increasing the exemption amount from $1 million to $5.25 million and reducing the top rate from 55 percent to 40 percent. Still, those modified rules impose higher taxes than the rules that were in place in 2010, when the estate tax was
effectively repealed. Also, the deduction under the indi-vidual income tax for the declining value of investment property relies in 2013 on a depreciation schedule that is less generous than the schedule in effect in the final three months of 2010. Under the 2013 rules, depreciation deductions would be smaller and taxable business income and taxes would therefore be larger than the amounts reflected in CBO’s analysis.
Holding the distribution of income constant and thereby not incorporating any changes in taxpayers’ behavior in response to the changes in tax rules, CBO estimates that the average federal tax rate for all taxpayers will be 1.3 percentage points higher under the 2013 tax rules (as just described) than under the 2010 tax rules (see Table 4). That increase is the equivalent of a 1.6 percent decline in average after-tax income, holding all else equal.
CBO
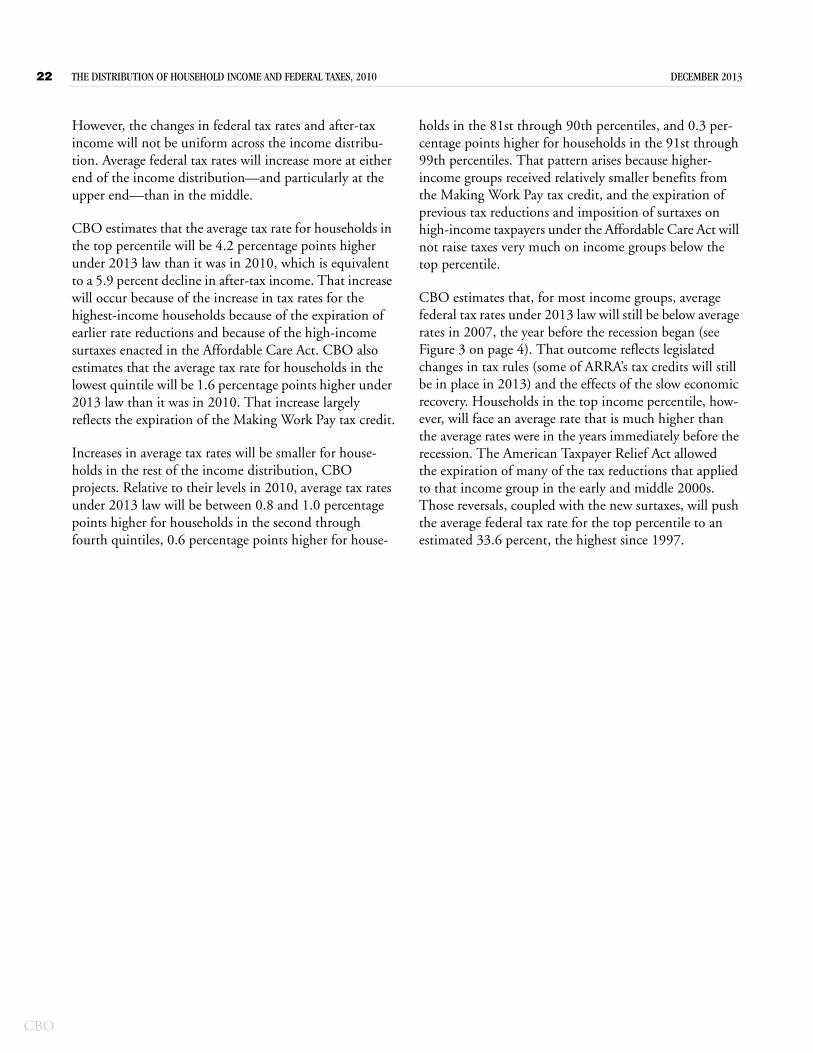
22 THE DISTRIBUTION OF HOUSEHOLD INCOME AND FEDERAL TAXES, 2010 DECEMBER 2013
CBO
However, the changes in federal tax rates and after-tax income will not be uniform across the income distribu-tion. Average federal tax rates will increase more at either end of the income distribution—and particularly at the upper end—than in the middle.
CBO estimates that the average tax rate for households in the top percentile will be 4.2 percentage points higher under 2013 law than it was in 2010, which is equivalent to a 5.9 percent decline in after-tax income. That increase will occur because of the increase in tax rates for the highest-income households because of the expiration of earlier rate reductions and because of the high-income surtaxes enacted in the Affordable Care Act. CBO also estimates that the average tax rate for households in the lowest quintile will be 1.6 percentage points higher under 2013 law than it was in 2010. That increase largely reflects the expiration of the Making Work Pay tax credit.
Increases in average tax rates will be smaller for house-holds in the rest of the income distribution, CBO projects. Relative to their levels in 2010, average tax rates under 2013 law will be between 0.8 and 1.0 percentage points higher for households in the second through fourth quintiles, 0.6 percentage points higher for house-
holds in the 81st through 90th percentiles, and 0.3 per-centage points higher for households in the 91st through 99th percentiles. That pattern arises because higher-income groups received relatively smaller benefits from the Making Work Pay tax credit, and the expiration of previous tax reductions and imposition of surtaxes on high-income taxpayers under the Affordable Care Act will not raise taxes very much on income groups below the top percentile.
CBO estimates that, for most income groups, average federal tax rates under 2013 law will still be below average rates in 2007, the year before the recession began (see Figure 3 on page 4). That outcome reflects legislated changes in tax rules (some of ARRA’s tax credits will still be in place in 2013) and the effects of the slow economic recovery. Households in the top income percentile, how-ever, will face an average rate that is much higher than the average rates were in the years immediately before the recession. The American Taxpayer Relief Act allowed the expiration of many of the tax reductions that applied to that income group in the early and middle 2000s. Those reversals, coupled with the new surtaxes, will push the average federal tax rate for the top percentile to an estimated 33.6 percent, the highest since 1997.
Appendix A:Methodology
When it estimates distributions of household income and federal taxes, the Congressional Budget Office (CBO) draws on data from various sources and makes judgments about the best way to use those data.
Data Sources on Household Income Information on household income for this analysis came from two primary sources: the Internal Revenue Service’s Statistics of Income (SOI) and the Census Bureau’s Current Population Survey (CPS). The core data came from the SOI, a nationally representative sample of individual income tax returns that has increased from roughly 90,000 returns around 1980 to more than 300,000 returns in recent years. CBO used the full Individual Income Tax file, which is more detailed than the public-use version of the file. The agency supple-mented those data with data from the CPS’s Annual Social and Economic Supplement; those data identify demographic characteristics and income for a large sample of households.
Both the SOI and the CPS lack important information needed for estimating and comparing after-tax household income over time. The SOI does not include information about people who do not file federal tax returns, and it does not report all income from government cash transfer programs. It also offers no information on the receipt of in-kind transfers and benefits, and it is organized by tax filing unit rather than by household. The CPS lacks detailed information on high-income households, it does not report capital gains, it underreports other income from capital, and it lacks information on the deductions and adjustments necessary to compute taxes.
Together, however, the two sources can form a relatively complete picture. To overcome limitations in each source
of data, CBO statistically matched SOI records to corresponding CPS records on the basis of demographic characteristics and income. Each pairing resulted in a new record that took on the demographic characteristics of the CPS record and the income reported in the SOI. (Some types of income—certain transfers and in-kind benefits, for example—appear only in the CPS; their values were drawn directly from the CPS.) Because some households are not required to file tax returns, the SOI does not have data on every household in the nation. To create a sample that was representative of the entire population, once all SOI records were matched to CPS records, the remaining CPS records were recorded as nonfiling households and their income values were taken directly from the CPS. CBO then estimated the tax liability for each record.
Allocation of Taxes to HouseholdsCBO allocated individual income taxes and the employee’s share of payroll taxes to the households paying those taxes directly. The agency also allocated the employer’s share of payroll taxes to employees because employers appear to pass on their share of payroll taxes to employees by paying lower wages than they would otherwise pay.1 Therefore, CBO also added the employer’s share of payroll taxes to households’ earnings in calculating before-tax income.
CBO allocated excise taxes to households according to their consumption of taxed goods and services (such as gasoline, tobacco, and alcohol). Excise taxes on intermediate goods, which are paid by businesses, were
1. That allocation reflects a consensus among economists. See Don Fullerton and Gilbert E. Metcalf, “Tax Incidence,” in Alan J. Auerbach and Martin Feldstein, eds., Handbook of Public Economics (Elsevier, 2002), vol. 4, pp. 1787–1872.
CBO
24 THE DISTRIBUTION OF HOUSEHOLD INCOME AND FEDERAL TAXES, 2010 DECEMBER 2013
CBO
attributed to households in proportion to their overall consumption. CBO assumed that each household’s spending on taxed goods and services was the same as that reported in the Bureau of Labor Statistics’ Consumer Expenditure Survey for a household with comparable income and other characteristics.
Far less agreement exists about how to allocate corporate income taxes (and taxes on capital income generally). In this analysis, CBO allocated 75 percent of corporate income taxes to owners of capital in proportion to their income from interest, dividends, adjusted capital gains, and rents.2 The agency used capital gains scaled to their long-term historical level, given the size of the economy and the tax rate that applies to them, rather than actual capital gains, so as to smooth out large year-to-year variations in the total amount of gains realized. CBO allocated the remaining 25 percent of corporate income taxes to workers in proportion to their labor income.
Measures of IncomeThis analysis uses three measures of household income: market income; market income plus government trans-fers (before-tax income); and market income plus government transfers, minus federal tax liabilities (after-tax income).
Market income includes the following components:
Labor Income. Cash wages and salaries, including amounts allocated by employees to 401(k) plans; employment-based health insurance premiums; the employer’s share of Social Security, Medicare, and federal unemployment insurance payroll taxes; and the share of corporate income taxes borne by workers.
Business Income. Net income from businesses and farms operated solely by their owners, partnership income, and income from S corporations.
Capital Gains. Profits realized from the sale of assets, excluding increases in the value of assets that have not been realized through sales.3
Capital Income Excluding Capital Gains. Taxable and tax-exempt interest, dividends paid by corporations
2. For a more detailed discussion of CBO’s methodology for allocating corporate taxes, see Congressional Budget Office, The Distribution of Household Income and Federal Taxes, 2008 and 2009 (July 2012), www.cbo.gov/publication/43373.
(but not dividends paid by S corporations, which are considered part of business income), positive rental income, and the share of corporate income taxes borne by owners of capital.
Other Income. Income received in retirement for past services or from other sources.
Government transfers consist of cash payments from Social Security, unemployment insurance, Supplemental Security Income, Temporary Assistance for Needy Fami-lies (and its predecessor, Aid to Families with Dependent Children), veterans’ programs, workers’ compensation, and state and local government assistance programs. Such transfers also include the value of in-kind benefits: Supplemental Nutrition Assistance Program vouchers (popularly known as food stamps); school lunches and breakfasts; housing assistance; and energy assistance and benefits provided by Medicare, Medicaid, and the Chil-dren’s Health Insurance Program. Health care benefits are measured using the Census Bureau’s estimates of the aver-age cost to the government of providing those benefits.4
Adjusting Income for Differences Among HouseholdsCBO used the household as the unit of analysis for this report. A household consists of the people who share a housing unit, regardless of their relationship to one another. The presumption is that households make joint
3. CBO measures capital gains when the income is realized, partly based on the availability of data and partly to use the same accounting framework to measure income and taxes (which are levied on realized capital gains). Various researchers have measured capital gains as they accrue, on the basis of assets held by households at different income levels, but those researchers have reached disparate conclusions about the effect of accrued capital gains on levels and trends in income inequality, depending in large part on their assumptions about the rate of return on assets. See, for example, Timothy M. Smeeding and Jeffrey P. Thompson, Recent Trends in the Distribution of Income: Labor, Wealth and More Complete Measures of Well Being, Working Paper 225 (University of Massachusetts, June 2010), http://tinyurl.com/qd8qrxx; and Philip Armour, Richard V. Burkhauser, and Jeff Larrimore, Levels and Trends in United States Income and Its Distribution: A Crosswalk From Market Income Towards a Comprehensive Haig-Simons Income Approach, Working Paper 19110 (National Bureau of Economic Research, June 2013), www.nber.org/papers/w19110.
4. For more details on the method for valuing health care benefits, see Congressional Budget Office, The Distribution of Household Income and Federal Taxes, 2008 and 2009 (July 2012), www.cbo.gov/publication/43373.
APPENDIX A THE DISTRIBUTION OF HOUSEHOLD INCOME AND FEDERAL TAXES, 2010 25
economic decisions, although that might not be true in all cases (such as in a group house, for example). A house-hold can consist of more than one taxpaying unit, such as a married couple living with an adult child.
Households with identical income also differ in ways that bear on their economic status. A larger household gener-ally needs more income to support a given standard of living than a smaller one does. However, economies of scale in some types of consumption—housing, in partic-ular—can mean that two people generally do not need twice the income to live as well as one person who lives alone. Therefore, to rank households by their standard of living, it is probably appropriate to divide household income by an adjustment factor that is between 1 (which would result only in household income and would not capture the greater needs of larger households) and the number of people in the household (which would pro-duce household income per capita and would not capture the benefits of shared consumption). CBO chose to adjust for household size by dividing household income by the square root of the number of people in the house-hold, counting adults and children equally.5 Households were then ranked by adjusted income and grouped into quintiles of equal numbers of people. Because household sizes vary, different quintiles generally have slightly different numbers of households.
Adjusting the income for other differences in circum-stances that affect a household’s standard of living also could be desirable. For example, the prices of goods and
services vary geographically, and households can incur different costs associated with working—for commuting and child care expenses, for example—depending on how many members are employed. CBO did not adjust for those additional differences.
Supplemental data tables, available online, show house-hold income and average federal tax rates for three types of households: those with members under age 18 (house-holds with children), those headed by a person age 65 or older and with no members under age 18 (elderly child-less households), and all others (nonelderly childless households).6 The tables group households into quintiles by position in the income distribution across the full population, not by distribution within each type of household, so each type of household is not evenly spread across the income quintiles.
5. That adjustment implies that each additional person increases a household’s needs but does so at a decreasing rate. For example, a household consisting of a married couple with two children and an income of $80,000 would have an adjusted income of $40,000 ($80,000/√4) and would have the equivalent economic ranking of a single person with an income of $40,000 or of a childless married couple with an income of $56,600 ($56,600/√2 is almost $40,000). See Constance F. Citro and Robert T. Michael, eds., Measuring Poverty: A New Approach (National Research Council, 1995), www.nap.edu/catalog.php?record_id=4759.
6. The tables present estimates for the 1979–2010 period. See Congressional Budget Office, The Distribution of Household Income and Federal Taxes, 2010 (December 2013), www.cbo.gov/publication/44604.
CBO

Appendix B:Variation Within Income Groups
This report analyzes average income and average federal tax rates for various subgroups of the U.S. population. Within each subgroup there are substantial variations, both in income and in average federal tax rates, for several reasons. Almost all of the differences in average payroll tax rates result from differences among households in the share of income from earnings, for example, but the variation in average individual income tax rates is affected both by the composition of income and by other factors, such as family structure, preferences in the tax code, and the progressive rate structure.
Before-Tax IncomeFor this study, the Congressional Budget Office (CBO) divided U.S. households into five groups on the basis of income, adjusted for household size. Each quintile (one-fifth of the population) consists of more than 25 million households and covers a fairly wide range of income and a smaller but still considerable range of income adjusted for household size (see Table B-1).1 For households in the lowest income quintile, the size-adjusted annual income is between zero and $23,200. A one-person household with income within that range would fall into the lowest quintile, as would a four-person household with income below $46,500. The second and middle quintiles cover narrower ranges of size-adjusted income, and the range of the fourth quintile is roughly equal in size to that of the lowest income quintile. The ranges of income represented by the subgroups of the top quintile are much larger, however. And the before-tax income of the top percen-tile—more than 1 million households—ranges from $306,900 to hundreds of millions of dollars.
1. Appendix A describes CBO’s method for adjusting for household size.
Average Federal Tax RatesDifferent households within each quintile can have dif-ferent average federal tax rates for any of several reasons, including the size of the household, the composition of income, and the amount claimed in tax-deductible expenses. To examine the variation of federal tax rates within quintiles, CBO first calculated the average tax rate for each household in its sample by dividing each household’s federal tax liability by its income. CBO then tabulated the range of average individual income tax rates and payroll tax rates for households in each quintile in 2010. A comparable tabulation for corporate income tax rates or excise tax rates would not be meaningful because CBO’s methods for allocating those taxes to households were not designed to capture the full range of variation in them.2
Payroll Tax RatesFor most workers, payroll taxes constitute a flat percentage of earnings (income from wages and self-employment). Therefore, most of the variation in average payroll tax rates arises because households derive different shares of their income from earnings. However, some variation in payroll taxes occurs because some workers have earnings above the maximum taxable amount for Social Security that are therefore not subject to the Social Security tax and some employed people are exempt from participating in Social Security or Medicare and therefore do not pay those taxes.
2. CBO allocated corporate income taxes in proportion to households’ income from labor and capital, and the agency allocated excise taxes by assuming that each household’s spending on taxed goods and services was the same as that reported in the Bureau of Labor Statistics’ Consumer Expenditure Survey for a household with comparable income and other characteristics. In both cases, CBO’s method allows for no additional variation in the amount of such taxes from one household to another.
CBO
28 THE DISTRIBUTION OF HOUSEHOLD INCOME AND FEDERAL TAXES, 2010 DECEMBER 2013
CBO
Table B-1.
Minimum Before-Tax Income for Different Income Groups, by Household Size, 2010(Dollars)
Source: Congressional Budget Office.
Notes: Before-tax income is the sum of market income and government transfers. Market income is composed of labor income, business income, capital gains, capital income (excluding capital gains), income received in retirement for past services, and other sources of income. Government transfers are cash payments and in-kind benefits from social insurance and other government assistance programs.
Income groups are created by ranking households by before-tax income. Quintiles (fifths) contain equal numbers of people; percentiles (hundredths) contain equal numbers of people as well.
For more detailed definitions of income, see Appendix A.
Household Size
One-Person Household 0 23,200 35,700 51,100 75,700 75,700 103,500 139,100 306,900Two-Person Household 0 32,900 50,500 72,300 107,100 107,100 146,400 196,700 434,000Four-Person Household 0 46,500 71,400 102,200 151,500 151,500 207,100 278,200 613,800
Memorandum:Income Adjusted forHousehold Size 0 23,200 35,700 51,100 75,700 75,700 103,500 139,100 306,900
Second Middle Fourth HighestPercentiles Within the Highest Quintile
91st to 95th 96th to 99th Top 1Lowest 81st to 90thPercentiles PercentQuintile Quintile Quintile Percentiles PercentilesQuintile Quintile
CBO examined the distribution of payroll tax rates in each quintile by ranking households from the lowest to the highest payroll tax rate. Within the lowest income quintile, the median rate is 8.8 percent—that is, half of all households have payroll tax rates above 8.8 percent and half have rates below (see the top panel of Figure B-1). In that group, the average payroll tax rate at the 10th percentile of the payroll tax distribution is zero, because at least 10 percent of households in the lowest quintile have no earnings and thus no payroll tax liability. The rate at the 90th percentile of the distribution is a lit-tle above 14 percent—about the rate for a household whose income is from earnings alone.3 Because most households in the lowest quintile have some income from earnings and some from other sources, their payroll tax rates fall between zero and 14 percent. Within the lowest quintile, the average payroll tax rate at the 25th percentile is 2 percent and the rate at the 75th percentile is 13 percent.
3. For a household with income only from earnings, CBO would add the employer’s share of payroll taxes to those earnings, raising that amount by 7.65 percent. That household’s payroll taxes would equal 15.3 percent of cash wages (after subtracting the employer’s share of the payroll tax), for an average rate of 14.2 percent (15.3 divided by 1.0765).
In the other income quintiles, the variation in average payroll tax rates between the 10th and 90th percentiles is about the same as in the lowest quintile. In each quintile, a household in the 10th percentile of the rate distribution has an average payroll tax rate near zero, implying no earnings, and a household in the 90th percentile has a payroll tax rate between 13 percent and 14 percent, implying that the household’s income is almost exclu-sively from earnings. But the payroll tax rate at the 25th percentile is higher for the fourth quintile and the highest quintile because fewer households in those groups have very low shares of income represented by earnings.
Individual Income Tax RatesThe individual income tax is more complex than the pay-roll tax, and average tax rates within a quintile can vary for any of several reasons, among them the following:
Income Composition. Some forms of income, such as most transfer payments and compensation in the form of employment-based health insurance, are exempt from taxation. Some other forms of income, such as dividends and capital gains, are taxed at lower rates than ordinary income.
APPENDIX B THE DISTRIBUTION OF HOUSEHOLD INCOME AND FEDERAL TAXES, 2010 29
Figure B-1.
Distribution of Average Federal Tax Rates, by Income Group, 2010(Percent)
Source: Congressional Budget Office.
Notes: Average federal tax rates are calculated by dividing federal tax liabilities by before-tax income.
Before-tax income is the sum of market income and government transfers. Market income is composed of labor income, business income, capital gains, capital income (excluding capital gains), income received in retirement for past services, and other sources of income. Government transfers are cash payments and in-kind benefits from social insurance and other government assistance programs.
Federal taxes include individual and corporate income taxes, social insurance (or payroll) taxes, and excise taxes.
Income groups are created by ranking households by before-tax income. Quintiles (fifths) contain equal numbers of people.
For more detailed definitions of income, see Appendix A.
ÿ ÿ ÿ ÿ ÿ
Lowest Quintile Second Quintile Middle Quintile Fourth Quintile Highest Quintile-30
-20
-10
0
10
20
10th Percentile
90th Percentile
ÿ
ÿ
ÿÿ
ÿ
Lowest Quintile Second Quintile Middle Quintile Fourth Quintile Highest Quintile-30
-20
-10
0
10
20
25th to 50thPercentiles
50th to 75thPercentiles
Payroll Tax Rates
Individual Income Tax Rates
Median
CBO
30 THE DISTRIBUTION OF HOUSEHOLD INCOME AND FEDERAL TAXES, 2010 DECEMBER 2013
CBO
Tax Preferences. In many cases, taxpayers can subtract state and local taxes, contributions to charity, mortgage interest on owner-occupied housing, and certain other expenses from their taxable income. The tax rate can be much lower for people with large deductions than it is for people who have about the same income but smaller deductions.
Family Structure. The tax system makes adjustments for family size, through such provisions as personal exemptions and separate tax schedules for single, married, and head-of-household filers. Eligibility for the earned income tax credit and child tax credit depend on the presence of children (although taxpayers without children who meet certain age requirements can qualify for a small earned income tax credit).
Amount of Income. Because individual income tax rates generally increase with income, households with income near the top of the range for a given quintile will tend to have higher tax rates than those with income near the bottom of that range.
CBO examined the distribution of income tax rates in each quintile by ranking households from the lowest to the highest income tax rate. There is more variation in income tax rates than in payroll tax rates in the lowest income quintile, less variation in the middle three quin-tiles, and about the same amount of variation in the highest quintile.
Within the lowest income quintile, the median individual income tax rate is -5 percent (see the bottom panel of Figure B-1).4 A span of 24 percentage points separates the 10th from the 90th percentile of the rate distribution, with the average rate at the 10th percentile equal to -24 percent and the average rate at the 90th percentile equal to zero. The difference in rates between the 25th and 75th percentiles is 15 percentage points. The earned income tax credit and other refundable credits account
4. A negative rate indicates that refundable tax credits exceed income tax liability before those credits are applied.
for most of the variation in individual income tax rates: Households with children and low earnings are eligible for earned income tax credits (which often are larger than the regular income taxes owed), whereas other low-income households are either not eligible for those credits or are eligible for much smaller credits (because they have no earnings or have no qualifying children) but still owe no income tax.
The variation in average tax rates is much smaller in the second income quintile, where there is a separation of 13 percentage points between the 10th and 90th percen-tiles of the average rate distribution and a separation of 4 percentage points between the 25th and 75th percen-tiles. Eligibility for refundable credits is still a significant factor affecting income tax rates in the second quintile, so large numbers of households face negative average rates. There is even less variation in tax rates in the mid-dle and fourth quintiles: The 10th and 90th percentiles are separated by 9 percentage points, and the 25th and 75th percentiles are separated by just 4 percentage points. In those income groups, eligibility for credits is much less important; most of the difference in rates arises from different shares of income stemming from taxable sources and differences in the amounts taken in itemized deductions.
There is more variation in the highest income quintile—in which 12 percentage points separate the 10th and 90th percentiles, and 6 percentage points separate the 25th and 75th percentiles—than there is in the middle and fourth quintiles. The variation in the highest income quintile is affected by two additional factors. First, the progressive rate schedule increases the variation in tax rates in the top quintile because of the wide range of incomes represented in that group. (The minimum household income for that group is $75,700, but the highest incomes are in the hundreds of millions of dol-lars.) Second, the tax rates some households in the top quintile face are lower than those faced by others because more of their income is in the form of dividends and capital gains, which are taxed at lower rates than ordinary income.
DECEMBER 2013 THE DISTRIBUTION OF HOUSEHOLD INCOME AND FEDERAL TAXES, 2010 31
CBO
List of Tables and Figures
Tables
1. Distribution of Before- and After-Tax Income, by Income Group, 2009 and 2010 8
2. Average Federal Tax Rates, by Income Group, 2009 and 2010 9
3. Shares of Federal Taxes, by Income Group, 2009 and 2010 13
4. Average Federal Tax Rates Under 2010 and 2013 Tax Laws, by Income Group 21
B-1. Minimum Before-Tax Income for Different Income Groups, by Household Size, 2010 28
Figures
1. Average Federal Tax Rates, by Income Group, 2010 2
2. Change in Before-Tax Income, by Income Group, 2009 to 2010 3
3. Average Federal Tax Rates, by Income Group, 1979 to 2010 and Under 2013 Law 4
4. Average Federal Tax Rates, by Income Group, 2009 and 2010 10
5. Shares of Before-Tax Income and Federal Taxes, by Income Group, 2010 11
6. Average Federal Tax Rates, by Income Group and Tax Source, 2010 12
7. Shares of Before- and After-Tax Income, by Income Group, 2010 15
8. Average Federal Tax Rates, 1979 to 2010 16
9. Cumulative Growth in Average After-Tax Income, by Income Group, 1979 to 2010 18
B-1. Distribution of Average Federal Tax Rates, by Income Group, 2010 29
32 THE DISTRIBUTION OF HOUSEHOLD INCOME AND FEDERAL TAXES, 2010 DECEMBER 2013
CBO
About This Document
This Congressional Budget Office (CBO) report was prepared at the request of the Chairman of the Senate Finance Committee. In keeping with CBO’s mandate to provide objective, impartial analysis, the report makes no recommendations.
Edward Harris of CBO’s Tax Analysis Division wrote the report, with guidance from Frank Sammartino (formerly of CBO) and David Weiner. William Carrington, Molly Dahl, and Kevin Perese of CBO offered comments.
Several external reviewers also provided comments: Jared Bernstein of the Center on Budget and Policy Priorities, Alex M. Brill of the American Enterprise Institute, and Sara LaLumia of Williams College. The assistance of external reviewers implies no responsibility for the final product, which rests solely with CBO.
Kate Kelly edited the report, and Maureen Costantino and Jeanine Rees prepared it for publication. An electronic version is available on CBO’s website (www.cbo.gov/publication/44604).
Douglas W. Elmendorf Director
December 2013