Embed Size (px)
Citation preview


The distinctiveness of our insurance strategy lies in our belief in improving the local community and the society at large. We constantly make an effort to feel the customers’ pulse, to understand their true circumstances, and maximize the benefits through providing them with trusted insurance policies, prompt settlement of insurance claims and other technical support services.
As a co-operative community and the only co-operative insurance company we are mindful in contributing to the overall social advancement through redistribution of a large share of our wealth within our society by way of taxes, payments to suppliers and business partners, contributions for CSR projects and payments to our employees.
Our products are mainly created with a focus on the rural and urban low and middle-income families island wide, reached via our widespread delivery network which we continue to grow by leveraging on technologies for faster and efficient service delivery.
It is this progressive approach that has set us apart from the competitors as a people’s company that is committed towards creating a sustainable society thereby becoming the nation’s voice in progressive insurance.

ANNUAL REPORT - 2018CO-OPERATIVE INSURANCE COMPANY2
Content
INTRODUCTION 04-13Vision and Mission 04Who we are 05Introduction to this Report 07Materiality Assessment 09History & Milestones 10Financial Highlights / KPIs 12
OUR PERFORMANCE IN 2018 Chairman’s Message 14Managing Director’s Review 20
ABOUT OUR COMPANYBoard of Directors - Co-operative Insurance Company Limited 26Board of Directors - Cooplife Insurance Company 30Corporate Management Team - Co-operative Insurance Company Limited 33Management Team - Cooplife Insurance Limited 35Senior Management Team - Co-operative Insurance Company Limited 37Branch Management 39Our Business Model 42Contribution to Sustainable Development 44Our Products and Services 46Our Channels & Branch Network 47Changes to our Material Capitals in 2018 49The Co-operative Insurance Training Academy 51
Management Discussion & Analysis 54-82Stakeholder Engagement & Social Capital 54Our Growth Strategy & Resource Allocation 58External Environment 62Operational Review 64
Managing our Capitals Financial Capital 67Manufactured Capital 72Intellectual Capital 73Human Capital 75Social Capital 78
Maintaining Good Governance 84-114Governance and Internal Control 84Compliance Status 91Risk Management 102Annual report of the Directors 110Certification of IBNR and LAT 114
Financial Reports 116-199Statement of Directors’ Responsibilities 116Audit Committee Report 117Independent Auditor’s Report 118Statement of Financial Position 120Statement of Profit or Loss and Other Comprehensive Income 121 Statement of Changes in Equity 122Statement of Cash Flows 124Notes to the Financial Statements 125Segmental Review - Statement of Financial Position 2018 196Segmental Review - Statement of Financial Position 2017 197Segmental Review - Statement of Profit or Loss and Other Comprehensive Income 2018 198Segmental Review - Statement of Profit or Loss and Other Comprehensive Income 2017 199
Supplementary Information Statement of Value Added 202Insurance Revenue Account 203Ten Year Summary - Statement of Income 204Ten Year Summary - Statement of Financial Position 205Glossary of Insurance Terms 206Our Branch Network 209Notice of the Annual General Meeting 212Form of Proxy Enclosed

IntroductionVision and Mission 04
Who we are 05
About this Report 07
Materiality Assessments 09
History & Milestones 10
Financial Highlights / KPIs 12
Our Performance in 2018 Chairman’s Message 14
Managing Director’s Review 20
About Our Company Board of Directors - Co-operative Insurance Company Limited 26
Board of Directors - Cooplife Insurance Company 30
Corporate Management Team - Co-operative Insurance Company Limited 33
Management Team - Cooplife Insurance Limited 35
Senior Management Team - Co-operative Insurance Company Limited 37
Branch Management 39
Our Business Model 42
Contribution to Sustainable Development 44
Our Products and Services 46
Our Channels & Branch Networks 47
Changes to our Material Capital in 2018 49
The Co-operative Insurance Training Academy 51
ANNUAL REPORT - 2018CO-OPERATIVE INSURANCE COMPANY4
Our VisionTo be an organisation that will stand ‘united’ with its customers to the very end.
ValuesBased on co-operative principles and ethics.
Our MissionTo be ever mindful of the needs of our customers and, thereby make ‘true protection’ a way of life via the provision of innovative, yet affordable insurance solutions which conform to the highest ethical and moral standards.

ANNUAL REPORT - 2018CO-OPERATIVE INSURANCE COMPANY 5
Who we are
Formed in 1999, CICL is Sri Lanka’s first and foremost insurance company built on the principles of co-operation and mutual understanding and has segregated its core business into Life (Long term insurance) and General Insurance, subsequent to the Segregation act constituted by the Insurance Regulatory Commission of Sri Lanka (IRCSL). Creating sustainable benefits for Sri Lankans across the rural and urban communities, CICL has now become an insurer trusted by the majority of Sri Lankans who believe in the principle of unity and mutual aid.
With ownership that rests within the Co-operative Sector of Sri Lanka, CICL is truly a local company operating under the spirit of nationalistic pride. As the first insurer to emerge within Sri Lanka’s Co-operative Sector, we have now penetrated those cross segments within the Sri Lankan market, where focus from other insurers was not formerly a priority.
Our business is driven by the creation of quality and comprehensive insurance solutions coupled with the continuous enhancements and improvements in service quality. Fundamentally, as an insurer, we are
in the business of building relationships and nurturing stronger bonds of understanding and mutual respect. Therefore, our model of business is also one that creates long term value for all our customers and our stakeholders, alike.
Dedicated in our commitment to all stakeholders, CICL nurtures a sustainable model of conducting business that grows stronger along with our assurance towards managing risks and financial interests of all parties with a vested interest in the organisation.
Spread across the far corners of Sri Lanka we have expedited a strategy of rapid expansions. Our service channel network is now the industry’s third largest with dedicated service centres for both CICL and Cooplife’s, general and life insurance businesses, respectively. With a unique service network that utilises Sri Lanka’s network of co-operative societies as well as offices within the postal system, we continue to grow our distribution and service reach, allowing greater conveniences and accessibility to all Sri Lankans, who seek our services.
Co-operative Societies
Co-operative Insurance Company Limited
Co-operative Insurance Training Academy Cooplife Insurance Limited
99.99%
100% 82%

ANNUAL REPORT - 2018CO-OPERATIVE INSURANCE COMPANY6
Who we are
Our product portfolio includes a holistic approach to development of policies that caters to various financial obligations and investment needs of the rural as well as urban market segments, and is developed to complement the myriad of financial obligations of the co-operative community.
CICL now caters to diverse market segments and clients from differing social and economic backdrops. Our approach to reaching these segments begins with education and awareness by filling the gaps of information and educate Sri Lankans on insurance and on options of risk management.
With leadership that extends from within the co-operative sector our Board of Directors share the same principles of the Co-operative movement. Their vision falls under the belief that CICL should create sustainable value without forming objectives around short term financial goals.
LIFE INSURANCE SUBSIDIARY.Our subsidiary Cooplife Insurance Limited provides comprehensive solutions for the long term protection of people from all walks of life. Re-established in 2015, the company leadership is formed with a team of veterans, handpicked from the industry in transforming the potentials of its people and systems into a growing success. Cooplife operates on the understanding that its people are its strongest threshold.
Cooplife’s advisors are recruited from across the country and include a highly diverse group of individuals who are groomed to serve customers with complete understanding, respect and technical expertise in providing Solution for customers’ financial interests and are adept in assisting them to financially mitigate life’s risk exposures.
CICL is also a member of the Asia and Oceania Association (AOA)
Co-operative Insurance Company Limited and Cooplife Insurance Limited are active members of the International co-operative and Mutual Insurance Federation (ICMIF). Established in the United Kingdom, the ICMIF is a globally spread Co-operative with an extensive base of 120 Co-operative Insurance companies across 65 countries from the developed and developing worlds and also within autonomous regional associations covering the United State of America, Europe, and ASIA. The ICMIF provides expertise to its members in the areas of Reinsurance, Training, Consultancy, Research, Department, & Publications, empowering them to achieve greater exposure and recognition for co-operative sector insurers.
ANNUAL REPORT - 2018CO-OPERATIVE INSURANCE COMPANY 7
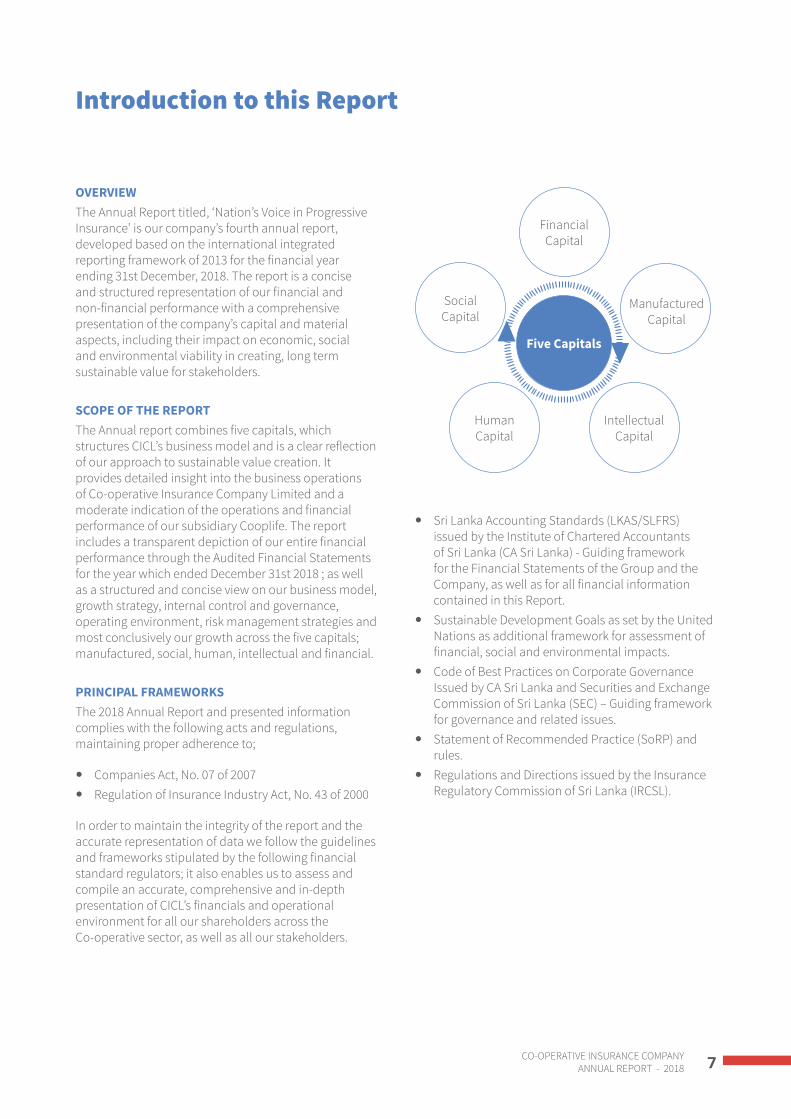
OVERVIEWThe Annual Report titled, ‘Nation’s Voice in Progressive Insurance’ is our company’s fourth annual report, developed based on the international integrated reporting framework of 2013 for the financial year ending 31st December, 2018. The report is a concise and structured representation of our financial and non-financial performance with a comprehensive presentation of the company’s capital and material aspects, including their impact on economic, social and environmental viability in creating, long term sustainable value for stakeholders.
SCOPE OF THE REPORTThe Annual report combines five capitals, which structures CICL’s business model and is a clear reflection of our approach to sustainable value creation. It provides detailed insight into the business operations of Co-operative Insurance Company Limited and a moderate indication of the operations and financial performance of our subsidiary Cooplife. The report includes a transparent depiction of our entire financial performance through the Audited Financial Statements for the year which ended December 31st 2018 ; as well as a structured and concise view on our business model, growth strategy, internal control and governance, operating environment, risk management strategies and most conclusively our growth across the five capitals; manufactured, social, human, intellectual and financial.
PRINCIPAL FRAMEWORKSThe 2018 Annual Report and presented information complies with the following acts and regulations, maintaining proper adherence to;
y Companies Act, No. 07 of 2007 y Regulation of Insurance Industry Act, No. 43 of 2000
In order to maintain the integrity of the report and the accurate representation of data we follow the guidelines and frameworks stipulated by the following financial standard regulators; it also enables us to assess and compile an accurate, comprehensive and in-depth presentation of CICL’s financials and operational environment for all our shareholders across the Co-operative sector, as well as all our stakeholders.
y Sri Lanka Accounting Standards (LKAS/SLFRS) issued by the Institute of Chartered Accountants of Sri Lanka (CA Sri Lanka) - Guiding framework for the Financial Statements of the Group and the Company, as well as for all financial information contained in this Report.
y Sustainable Development Goals as set by the United Nations as additional framework for assessment of financial, social and environmental impacts.
y Code of Best Practices on Corporate Governance Issued by CA Sri Lanka and Securities and Exchange Commission of Sri Lanka (SEC) – Guiding framework for governance and related issues.
y Statement of Recommended Practice (SoRP) and rules.
y Regulations and Directions issued by the Insurance Regulatory Commission of Sri Lanka (IRCSL).
Introduction to this Report
Five Capitals
Manufactured Capital
Human Capital
Social Capital
Financial Capital
Intellectual Capital

ANNUAL REPORT - 2018CO-OPERATIVE INSURANCE COMPANY8
INFORMATION CREDIBILITY AND INTEGRITYThe information presented throughout the report, has been gathered from all departments. Highest integrity and accuracy is ensured across factual information as well as qualitative information in presenting the accurate outcomes and processes of CICL and Cooplife. Non-financial and financial information gathered and presented through this report have been reviewed and approved where relevant by the;
y Board of Directors y Audit Committee y Sub-committees of the Board
In addition, information pertaining to Human Resources is acquired via the core in-house developed HR system while information related to internal processes is gathered through CICL’s core systems, custom developed for General and Life Insurance operations, as well as through our Document Management System (DMS) which holds a digital foot print of all documents across our branch network.
AN INCLUSIVE APPROACHAs a company that works within an inclusive and holistic operational framework with ultimate focus on long term value creation, our representation of company non financials and financials is aligned with inclusivity, integrity and clarity. Most importantly, transparency and integrity remains fundamental principles across the report and the reported information.
The report is structured to provide an insight into CICL’s value creation process including the developments within the five capitals we utilise for achieving our long term strategies and objectives for growth. The aforementioned capitals have been integral in the development of our business model and constitutes the main focus of the report, reflecting our core business growth strategies, governance and internal controls as well as financial performance. CICL does not utilise or deploy natural resources, however our approach to the utilisation of energy in an efficient manner while ensure that our business outcomes have no negative impact on the eco-system and the environment.
The report systematically demonstrates all relevant aspects, segregated into main sections and sub-sections structured in a clear and concise manner. Our business model is depicted in pages 42 and 43 and remains the core of CICL’s operational processes as well as our guiding mechanism in our objectives of creating short term, medium and long term growth for our stakeholders, and in working towards profitability. Our growth strategy and resource allocation detailed in pages 58 to 61 provides the holistic outlook on our strategic priorities, our division of capital in terms of its relevance and importance to value creation, and conclusively amalgamates key performance indicators towards achieving and ensuring sustainable growth in the short and long term.
The capitals and applicable material matters are interrelated and remain undetached in achieving sustainable growth across our objectives. Intellectual capital remains crucial in our business as the systems used, the IT infrastructure, people knowledge, experiences and skills all correlate with other four capitals and aptly exhibit the nature of our business as a progressive insurance services provider.
EXTERNAL VALIDATIONSThe Financial Statements and all relevant notes provided across pages 120 to 195 have been audited by Messrs. Deloitte (SJMS Associates), Chartered Accountants, ensuring the integrity and quality of the Annual Report. The Independent Auditors Report can be viewed on pages 118 and 119.
WE VALUE YOUR OPINIONWe welcome feedback from all stakeholders on this report. Please direct any questions or comments to:
Name : Mr. Laksiri NawaratneDesignation : Chief Financial OfficerTel : 011-2 557 318Fax : 011-2 557 311Email : [email protected]
Introduction to this Report

ANNUAL REPORT - 2018CO-OPERATIVE INSURANCE COMPANY 9
Materiality Assessment
Determination of materiality in developing the annual report was based on those aspects that have significant impact on the company’s potential and capacity to create value; especially their effect on CICL’s growth strategy, compliance and risk environment and financial performance and in creating short term, medium and long term value for all our stakeholders. In another sense, materiality or material aspects are considered as those factors that have the potential or the certainty to influence the assessment of CICL’s business outcomes and potential for growth and opportunities. With regard to stakeholder interests, long term value creation, leadership decisions and our internal processes, we have selected and reported all materiality matters that have an identified impact of creating value.
All aspects pertaining to materiality provide a concise overview and analysis of how CICL aims to create value overtime, for the company and its stakeholders. In assessing the material aspects’ impact CICL has deployed the use of qualitative and quantitative evaluations, wherever relevant and applicable. This has enabled us to gauge the magnitude of its effect in evaluating its importance of material aspects on value creation.
In assessing material aspects, and relevant to Co-operative Insurance Company Limited and Cooplife Insurance Limited, we have applied CICL’s potentials for being financially viable and socially impactful within the co-operative, rural and urban communities we operate in. We have thereby, presented a structured and logical as well as direct outline and presentation of this information through our financial and non-financial performances or business outcomes, demonstrating our growing strong potential for sustainable and long term value. The material matters relevant to CICL also enable the influence on stakeholder decisions and perspectives.
In addition, we strive to provide a comprehensive and very direct analysis, of our growth strategy, internal processes and governance practices as well as risk mitigation framework that impact stakeholder decisions as well as financial outcomes.
MATERIALITY MATRIXCICL’s materiality matrix has enabled the company to identify those aspects which impact stakeholder
concerns and decisions. It gives us a mechanism with which the organisation can identify economic, social and environmental aspects that have a significant impact on the organisation’s stakeholder interests. Essentially at its core, it is a framework with which to develop growth strategies that enable the creation of long term value for all stakeholder groups.
MATERIALITY ASPECTS
1. Enhancing Customer Service2. Channel Expansions3. Information Technology Innovations and Systems4. Employee Satisfaction5. Co-operative Sector Contributions6. Ethical Work Practices7. Workplace diversity, inclusion and equal opportunities8. Creating Awareness on Insurance9. Process Innovations and digital work processes10. Employee Learning and Development11. Quality and Comprehensive product portfolio12. Responsible underwriting
IMPORTANT VERY IMPORTANT
RELEVANCE FOR GENERAL
RELE
VANC
E FO
R ST
AKEH
OLD
ERS
IMPO
RTAN
TVE
RY IM
PORT
ANT 26
1
4
8
10
129
11
375

ANNUAL REPORT - 2018CO-OPERATIVE INSURANCE COMPANY10
With a history that has stretched across two decades since 1999, CICL was the vision and product of like-minded individuals and veterans within the co-operative movement of Sri Lanka. The co-operative sector raised its concerns in bringing a mode of compensation and assurance to scores of our fellow Sri Lankans, whose livelihoods are dependent on the mutual understanding and support of the wider society. While insurance remained a non-existent concern within the rural and backward communities of the country a few decades ago, it became imperative to bring about an organisation that benefitted and compensated those in the rural and semi urban backdrops of our growing country.
Insurance remained by and large a product for the urban and high-middle income segments of the society which then saw an evolutionary change emerging with the inception of CICL. Viewed as unnecessary, complicated and unaffordable, perceptions on insurance began changing through the exemplary principles of the co-operative society initiating a revolutionary change in the history of our country’s insurance industry. At the onset we faced numerous challenges. However, the collective efforts of everyone involved and the numerous individuals who selflessly extended their knowledge and hard working in has helped CICL in reach the progression and stance it has achieved today.
Rooted in nationalistic pride and a sense of true Sri Lankan co-operative spirit, CICL is driven by the vision of its people. Our progressive culture and co-operative spirit is our identity that makes us formidable in our market presence and in our ability to adapt to serve all communities of Sri Lanka. In the recent past, we invested in prudent strategies that are based on ICT systems and innovative technologies, assimilated into the corporate working environment for driving speed of processes and enhancing cost efficiencies. Although our focus on innovation continues to make service quality improvements, at our core, we hold are a culture centered on people and human capital.
Amongst our feats we made the highest payment of dividend by an insurer at a percentage of 14%, in 2013, marking a significant leap in our commitment to creating value for our shareholders and all stakeholders
Award of Certificate of Compliance for the 2017 Annual Report at the Annual Report Award Competition organised by the Institute of Chartered Accountants of Sri Lanka.
History and Milestones

ANNUAL REPORT - 2018CO-OPERATIVE INSURANCE COMPANY 11
Milestones
Established with the vision of fulfilling
the insurance needs of those within the co-operative, rural
and semi-urban sectors of the country.
CICL opened the 100th branch office.
Received Diamond award at the
International Quality Crown Convention.
CICL was ranked in the highest claims
paid category, by the insurance regulator, for the 2Q of 2017.
CICL recorded the highest GWP growth
rate in General Insurance sector
CICL paid the highest dividend
made by any insurer in the year, at 14%.
Won Platinum Award at the
International Star for Leadership in
Quality Convention, Paris.
CICL and Cooplife was re-established
as separate entities, based on the
Segregation of the Life and General
Insurance Business under Section 53 of
the Regulation of Insurance Industry (Amendment) Act
No. 3 of 2011.
1999
2018
2011
20172016
2014
2009
2015
Won Gold award at the International
Quality Summit, New York.
Accepted Diamond
award at Arch of Europe, for Quality and Technology.
Century International quality Era in the Diamond
Category.
2008
2013
2010

ANNUAL REPORT - 2018CO-OPERATIVE INSURANCE COMPANY12
Financial Highlights/KPIs
Growth Trend
FY Ending 31st December
2018
FY Ending 31st December
2017
FY Ending 31st December
2016Growth Rate
%
GWP (group) 4,368,316,886 3,677,800,345 2,940,072,597 18.8
Profit After Tax 411,645,940 370,768,584 129,373,235 11
Capital Base 1,430,194,585 1,260,251,770 1,115,367,950 13.5
SHAREHOLDER RETURNSDividends Paid 179,133,989 144,997,834 110,540,057 23.5
Earnings per Share 2.93 2.77 1.22 5.8
Dividends Paid per Share 1.35 1.15 1.30 17.4
GENERAL INSURANCEMotor - GWP 3,254,676,122 2,680,389,734 2,203,632,975 21.4
Non Motor - GWP 496,162,335 375,445,930 271,910,339 32.2
Market Share 3.45 3.92 3.22 0.48
Claims Incurred 2,181,895,843 1,830,737,958 1,354,063,910 23.2
LIFE INSURANCEGWP (Rs. Mn.) 619,881,069 625,573,542 465,830,348 -0.9
Claims Incurred 222,428,887 121,573,256 81,898,522 83
2014 2015 2016 2017 20180
10
20
30
40
50
60
70
Net Assets Growth
8
2924
6
50.1
%
2014 2015 2016 2017 20180
5
10
15
20
25
30
35
12.0
24.3
16.6
21.2
28.3
%
Total Assets Growth

ANNUAL REPORT - 2018CO-OPERATIVE INSURANCE COMPANY 13
GWP - Group
Rs. Mn 4,368.3 +19%2017: Rs. Mn 3,677
Profit After Tax
Rs. Mn 411.6 +11%2017: Rs. Mn 370.7
Dividend Paid
Rs. Mn 179 +17%2017: Rs. Mn 144.99
Earnings Per Share
Rs. 2.93 +5.8%2017: Rs. 2.77
YEAR END RESULTS
1.0
1.5
2.0
2.5
3.0
3.5
4.0
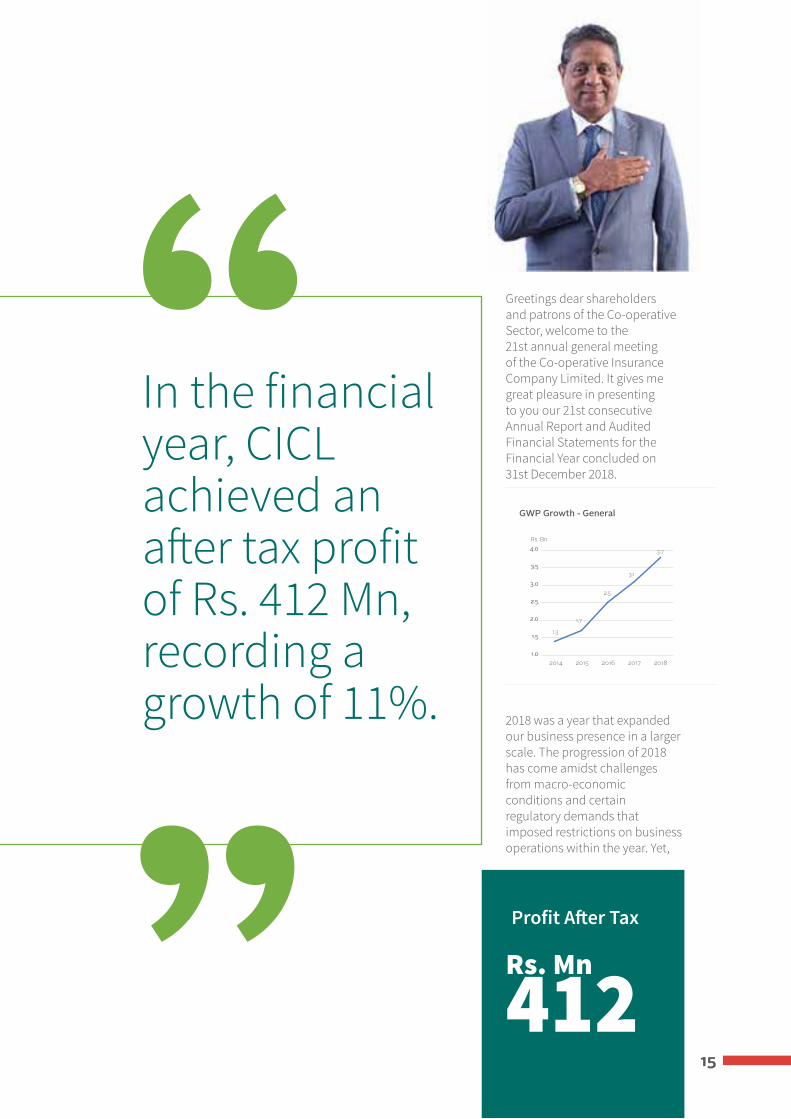
GWP Growth - General
2014 2015 2016 2017 2018
1.3
1.7
2.5
3.1
3.7
Rs. Bn
0
5
10
15
20
25
30
35
40
Premium & Claim Growth
GWPGrowth
NEP Growth
Claim Growth
32
21
14
24
2
23
%
Motor Non Motor
0
500
1,000
1,500
2,000
Insurance Liability - Life
2014 2015 2016 2017 2018
1,074
87
1,231
1,4911,608
Rs. Mn
Revenue Composition
74%
14%3%8%
Life insuranceMotorFire
MarineMiscellaneous
Total GWP Rs. Mn
4,368 2017: 3,679
Claims Incurred Rs. Mn
2,182 2017: 1,831

Chairman’s Message
ANNUAL REPORT - 2018CO-OPERATIVE INSURANCE COMPANY 15
Rs. Mn
412Profit After Tax
In the financial year, CICL achieved an after tax profit of Rs. 412 Mn, recording a growth of 11%.
Greetings dear shareholders and patrons of the Co-operative Sector, welcome to the 21st annual general meeting of the Co-operative Insurance Company Limited. It gives me great pleasure in presenting to you our 21st consecutive Annual Report and Audited Financial Statements for the Financial Year concluded on 31st December 2018.
2018 was a year that expanded our business presence in a larger scale. The progression of 2018 has come amidst challenges from macro-economic conditions and certain regulatory demands that imposed restrictions on business operations within the year. Yet,
““1.0
1.5
2.0
2.5
3.0
3.5
4.0
GWP Growth - General
2014 2015 2016 2017 2018
1.3
1.7
2.5
3.1
3.7
Rs. Bn

ANNUAL REPORT - 2018CO-OPERATIVE INSURANCE COMPANY16
Chairman’s Message
despite the lackluster conditions and political instability that prevailed at the latter part of the year, the financial year ended favorably for CICL, with a positive reflection in our key indicators of financial performance.
The year was a challenging period for the sector as well as the economy as the rupee depreciated with further distress from political instability; despite the slow progression, CICL continued to execute our expansion strategies while carrying out organic growth of business, chiefly attributed to market word of mouth and grass root promotions.
The outcomes of this year’s business performance have been a result of our strategic initiatives, in creating value for our stakeholders. In 2018, the Co-operative Insurance family continued to grow as a vast network of employees, partners, brokers and agents with access to both mass and niche markets. Since our inception in 1999, our growth has been a result of our shared efforts in promoting Co-operative Insurance amongst the broader markets in Sri Lanka. With a growing base of customers both from the Co-operative, urban and rural communities we are becoming a formidable competitor in the industry with access to formerly untapped markets in the insurance sector of Sri Lanka.
EXTERNAL ENVIRONMENTIn 2018, the Gross Domestic Product at current prices was estimated at Rs. 14,449.9 billion (US dollars 88.9 billion) with a growth rate of 7.7% over 2017. Real GDP growth in 2018 declined to 3.2%, from to 3.4% in 2017. The overall growth can be attributed to the improvement in service related activities which rose by 4.7% and agricultural activities which increased by 4.8% which was a considerably progress over the 0.4% contraction in 2017. Agricultural activities recorded a 7.9% contribution to the overall GDP in 2018. In addition industry and service related activities have contributed to the GDP at a share of 27% and 56.8%, respectively.
During the 1Q of 2018, financial services recorded a growth rate of 12.2%, which was an increase from the previous year’s 9.1% and the Profit before Tax of Licensed Commercial Banks and Specialized Banks increased by 4.8%. The value of loan advances and the value of total deposits increased by 15.1% and 17.1% accordingly. The Average Weighted Lending Rate (AWLR) and the Average Weighted Deposit Rate (AWDR) reported 14.4% and 9% growth rates, respectively. Insurance, reinsurance and pension funding scored an increase of 9.3%, in addition, employment payments and profit before tax of insurance companies have also increased during the period.
INSURANCE INDUSTRYThe industry posted a gross written premium of Rs. 175.7 billion at a growth rate of 12.6% over the previous GWP. The gross written premiums of both life and general insurance sub-sectors varied marginally at 12.7% and 12.5%, respectively. General insurance remained the biggest contributor to the sector’s GWP with a share of 54.3% including a growth in the motor insurance sub-segment of 12.9%.
The industry also faced a downward trend in profit by 38.4% chiefly due to the contraction of profits of 3 long-term insurance companies; profit of long-term insurance declined by 48.5% while profits in the general insurance sector marked an increase by 8.3%. Total claims during the reviewing year recorded a growth of 19.9% and increased to Rs. 81.6 billion from Rs. 68.1 billion.
The industry has a greater level of unfulfilled potential as penetration of insurance has stinted at 1.2% of GDP, against a global average of 3%. The domestic market is yet to fully comprehend the financial benefits of insurance, especially when faced with unexpected losses. However, unmet potential also means that insurers are facing a wider market that is teeming with new prospects with a backdrop for immense growth. In this regard, education and continued awareness becomes imperative in the growth of the industry. Knowledge becomes crucial in winning the fight for market position as it facilitates the decisions of potential buyers when faced with the need for policies.
ANNUAL REPORT - 2018CO-OPERATIVE INSURANCE COMPANY 17
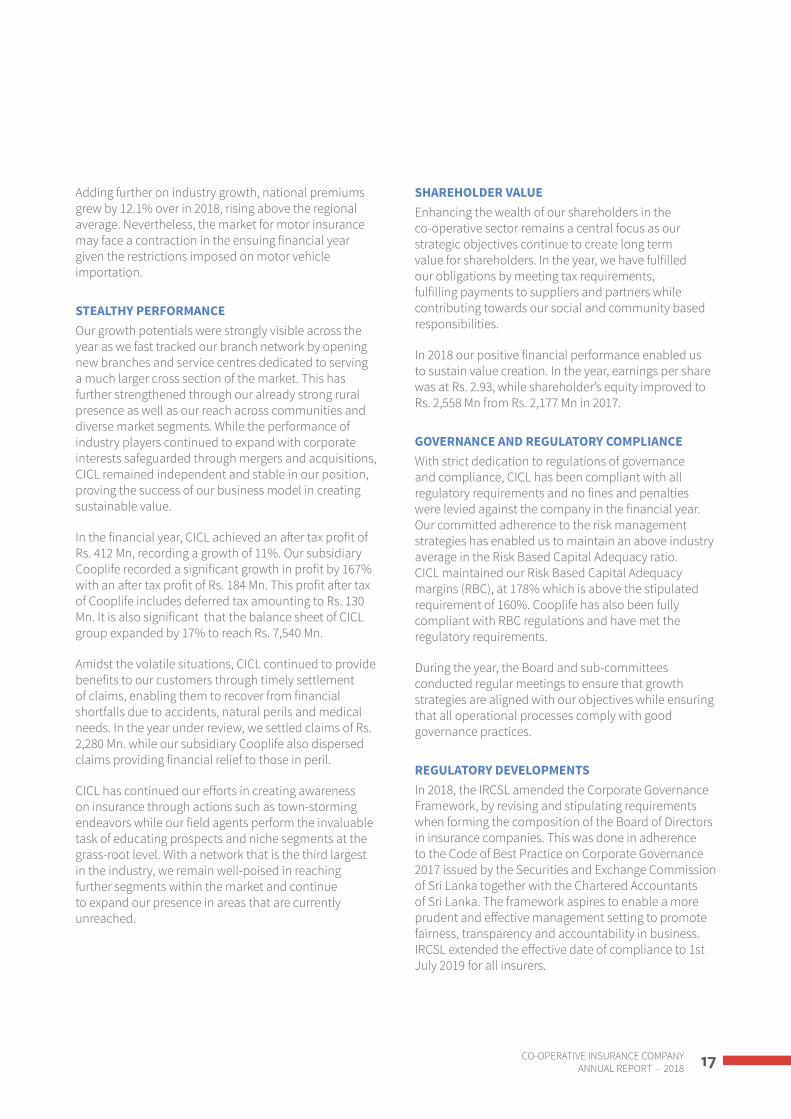
Adding further on industry growth, national premiums grew by 12.1% over in 2018, rising above the regional average. Nevertheless, the market for motor insurance may face a contraction in the ensuing financial year given the restrictions imposed on motor vehicle importation.
STEALTHY PERFORMANCEOur growth potentials were strongly visible across the year as we fast tracked our branch network by opening new branches and service centres dedicated to serving a much larger cross section of the market. This has further strengthened through our already strong rural presence as well as our reach across communities and diverse market segments. While the performance of industry players continued to expand with corporate interests safeguarded through mergers and acquisitions, CICL remained independent and stable in our position, proving the success of our business model in creating sustainable value.
In the financial year, CICL achieved an after tax profit of Rs. 412 Mn, recording a growth of 11%. Our subsidiary Cooplife recorded a significant growth in profit by 167% with an after tax profit of Rs. 184 Mn. This profit after tax of Cooplife includes deferred tax amounting to Rs. 130 Mn. It is also significant that the balance sheet of CICL group expanded by 17% to reach Rs. 7,540 Mn.
Amidst the volatile situations, CICL continued to provide benefits to our customers through timely settlement of claims, enabling them to recover from financial shortfalls due to accidents, natural perils and medical needs. In the year under review, we settled claims of Rs. 2,280 Mn. while our subsidiary Cooplife also dispersed claims providing financial relief to those in peril.
CICL has continued our efforts in creating awareness on insurance through actions such as town-storming endeavors while our field agents perform the invaluable task of educating prospects and niche segments at the grass-root level. With a network that is the third largest in the industry, we remain well-poised in reaching further segments within the market and continue to expand our presence in areas that are currently unreached.
SHAREHOLDER VALUEEnhancing the wealth of our shareholders in the co-operative sector remains a central focus as our strategic objectives continue to create long term value for shareholders. In the year, we have fulfilled our obligations by meeting tax requirements, fulfilling payments to suppliers and partners while contributing towards our social and community based responsibilities.
In 2018 our positive financial performance enabled us to sustain value creation. In the year, earnings per share was at Rs. 2.93, while shareholder’s equity improved to Rs. 2,558 Mn from Rs. 2,177 Mn in 2017.
GOVERNANCE AND REGULATORY COMPLIANCE With strict dedication to regulations of governance and compliance, CICL has been compliant with all regulatory requirements and no fines and penalties were levied against the company in the financial year. Our committed adherence to the risk management strategies has enabled us to maintain an above industry average in the Risk Based Capital Adequacy ratio. CICL maintained our Risk Based Capital Adequacy margins (RBC), at 178% which is above the stipulated requirement of 160%. Cooplife has also been fully compliant with RBC regulations and have met the regulatory requirements.
During the year, the Board and sub-committees conducted regular meetings to ensure that growth strategies are aligned with our objectives while ensuring that all operational processes comply with good governance practices.
REGULATORY DEVELOPMENTS In 2018, the IRCSL amended the Corporate Governance Framework, by revising and stipulating requirements when forming the composition of the Board of Directors in insurance companies. This was done in adherence to the Code of Best Practice on Corporate Governance 2017 issued by the Securities and Exchange Commission of Sri Lanka together with the Chartered Accountants of Sri Lanka. The framework aspires to enable a more prudent and effective management setting to promote fairness, transparency and accountability in business. IRCSL extended the effective date of compliance to 1st July 2019 for all insurers.

ANNUAL REPORT - 2018CO-OPERATIVE INSURANCE COMPANY18
Chairman’s Message
In 2018, IRCSL issued Direction #16 for the Identification and Treatment of one-off surplus. The Direction included changes in tax rules which came into effect on 1st April, 2018. Distribution of surplus to shareholders from policyholder funds as well as investment income of shareholder funds are taxed at 28%. Additionally, distributions to participatory life policyholders are to be taxed at 14% which was previous untaxed.
SUSTAINABLE DEVELOPMENTCICL remains the primary contributor to the co-operative sector in Sri Lanka, serving a broader, more potent sector of the economy, including our communities in rural and semi-urban Sri Lanka with its sectors of self-employed small and medium scale entrepreneurs and those within the low-middle income bracket of the nation.
At our core, our mission is to safeguard the lives and financial interests of Sri Lankans while working under the guiding philosophy that a united and mutually co-operative society leads to sustainable and upright development; this is envisioned would sustain thousands of individuals whose lives can be impacted through the life altering benefits of insurance and indemnification. We continue to change perceptions across Sri Lanka, creating awareness on the life-long benefits of insurance as part of the co-operative framework and promote fellowship within the sector and its principle of mutual partnership without any ambiguities and indifferences to any cross section of our society.
FUTURE OUTLOOKWith our principles having an interminable connection to the co-operative sector as the only insurer with dedicated focus on providing the much wider market base of the rural and semi urban communities, we continue to expand our promise of standing by our customers across all stages of life. Our plans for expansion will continue while maintaining stability in a volatile macroeconomic context.
As insurers we must also not forget that cost of living plays a decisive role in determining industry growth, with the potential to either inhibit or support growth and dictates payment capacities of prospective buyers in a market that is also penetrated by heavy competition. Nevertheless, service remains our biggest competitive advantage as well as innovation and technological enhancements. In the face of growing competition, meeting service expectations, transparency, trustworthiness and approachability are key elements in growing our business across both general and life insurance. In addition, with rising per capita income and a growing need for insurance based on awareness will enable the industry to maintain its growth momentum.
As a Co-operative sector insurance company with one of the largest service networks in the industry, we have the unique disposition of improving the lives of countless individuals by allowing them to expand their objectives in life without fearing the financial burdens of the risks involved. CICL continues to enable social and economic development within the co-operative and rural

ANNUAL REPORT - 2018CO-OPERATIVE INSURANCE COMPANY 19
communities as well as within the private sector of the country. With our plans to initiate the public listing in the future is expected to create further sustainable value and enable us in enhancing our services to better serve our multitude of customers, across Sri Lanka.
APPRECIATIONThe progress of the year has been a result of the dedication of our shareholders and the Board of Directors and the Co-operative community as a whole. Their vision of taking insurance to all sectors of the country has enabled us to form a unique business model and form a truly sustainable model that benefits our market segments to the fullest potential. On behalf of this success I thank our Managing Director, Mr. Wasantha Ranasinghe, our Corporate and Senior Management teams for their self-driven dedication to CICL and the profession. Our staff members have been our most uncontested strength in taking CICL and Cooplife to the far corners of the country, hence, I extend my most heartfelt gratitude towards their commitment to the corporate vision and objectives.
W. Lalith A. PeirisChairman
23rd May 2019

ANNUAL REPORT - 2018CO-OPERATIVE INSURANCE COMPANY20
Managing Director’s Review

ANNUAL REPORT - 2018CO-OPERATIVE INSURANCE COMPANY 21
Revenue Composition
Motor Fire Marine Miscellaneous
87%
3%
10%
Co-operative Insurance made headway in our growth objectives, achieving our targets envisioned for the financial year, amidst unprecedented challenges which added strain on the nation’s economy and our industry. In 2018, the economy continued to be riddled with tax reforms and policy changes while a political crisis posed further instability.
However, amidst all these adversities, CICL proudly witnessed a growth rate of 23% in our GWP performance for general insurance, achieving our objective for the year.
““23%
GWP Growth Rate
Our GWP for the year increased by 23% reaching Rs. 3,751 Mn

ANNUAL REPORT - 2018CO-OPERATIVE INSURANCE COMPANY22
Managing Director’s Review
Our presence across the country was expanded, unparalleled to any other financial year, while, our business operations continued to be optimized by continuing to shift to a paperless, more technologically enabled environment. Our investments too, are now aligned with projects based on transforming CICL into an ICT driven company aimed at achieving greater strides in enhancing customer service through innovation.
As at present, CICL’s branch network is the third largest in the nation’s insurance landscape with significant leverage from having established our presence within the rural markets, as well as with urban customer segments. Our journey is paved by the principles of our fellow co-operative societies and remains rooted in the model of safeguarding the lives and financial interests of all our customers while providing services with mutual understanding and respect.
In all essence, CICL and Cooplife continues to be the ‘National Voice of Insurance’ across all communities, especially in the rural sector, presenting to them a world of opportunities in mitigating their risks and financial uncertainties, while understanding their financial constraints and concerns that have hither to restricted their complete belief in the instrument of insurance.
FINANCIAL AND BUSINESS PERFORMANCEDespite the unfavorable conditions which prevailed in the year, CICL has achieved our performance objectives for the year even with substantial investments being made for our branch network expansions. Our GWP for the year increased by 23% reaching Rs. 3,751 Mn in 2018, with 87% of it belonging to motor insurance, while, 13% of GWP was from non-motor insurance.
Business in Motor Insurance grew by Rs. 574.28 Mn which was a 21% increment in comparison to the corresponding year of 2017. Non Motor Insurance also contributed to the high performance during the year.
CICL recorded an After Tax Profit of Rs. 268 Mn, maintaining the planned growth rate. The CICL group recorded an After Tax Profit of Rs.412 Mn and in spite of regulatory changes and tax increases we maintained a stable outlook, increasing our main financial performance targets.
CLAIMS AND SETTLEMENTSIn 2018, we continued to digitize our claim settlement processes, fast tracking it by upgrading our in-house claim settlement system, for improving the overall speed and efficiency of the entire claim settlement process. Segmenting of claims was carried out, using our custom in-house system that continued to be topped with modules for creating an all-inclusive software application. Our customers now benefit from faster and completely efficient results of claim settlements with time reduced by 50%.
Being a truly local insurer we remain true to our values of and ideals for mutual growth, while still evolving into a new era of commanding business through digital and technological innovations.
CHANNEL EXPANSIONIn the year under review, we set out to increase our branch portfolio, which was expanded by 23 new branches. CICL now operates a total of 102 company owned offices besides a much wider network of agents, partners and insurance brokers. Optimising our growth potentials further by the selection of strategically important locations, the new branches provide more access to further untapped markets within the island, catapulting our reach and expanding our market presence.

ANNUAL REPORT - 2018CO-OPERATIVE INSURANCE COMPANY 23
Our physical foot print is unrivalled in its spread and has provided a greater competitive advantage in enabling further convenience and in enhancing customer service for customers across the country. Replacing fierce and incessant strategies deployed through mass media communications, by competitors, our expanding branch and channel network has provided us with a significant level of exposure, creating better brand visibility and awareness amongst a multitude of Sri Lankans. Excluding the centrally placed branches in Colombo, 95% of all new branches are located outside of Colombo, providing more flexibility in reaching new market segments, increasing our potential of growing our customer base while providing ease of service to our existing customers in all provinces and districts.
ENHANCING HUMAN CAPITAL POTENTIALSAcross the year, our employees from varying technical capacities were exposed to knowledge and skill development through training sessions, workshops and seminars. Employees from technical areas such as underwriting, reinsurance and claims, marketing and sales have undergone in-house and overseas training, enhancing and developing their core competencies as well as developing their personal skills. Our training academy, CITA absorbed more students to its fullest capacity, providing certificate and diploma level qualifications in association with the Insurance Institute of India.
MACROECONOMIC IMPACTSMonetary policies tightened in 2018, while CBSL relaxed monetary policy stance moderately in April of 2018. The government launched its ‘Vision 2025’ schemes in September of 2018, leading to a constructive impact on the medium and long term performance of the overall economy.
In the first half of 2018, the importation of vehicles with a less than 1000cc engine capacity reported a massive growth accounting for around 90% of all vehicle imports also involving unregulated importations by private dealers and individuals. In August of 2018, the government revised the excise duty levied on vehicles of the same engine category. The tax amendment effected importers with letters of credit initiated before August; however, the new tax regime became applicable to vehicles cleared after the 31st of January.
In a strategy to reduce the outflow of foreign currency and in stabilizing the rupee vehicle permits of the Loan to Value ratio was adjusted from 70 to 50 percent for financing vehicles. In 2018, the cost of living propelled by a rising inflation rate created unrest in the markets and with the general public. The Sri Lankan rupee depreciated rapidly at a rate of 16.7% against the US dollar creating market volatility, especially those impacted by massive imports of raw material and finished goods. The CBSL and government introduced a portfolio of policy initiatives which includes margin deposit requirements for letters of credit opened for the importation of personal motor vehicles. The step was expected to curb the disproportionate demand for foreign currency.
On April 1st 2018, changes to the inland revenue act which came into effect was expected to lower, net profits of life insurance providers; making it increasingly challenging to achieve profitability amidst other investments in infrastructure.
Industry-wise, the trend of consolidation between local and overseas insurance companies continued in the year, with another merger between two industry leaders. Regulatory requisites such as high capital needs and segregation of composite operations have

ANNUAL REPORT - 2018CO-OPERATIVE INSURANCE COMPANY24
Managing Director’s Review
also compelled insurers to consolidate in the hope of better prospects. Surplus distributions to shareholders from policyholder funds and investment income of shareholder funds (less allowable expenses) are taxed at 28%. Earlier, most of the life insurers paid lower taxes under the ‘investment income minus management fees’ method, which resulted in a lower tax base. In addition, distributions to participating life policyholders, which were not taxed previously, are now taxed at 14% and will be increased to 28%.
STRENGTHENING INTERNAL PROCESSESIn the Financial Year we intensified our organizational process efficiencies, strengthening core business systems and focusing on further enhancing the reliability and adaptability of core business systems. Our highly skilled IT team further developed the core business systems of Life and General Insurance, ensuring speed and efficiency across all of our business processes, while ensuring islandwide connectivity and effective networking across branches.
Our document management system was further developed as part of our strategy of shifting to a more digitally driven business environment. The system has provided our employees greater efficiency in accessing relevant documentation faster and in-time, for processing claim related requirements and for allowing customers speedier claim settlements.
CREATING SHAREHOLDER VALUEAs a result of the year’s financial performance, CICL has a strong capacity to create additional value to our Shareholders. Our earnings per share increased from Rs. 2.77 to Rs. 2.93, indicating a positive growth of 6%, YoY. The Board declared a dividend of Rs. 1.25 and the return on assets for the period is 6% whilst the ROE is 15.24%. Total Shareholder equity increased from Rs. 2,289 Mn. to Rs. 2,701 Mn. The Financial Year did not prove favorable for moving towards a listing, as conditions within the nation’s overall economic context remained unfavorable in returning to Shareholders the full benefit of their trusted investments.
BRAND IMAGEAcross the year, CICL conducted 260 promotional activities which included sessions of town storming, with an average of 15-20 sessions covered on a monthly basis. These sessions were essentially based on visiting various locales. More importantly, they fulfill a broader objective of creating awareness amongst the general public on the importance of insurance and the benefits of CICL’s products and services. Fitch Ratings has affirmed Co-Operative Insurance Company Limited (CICL) National Insurer Financial Strength (IFS) Rating at ‘BBB+ (lka).
THE ROAD AHEADWe expect the industry regulator to enable an environment that remains consistently conducive to creating sustainable value that benefits the industry and the national economy. Nevertheless, our commitment to investing in CICL’s expansion in terms of expanding physical footprint and in developing our internal technological systems remain robust and well-poised amidst the sustained and stable growth trajectory of the Company, as we continue to create long-term value for our stakeholders.
In the year ahead, we will continue our investments in enhancing service quality by expanding our channel base, our human resource skills and knowledge; as well as our digital and ICT based infrastructure. Our medium term objectives also include diversifying our products in increasing revenue, across motor, non-motor and life insurance segments and in increasing our GWP in the medium and long term.

ANNUAL REPORT - 2018CO-OPERATIVE INSURANCE COMPANY 25
APPRECIATIONCICL’s corporate and senior management plays a pivotal role in achieving our growth strategies through seamless supervision of operations across our branch and service channel network. Their specialist managerial skills, ensures that performance is aligned with targets and growth objectives and that work processes are aligned with internal control processes and governance practices.
I commend their dedication and also thank our employees across CICL’s branch network and our multitude of agents and brokers, whose access to varying market segments has given us a significant competitive advantage. I would also like to thank our Board of Directors and shareholders for their persistent guidance in steering both CICL and Cooplife towards success.
Wasantha RanasingheManaging Director
23rd May 2019

ANNUAL REPORT - 2018CO-OPERATIVE INSURANCE COMPANY26
Board of DirectorsCo-Operative Insurance Co. Ltd
Standing left to right
Mr. R. Sooriaarachchi - DirectorMr. K.J. Sesiri - DirectorMr. K.R.W. Ranasinghe - Managing DirectorDr. W. Lalith A. Peiris - ChairmanMr. K.R.K.N. Jayasinghe - Vice Chairman Mr. D.P. Amaradeva - DirectorMr. R.G.K. Rankothge - Director

ANNUAL REPORT - 2018CO-OPERATIVE INSURANCE COMPANY 27
Standing left to right
Mr. C.P. Jayasinghe - DirectorMr. J. M.V. P. Jayasooriya - DirectorMr. P. P. D. S. Kularathne - DirectorMr. A.D.T.S. Palitha - DirectorMr. S.S. Weerasekara - DirectorMr. D.L Samarawickrama - Director

ANNUAL REPORT - 2018CO-OPERATIVE INSURANCE COMPANY28
Mr. D. P. AmaradewaDirector
Mr. D.P. Amaradewa is the former Chairman of Natthandiya Multi-Purpose Co-operative Society Limited.
Mr. K. J. SesiriDirector
Mr. K. J. Sesiri holds a Special Degree in Bachelor of Management Science. He is also the Chairman of Beralapanathara Multi-Purpose Co-operative Society Limited. He is the Vice Chairman of Matara District Co-operative Council and Matara District Tea Producers Co-operative Society Union. He is also a Director of Matara District Co-operative Rural Bank Union Limited.
Mr. R. Sooriyaarachchi Director
Mr. R. Sooriyaarachchi is the former Chairman of Gampaha District Co-operative Rural Bank Union Limited and as well as in Puttalam Salt Limited.
Mr. R. G. K RankothgeDirector
Mr. R. G. K Rankothge is the Chairman of Sri Lanka Co-operative Marketing Federation and Poojapitiya Multi-Purpose Co-operative Society Limited.
Mr. C. P. JayasingheDirector
Mr. C. P. Jayasinghe holds a Bachelor of Arts Degree and He is the Chairman of Dambadeniya Multi-Purpose Co-operative Society Ltd., Vice Chairman of Wayamba Co-operative Rural Bank Union Ltd and also a Director of Co-operative leasing Company Limited and Wayamba Co-operative Consumer Society Limited.
Board of Directors
Dr. W. Lalith A. PeirisChairman
Dr. W. Lalith A. Peiris is the Chairman of the Cooplife Insurance Limited, National Co-operative Council of Sri Lanka, Wennappuwa Multi-Purpose Co-operative Society Limited and Chilaw District Co-operative Council. He is also a Director of Sri Lanka Co-operative Rural Bank Federation and National Institute of Co-operative Development - Polgolla. He also the Chairman of Co-operative Insurance Training Academy.
Mr. K.R.K.N. JayasingheVice Chairman
Mr. Jayasinghe is the former Chairman of Postal & Telecom Employees Co -operative Bank Society Ltd.
Mr. K.R.W. RanasingheManaging Director
Mr. Wasantha Ranasinghe is a Fellow Member of the Institute of Chartered Accountants of Sri Lanka (F.C.A) and the Society of Certified Management Accountants Sri Lanka (FSCMA). He is also a member of the Institute of Data Processing Management UK (LIDPM). He holds an MBA, PIM and B.Sc. Management (Special) Degree from University of Sri Jayawardenepura. His experience extends over 30 years in public and private sectors. He served as CEO and CFO in Laugfs group and also he is a former Director of Laugfs group, Sri Lanka.
He is a Director of Prime Engineering Lanka (Pvt) Ltd and Sirioya Hydro Power (Pvt) Ltd. Mr. Wasantha Ranasinghe is the Managing director of Cooplife Company Limited and Director- Studies in Co-operative Insurance Training Academy.
Co-Operative Insurance Co. Ltd

ANNUAL REPORT - 2018CO-OPERATIVE INSURANCE COMPANY 29
Mr. A. D. T. S. Palitha Director
Mr. A. D. T. S Palitha is a B.Com (Special) Degree graduate of University of Kelaniya. He is also a member of Institute of Chartered Accountants of Sri Lanka (ACA). Currently he is the partner at TSP Associates, Chartered Accountants.
Mr. J.M.V.P. JayasooriyaDirector
Mr. J.M.V.P. Jayasuriya holds a Bachelor of Arts Degree and a Master of Arts (Sociology) Degree from University of Kelaniya. He is the Chairman of Galigamuwa Multi-Purpose Co-operative Society Limited and a Director of Kegalle District Co-operative Rural Bank Union, District Co-operative Council of Kegalle. Also he is a Director of Cooplife Insurance Limited.
Mr. P. P. D. S. KularathneDirector
Mr. P.P.D.S. Kularathne is the former Chairman of Paduwasnuwara Multi-Purpose Co-operative Society and the former Managing Director of Puttalam Salt Limited. He is also former Director of Wayamba Co-operative Rural Bank Union and Kuliyapitiya District Co-operative Council.
Mr. S. S. WeerasekaraDirector
Mr. S.S. Weerasekara is the Chairman of Weligama Multi-Purpose Co-operative Society Limited, Vice Chairman of National Co-operative Council of Sri Lanka and Chairman of Matara District Tea Producers Co-operative Society Union. He is also the Vice Chairman of Matara District Co-operative Rural Bank Union and Director of Matara District Co-operative Council.
Mr. D.L. SamarawickramaDirector
Mr. D.L. Samarawickrama is the Chairman of Jayawardhanapura Multi-Purpose Co-operative Society Limited. Also he is a director of Colombo District Rural Bank Union, Colombo south Co-operative union and Cooplife Insurance Limited. He serves as the Treasurer of the Public Service Co-operative Thrift and Credit Co-operative Society.
ANNUAL REPORT - 2018CO-OPERATIVE INSURANCE COMPANY30
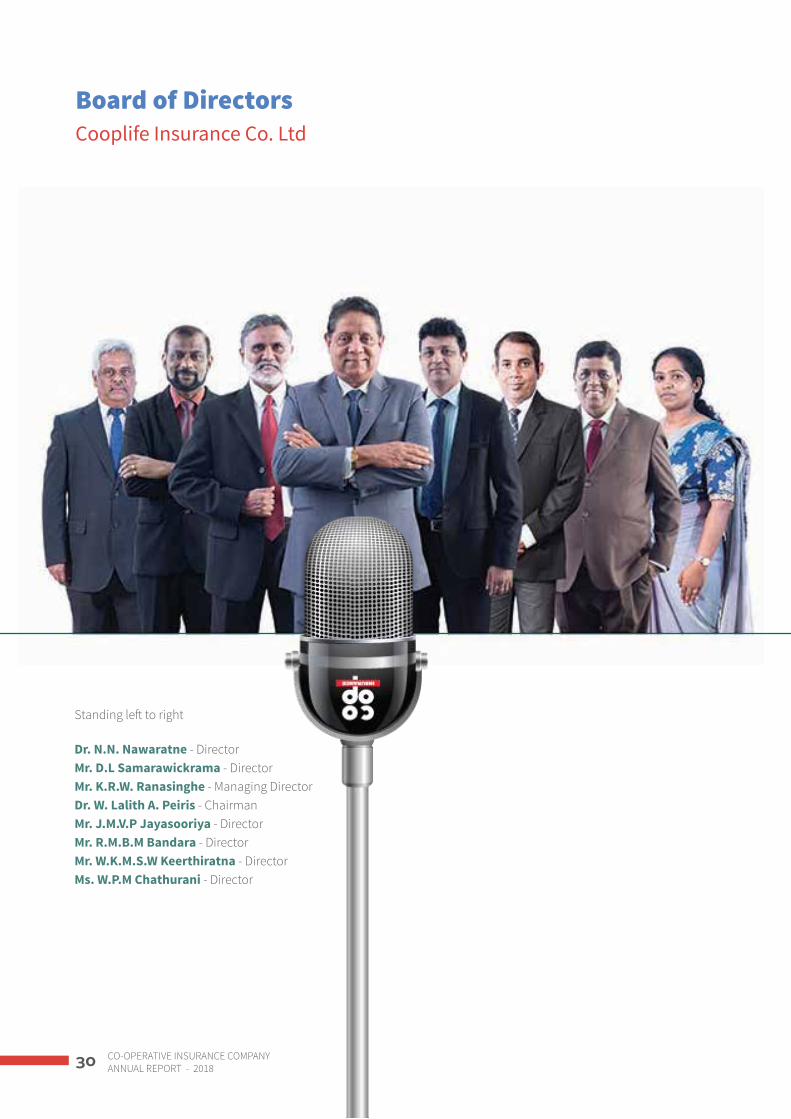
Board of DirectorsCooplife Insurance Co. Ltd
Standing left to right
Dr. N.N. Nawaratne - DirectorMr. D.L Samarawickrama - DirectorMr. K.R.W. Ranasinghe - Managing Director Dr. W. Lalith A. Peiris - ChairmanMr. J.M.V.P Jayasooriya - DirectorMr. R.M.B.M Bandara - DirectorMr. W.K.M.S.W Keerthiratna - DirectorMs. W.P.M Chathurani - Director

ANNUAL REPORT - 2018CO-OPERATIVE INSURANCE COMPANY 31
Dr. W. Lalith A. PeirisChairman
Dr. W. Lalith A. Peiris is the Chairman of the Co-operative insurance Company Limited, National Co-operative Council of Sri Lanka, Wennappuwa Multi-Purpose Co-operative Society Limited and Chilaw District Co-operative Council. He is also a Director of Sri Lanka Co-operative Rural Bank Federation and National Institute of Co-operative Development - Polgolla. He also the Chairman of Co-operative Insurance Training Academy.
Mr. K.R.W. RanasingheManaging Director
Mr. Wasantha Ranasinghe is a Fellow Member of the Institute of Chartered Accountants of Sri Lanka (F.C.A) and the Society of Certified Management Accountants Sri Lanka (FSCMA). He is also a member of the Institute of Data Processing Management UK (LIDPM). He holds an MBA, PIM and B.Sc. Management (Special) Degree from University of Sri Jayawardenepura. His experiences extends over 30 years in public and private sectors. He served as CEO and CFO in Laugfs group and also he is a former Director of Laugfs group Sri Lanka.
He is a Director of Prime Engineering Lanka (Pvt) Ltd and the Sirioya Hydro Power (Pvt) Ltd. Mr. Wasantha Ranasinghe is the Managing director of Co-operative insurance Company limited and Director- Studies in Co-operative Insurance Training Academy.
Mr. D.L. SamarawickramaDirector
Mr. D.L Samarawickrama is Chairman of Jayawardhanapura Multi-Purpose Co-operative Society Limited. Also he is a director of Colombo District Rural Bank Union, Colombo south Co-operative union and Co-operative Insurance Company Limited. He serves as the Treasurer of the Public Service Co-operative Thrift and Credit Co-operative Society.
Dr. N.N. NawaratneDirector
Dr. N.N. Nawaratne Graduate from the University of Sri Jayewardenepura and obtained his Ph.D. in Business and Commerce from Keio University Japan. Dr. N.N. Nawaratne has rendered his services as an Accountant for the Govt. Service and later as a company Director and also a Senior Lecturer to a host of Universities.
Mrs. W.P.M. ChaturaniDirectress
Mrs. W.P.M. Chaturani is a graduate of the University of Colombo. She is a member of the Institute of Chartered Accountants of Sri Lanka and Certified Management Accountants of Sri Lanka. She further extends her professional involvement as an Audit Manager to PE Mathew & Company.

ANNUAL REPORT - 2018CO-OPERATIVE INSURANCE COMPANY32
Board of Directors
Cooplife Insurance Co. Ltd
Mr. J.M.V.P Jayasooriya Director
Mr. J.M.V.P. Jayasuriya holds a Bachelor of Arts Degree and a Master of Arts (Sociology) Degree from University of Kelaniya. He is the Chairman of Galigamuwa Multi-Purpose Co-operative Society Limited and a Director of Kegalle District Co-operative Rural Bank Union, District Co-operative Council of Kegalle. Also he is a Director of Cooplife Insurance Limited.
Mr. W. K. M. S. W. KeerthirathneDirector
Mr. W. K. M. S. W. Keerthirathne is the Chairman of Kirindiwela Multi-purpose Co-operative Society Ltd. and has rendered his leadership skills to many organisations including Government bodies.
Mr. R. M. B. M. BandaraDirector
Mr. R. M. B. M. Bandara is the Chairman of Polonnaruwa Multi-Purpose Co-operative Society Ltd., Vice Chairman of Polonnaruwa District Co-operative Rural Bank Union Limited. He also a Director of Polonnaruwa Dist. Co-operative Council and Co-operative Rural Bank Federation. Mr. Bandara is the Chairman of North Central province Industrial Development authority.

ANNUAL REPORT - 2018CO-OPERATIVE INSURANCE COMPANY 33
Corporate Management TeamCo-Operative Insurance Co. Ltd
Mr. Wasantha RanasingheManaging Director
Mr. Pubudu WimalarathneChief Operating Officer/
Principal Officer
Mr. Laksiri NawaratneChief Financial Officer
Mr. W.H. SomathilakeConsultant
Mr. L.A.N.C. WeerasingheAGM- Marketing Operations
Mrs. Dilrukshi BaduraliyaAGM - General Insurance
Mr. Vipul De SilvaAGM - Motor Insurance
Mr. Ravi RathnayakeManager - Information
Technology

ANNUAL REPORT - 2018CO-OPERATIVE INSURANCE COMPANY34
Mr. Sumith AmarasingheManager - Human Resources
Ms. Preethimali WijeramaManager - Legal
Mr. K.M. JayasundaraAGM - Regional Sales
Mr. D.S. PallegamaAGM - Regional Sales
Mr. M.N.D. De SilvaManager - Adminstration
Mrs. T.S. RasanjaleeAsst. Manager - Re-insurance
Corporate Management Team
Co-Operative Insurance Co. Ltd

ANNUAL REPORT - 2018CO-OPERATIVE INSURANCE COMPANY 35
Management TeamCooplife Insurance Co. Ltd
Mr. Wasantha RanasingheManaging Director
Mr. W.G.C.S.DharamasenaChief Operating Officer/
Principal Officer
Mr. L.S.R. De SilvaGM-Sales & Marketing
Mrs. Sripali Bamunuarachchi
AGM-Life
Mrs. W.A.L.W. PereraFinance Manager
Mrs. G.N. KettipearachchiManager- Underwriting &
Operations (Life)
Mr. S.G. RathnapalaAGM - Zone 01
Mr. H.M.R. KarunarathneAGM - Zone 02

ANNUAL REPORT - 2018CO-OPERATIVE INSURANCE COMPANY36
Mr. R.M.K. RajakarunaRegional Manager
Mr. B.S. MendisAsst. Accountant
Mr. S.N.W.M.J.L. Semasinghe
Regional Manager
Mr. A. RanjithRegional Manager
Mr. P.D.K.M. DewappriyaRegional Manager
Mr. A.C.K.K. SilvaAsst. Manager - Training
Management Team
Cooplife Insurance Co. Ltd
ANNUAL REPORT - 2018CO-OPERATIVE INSURANCE COMPANY 37
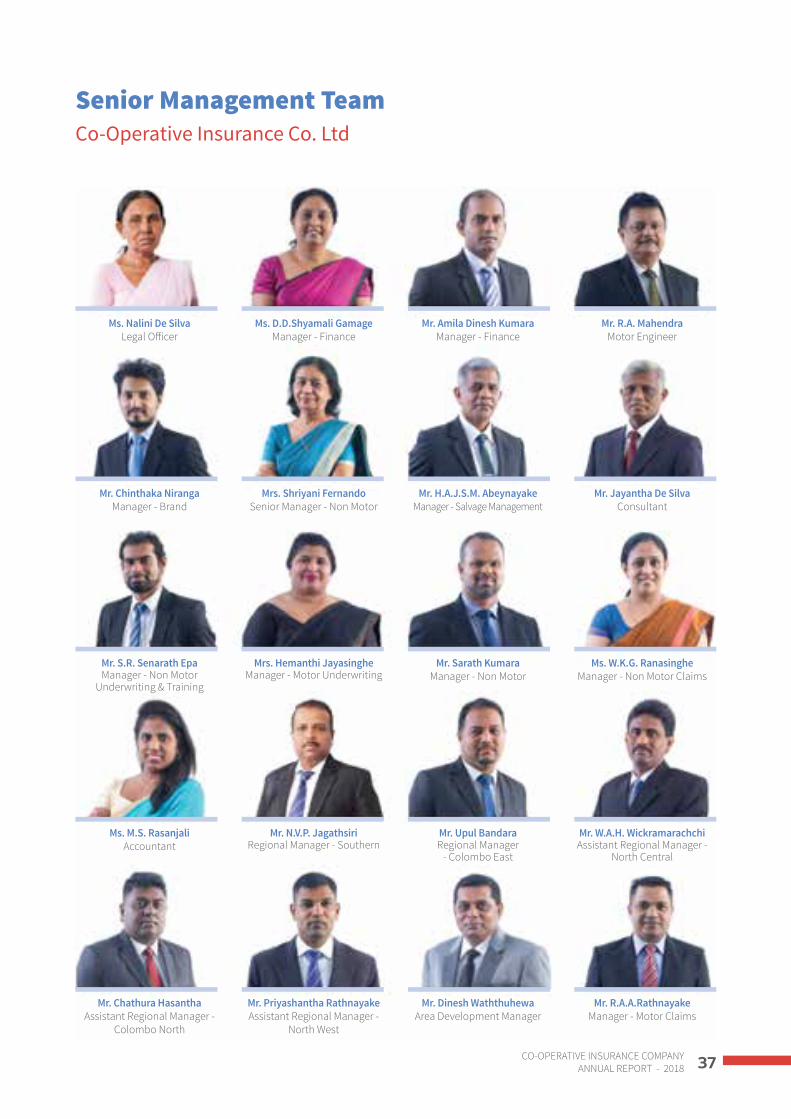
Senior Management TeamCo-Operative Insurance Co. Ltd
Ms. Nalini De SilvaLegal Officer
Ms. D.D.Shyamali GamageManager - Finance
Mr. Amila Dinesh KumaraManager - Finance
Mr. R.A. MahendraMotor Engineer
Mr. S.R. Senarath EpaManager - Non Motor
Underwriting & Training
Mrs. Hemanthi JayasingheManager - Motor Underwriting
Mr. Sarath KumaraManager - Non Motor
Ms. W.K.G. RanasingheManager - Non Motor Claims
Mr. Chinthaka NirangaManager - Brand
Mrs. Shriyani FernandoSenior Manager - Non Motor
Mr. H.A.J.S.M. AbeynayakeManager - Salvage Management
Mr. Jayantha De SilvaConsultant
Ms. M.S. RasanjaliAccountant
Mr. N.V.P. JagathsiriRegional Manager - Southern
Mr. Upul BandaraRegional Manager
- Colombo East
Mr. W.A.H. WickramarachchiAssistant Regional Manager -
North Central
Mr. Chathura HasanthaAssistant Regional Manager -
Colombo North
Mr. Priyashantha RathnayakeAssistant Regional Manager -
North West
Mr. Dinesh WaththuhewaArea Development Manager
Mr. R.A.A.RathnayakeManager - Motor Claims

ANNUAL REPORT - 2018CO-OPERATIVE INSURANCE COMPANY38
Mr.A D ParanavithanaManager - Technical Operations
Mr. Suraj N FernandoManager - Corporate Division
Ms. M E K FernandoManager - Motor Claims
Mr. M.J.K. PereraManager - Motor Claims
Ms. Nodeesha GunawardeneAssistant Manager - Human
Resources
Ms. Nisha EkanayakeAssistant Manager - Marketing
Ms. T.A.M.T.L. WickramasingheAssistant Manager - Non Motor
Claims
Ms. L.A.D.S. LiyanarachchiAssistant Manager - Non Motor
Mr. J.S.P. KumarAssistant Manager -
Administration
Mr. A.N.M. De AlwisAssistant Manager - Motor
Claims
Mr. K.W.M.D. LalendraAssistant Manager - Broker
Mr. D.G.S.C. KarunathilakeAssistant Manager - Motor
Claims
Mr. A.V.A. MadushanAssistant Manager - Motor
Claims
Senior Management Team
Co-Operative Insurance Co. Ltd

ANNUAL REPORT - 2018CO-OPERATIVE INSURANCE COMPANY 39
Co-Operative Insurance Co. LtdBranch Management Team
Mr. Venura KrishanthaHomagama
Mr. M. MallwarachchiMaharagama
Mr. R.M.S.K. Rathnayake Anuradhapura
Ms. A.I. BandaraMatara
Mr. Charitha JayasekaraGampaha
Mr. K.A.R.L. Kuruppu (ADM)Kaluthara
Mr. P.P.K. JayasingheAmbalanthota
Mr.Kamal JeerasingheAkuressa
Mr. L.R.B. GunawardaneKiribathgoda
Mr. P.K.L.P. PeramunaEmbilipitiya
Mr. N.A.S.T. NarasingheKurunagala
Mr. Ranjan DayaratneRathnapura
Mr. P.R.A.B. UdurawanaKandy
Mr. M.M.D.P.T. PereraMalabe
Mr. I.P.J. KappurugeGalle
Mr. P.M.S.P. WijesingheBalangoda
Mr. W.M.S. BandaraNikaweratiya
Mr. Upali WickramasingheAvissawella
Mr. Nishantha FernandoNegombo
Mr. Roshan PereraCorporate Branch

ANNUAL REPORT - 2018CO-OPERATIVE INSURANCE COMPANY40
Mr. M.L.T.L.N. PereraMetro Branch
Mr. K.K.S. ChanakaPiliyandala
Mr. H.M.N.P PriyankaraKegalle
Mr. Srilal OwitimullaAmbalangoda
Mr. Tiral KarunathilakeMathugama
Mr. J.H.R.K. JayamahaPuttalam
Mr. GunasekaraKekirawa
Mr. L.J.L. JayasingheNittambuwa
Mr. M.F.M. NumaisTrinco
Mr. S.M.P. PriyankaraNugegoda
Mr. A.D. KanishkaHorana
Mr. A.R.R. RajakarunaMatale
Mr. H.K. JayanthaDeniyaya
Mr. Shane AllapichchaiAmpara
Mr. T. Anoop (ADM)Mannar
Mr. G.H.A. SanjeewaBattaramulla
Mr. S.B. SampathBandarawela
Ms. P.H.M.S. PereraJa Ela
Mr. G.D. KariyawasamNeluwa
Mr. R.J.W.N. RajapaksheKaduwela
Branch Management Team
Co-Operative Insurance Co. Ltd

ANNUAL REPORT - 2018CO-OPERATIVE INSURANCE COMPANY 41
Mr. D.D.C. FernandoKuliyapitiya
Mr. Indika WijesingheKatugastota
Mr. R.A.G.C. RajapakshaKadawatha
Mr. H.M. KarunarathneThambuttegama
Mr. P.A. WeraniyagodaElpitiya
Mr. L.H.A. KumaraKalawana
Mr. H.R.A. RuwanthaKirindiwela
Mr. H.L. RajawasamKarapitiya
Ms. I.K. PereraPostal Division
Mr. G.G.J.A. WimalasenaGampola
Mr. S.D. Hasantha SamarawilaDankotuwa
Mr. A.A.P. KumaraRikillagaskada
Mr. D.M.M.S.K. DissanayakeGiriulla
Mr. A.P.M.P. JayasekaraGalewela

ANNUAL REPORT - 2018CO-OPERATIVE INSURANCE COMPANY42
Our Business Model
FINANCIAL CAPITAL• Rs. 1,430 Mn. Stated Capital
• Rs. 1,128 Mn. Retained Earnings and Other Reserves
• Rs. 269 Mn. Operating Cash Flows
• Rs. 4,864 Mn. Investment Portfolio
HUMAN CAPITAL• 1354 Talented Employees
• Rs. 3 Mn. Invested in Training and Development
• Training academy for continuous improvement of employees
Risk AssessmentCreating and implementing appropriate risk strategies to achieve strategic objectives while ensuring the maximum management of key operational risks.
Investment ManagementUse of sufficient and surplus funds generated through insurance business and returning the right returns to shareholders and increased benefits to customers
Claim Processing Improved claim settlement processes with the use of digital and information technologies for reducing settlement times
ICT DevelopmentDeveloping internal systems for improving process efficiencies and reducing service times for the benefit of customers and employees
Product DevelopmentDeveloping and revamping product portfolio to offer solutions with competitive features and pricing to match customer needs.
Regulatory CompliancesAdherence to regulations and supporting regulatory decisions in the industry, for the common betterment of stakeholders
Policy UnderwritingEfficient and accurate policy underwriting based on policy buyer’s risk exposures and assigning the right pricing
Continuous Training and RetentionEmpowering and developing employees’ knowledge, skills and inward values while inspiring self-driven commitment to being longstanding employees.
INTELLECTUAL CAPITAL• Experienced Board and Competent Corporate
Management
• Co-op brand which is closer to the people
• Experienced Workforce
MANUFACTURED CAPITAL• Rs. 1,139 Mn. Investment in Property Plant & Equipment
• Branch Network
- 102 General Insurance
- 44 Life Insurance
SOCIAL AND RELATIONSHIP CAPITAL• 363 Field Staff
• Continuous Investment in Community Projects
• Strong Reinsurance Back up
• Eminent Banking Panel
• Hospital Network for Cashless indoor treatments
CAPITAL INPUTS VALUE CREATION MODEL
GROWTH STRATEGY
Vision
To be an organisation that will stand ‘united’ with its customers to the very end.
Mission
To be ever mindful of the needs of our customers and thereby making ‘true protection’ a way of life via the provision of innovative, yet affordable insurance solutions which conform to the highest ethical and moral standards.

ANNUAL REPORT - 2018CO-OPERATIVE INSURANCE COMPANY 43
FINANCIAL• 41% Increase in Net Assets per Share
• 23% Growth in Reserves
• 15.24% Increase in Return on Equity
• Rs. 411.9 Mn. Profitability
MOTOR INSURANCE PRODUCTS
LIABILITY INSURANCE PRODUCTS
FIRE INSURANCE PRODUCTS
MARINE CARGO & HULL INSURANCE PRODUCTS
MEDICAL INSURANCE PRODUCTS
ENGINEERING INSURANCE PRODUCTS
MICRO INSURANCE PRODUCTS
LIFE INSURANCE PRODUCTS
HUMAN• Increase in Employee Training
• Increase Revenue per Employee
• 97.73% Employee Retention
• Increase in value added per Employee Up to Rs. 1.28 Mn
INTELLECTUAL• New software solutions for claims management, administrations
and HR
• Networking software connecting 102 CICL Branches including 23 New Branches
• Natural Depletion of energy by converging to low consumption lighting.
• In the process of converting to paperless office.
MANUFACTURED• 23 new branches
• New ICT equipment
SOCIAL AND RELATIONSHIP• 18% Revenue growth
• Increased customer retention
• Rs. 5,369/- average policy value
• Rs. 2,181 Mn. claims paid
OUTPUTS OUTCOMES

ANNUAL REPORT - 2018CO-OPERATIVE INSURANCE COMPANY44
Contribution to able Development
CONTRIBUTION TO SUSTAINABLE DEVELOPMENTEnvisioning a sustainable future for all on the planet and addressing global challenges faced by the world’s growing population, the UN developed 17 interconnected goals that falls under the resolution 70/1 of the UN general assembly – “Transforming our World: the 2030 Agenda for Sustainable Development”. The goals were adopted by all member nations of the UN in 2015.
As a company that was established through the principles and ethics of the co-operative movement in Sri Lanka with community based values that create sustainable growth for customers in the rural and urban communities, CICL views the Sustainable Development Goals for their importance and necessity in creating
a planet that’s healthier and safer for all to enjoy a brighter future. In realising its overall purpose, CICL’s contributions to the society are aligned with that of several key SDGs.
Goal 1: No Poverty y With a larger base of customers in the rural and
village-based communities of Sri Lanka, with most being entrepreneurs of small and medium scale businesses we are in the service of ensuring the stability of their assets against financial obligations and risk exposures; contributing towards poverty alleviation and financial independence. Low premium policies with high returns and improved customer service to facilitate this development.
y When recruiting, we target rural areas in order to empower families in rural communities.

ANNUAL REPORT - 2018CO-OPERATIVE INSURANCE COMPANY 45
Goal 3: Good Health and Well-being y Our employees are encouraged to stay healthy.
Participation in sports endeavors are encouraged as CICL leather and softball cricket teams are provided with the capacity and investment for training.
y Conduct Zumba classes once a week (free of charge) y Conduct a personal grooming session for employees
Goal 4: Quality Education y Employees are provided the resources to receive
self-learning as well as professional and personal development.
y CICL’s online learning portal allows employees and students of CITA to access a variety of course and learning material for self-learning and in preparing for industry exams
y The CICL Training Academy (CITA) is registered under the Tertiary Education Authority and is also affiliated with the Indian Insurance Institute.
y CITA provides exposure to work life experiences besides technical training.
y Employees and Management is provided with the opportunities to participate in overseas training sessions and forums.
Goal 5: Gender Equality y We have a balanced mix of male and female
employees within the workforce. Our male female employee ratio is 1.3: 1.
y We are an equal opportunity employer with payment structures being equal for both women and men in similar designations.
y We have an approach of zero tolerance for sexual harassment.
Goal 6: Clean Water and SanitationCICL is responsible for the well-being of our employees. Therefore, we ensure that all provisions made by CICL are up to the best safety and hygiene standards.
y Purified water is provided to all CICL and Cooplife employees across Corporate Offices and at all branches.
y Sanitation facilities across all CICL owned premises are ensured with the highest standards.
Goal 7: Affordable and clean energy & Goal 11: Sustainable Cities and Communities
y We are ensuring lesser use of energy and power while reducing our use of paper, leading towards a more sustainable approach to energy efficiency and sustainable workplace.
y All new branches are designed to be energy efficient, saving on energy and lighting
y New branches utilise LED bulbs and energy economical equipment.
y Our core business processes are converted to online based platforms, that connects all branches while gradually eliminating the need for the use of physical documentation, creating a much sustainable use of energy and resources.
Goal 8: Decent Work and Economic Growth Prospects of growth are enjoyed by our employees within a positive work environment.
y We are compliant with all labor regulations y Work environment across our offices are enhanced
to make work life positive for all employees with potential for learning and career growth.
y We make timely and consistent contribute 8% to the employee provident fund and 3% to the employee trust fund.
Goal 9: Industry, Innovation and Infrastructure y CICL pursues continued development of Information
technological systems with a growth strategy that is conducive with the demands of an evolving digital age and the requirement for efficient work processes.
y CICL has also enabled and enhanced access to information across our branch network and offices, allowing employees their right for knowledge and personal development

ANNUAL REPORT - 2018CO-OPERATIVE INSURANCE COMPANY46
Our Products and Services
SorabiyaBurglary Insurance
Pashu SampathLivestock Insurance
Vimana - SirimaduraHouseholders Comprehensive Insurance
SahanayaCoop Shakthi Micro Insurance
Maga SurakumaMoney in Transit Insurance
Instant MotorComprehensive Motor Insurance
Instant Motor MiniComprehensive Motor Insurance for Threeweelers and Motorcycles
SesathaTrade Combined Insurance
SuwapathSurgical & Hospital Insurance
GiniCommercial Fire Insurance
SaranaPersonal Accident Insurance

ANNUAL REPORT - 2018CO-OPERATIVE INSURANCE COMPANY 47
Co-operative Insurance Company LimitedCooplife Insurance Limited
We deliver insurance products, services and support, through an island wide network of multiple service delivery channels. Our services delivery channels include our branch network, our call centre, service centres operated in collaboration with Co-operative societies and a network of independent business partners.
In 2017, we added a new service delivery channel through the national postal system by entering into a partnership with the Sri Lanka Postal Department to facilitate the sale of CICL products at all post offices and sub-post offices in the country.
We also expanded our branch network by adding 23 new CICL branches.
Our Channels and Branch Network
Branch network of 102 branches
546 post offices and sub post
offices
Call Centre117 Co-operative owned Service Centres
Independent business partners
CICL Service Delivery Channels

ANNUAL REPORT - 2018CO-OPERATIVE INSURANCE COMPANY48
Our Channels and Branch Network
CHANNELS AND BRANCH NETWORKCICL now operates through one of the strongest branch networks in the industry. We are now located across all 25 district of the country and all 9 provinces with the majority of CICL owned branches residing in the western province.
Province
Number of Post Offices
Number of service locations (Branch
Network)Number of
Post Offices
Western Province 31 38 139Central Province 15 09 49North Central 09 04 39North Western 25 10 54Sabaragamuwa 13 05 35Southern 21 11 57Uva 03 06 56Eastern Province Nil 06 51North Province Nil 05 66
CICL OWNED BRANCH NETWORKIn 2018, we opened 23 new branches expanding our branch network, resulting in the growth of our physical expansion that is unparalleled to that of any other financial year. Currently, we operate through 102 branches, islandwide, serving general insurance products and services while our subsidiary Cooplife branches offer life insurance solutions.
Our network of life insurance branches comprise of 44 branches, located in some of the most strategic geographical areas across Sri Lanka. Branch locations are selected for optimum visibility as well as proximity to major locales and towns with a higher footfall.
Our vast presence and access to remote locations has made us the insurer with the 3rd largest distribution network with company owned service locations across the country. Our network of comprehensive distribution channels include multiple, islandwide delivery channels which include our branch network, call centre services, service centres operated alongside a network of co-operative societies and a network of independent distribution partners.
POSTAL SERVICE NETWORKIn 2017, we expanded our reach and presence by entering a strategic partnership with the Sri Lanka Postal Department which now facilitates the provision of our products and services through post offices and sub post offices. As of 2018, 540 post offices and sub post offices extended our already substantial reach, across further remote locations of the island.
CO-OPERATIVE SOCIETY OWNED SERVICE CENTRESOur service network also includes 117 Co-operative owned service centres, located across the country, reaching a vast rural community, providing access to our products and services in both general and life insurance.
INDEPENDENT BUSINESS PARTNERSCICL also operates through a group of independent business partners or brokers who take our products across to target segments, creating a much wider network that enhances our reach within the population.
OUR REACHOur branch network and reach is now present across all 25 districts, covering all major towns, cities and localities. Newly added branches are located in the areas of Akkaraipattu, Aluthgama, Bibila, Baddegama, Colombo Metropolitan, Dankotuwa, Elpitiya, Galewela, Giriulla, Kadawatha, Kalawana, Karapitiya, Kirindiwela, Kolonnawa, Melsiripura, Neluwa, Nugegoda South, Panadura Potuvil, Rikillagaskada, Thambuttegama, Wellawaya and Welimada.
CALL CENTRE CICL updated and upgraded our call centre systems in the Financial Year under review, for better serving our customers across the country. Fully fledged and fully equipped CICL call centre operates at maximum capacity with customer queries handled 24 hours of the day, 7 days a week. At the instance of a motor related accident, our call centre operatives keep a constant tab on the customer, contacting them every 15 minutes until an assessor arrives at the location for assessing the damage to the vehicle.

ANNUAL REPORT - 2018CO-OPERATIVE INSURANCE COMPANY 49
Changes to Our Material Capitals in 2018
CHANGES TO MATERIAL CAPITALSOur business model and our value creation process adopt five capitals according to their ability to create value for our stakeholders.
y Financial capital y Human capital y Social and Relationship capital y Intellectual capital y Manufactured capital
Manufactured capital: Our manufactured capital base includes our fully owned Head Office building in Colombo 14, physical assets owned by the Company, such as office equipment, furniture and vehicles. Apart from which CICL and Cooplife does not occupy inventory.
Social capital: Brand visibility and goodwill is used in assessing our social capital and is enhanced through our own branch network, service centres of Cooplife and CICL, our dedicated call centre and through our product portfolio. In addition, our network of diversified channel partners also enable us to increase our social capital; this includes our network of independent business partners, including field officers, institutional agents and insurance brokers, dedicated to promoting our products, thus enhancing brand visibility.
Natural capital: Not considered as a material capital that adds significance to our value creation model, as CICL does not own or consume natural capitals. Regardless of which we continue to be environmentally responsible across our operations for enabling a sustainable business model.
MATERIAL CAPITALS AND CHANGES IN 2018Changes to our material capitals during the reporting period of 1st January 2018 to 31st December 2018 are summarised below:
Our financial capital base grew adequately, stemming from changes in ordinary share capital, shareholder equity and revenues. This facilitated company growth objectives and short term plans within the year.
Manufactured Capital expanded within the year, as 23 new branches were established on rented property, fully equipped with furniture, ICT infrastructure and complete necessities. The physical expansion has
enhanced brand visibility and further mobility within the same geographic locations and market segments. The expansion has enabled CICL to raise our level of customer service and customer convenience. All new branches are fully integrated with our core business systems, for efficient and decentralised conducting of operations. The branches provide seamless and swift customer service with faster claims settlement as well as routine transactions.
Intellectual Capital was enhanced drastically with further development in replacing manual paper based work processes with core business systems and eliminating physical maintenance of records by digitising documents for speedy and easy access. HR and administration system as well as our online Learning Portal was further enhanced.
Human Capital was enhanced as employee skills knowledge base and capacities were developed to align with organisational growth strategies. Training and knowledge enhancement seminars as well as foreign training opportunities were provided to employees across various technical and managerial levels. These in turn has helped enhance their abilities to improve the quality of their work and service level expectations.
Social capital was also expanded during the year. Corporate performance indicators on measuring our social capital is done in terms of brand visibility and company goodwill rendered across employees, stakeholders and society in general. Brand visibility is assessed through CICL’s service centres, our 24/7 call centre and through our diversified product portfolio. Our network of Service Centres utilised in partnership with Co-operative Societies and which operate across the island also enable brand visibility. CICL continues to build a stronger network of independent business partners which include field officers, institutional agents and insurance brokers that continue to promote our products and enhance brand visibility.
KEY CHANGES TO CAPITALS IN 2018Please refer the ‘Managing Our Capitals’ section in pages 67-82 for details regarding changes to our material capitals during the year.

ANNUAL REPORT - 2018CO-OPERATIVE INSURANCE COMPANY50
Changes to Our Capitals in 2018
Financial Capital y Ordinary share capital y Retained profits y GWP y Investment income
Human Capital y Permanent employee base
Social Capital y Branches and Call Centre y Product portfolio y Business partners y Co-operative service centre
network y Co-operative representatives
Intellectual capital y Customised Software y Systems Developed and
upgraded in-house
Manufactured Capital y CICL Head Office Building y CICL Branch Office Buildings y Vehicles y Furniture y Equipment
y Share ownership in subsidiary Cooplife was changed due to scrip dividend distributed by Cooplife Insurance Ltd from 82% to 81.8%.
y Share capital increased by Rs. 169.94 Mn, from Rs. 1,260.25 Mn to Rs. 1,430.19 Mn due to shareholders reinvesting dividends.
y Shareholders’ equity increased by Rs. 110.08 Mn y Retained profits increased by Rs. 102.85 Mn from Rs. 553.31 Mn to
Rs. 656.16 Mn. y Gross Written Premium income increased by 23% year on year to
Rs. 3,750.83 Mn. y Investment income increased by Rs. 83.90 Mn from Rs. 261.65 Mn to
Rs. 345.55 Mn. y We have maintained significant long term debts at zero. y Balance sheet expanded by Rs. 1,075.36 Mn, From Rs. 6,464.16 Mn to Rs.
7,539.52 Mn
y Total permanent employees increased by 27.2% y Total permanent employees as at end December 2018 was 1093 y Recruited new management staff to guide and lead the business y Investment in training increased during the year 2018
y 23 new branches were opened, expanding CICL’s branch network to 102 y No. of business partners increased by a significant amount y Marketing and promotional expenditure increased to enhance the image
of the Company
y Invested significant amount on in-house software development y IT skill base expanded with new recruitments y Developed new IT solutions to support core functions of administration,
claims management, HR and customer support y Networked all 102 branches including 23 new branches opened in 2018
y Total value of manufactured capital base (CICL owned buildings, equipment, furniture and vehicles) increased by 3% from Rs. 1,102.08 Mn to Rs. 1138.59 Mn

ANNUAL REPORT - 2018CO-OPERATIVE INSURANCE COMPANY 51
The Co-operative Insurance Training Academy
CO-OPERATIVE INSURANCE TRAINING ACADEMY (CITA)Registered under the Tertiary and Vocational Education Commission (TEVC) of Sri Lanka and registered as a limited liability company, CITA provides certificate level qualifications and training to students in addition to CICL employees, empowering them with a professional qualification that adds greater value to their professional life and career.
Established in 2015 and registered as a Private Limited liability company in 2018. This is the first government approved training academy in Sri Lanka. CITA is 100% CICL owned training academy, conducted in partnership with the Insurance Institute of India, offering a widely accepted certification and training to CICL employees. Course followers are also exposed to professional industry operations giving them the full offering of an interactive learning experience.
In 2018, 50 of our employees obtained certification level training and many students received training related to technical aspects of the company’s insurance processes. In 2017, a new training facility was inaugurated in close proximity to CICL head office, offering a dedicated location for conducting training and class room activities.
CITA now offers diploma level certification to employees and to individuals who aspire to obtain an internationally recognised insurance certification. With a focus on education and research in insurance, CITA is focused on developing learner skills and personalities, including development of inward traits, allowing them to be empowered through attitudes, knowledge and skill enhancement. In a constantly competitive and demanding business world, CITA’s vision is to develop
our students and employees to meet professional and personal challenges with knowledge and integrity.
CITA currently focuses in three core area;
1. Certificate courses
2. Diploma courses
3. Professional skills development, advisory and competency enhancement
Currently, CITA has 50 students following certificate courses and 20 following diploma courses.13 students Successfully graduated in 2018.
CITA provides CICL employees and learners the options of following,
Certificate Courses in Insurance and Marketing
y Diploma in Insurance y Higher Diploma in Insurance y Diploma in Business Management y Technical Skills Development Series (TSD) y Sales Skills Development Series (SSD) y Personal Skills development Series (PSD)


ANNUAL REPORT - 2018CO-OPERATIVE INSURANCE COMPANY 53
Management Discussion & AnalysisStakeholder Engagement & Social Capital 54Our Growth Strategy & Resource Allocation 58External Environment 62Operational Review 64
MANAGING OUR CAPITALS Financial Capital 67 Manufactured Capital 72 Intellectual Capital 73 Human Capital 75 Social Capital 78

ANNUAL REPORT - 2018CO-OPERATIVE INSURANCE COMPANY54
Stakeholder Engagement and Social Capital
STAKEHOLDER ENGAGEMENT
EmployeesOur employees include both
CICL and Cooplife, and are a diverse mix of individuals
from rural and urban communities
Community A company fully owned by the
Sri Lanka Co-operative sector, we are committed
to providing benefits to the wider Sri Lankan
community.
Co-operative Societies (Shareholders)
Our shareholders are multi-purpose Co-operative societies of Sri Lanka
CustomersOur customer base is a mix
of cross segments from across the island; with a
majority from rural-based communities.
Regulatory AgenciesWe are compliant with
rules and regulations from insurance industry
regulator IRCSL and other financial and business
regulators.
STAKEHOLDER ENGAGEMENTOur stakeholders are the backbone of both CICL and Cooplife. Who we are and what we represent is essentially a reflection of what are stakeholders offer and their contributions to the organisation. Our relationship with each and every stakeholder segment is based on a mutual belief system and based on mutual returns.
While our stakeholders provide values that are imperative to us, we continue to offer our promise of sustained value and benefits to each and every segment of our stakeholders across the board, achieving desired outcomes from sustainable business practices.

ANNUAL REPORT - 2018CO-OPERATIVE INSURANCE COMPANY 55
STAKEHOLDER CONTRIBUTIONS
VALUE CREATION FOR STAKEHOLDER
y Shareholders Dispersion of capitals to facilitate corporate growth objectives
y Customers Placing confidence in our products and service
Co-operative Societies (Shareholders)Value created for Shareholders
y A dividend of 185 Mn was distributed by way of new shares to shareholders. y The Annual General Meeting of shareholders was conducted and approval
obtained on numerous matters of importance. y Regular meetings on Company progress were organised to Co-operative societies. y Approval was obtained for all non-routine matters by the Board of Directors.
y Employees Providing knowledge, experiences and growing skills to develop better products and services and
achieving growth objectives for the betterment of all stakeholders y Regulatory Agencies
Providing regulations for overall integrity and stability within the industry y Business Partners
Funneling resources for increasing business volumes and market growth
Community Provides capacities to make a difference in the lives of those in need of assistance and provides access to
the promotion of insurance as source of assistance during financial needs.
Customers Value created for Customers
y Claims of Rs.2,181 Mn paid during the year.. y Fast claim settlement and low premiums, allowing customers product affordability and convenience
in settling claims y Service delivery network increased giving customers’ easy accessibility to our products and services. y Customer complaints were recorded by the Customer Grievance Committee in compliance with IRCSL
requirements. y Service times improved and processing times of claims reduced for customer convenience y Customer care was enhanced through technological improvements.
EmployeesValue created for Employees
y CICL training academy provides internationally recognised professional training, investing in employee skill and career development.
y Activities and facilities for welfare were provided during the year (Please refer the Social Capital section, pages 78 to 82)
y Corporate and Senior management personnel were provided the opportunity for four overseas trainings and workshops (Please refer the Human Capital section, pages 75 to 77)
y Managers and staff selected for a workshop in Claim Identification by Insurance institute of India. y Welfare and leisure activities for work-life balance

ANNUAL REPORT - 2018CO-OPERATIVE INSURANCE COMPANY56
Stakeholder Engagement and Social Capital
VALUE CREATION FOR STAKEHOLDERS
Regulatory agenciesCompliance with Regulatory Requirements
y IRCSL y Central Bank y National Insurance Trust Fund y Companies Registrar y CICL continues to be compliant with all reporting and auditing requirements and
regulations by the IRCSL and other regulatory institutions. y Please refer the ‘Governance and Internal Controls’ chapter for more information.
....Contd.
Business partnersValue created for Business Partners- Brokers- Agents- Field Officers- Reinsurers- Auditors
y Sales Training to better improving customer service and promotion of products y Insights on increasing business growth
CommunityGiving back to the community- A number of activities were conducted for raising our Corporate Social Responsibility.

ANNUAL REPORT - 2018CO-OPERATIVE INSURANCE COMPANY 57
STAKEHOLDER ENGAGEMENT
We maintain a constant two-way dialogue with all our stakeholders across the year, exchanging corporate objectives, status of target performances as well as discussing concerns and enabling an open environment for solutions; encouraging constructive criticism of material aspects and objectives in creating sustainable value.
Shareholders y Annual general meeting and annual report presentation with Audited Financial Statements y Quarterly Reports to Shareholders y Continuously providing assistance in CSR activities to shareholders (Co-operative Societies)
Customers y 24/7 call centre assistance y Constant communication in the event of an accident till assessor’s arrival y Diversified product portfolio and low premiums y Faster claim settlement y Increasing branch portfolio and geographical spread y Access to information through corporate website
Employees y Staff Annual Awards y Management and staff meetings y Branch-wise meetings y Sales Personnel meetings y Online learning portal and core business systems y Company owned academy for employees (CITA) y Overseas workshop exposure y Outbound training y Technical and sales trainings and workshops y Staff welfare and leisure activities
Regulatory Agencies y Disclosure of financials y Quarterly Submission Of Financial Statements y Response To Needs-Based Requirements
Business Partners Monthly review meetings
y Constant communications y Trainings y Encourage win-win partnership y Encourage ethical conduct
Community y CSR Activities y Employment opportunities y Enhance knowledge by updating corporate website

ANNUAL REPORT - 2018CO-OPERATIVE INSURANCE COMPANY58
Our Growth Strategy and Resource Allocation
OUR GROWTH STRATEGY With higher claim settlements, organic growth that results from a sustainable business growth strategy that also puts us in a position to compete as a smaller player in a competitive industry. All of this is achieved without the use of aggressive marketing and mass communication strategies; CICL has grown sustainably over the years.
With a five year medium-term strategy we review and redefine our strategies to align with external risks including impacts from regulatory requirements and tax regime changes as well macro-economic and market developments. Our competitive advantage is enhanced through the development of our people, by empowering
them through technical and soft skills training and by adopting innovative technological systems and processes that enable faster and agile processing of transactions and business operations.
Our core business systems for life and general insurance, as well as our systems across Claims Processing, Document Management, Human Resources Management and administration services has enabled us to reduce service times and processing times, enabling accelerated customer convenience and better customer communications, both internally and with external parties.
EXPECTED OUTCOMES • Increasing policyholders and new product
acquisitions • Increased customer satisfaction• Increased use of services • Increased speed of service• Faster process time• Reduced claims process time• Reduced wastage of time and resources• Reduced operational costs• Solutions that meet customer needs and price
requirements• Attract new customer and retain existing customers
y Comprehensive benefits and features y Customised products and low premiums y Products targeting all cross segments
y Fully developed and integrated core business systems
y Fully developed HR and admin systems y Fully developed document management system y Comprehensive and adaptive self-learning portal
y Employee training and development y Innovative and interactive digital platforms
(Website, mobile applications etc.) y Wider service channel network (branch expansion,
increase partner and agent network, increase third part delivery channels)
Progressive use of innovative technologies
Competitive product portfolio
Delivering value for money through enhanced customer service

ANNUAL REPORT - 2018CO-OPERATIVE INSURANCE COMPANY 59
KPI Targets for 2018 Actual Performance Targets for 2019
Financial Capital y Increase net profit by 25%. y Increase total GWP by one
billion. y Growth in non-motor
insurance segment y Maintain RBC level of
120%.
y Achieved a net profit growth of 87%
y Achieved GWP growth of 23%
y Achieved a growth of 32% y Able to maintain RBC level
as 180%
y Increase net profit by 25%. y Growth in non-motor
insurance segment y Maintain statutory
required RBC level.
Human Capital y Increase level of skill development programs for employees.
y Provide knowledge on identifying and balancing customers.
y Increase employees across branches
y Establish new methods to improve work efficiency.
y Professional skill development sessions conducted, monthly
y Conducted training sessions for underwriting staff.
y Conducted induction programs for new employees, monthly.
y Conducted training for sales new comers, regional staff ad sales staff.
y Newly recruited staff for fulfilling job capacities new branches.
y System training provided to branch staff.
y Provide employees exposure to technical and sales training
y Increased use of self-learning portal
y Increase training in professional and soft skills development
y Recruit more competent staff for field and sales teams
Intellectual Capital y Shift to a paperless organisation.
y Further improve claim management systems
y Enhance systems to Accommodate industry changes into core insurance system.
y Complete implementation of re-insurance module.
y Continued development of in-house software pertaining to claims, online policies, stores and HR management.
y Continued development of digitised document system.
y Improving core insurance system for high flexibility to address system risks.
y Call center systems were upgraded enhancing customer service.
y Continued development of re-insurance module
y Fully develop core business/insurance systems
y Increase digitisation of documents to the Document Management Systems
y Increase Modules under HR and admin systems

ANNUAL REPORT - 2018CO-OPERATIVE INSURANCE COMPANY60
Social and Relationship Capital
y Monitor brand value and image.
y Offer best in class insurance products and services that meet customers’ needs.
y A brand audit was conducted, gauging brand perception.
y Conduct market research to gauge market perceptions and customer satisfaction
y Increase activities involving business partners (Agents, independent partners and brokers)
y Conduct more CSR initiatives
Manufactured Capital y Further expand branches and service centres, operated under co-operative societies.
y Fully furnish branches and fully equip with ICT infrastructure
y 23 branches added, increasing the network to 102
y All 23, newly opened branches are fully furnished and equipped with modern ICT communications facilities and have already been integrated into the CICL network.
y Expand CICL owned branches and service centered operated by co-operative societies
RESOURCE ALLOCATIONOur allocation of resources spreads across organisational short term and long term strategic objectives, ensuring overall growth across our long term and general insurance businesses.
1
2
3
4
55 Year
Corporate Strategy
Annual Growth Target
Monthly KPIs
Annual Functional
Targets
Annual KPIs
System of Internal Control
Our Growth Strategy and Resource Allocation

ANNUAL REPORT - 2018CO-OPERATIVE INSURANCE COMPANY 61
Resource AllocationsImmediate and Short Term Resource Allocations
Mid to Long term Resource Allocations
Financial capital y Increase capital to facilitate physical expansion.
y Increase shareholder returns. y Increase total assets by 25% y Meet regulatory requirement for
Risk Based Capital Adequacy.
y Enhance CICL’s market value. y Enhance shareholder returns. y Strengthen market position by
capturing market share at a higher rate than competitors
Human capital y New recruitments to support expansion.
y Technical and industry training. y Marketing skill development. y Customer care skill development. y Develop second tier of talent to
enhance employee growth to fill vacancies internally.
y Competitive salaries. y Competitive capabilities.
y Develop leadership pipeline. y Streamline skill base for
specialisations. y Develop as one of the best
insurance teams in the country.
Intellectual Capital y Develop customised software support systems.
y Further develop and add modules to existing core business systems and support systems.
y Increase IT cadre. y Provide web based solutions for
customers. y Establish separate external real time
backup locations. y Integrate online payment gateway. y Transition from manual to digital
systems.
y Transform to a fully paperless organisation.
y Integrate intellectual capital base to add value to market value of Company.
y Develop new product brands and trademarks.
y Develop blue ocean strategies. y Enable customers to complete
processes digitally (online based platform)
Social and Relationship Capital y Provide best customer value against competitors.
y Invest in CICL brand visibility in new market segments.
y Enhance brand equity through community and stakeholder engagements.
y Be the most preferred insurance provider.
y Enhance brand value and image. y Increase relationship building
activities with business partners and brokers
Manufactured Capital y Support branch expansion through manufactured capital acquisition.
y Purchase additional ICT hardware. y Acquire vehicles to support business
growth. y Provision of web base services to
customers
y Selective investments to consolidate operations.

ANNUAL REPORT - 2018CO-OPERATIVE INSURANCE COMPANY62
External Environment
The economy in 2018 grew at a rate of 3.3%, despite the previously anticipated 4.5% in the corresponding year. Unemployment rate within the year stood at 4.2% and Per capital income of the year was at Rs. 621,026. Certain key determinants played a role in the slow development of the economy which continued until the end of the Financial Year. A weak domestic demand continued tightening in monetary conditions and government spending contributed to the weakened performance of the overall economy.
In addition, stagnant fixed investment, lower net exports, weak economic policies and political instability impacted the downward economic environment. The following strategic decisions also played a role in influencing the overall lacklustre performance while continuing to slowdown the economy. Within the year, the government commenced the following.
- Structural reforms supported by IMF which addresses key structural issues in the economy.
- Launch of the new inland revenue act resulting in revenue-based fiscal consolidation
- Introducing an automatic fuel pricing formula for reducing fiscal risks of state owned enterprises.
EXTERNAL SECTOR
The trade deficit widened to USD 8,857Mn during the first ten months of the year when compared to the corresponding time frame in 2017. This was mostly in part due to the higher import expenditure and a relatively marginal growth of imports.
A widening current account deficit was largely in part due to the increase in fuel import expenditure and vehicle and gold importation. However, export earnings improved by 4.7% in 2018 to USD 11.9 billion owing to industrial exports while agricultural and mineral exports decreased. Import expenditure rose by 6%, reaching 22.2% billion. Nevertheless, revenue from service exports and workers’ remittances helped buffer the external current account deficit up to a certain extent.
Bright prospects did however remain to show positive outcomes despite the overall negativity. The tourism sector in particular showed stealth in maintaining its positive growth. Earnings in the year grew by 11.6% bringing revenue of USD 4.4 billion. The country was also named as the no. 1 destination to visit in 2019, creating better prospects for further expansion of the sector’s revenue performance. Remittances dropped marginally by 2.1% in 2018 to USD 7 billion.
EXCHANGE RATE
The CBSL mediated in market activities in order to restrict unsystematic adjusting of the exchange rate and allowed demand and supply dynamics to determine its course.
The exchange rate performance was impacted by the CBSL’s decision to allow markets to determine the rate with less intervention in defending the rupee by supplying foreign exchange from official international reserves. Imports growth and capital outflows of Rs. 159 billion and a strong US Dollar impacted the depreciation of the Sri Lankan Rupee by 16.4% relative to the 2% in 2017.
STOCK MARKET PERFORMANCE
The markets showed lacklustre performance across the year. The ASPI made a loss of 4.9% in comparison to the 2.3% growth in the previous year. The S&P SL also showed a similar trend with a loss of 14.3% in the Financial Year. The average daily turnover was around Rs. 788Mn. at the end of 2018’s 3rd quarter, a drop from that of 2017’s Rs. 915.3Mn. More foreign investors played a vital role in market dynamics than local investors. Money was injected into fixed income securities as interest rate hikes impacted negatively; with money being pulled out of the Colombo Stock Exchange, further deepened by the hike in FED rate.
INFLATION RISE AND INTEREST RATE INCREASE
Headline inflation as measured by the change in the National Consumer Price Index, was at 2.8%, at the end of 2018; this was a retreating level from previous months. Core inflation, increased by 3.1% during the year and is expected to be curbed by defensive monetary policy measures.
The Monetary Board increased the Standing Deposit Facility Rate (SDFR) by 75 basis points to 8.00% along with the Standing Lending Facility Rate (SLFR) of CBSL by 50 basis points to 9.00%. This was conducted under the aim of stabilising inflation at mid-single digit levels for economic recovery.
TIGHTENING MONETARY CONDITIONS
Government security yields underwent a significant increase alongside other market interests which were high in nominal as well as real terms. Credit provided to major economic segments showed signs of sharp rising with accelerated growth in personal loans and advances. Central bank measures are expected to curb the credit growth of the private sector in time to come.
INSURANCE INDUSTRY
In 2018, there were 25 insurance companies Licensed under IRCSL and included 2 composite insurers, 11 General Insurance companies and 12 Long Term (Life) Insurance companies.

ANNUAL REPORT - 2018CO-OPERATIVE INSURANCE COMPANY 63
The overall industry GWP enjoyed a growth rate of 9.9% in the third quarter of 2018, an increase of Rs. 11,757Mn. The aggregated GWP from both Long Term and General Insurance Businesses fetched Rs. 129, 773Mn. Total assets of the industry increased to RS. 588,746Mn. a 7.36% growth from the total assets value of Rs. 548,361Mn witnessed in 2017.
However, growth in Long Term Insurance assets plummeted drastically in comparison to the 13.27% in the third quarter of 2017, while, General Insurance assets amounted to RS. 171,400Mn.
By the third quarter of 2018 total claims paid out by insurance companies across both Long Term and General Insurance businesses were Rs. 59, 639Mn. Claims increased by 17.87% with the value increasing by Rs.25, 214Mn. from the recorded value in 2017. As a percentage of the total GWP, Long Term insurance claims held a portion of 43%, whereas General Insurance recorded a 48% stake in its claims from the total GWP.
By the 3rd quarter of 2018, premium income from insurance brokering companies aggregated to Rs. 6,646Mn which was 5.12% of the total GWP. This included premium income from General and Long Term Insurance Businesses as well as from Reinsurance. The income grew had increased by 7.76% in the third quarter in comparison to the corresponding term in 2017. Premium income from General Insurance business which was Rs. 5,983 Mn (4.61% of GWP) far exceeded that of the income from Long Term Insurance, which was at Rs. 131 Mn, 0.22% of total GWP.
CONTINUED CONSOLIDATIONS
In the year, the Industry witnessed the continuation of the pattern of mergers and acquisitions witnessed since 2014, merging local insurance giants with international leaders. This allows the cushioning of underwriting losses for merged insurers. Regulatory requisites such as high capital needs and segregation of composite operations have also compelled insurers to consolidate in the hope of better prospects.
TAX EFFECTS
On April 1st 2018, changes to the Inland Revenue act which came into effect was expected to lower net profits of life insurance. Life Insurance Businesses are liable to pay a tax rate of 28%, bringing a far greater challenge to profit making. In addition, surplus distributions to participating life holders are expected to be taxed at 28% from 2021, which is now taxed at 14%.
Despite the increase in vehicle taxation and CIF value increases, the necessity of owning a motor insurance
policy according to regulations, propels vehicle buyers to acquire solutions from insurers. In addition, the increasing volumes of newly registered vehicles have encouraged insurance companies to promote motor insurance over other categories. Yet, the overall industry is facing a trend of under penetration with levels plummeting below the global average of 3%.
REGULATORY CHANGES
Insurers were required to follow SLFRS 9 on Financial Instruments, effective from 2018; yet, this was delayed till 2022 which would then require insurers across the globe to adopt IFRS 17 – Insurance contracts.
In January 2018, the Insurance Regulatory Commission of Sri Lanka commissioned principle regulations to ensure the fair treatment of customers within the industry by insurers.
y Principle 01 - Fair treatment of customers shall be at the heart of the business model of all companies
y Principle 02 - Products are developed and marketed in a way, that pays due regard to the interests of customers
y Principle 03 - Customers are provided with clear information before, during and after the point of sale
y Principle 04 - Suitability of advice y Principle 05 - Managing reasonable expectations of
customers y Principle 06 - Fair handling of claims y Principle 07 - Analysis of customer feedback and fair
handling of complaints
Meantime, guidelines were also issued to insurers and brokers who obtain leads from Banks and Financial Institutions. making them liable to pay a commission to the BFI. The IRCSL has made it mandatory to incorporate relevant changes to existing contracts by the 1st of 2019.
Under Direction #17 under the Regulation of Insurance Industry Act a Corporate Governance Framework has been issued to all insurers, effective from the beginning of 2019.
FUTURE OUTLOOK
The increase in imports is expected to recede in the subsequent months with the impact of new restrictions resulting in a reduction of particular categories of imports, including vehicles. Inflation is anticipated to recover in the year with the rate stabilising at mid-single digit level. The forecast for 2019 includes an anticipated growth of the economy at a rate of 4.3% and 4.5%. The per capita GDP growth is expected to fall at around 3.8% in the year.

ANNUAL REPORT - 2018CO-OPERATIVE INSURANCE COMPANY64
Operational Review
CICL’S PERFORMANCE Benchmarked against the industry, CICL’s operational performance saw a marked improvement in the financial year 2018.
y Overall market share held by CICL in the general insurance market, in terms of GWP, increased from 3.18 % in end-2017, to 3.65% by end December 2018
y Company was able to remain the General Insurance GWP growth rate at 23% even in unfavourable economic conditions Prevailed during the year 2018.
y 87% out of total GWP was from motor business and it was increased by 574Mn comparing prevailed during the year 2018.
y Company has achieved 21.4% of motor growth rate which was above the industry growth rate of 8%.
y The non motor premium growth rate increased to 32%, compared to the industry average growth rate of 1%
y Net earned premium (NEP) increased by 21%, while GWP increased by 23% during the year 2018.
0
5
10
15
20
25
30
35
40
Premium & Claim Growth
GWPGrowth
NEP Growth
Claim Growth
32
21
14
24
2
23
%
Motor Non Motor
1.0
1.5
2.0
2.5
3.0
3.5
4.0
GWP Growth - General
2014 2015 2016 2017 2018
1.3
1.7
2.5
3.1
3.7
Rs. Bn
CLAIMS PAY OUTTotal value of claims settled by CICL increased by Rs. 408.8 Mn to Rs.2,321 Mn out of which 2,123 Mn. on motor insurance class.
ClaimsCICL 2018
Rs. MnCICL 2017
Rs. Mn % change
Motor Claims 2,123, 1,709 24
Non Motor Claims 198 202 -2
COMBINED RATIO The combined ratio changed from 100.2 % in 2017 to 104.4% in 2018 reflecting efficiency gains during the year. The combined ratio remained above 100% despite a strong growth in net earned premium, mainly due to underwriting and policy acquisition costs, and operating and administration costs, increased during the current financial year, compared to 2017.
Performance indicator
CICL 2018
%
CICL 2017
%Industry avg
2018
Combined ratio 104.4 100.20 102.75
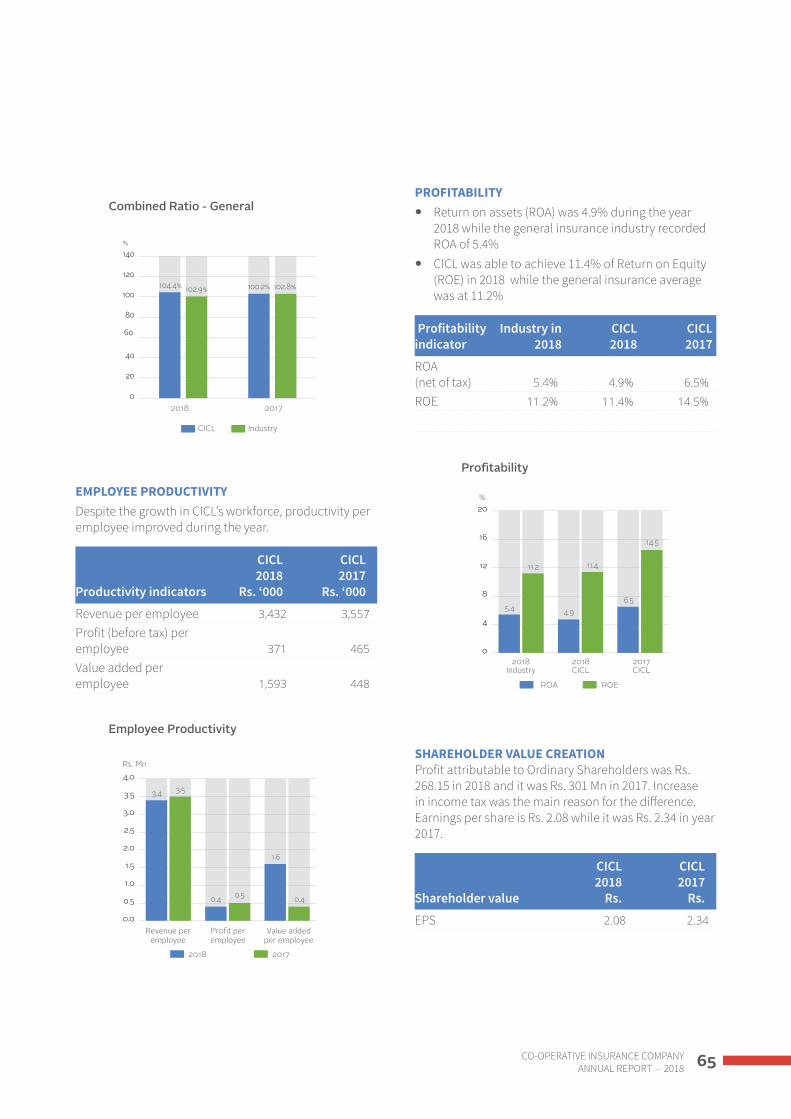
ANNUAL REPORT - 2018CO-OPERATIVE INSURANCE COMPANY 65
0
20
40
60
80
100
120
140
Combined Ratio - General
2018 2017
%
CICL Industry
104.4% 102.9% 100.2% 102.8%
EMPLOYEE PRODUCTIVITYDespite the growth in CICL’s workforce, productivity per employee improved during the year.
Productivity indicators
CICL 2018
Rs. ‘000
CICL 2017
Rs. ‘000
Revenue per employee 3,432 3,557
Profit (before tax) per employee 371 465
Value added per employee 1,593 448
0.0
0.5
1.0
1.5
2.0
2.5
3.0
3.5
4.0
Employee Productivity
Revenue per employee
2018 2017
0.4 0.5
1.6
0.4
Rs. Mn
Pro�t per employee
Value added per employee
3.4 3.5
PROFITABILITY y Return on assets (ROA) was 4.9% during the year
2018 while the general insurance industry recorded ROA of 5.4%
y CICL was able to achieve 11.4% of Return on Equity (ROE) in 2018 while the general insurance average was at 11.2%
Profitability indicator
Industry in 2018
CICL 2018
CICL 2017
ROA (net of tax) 5.4% 4.9% 6.5%
ROE 11.2% 11.4% 14.5%
ROA ROE
0
4
8
12
16
20
Pro�tability
2018Industry
5.4
11.2
4.9
11.4
6.5
14.5
%
2018CICL
2017CICL
SHAREHOLDER VALUE CREATIONProfit attributable to Ordinary Shareholders was Rs. 268.15 in 2018 and it was Rs. 301 Mn in 2017. Increase in income tax was the main reason for the difference. Earnings per share is Rs. 2.08 while it was Rs. 2.34 in year 2017.
Shareholder value
CICL2018
Rs.
CICL2017
Rs.
EPS 2.08 2.34

ANNUAL REPORT - 2018CO-OPERATIVE INSURANCE COMPANY66
Cooplife Insurance Limited Cooplife’s performance in 2018
y Company has earned Rs. 619 Mn of GWP in 2018 in an unfavorable economic conditions occurred during the year. This was a 1% different in GWP comparing to previous year. The industry average GWP growth rate was 13% for the same period.
y Net earned premium (NEP) changed from Rs. 587.04 Mn to Rs.574.04 Mn in 2018.
0
100
200
300
400
500
600
700
Industry performance Vs Cooplife
GWP NEP Claims
Cooplife 2018 Cooplife 2017
620 627574 587
222
122
Rs. Bn
0
100
200
300
400
500
600
700
GWP Growth 2014 - 2018
2014 2015 2016 2017 2018
402
495
467
627 620
Rs. Mn
Life fundThe life insurance liability increased from Rs.1,491 Mn to Rs. 1,608 Mn during the year. This will allow the company to declare attractive bonus to policy holders in future years.
Employee productivityCooplife has recruited new marketing staff to cater the competitiveness on the market. Therefore, Company was able to increase the revenue per employee 10.2% comparing to previous year.
0
500,000
1,000,000
1,500,000
2,000,000
2,500,000
Employee Productivity
Revenue per employee
Pro t (before tax) per employee
Rs. ‘000
2,3752,154
167 188
2018 2017
ProfitabilityReturn on assets improved during the year by 4.2% against the life insurance industry average of 2.5%.
Return on equity was at 11.21% in the financial year 2017 and Company was able to improve it to 23.4% during the current financial year.
Profitability Indicator
Industry Avg. 2018
Cooplife 2018
Cooplife 2017
ROA (Net of tax) 4.9% 7.4% 3.13%
ROE 25% 23.4% 11.21%
ROA ROE
0
5
10
15
20
25
30
Pro�tability
2018
2017
%
7.4
23.4
3.1
11.2
Operational Review

ANNUAL REPORT - 2018CO-OPERATIVE INSURANCE COMPANY 67
Managing Our CapitalsFinancial Capital
REVENUE COMPOSITIONCICL’s revenue is derived from 3 primary sources.1. Motor insurance is the main contributor to revenues
and accounted for Rs. 3,255 Mn of total revenue in 2018 and was 86.8% of GWP.
2. Non motor insurance is limited to fire, marine and miscellaneous insurance products and accounted for Rs. 496 Mn of revenue in 2018 and 13.2% of GWP.
3. Other income including investment income represented 15.7% of total revenue. Income from investments was Rs. 345.5 Mn (before charging finance cost) for the year. This was Rs. 261.6 Mn in the previous year.
ClassAmount
Rs.’000 Composition % GrowthMotor 3,254,676 86.8% 21.4%Fire 121,113 3.2% 5.1%Marine 7,791 0.2% 73.7%Miscellaneous 367,258 9.8% 43.6%Total GWP 3,750,838 100% 22.7%
Revenue Composition
Motor Fire Marine Miscellaneous
87%
3%
10%
Net written premium (NWP)The NWP growth was 27.1% compared to the GWP growth of 22.7% due to changes in reinsurance ceded premium and reserves for unearned premium.
EXPENDITURE
Net benefits and claimsThe net benefits and claims for the Financial Year 2018 increased by 26% from Rs. 1,529 Mn. to Rs. 1,1,927 Mn. This indicates CICL has served their customers with fair claims.
60
61
62
63
64
65
66
67
68
69
70
Claims Ratio
Industry
63.7%
67.7%
65.0%
%
CICL2018
CICL2017
Indicator Industry
2018 CICL 2018 CICL 2017
Claims ratio 63.7% 67.7% 65.02%
Underwriting and policy acquisition costThe net underwriting and policy acquisition costs increased in tandem with the growth in business volume. The cost to net earned premium for the year was 4.94%. This ratio for the previous year was 3.98%.
Other operating expensesCosts increased during the year by 23%, mainly due to increased staff costs and administrative expenses. CICL was able to expand the branch network around the country (102 branches) and this also was a main reason for the increment in other operating expenses.
Finance costsFinance costs including interest costs decreased by 67% from 2017 to Rs.986,035 in 2018 with the settlement of few finance lease liabilities.

ANNUAL REPORT - 2018CO-OPERATIVE INSURANCE COMPANY68
Managing Our Capitals
Financial Capital
PROFITABILITY
Profits before taxationProfit before tax as a percentage to net earned premium stood at 14% against 17% in the previous year. This reflects CICL’s improved competitiveness.
Profits after taxationThe net profit after tax (PAT) for the year was Rs.268 Mn compared to Rs. 301 Mn in the previous Financial Year. Political turmoil during the year and relatively weak corporate earnings had substantial negative impact on business performance.
ASSETS
Property, plant and EquipmentProperty, plant and Equipment increased by 3% in 2018 mainly due to investment in new branches and increase in the market value of land and building. Total Capital expenditure incurred by the Company on acquisition of Property, Plant and Equipment amounted to Rs. 79 Mn in 2018 and Rs. 61 Mn in the previous Financial Year. Carrying value of Property, Plant and Equipment of the Company amounted to Rs. 857 Mn in 2017 and Rs. 828 in 2017. Further Information on Property, Plant & Equipment of Company and Group are given in Note 4 to the Financial Statements.
Financial investments The investment portfolio is maintained primarily to ensure maximum protection to its assets in accordance with the regulatory requirements and to receive the highest returns for policyholders and shareholders.
The investment decisions are taken by the Investment Committee subject to subsequent Board ratification. Investment decisions are governed by the investment policy of the Company. In the investment decisions, the contribution towards the solvency status and the security received to the investments, are given more weight than the returns. The investment portfolio contains 23.5% of government securities. This content is in excess of the regulatory requirements.
Investments are classified under four categories as specified in Sri Lanka Financial Reporting Standards (SLFRSs) depending on their characteristics. More details of the investment portfolio are available in Note 06 to the Financial Statements.
Composition of the Investment Portfolio (excluding investment in subsidiary)
27%
40%
15%
9%
9%
Treasury bondsQuoted debenturesFixed depositsInvestment in repos
Commercial papersUnquoted equity instrument Quoted equity instrument
Composition of the Investment portfolio(excluding investment in subsidiary)
Reinsurance and premium receivablesReinsurance receivables represent the dues from reinsurance companies for paid and unpaid losses and loss adjustments. Reinsurance receivables are recognised as per the terms of reinsurance contracts. The amounts receivable are estimated to be consistent with the outstanding claim provision or settled claims associated with reinsurers’ policies.
The management attempts to recover reinsurance receivables promptly and to keep the receivable amounts at a minimum.
Premium receivables at the end of the year recorded an increase in comparison with the growth of GWP. The reason for the increase was the increase in the sales volume during the latter part of the year. The Company has a credit policy of 90 days.
Indicator CICL2018
CICL 2017
GWP (Rs.Mn) 3571 3,056
Premium ceded (Rs.Mn) 559 544
Reinsurance ratio 15% 18%

ANNUAL REPORT - 2018CO-OPERATIVE INSURANCE COMPANY 69
Other assets and cash equivalentOther assets mainly include deposits, prepayments and staff loans. Cash and cash equivalents are held at levels that are necessary to meet liquidity requirements. Staff loans outstanding were Rs 16.4 Mn compared to Rs. 21.95 Mn in 2017, which is the balance of loans granted under the staff loan scheme. These loans are provided at a nominal interest rate.
The recoverability of these assets is monitored on timely basis and provisions are made in cases where the recoverability is doubtful.
INSURANCE LIABILITYThe insurance liability fund to indemnify clients from specified future losses, grew by 17.3% over the previous year.
The growth of insurance liability for past 5 years is as follows:
1,000
1,500
2,000
2,500
Insurance Liability in Rs. Mn
2014 2015 2016 2017 2018
1,1061,277
1,654
1,900
2,230
Rs. Mn
The insurance liability is formed from claims outstanding, together with unearned premium reserve (UPR), Incurred But Not Reported claims (IBNR) and Incurred But Not Enough Reported claims (IBNER).
Our Actuary, M/s NMG Financial Services Consulting (Pvt) Limited confirms that we have made reserves adequate to meet future obligations.
In compliance with the Sri Lanka Accounting Standard SLFRS 4 – Insurance Contracts, a Liability adequacy test was performed by M/s NMG Financial Services Consulting (Pvt) Limited and confirmed that the liabilities are adequately recorded with regard to future obligations.
Their report is shown in page 114.
Solvency marginAccording to Section 26 of the Regulation of Insurance Industry Act No 43 of 2000, the Company is required to maintain solvency margins as determined by the Insurance Regulatory Commission of Sri Lanka.
Solvency ratio
The group operates according to the regulatory requirements set out by the IRCSL. The Group successfully implemented the Risk Based Capital (RBC) framework on solvency margin as required by IRCSL. The capital positions of the Group’s operating companies as of 31st December 2018 and 2017 are as follows.
Criteria CICL 2018
CICL 2017
Total available capital (TAC) (Rs.) 1,353,242 1,297,737
Minimum capital requirement (Rs.) 500,000 500,000
Risk based capital adequacy 178% 180%
Regulatory minimum CAR 120% 120%
COOPLIFE’S PERFORMANCE IN 2018
Revenue compositionCooplife offers customers a comprehensive range of life insurance solutions for every stage of the human life from infancy to old age.
1. With unsettled economic environment and changing regulatory requirements Life insurance was able to achieve Rs. 619.8Mn of GWP with a net profit of Rs. 183.9Mn.
2. Other income including investment income represented 26.4% of revenue. Income from investments was Rs. 201.77Mn (before charging

ANNUAL REPORT - 2018CO-OPERATIVE INSURANCE COMPANY70
Net written premium (NWP)The NWP was Rs.574.04 Mn compared to the GWP of Rs.619.8 Mn due to increase in premium ceded to reinsurances.
ClaimsThe net benefits and claims for the Financial Year 2018 increased by 83% from Rs. 121.5 Mn to Rs. 222.42 Mn when comparing to 2017.
Claim ratio
Performance indicator Cooplife
2018Cooplife
2017
Claim ratio 38.7% 20.7%
0
10
20
30
40
50
Claim Ratio
%
2018 2017
38.7%
20.7%
Underwriting and policy acquisition costThe net underwriting and policy acquisition costs increased by Rs. 21.2 Mn in tandem with the growth in business volume. But the cost to net earned premium for the year was 17%. This ratio for the previous year was 13%.
Other operating expensesCosts increased during the year by 11%, mainly due to increased staff costs and administrative expenses.
Finance costsFinance costs including interest costs has reduced by 44% from Rs.778,663 in 2017 to Rs. 435,327 Since Company was able to reduce overdraft interest comparing to last year.
PROFITABILITY
Profits after taxationThe net profit after tax (PAT) for the year was Rs. 183.99 Mn compared to profit of Rs. 69.35 Mn in the previous Financial Year. Company was able to get the advantage of differed tax amounting to Rs. 141 Mn. during the year and it increased PAT significantly during 2018.
ASSETS
Property, plant and equipmentTotal value of Property Plant and Equipment increased by Rs.7.7 Mn to Rs. 281.19 from Rs. 274.19 in 2017. Company has incurred Rs. 17.27 Mn of capital expenditure during the year 2018. This was mainly due to the purchase of computer, office equipment and furniture for the expansion of branch network and upgrade working environment for the existing employees. Further information on Property, Plant & Equipment of the Group are given in Notes 4 to the Financial Statements.
Financial investments The investment portfolio is maintained primarily to ensure maximum protection to its assets in accordance with the regulatory requirements and to receive the highest returns for policyholders and shareholders.
The investment decisions are taken by the Investment Committee subject to subsequent Board ratification. Investment decisions are governed by the investment policy of the Company. In the investment decisions, the contribution towards the solvency status and the security received to the investments, are given more weight than the returns. The investment portfolio contains 31% of government securities. This content is in excess of the regulatory requirements.
Investments are classified under four categories as specified in Sri Lanka Financial Reporting Standards (SLFRSs) depending on their characteristics. More details of the investment portfolio are available in Note 06 to the Financial Statements.
Managing Our Capitals
Financial Capital

ANNUAL REPORT - 2018CO-OPERATIVE INSURANCE COMPANY 71
Composition of the Investment portfolio
Treasury bondsQuoted debenturesFixed depositsInvestment in repos
Commercial papersUnquoted equity instrument Quoted equity instrument
16%
32%
38%
5%
9%
Reinsurance and premium receivablesReinsurance receivables represent the dues from reinsurance companies for paid and unpaid losses and loss adjustments. Reinsurance receivables are recognised as per the terms of reinsurance contracts. The amounts receivable are estimated to be consistent with the outstanding claim provision or settled claims associated with reinsurers’ policies. The management attempts to recover reinsurance receivables promptly and to keep the receivable amounts at a minimum.
Premium receivables at the end of the year recorded a decrease in comparison with last year. The reason for the decrease is the Company was able to recover reinsurance receivables in a timely manner during the year 2018.
Indicator
CoopLife2018
Rs. ‘ooo
CoopLife2017
Rs. ‘ooo
GWP 619.88 626,97
Premium ceded 45.83 39,92
Reinsurance ratio 7.4% 6.4%
Other assets, cash and cash equivalentsOther assets mainly include deposits, prepayments and staff loans. Cash and cash equivalents are held at levels that are necessary to meet liquidity requirements. Staff loans outstanding were Rs.11.57 Mn compared to Rs. 12.83 Mn in 2017, which is the balance of loans granted under the staff loan scheme. These loans are provided at a nominal interest rate.
The recoverability of these assets is monitored on timely basis and provisions are made in cases where the recoverability is doubtful.
Insurance liabilityThe insurance liability fund to indemnify clients from specified future losses, grew by 7.85% over the previous year. The growth of insurance liability for past 5 years is as follows.
0
500
1,000
1,500
2,000
Insurance liability
2014 2015 2016 2017 2018
1,074
87
1,231
1,4911,608
Rs. MN
The insurance liability is formed from claims outstanding, together with Unearned Premium Reserve (UPR), Incurred But Not Reported claims (IBNR) and Incurred But Not Enough Reported claims (IBNER).
The Actuary for Cooplife Insurance Limited Mr. M. Poopalanathan of Actuarial and Management Consultants (Private) Limited confirms that we have made reserves adequate to meet future obligations.
In compliance with the Sri Lanka Accounting Standard SLFRS 4 – Insurance Contracts, a Liability adequacy test was performed by Actuarial and Management Consultants (Private) Limited confirmed that the liabilities are adequately recorded with regard to future obligations.

ANNUAL REPORT - 2018CO-OPERATIVE INSURANCE COMPANY72
Managing Our Capitals
Manufactured Capital
WHAT IT ENTAILSAs a service-oriented company with a sole focus on providing insurance solutions, our manufactured capitals include Property, Furniture and Equipment, either purchased or have obtained on lease agreements that contribute to the provision of our services to customers. CICL currently owns its Corporate Office premises and infrastructure, as well as infrastructure across our branch network, islandwide. This infrastructure comprises of furniture, information technology based hardware and office facilities such as computers, scanners, photocopiers and modern fixtures.
The efficient use of these physical resources and property, as well as those owned by our business partners enables CICL to provide our services across the country to existing and potential customers. The use of business and administrative systems as well as those that support work processes and transactions reduce the use of material resources while enhancing efficiency and sustainability across the organisation.
With over a large base of customers in various cross segments and demographics across the country, our branch network and infrastructure fulfill a vital component of our growth strategy. It provides the context and resource base with which to approach new customers and to retain existing customer through accessibility to our products and services.
CORPORATE AND BRANCH INFRASTRUCTURE Our total manufactured capital base that includes property, furniture and equipment increased by 3% during 2018 to Rs. 1,138.5 Mn. Within the year Rs.28.7 Mn. was invested in acquiring hardware for supporting ICT functions. During the year, our IT department invested in the purchase of servers, computers and accessories and data storage devices. These acquisitions enable our objective of moving from a traditional paper and manual operational environment to a paperless, more efficient digital platform. Our ICT and network infrastructure allows employees real time work processes to occur across our 102 branches effectively enabling faster claims processing and settlement, eliminating ineffective processes, improving organisational efficiency as well as improving cost efficiencies, reducing operational costs.
The newly opened 23 branches were integrated across our branch system, facilitating speedier and efficient networking that facilitates decentralised operations. A total of Rs. 17.2 Mn have been invested in the new branches that now contributes to CICL’s brand equity by enhancing brand visibility and brand image as an insurer with rapid progression. New vehicles worth Rs. 27.1 Mn were purchased during the year.
CALL CENTRE INFRASTRUCTURE In the year, improvements and upgrades were made to the call centre system, facilitating its customer service processes and employees to improve its service levels.
Manufactured Capital Asset Base –
PPE balance as at 2018
Rs. Mn2017
Rs. Mn
CICL group 1138.59 1,102.08
Company 856.62 827.91
0
200
400
600
800
1,000
1,200
1,400
1,600
Manufactured Capital Asset Base
CICL group Company
Rs. Mn
2018 2017
1,139 1,102
857 828
Total Capital Expenditure
Capital Expenditure 2018 2017
Rs. Mn Rs. Mn
CICL group 96.02 120.98
Company 78.78 61.18
0
30
60
90
120
150
Total Capital Expenditure
CICL group Company
Rs. Mn
2018 2017
96
121
79
61

ANNUAL REPORT - 2018CO-OPERATIVE INSURANCE COMPANY 73
INTELLECTUAL CAPITALIntellectual capital within the organisation is the knowledge based intangibles which essentially comprises of all intellectual property owned by CICL. These include our core business systems, administrative systems, organisational capital which comprises of knowledge, processes and internal protocols and those aspects intangible to brand reputation.
Our core business systems and internal processes were improvised and further developed to facilitate business efficiencies and to improvise service level expectations of our customers. Internal processes and work flows were revaluated and adjusted to enable speedier customer service times.
TECHNOLOGICAL EXPANSIONS
Information Systems Innovation and technological advancements have become a strategic imperative when deciding the future and the growth potentials of insurers. We are not isolated in this regard. CICL and Cooplife have invested heavily in equipping our organisational processes and our staff with information systems for the efficient and productive management of our core business and transactional operations. During the Financial Year CICL and Cooplife continued to upgrade, develop and improve its existing systems while making innovative strides in moving the company towards a more technologically driven organisation.
Core Insurance SystemsOur existing core systems for both General and Life Insurance have been developed and maintained by the company IT division. Both our core operational systems include main modules such as sales and marketing, commission, underwriting, claims, payment, general ledger and administration, which are fundamental for the cohesive conduct of processes.
Employees employed within the units of underwriting and claims are trained on system functionalities and usage. These personnel then provide the necessary training to staff across our 102 branch network.
In 2018, our core life insurance system was updated to a more advanced version - Oracle 12c. A new Life Quotation module was also developed and integrated to the system, enabling our agents easier and faster delivery of policy quotations to customers.
INVESTMENT IN ICT INFRASTRUCTUREIn 2018, we began to our investments of in-house software development reached Rs. 22Mn. In 2018, CICL group invested Rs. 28.7 Mn. for the purchase of hardware which included servers, computers and accessories and data storage devices; purchased in equipping new branches which began operations in 2018.
NEW CALL CENTRE SOLUTIONThe existing call centre software was upgraded to ensure uninterrupted service to our customers. New upgrades ensure that risks of system failure and down-time will be eliminated for continuous operations. Through internal call recording and data management features of our call centre system, we receive greater leverage in assisting faster claim settlement.
DATA MANAGEMENT SYSTEM (DMS)In 2018, our document management system was developed with the objective of converting the Group to a paperless company by 2019/2020. Presently, underwriting and claims related documents are uploaded to the system, while documents obtained from customers are scanned and reverted. The system now enables our staff to access digitised documents, giving them greater flexibility with ease of access coupled with the elimination of maintaining a significant number of physical documents which require unwarranted space and time. The ultimate objective of the system is to digitise all document processes across the company.
EFFICIENT CLAIM MANAGEMENTThe use of our technological developments focuses mainly on increasing the speed and process time of settling claims for customers. Across the year, our IT team continued to integrate and streamline work across our claim settlement process. The module which enables claim settlement in the software application was expanded with intranet facilities and allows the relevant individuals as well as branches to share documents as and when needed.
As part of enhancing the overall efficiency and speed of claim settlement a mobile device application was developed in 2017 for our team of accident assessors. This was further maximised in its capability of sending photographs to a central system for faster claims processing. It also allows call centre to monitor the status of accident claims.
Managing Our Capitals
Intellectual Capital

ANNUAL REPORT - 2018CO-OPERATIVE INSURANCE COMPANY74
INTER-CONNECTING THE BRANCH NETWORK23 new branches were connected with networking infrastructure which provides flexibility and faster turnaround times for branch services. Direct real time communications is facilitated through VPN facility ensuring safety.
LEARNING PORTALIn 2018, we developed an online learning portal that provides employees the digital resources necessary to complete their learning modules, course material (of CITA) or material related to technical aspects, covering a wide range of subjects and areas. Employees can access audio visual material, theoretical lessons as well as exam preparation guides with regard to the IRCSL exams.
OTHER INTELLECTUAL CAPITALAn app was developed for the convenience of customers across the agricultural sector when selecting and acquiring an insurance policy without the requirement of visiting a physical branch. The app is being promoted by our team of field agents across relevant areas, targeting the prospective customer segment.
Our IT division is equipped in installing and maintaining hardware and other physical infrastructure related to information systems. They take on responsibility in implementing hardware across our branch network which has replaced the need for third party support services. Their expertise, technical knowledge and experience in developing IT applications and in solving issues related to back end processes is also part of our intellectual capital.
ORGANISATIONAL CAPITAL
Management controls and processesIn our strategic effort to strengthen our management of claims settlement process, CICL provided quarterly, focused trainings for claim department staff in the detection and prevention of frauds. These programs are conducted by outsource specialists in the field and senior staff members of the company.
BRAND IMAGEBuilding and enhancing brand image by improving service levels is a strategic directive under our corporate mission where we continuously stay mindful and analytical of the needs of our customers, providing convenience and reliability while conforming to standards that elevate our moral and ethical standing in society, thereby, enhancing brand equity.
Managing Our Capitals
Intellectual Capital

ANNUAL REPORT - 2018CO-OPERATIVE INSURANCE COMPANY 75
CategoryNo. of
Employees
Permanent 750
Contract 175
Probation 158
Trainees 20
Total 1103
Our work force is one that has an amalgamation of unique individuals from various demographics and walks of life, who share different goals and aspirations in life. We remain competitive as far as the strengths and capabilities of our now growing and dedicated workforce. That is why we strive to attract, train and retain our employees while providing them ample room to grow professionally, all the while understanding their strengths and capacities for identifying those traits that could one day take them to greater personal achievements while being an employee at CICL or Cooplife.
GENDER EQUALITY AND DIVERSITYThe workforce at CICL remains balanced in its composition of gender equality, as we continue to maintain a male to female employee ratio of 1.3:1. While being an employer that grants equal opportunities to both our female and male employees we ensure equilibrium in our payment structures across designations, maintaining the same pay for both men and women of the same job role.
Our employees are a vibrant mix of young individuals from diverse walks of life, those with exposure to both rural and urban environments. Our employees are dynamic individuals, experienced in their profession, who are continuously groomed to approach customers and provide the best possible solution in fulfilling all insurance needs. In the Financial Year under review, CICL continued to conduct branch wise recruitment on a regular basis, while hiring 676 across Life and General Insurance businesses while our field agent team consisted of 343 agents across our service network.
NEW APPOINTMENTSAssistant Managers for Regional Underwriting were appointed in facilitating further decentralisation of underwriting duties, branch-wise. Regional underwriters were appointed to each region that acts as the liaison and coordinating link between Head Office and branches. These regional underwriters are also responsible for handling the training of new recruits and existing employees in underwriting operations.
As part of our on-going strategy of transforming CICL to a technologically driven insurance company, we created two new personnel job roles which were deemed to be crucial for the development of our in-house IT solutions. In this regard, 2 Quality Assurance Engineers were sought out and recruited for improving and advancing our system development projects and operations.
As means of ensuring further control on credit related transactions the finance department established two separate units under its purview.
1. Credit control unit2. Assessor payment unit
These two units are envisioned to optimise assessor payment process and to help minimise debtors’ collections.
TRAINING AND DEVELOPMENTIn the year under review, CICL conducted numerous training sessions for our employees across branches and across departments with the goal of improving their technical know-how and skills and in developing their soft skills based capabilities.
y Regional Goal Setting Programs - The programs were based on goal setting for our sales staff, providing them with clear direction for achieving performance in sales.
y Professional Skills Development Programme (PSD) - An outbound training approach to developing professional skills of branch executives; the sessions were conducted on a monthly basis and covered Underwriting practices, Technical issues, Leadership and Team building and Claims handling process.
Managing Our Capitals
Human Capital

ANNUAL REPORT - 2018CO-OPERATIVE INSURANCE COMPANY76
y System training – Selected branch staff was given training on the use of the non-motor system.
y Orientation for new staff members- A familiarisation training program was given for all new sales personnel with training on general insurance and product awareness. Newly recruited employees were provided training with insight into the overall workings of the company.
y Product Training – Product refresher training was provided for regional sales staff and those in underwriting. Priority was placed on region specific products alongside awareness on other products.
y Motivational Programs – Targeted career development and personal development, a motivational interactive session was organised for new sales and other employees.
y Planning forum – Organised with the participation of top management, regional and branch managements, sales targets were provided for 2019, followed by a one-day motivational program.
y Assessor training – Training was provided for all our company assessors.
y Underwriter training – Training was provided for Underwriters, Regional Underwriting Assistant Managers.
y External workshops – Additional workshops were attended by our staff on various technical and professional development themes.
y Overseas Workshops – Several opportunities were provided for our top management and senior management to attend training sessions organised internationally.
y Top Management Training – Training and knowledge enhancement workshops were attended by our top and senior managers, organised by leading institutional and regulatory authorities in financial and insurance industry.
COOPLIFE INSURANCE LIMITEDOur life insurance subsidiary executed numerous training sessions enhancing product based knowledge, technical skills and soft skills for professional and personal development. Training was provided under the following areas:
y Induction training y Product and sales training y Need based selling y Financial planner development course y Field training y Technical competency training y Motivational forum for sales staff y MDRT based forum y IAP, IQA and LIMRA based forums y Goal setting workshops
CAREER DEVELOPMENTCo-operative Insurance Training Academy The Co-operative Insurance Training Academy is the company’s in-house training facility established in 2015 for career development of our employees. The institute facilitates training and certification for students in partnership with the Insurance Institute of India and provides 3 course levels, including, Certificate level, Diploma and Higher Diploma. Currently, 30 students are registered for Higher Diploma Course and 66 students are registered for Certificate course.
Managing Our Capitals
Human Capital

ANNUAL REPORT - 2018CO-OPERATIVE INSURANCE COMPANY 77
EMPLOYEE EVENTS DURING THE YEAR
Annual Awards of 2018CICL’s annual award ceremony was held at Eagles’ Lake Side Banquet & Convention Hall, Attidiya and was organised as a formal, grand event for recognising those employees, who demonstrated exceptional results in the year 2018.
Staff Retreat
A staff retreat was organised at the Leisure World, Avissawella. Employees and families participated in this event, taking time to interact with colleagues and family members with fun games and activity that provided everyone an enjoyable time.
CO-OP Classical Musical ShowClassical musical show was organised by employee’s welfare and sports society of Co-operative Insurance Company Limited. It was held in Teacher’s training College auditorium at Maharagama.
Sports Equipment DistributionIn the year under review, we provided cricket equipment to staff at our Head office and branches, equipping them with the right gear for enhancing their capabilities in the sport and enable them to engage in an activity that promotes work-life balance.
Dharma Deshana ProgramPromoting religion and harmony, the program was organised on Poson poya day providing a chance for employees to obtain religious and spiritual advice.
Poson Poya DansalSeveral Dansals were organised at Head office premises by several departments, with generous provisions of food and beverages sourced or prepared by our employees; promoting the spirit of giving.
Blood Donation ProgramA blood donation event was organised by employees, inviting staff members from Head Office and branches; which was held in association with the National Blood Bank of Sri Lanka.

ANNUAL REPORT - 2018CO-OPERATIVE INSURANCE COMPANY78
Managing Our Capitals
Social Capital
SOCIAL CAPITALCo-operative Insurance is formed around the principles of the co-operative movement in Sri Lanka. Our work is fundamentally based on uplifting the lives of our customers as well as in ensuring that our stakeholders receive value for their contributions. Hence, our social and relationship capital is a significant aspect in terms of its impact on creating long term, sustainable value. Our social and relationship capital includes the key relationships and interactions we have built over the years with our customers, business partners, agents/brokers and social communities.
The social and relationship capital we maintain is a factor that provides a leading advantage in times of industry competition. By sharing the same values and norms, we share the pursuit of common objectives that enable growth for our partners and customers; as well as enabling our growth strategy to be achieved. Our commitment to the society at large is a responsibility we see an imperative in fulfilling our obligations as an insurer in the service of safeguarding lives and interests of individuals. Hence, we are committed to uplifting the lives of those in need as a corporate citizen.
CUSTOMER DRIVEN VALUESOur relationship with our customers is formed on the basis of the value we offer for fulfilling their expectations. Our relationship with them begins on the basis of a life-long understanding to support them during their financial obligations and needs; we enhance this relationship by providing a service that enables them accessibility and convenience to services and products. We constantly evaluate ways of improving our service offering coupled with a suite of comprehensive and inclusive product portfolio that is both reliable and affordable to all our customers across all market cross-segments. In essence, this is the meaning of being an insurer within the co-operative sector; catering to all regardless of their financial strengths and livelihoods.
Our social relationship with our business partners keeps evolving as we continue to grow our partner network each year. Currently, CICL and Cooplife operates across 117 co-operative society owned service centres, 346 field officers, 2000 institutional agents and 57 insurance brokers. This vast network of CICL branches and business partners has made us the third largest network in the insurance industry.
Support towards our service partners extended in the year by providing assistance in technological needs and through training. In addition, we strengthened our relationship with the wider community through various CSR initiatives.
CUSTOMER CAREWith competition becoming tighter in a continuously challenging external environment, elevating customer service quality remains the key to remaining competitive, especially within the motor insurance market. For enhancing service quality and fast response times we continued to streamline internal processes by integrating departments and work processes, supported by real time exchange of information and access to digitised documents that result in faster turnaround times in providing, efficient services including the generation of quotations, settling claims and in handling queries. In the year we further reinforced our services that have been innovative in taking our services to a much diverse set of cross-segments across the insurance market.
Our head office operates 12 hours, 365 days of the year offering all insurance services, especially our dedicated Motor Division that continued to offer optimum customer convenience. Our SMS system enables frequent notification of payments and renewals to customers and provides continued communication enabling them to make payments on time and avoid lapsed premiums.
We continued to strengthen our cashless motor vehicle repair service with more garages being added to the network, from Colombo and suburbs.

ANNUAL REPORT - 2018CO-OPERATIVE INSURANCE COMPANY 79
CUSTOMER SERVICE STRATEGYIn our efforts to strengthen our approach to customer service we have developed a customer strategy that focuses on 10 crucial components used for enhancing service quality.
CICL 10 Point Strategy for Customer Care
InteractionsFront Door
Onto the Web
Handl
e Cal
ls
Give Agents
Proactive
Customer Data
Better Use of
Optimise
Win
ning
Team
Productivity
Cross-Channel
Customer
Off the Phone and
More I
ntel
ligen
tly
Information
Contact
and Segmentation
Business Process
Execution
Crea
te a
Boost Agent
Strategy DescriptionFacilitate integrated and consistent cross channel interactions
To provide an exceptional customer experience through multi-channel interactions that include phone, email and SMS for ease of access and convenience in conducting business at flexible times.
Offer an inviting customer service Our interactive voice response system creates a friendly atmosphere that sets the initial impression of the company. The system also provides information on our products and services. It gives insight into ways which could enable decreased volume of calls that agents handle or in reducing response times.
Increased usage of online portal Provide customers access to services and information through website Intelligent handling of calls Ensuring the provision of acceptable service that does not
compromise the level of expected quality. Three main strategies are deployed in achieving efficiency in providing service expectations; including skills based routing, virtual hold and business priority routing which also enables maximising on opportunities of potential revenue.
Supplement agents with information for enhanced work performance
Integrating front office activities with back office system information assists agents to respond and resolve queries efficiently and in less time. Customer information is automatically displayed on screen at the time of a call, eliminating the manual navigation of the system for customer information.
Proactive contact Proactive communication with customers prior to renewal of policies results in increased renewals.

ANNUAL REPORT - 2018CO-OPERATIVE INSURANCE COMPANY80
Strategy DescriptionMore efficient use of Customer data and segmentation
Assessing the future needs of customers based on data and segmentation.
Optimise evolution of business process execution
Using the front office to automate and expedite end to end business processes that support multi-step business processes which entails multiple contacts with customers
Create a winning team with Contact Centre Virtualisation
Through agent availability we ensure that expected response times are maintained while tapping expertise when required.
Boost agent productivity through interaction blending
Optimising agent time through multiple efforts.
A Customer-first approach Co-operative Insurance strives to provide highly reliable and attractive products and an after-sale service that provides customer expectation across the product life-cycle. With customers especially from the rural and co-operative sectors, our products are made to match their needs and financial capacities, ensuring peace of mind and maximum benefits to all our customers.
Our ‘One Life Policy’ concept has made the brand distinct as it is a pioneering concept that delivers affordability to customers and convenience.
‘For the people, by the People”A truly local company with ownership in the co-operative sector of Sri Lanka, Co-operative Insurance is a product of a revolutionary change that targeted the rural and low-middle income citizens of the country; especially within the co-operative community. Our approach is not in being a commercial enterprise with short term profit making goals but in delivering long-term, sustainable values to our customers and our stakeholders.
Understanding the vital life needs of our customers has enabled us to provide them with the solutions they require in tackling financial risk exposures when they materialise.
Customer ConvenienceWith a value driven model of growth, we continue to expand our presence through an islandwide branch network of 102 branches and 44 life insurance branches alongside 117 co-operative society owned service centres, 540 post offices and sub post offices, a widespread agents and broker network that allows customer convenience in obtaining solutions or for after sales transactions.
CICL Brand +
Product Portfolio
C0-operative Societies
CSR Activities
120 CICL Branches
117 Service Centres
Field Officers, Institutional Agents and Insurance
Brokers
Regional Underwriting and Decentralised Claims ProcessingOur branches across the country have flexibility and autonomy in handling underwriting work through our regional underwriting managers, fast-tracking the underwriting process for speedier policy provision. With claims operations being decentralised across our branch network, through the integration of branches and head office via our online business systems, we are able to process claims faster than before, with time reduced by 50%.
Cooplife Policy Conservation Unit The unit ensures the seamless transition of policies and policyholders to new agents at the time an existing agent leaves the Company. Customers are approached with information on their renewed relationship with the company and our team ensures that policy premium payments are up-to-date as well as assuring customers of a consistent level of service and reliability.
Managing Our Capitals
Social Capital

ANNUAL REPORT - 2018CO-OPERATIVE INSURANCE COMPANY 81
Enhance Social Capital through Brand Building In the year, CICL conducted 260 promotional and town storming programs which enabled the company in brand building while making these the opportunities to create general awareness on insurance within the communities. Our brand visibility was increased and engagement with the brand was increased by expanding our physical network from 79 branches to 102 branches.
Enhancing Partner Relations through Innovation
By streamlining processes and through our core and administrative systems, we are able to provide a faster and much leaner operational efficiencies, enabling our business partners, brokers and agents the chance to assess claims speedily and easily providing their customers with faster turnaround times.
SOCIAL RESPONSIBILITYAt CICL we believe that it is our responsibility to give back to our community and country, As such we have embarked upon numerous philanthropic efforts, and put in place sustainable, socially oriented business policies designed to ensure social and economic justice.
CICL, as a responsible Corporate Citizen, has practiced the CSR model of “Creating Shared Values”, by reaching out to the stakeholders, community and society who are directly or indirectly involved in its business operations. There by we have sponsored many identified Programs relating to Child Care & Education, Health Care, Skill Development and Community Development to make a difference to the under privileged.
CICL has made long term commitments to Sri Lanka Deaf Rehabilitating Organization, the Deaf and Blind Association and the Ceylon School for the Deaf and Blind. This year also we have donated funds to enrich CICL social appearance. This was the 10th consecutive occasion we extended our helping hand.
We get more joy out of giving joy to others. Every individual will like to make their Children’s life safe and happy. But there are many children those who not reach least primary human needs such as foods, health etc. Our ultimate goal is making children safe and happy. Thus that we decided to sponsor child day celebration function which was organized by Base Hospital Horana.

ANNUAL REPORT - 2018CO-OPERATIVE INSURANCE COMPANY82
Managing Our Capitals
Social Capital
Also we have given our helping hand to a child who is suffering ear corruptions. His family was mentally and economically diminished due to this disease. We have offer funds to ear surgery .As a company that comprises of a social sense, we funded in truths to particular individual to enliven the spirit of the CICL. By supporting and comforting individual in this worst of circumstances, we can help save lives and heal wounded families together.
Evolving rural templesCICL has paid special attention to develop facilities at temples in rural areas and to provide more facilities for temples in those areas. We believed discipline and moral values in the country are protected to some extent due to the commitment of the Maha Sangha. Thus that we do have responsibility to fulfill their responsibilities towards the Maha Sangha, who committed themselves to build a better society by inculcating spiritual values among the people. CICL engaged to facilitate Sri Subadra temple , Colombo 15. We funded to develop many due facilities.
Sponsoring for sportsmen y CICL has been involved in various sporting activities,
amongst which includes fund donation for Sportsmen.
y Mr. Gamini Ranasinghe was one of the nominated athletes for winter throwing championships –2017. But he was economically dispersed. There for we decided to offer a sponsorship to participate above competition as a Sri Lankan representer.

Maintaining Good GovernanceGovernance and Internal Controls 84Compliance Status 91Risk Management 102Annual report of Directors 110Certification of IBNR and LAT 114
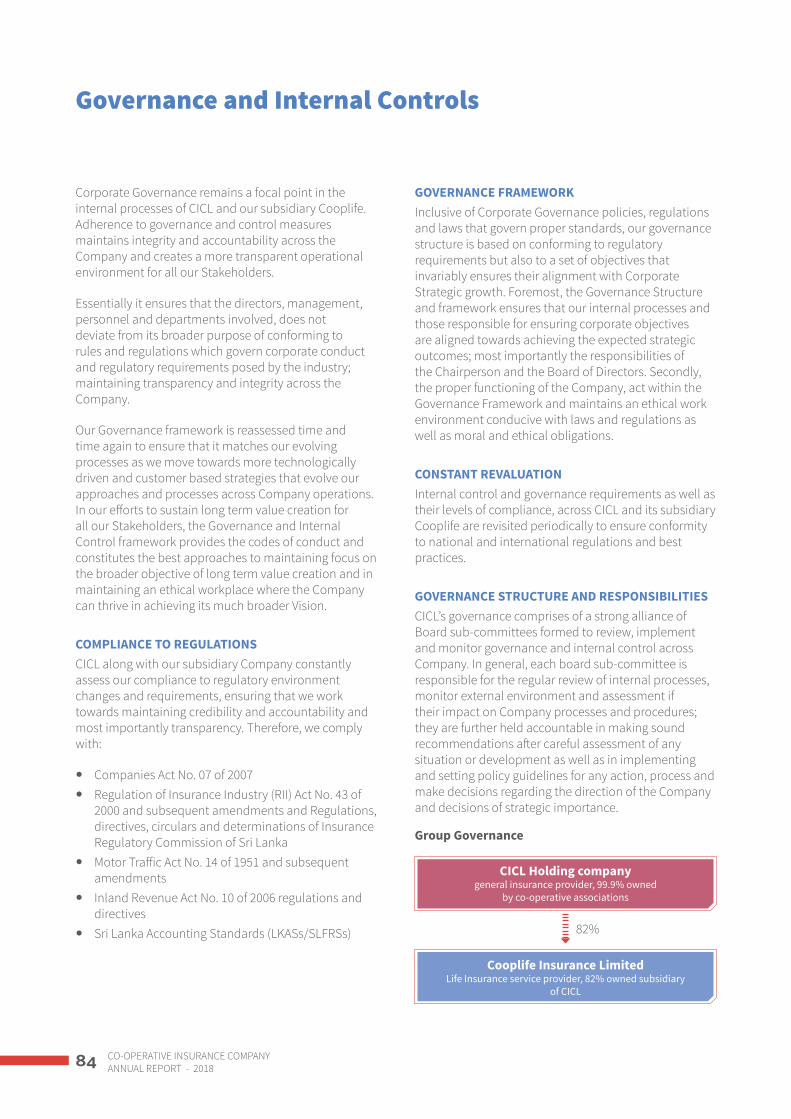
ANNUAL REPORT - 2018CO-OPERATIVE INSURANCE COMPANY84
Governance and Internal Controls
Corporate Governance remains a focal point in the internal processes of CICL and our subsidiary Cooplife. Adherence to governance and control measures maintains integrity and accountability across the Company and creates a more transparent operational environment for all our Stakeholders.
Essentially it ensures that the directors, management, personnel and departments involved, does not deviate from its broader purpose of conforming to rules and regulations which govern corporate conduct and regulatory requirements posed by the industry; maintaining transparency and integrity across the Company.
Our Governance framework is reassessed time and time again to ensure that it matches our evolving processes as we move towards more technologically driven and customer based strategies that evolve our approaches and processes across Company operations. In our efforts to sustain long term value creation for all our Stakeholders, the Governance and Internal Control framework provides the codes of conduct and constitutes the best approaches to maintaining focus on the broader objective of long term value creation and in maintaining an ethical workplace where the Company can thrive in achieving its much broader Vision.
COMPLIANCE TO REGULATIONSCICL along with our subsidiary Company constantly assess our compliance to regulatory environment changes and requirements, ensuring that we work towards maintaining credibility and accountability and most importantly transparency. Therefore, we comply with:
y Companies Act No. 07 of 2007 y Regulation of Insurance Industry (RII) Act No. 43 of
2000 and subsequent amendments and Regulations, directives, circulars and determinations of Insurance Regulatory Commission of Sri Lanka
y Motor Traffic Act No. 14 of 1951 and subsequent amendments
y Inland Revenue Act No. 10 of 2006 regulations and directives
y Sri Lanka Accounting Standards (LKASs/SLFRSs)
GOVERNANCE FRAMEWORKInclusive of Corporate Governance policies, regulations and laws that govern proper standards, our governance structure is based on conforming to regulatory requirements but also to a set of objectives that invariably ensures their alignment with Corporate Strategic growth. Foremost, the Governance Structure and framework ensures that our internal processes and those responsible for ensuring corporate objectives are aligned towards achieving the expected strategic outcomes; most importantly the responsibilities of the Chairperson and the Board of Directors. Secondly, the proper functioning of the Company, act within the Governance Framework and maintains an ethical work environment conducive with laws and regulations as well as moral and ethical obligations.
CONSTANT REVALUATIONInternal control and governance requirements as well as their levels of compliance, across CICL and its subsidiary Cooplife are revisited periodically to ensure conformity to national and international regulations and best practices.
GOVERNANCE STRUCTURE AND RESPONSIBILITIESCICL’s governance comprises of a strong alliance of Board sub-committees formed to review, implement and monitor governance and internal control across Company. In general, each board sub-committee is responsible for the regular review of internal processes, monitor external environment and assessment if their impact on Company processes and procedures; they are further held accountable in making sound recommendations after careful assessment of any situation or development as well as in implementing and setting policy guidelines for any action, process and make decisions regarding the direction of the Company and decisions of strategic importance.
82%
CICL Holding company general insurance provider, 99.9% owned
by co-operative associations
Cooplife Insurance Limited Life Insurance service provider, 82% owned subsidiary
of CICL
Group Governance

ANNUAL REPORT - 2018CO-OPERATIVE INSURANCE COMPANY 85
CICL Board of Directors
Investment Committee
Business Development
CommitteeAudit Committee Procurement &
Tender Committee
Compliance and Risk Committee
Management Committee
Customer Grievance Committee
HR and Remuneration
Committee
(Chaired by Managing Director)
(Heads of Departments, Chaired by Managing Director)
(Chaired by Managing Director)
CICL Governance Structure
RESPONSIBILITIES OF THE BOARD OF DIRECTORSThe Board of Directors is committed to maintaining and regulating conformity to standards of Corporate Governance. Each member fulfills a significant role in providing leadership and strategic insight whilst operating with effective and credible internal controls as well as prudent compliance to governance requirements. The Board members provide direction by setting corporate objectives and by ensuring the effective achievement of corporate growth strategy by guiding the Management to effectively operate in a demanding environment.
The Board’s levels of responsibilities are all encompassing and require the constant monitoring and systematic implementation of systems and procedures and delegating their effective execution, to the Corporate and Senior Management teams of the Company.
Pursuing the Corporate Strategy, the BOD has an immeasurable and expansive role in ensuring that MD and the Management team has the right skills and experience in developing the Corporate Growth Strategy and in implementing the necessary plans while
sustaining the intended outcomes of our value creation approach.
For an in-depth understanding of the Board’s responsibilities please refer the section on Compliance status on page 93.
THE ROLE OF THE CHAIRPERSONThe Chairperson of the Company plays a crucial role as the strategic leader of the Company and has a far greater responsibility of ensuring conformity to governance practices and in directing the Company towards creating sustainable returns to Shareholders and other Stakeholders. The Chairpersons’ role is elaborated under the section of Compliance Status on page 93.

ANNUAL REPORT - 2018CO-OPERATIVE INSURANCE COMPANY86
Governance and Internal Controls
COMPOSITION AND MAIN FUNCTIONS OF BOARD SUB- COMMITTEES
Committee Names
No. of ScheduledMeetings
No. of Scheduled Attended
Audit Committee Mr. A.D.T.S. Palitha - Director (Chairman of the Committee) 16 16Mr. D.P. Amaradeva - Director 16 16Mr. R.G.K. Rankothge – Director 16 16Mr. J.M.V.P. Jayasooriya - Director 16 13Secretary – Internal Auditor
Human Resources and Remuneration Committee Mr. W. Lalith A. Peiris - Chairman 11 08
Mr. K.R.W. Ranasinghe - Managing Director 11 07Mr. K.R.K.N. Jayasinghe - Director 11 06Mr. K.J. Sesiri - Director 11 11Mr. P.P.D.S. Kularathna - Director 11 10Mr. Laksiri Nawaratne - Chief Finance OfficeSecretary – Human Resources Manager
Investment Committee Mr. W. Lalith A. Peiris - Chairman 03 02Mr. K.R.W. Ranasinghe - Managing Director 03 03Mr. R. Sooriyaarachchi – Director 03 03Mr. P.P.D.S. Kularathna - Director 03 03Mr. Pubudu Wimalarathne -Chief Operating OfficerMr. Laksiri Nawaratne - Chief Financial OfficerSecretary – Finance Manager
Procurement & Tender Committee Mr. W. Lalith A. Peiris - Chairman 11 07Mr. K.R.W. Ranasinghe - Managing Director 11 09Mr. K.R.K.N. Jayasinghe - Vice Chairman 11 08Mr. C.P. Jayasinghe - Director 11 10Mr. R. Sooriarachchi - Director 11 11Mr.K J Sesiri 11 11Secretary – Manager Administration
Business Development Committee Mr. W. Lalith A. Peiris - Chairman 03 02Mr. K.R.W. Ranasinghe - Managing Director 03 02Mr. R.M.R.B. Bandara – Director (01.01.2018-30.06.2018) 01 01Mr. C.P. Jayasinghe – Director 03 03Mr. S.S. Weerasekara - Director 03 03Mr. D.L. Samarawickrema - Director 02 02Secretary – AGM Marketing

ANNUAL REPORT - 2018CO-OPERATIVE INSURANCE COMPANY 87
Audit Committee
HR Committee
Investment Committee
- Implement effective Internal Control Processes.- Review risk assessment process and risk profile.- Review internal and external audit reports and follow up on
recommendations.- Ensure compliance with laws and regulations - Review financial reporting system, critical accounting policies and the
quality of accounting judgments and estimates.
- Ensure the recruitment and maintenance of a competent and suitably-qualified staff and the reduction of the staff turnover.
- Regular review of remuneration as well as service conditions.- Determine the career path of staff members.- Ensure a sound performance appraisal system at all levels.
- Set policy guidelines to manage investment portfolio.- Monitor investment portfolio and its return against the set income target.- Monitor compliance with investment regulations- Review performance of the key investment portfolios and guide
investment strategy at the macro level.
Procurement and Tender Committee
- Develop procurement policy subject to Board approval.- Decide on mode of procurement for high value goods and services.- Scrutinise Admin. Department procedures for quotations.- Approve tender procedures and scrutinise tender invitation documents.- Open tenders and sealed quotations and handle information received
with due care.- Evaluate quotations and tenders using matrix prepared by the Admin.
Manager and other technical personnel. When necessary, delegate such evaluation to an expert/s.
- Based on evaluations decide on awarding tenders.- Set conditions for carrying out a contracted task or purchase order.- When necessary, take follow up action on a contract or process of
procurement.
RESPONSIBILITIES OF BOARD SUB-COMMITTEES

ANNUAL REPORT - 2018CO-OPERATIVE INSURANCE COMPANY88
Governance and Internal Controls
Business Development Committee
- Suggest to the Board new ventures and take action after feasibility studies.
- Evaluate IRCSL reports, auditors, actuaries, rating agencies and any other consultants who may provide consultancy on specific issues.
- Suggest any changes in the management structure.- Study external market reports to enable the Company to take proactive
action.
*The sub-committees meet as and when required across the Financial Year and have maintained regular meetings across the year. Please refer page 86 for additional information.
Director Name
No. of Meetings
Scheduled in 2018
No. of Meetings Attended
in 2018Mr. W. Lalith A. Peiris 12 12Mr. K.R.K.N. Jayasinghe 12 12Mr. K. R. Wasantha Ranasinghe 12 12Mr. D. P. Amaradeva 12 12Mr. Rajeewasiri Sooriyarachchi 12 10Mr. K. J. Sesiri 12 12Mr. R. G. K. Rankothge 12 12Mr. C. P. Jayasinghe 12 12Mr. A. D. T. S. Palitha 12 12Mr. P. P. D. S. Kularathne 12 12Mr. J. M. Vajira Prabath Jayasuriya 12 12Mr. R. M. B. M. Bandara 07 07Mr. S. S. Weerasekara 12 11Mr. D. L. Samarawickrama (Appointed on 02.08.2018) 05 05
SYSTEM OF INTERNAL CONTROLS With risk assessment as a fundamental aspect of our internal control system, CICL and Cooplife follow the following system of internal controls maintaining an environment of control consistent with regulatory and legal requirements of compliance.
Our system of internal control is instilled across all processes to ensure the smooth operation of the Company while operating within the principle of transparency while safeguarding Company assets, intellectual property and abidance to laws and regulations.

ANNUAL REPORT - 2018CO-OPERATIVE INSURANCE COMPANY 89
Risk Assessment
Control Activities
Control Environment
Information &
CommunicationMonitoring
CICL’s system of internal control is designed to achieve:
1. Effectiveness and efficiency of operations.2. Reliability of financial reporting.3. Compliance with applicable laws and regulations.
STRONG INTERNAL CONTROLS With the entire breadth of internal controls in place, CICL and Cooplife have in place a framework that encourages and promotes stewardship across all departments and branches. These strong and constantly reassessed control mechanisms practices provide the basic groundwork for ensuring the effectiveness of our Risk Management Framework. Our Board of Directors and Corporate Management at both CICL and Cooplife are committed to enforcing internal controls across processes and ensure consistent and uncompromised compliance with Corporate Governance Requirements.
AUDITING OF INTERNAL CONTROLS The internal control framework is reviewed on a regular basis by the Manager of Internal Audit, who is responsible for reporting all areas of concern and importance.

ANNUAL REPORT - 2018CO-OPERATIVE INSURANCE COMPANY90
Governance and Internal Controls
ELEMENTS OF INTERNAL CONTROLS AND RESPONSE
Internal Control ResponseControl environment y Board of Directors who are independent and are responsible for the overall health and
integrity of Company actions. y As insurers we operate with honesty, integrity and cooperation with all our Stakeholders y Accountability at work is expected from all our personnel and from our team of
managers. y Reporting and oversight structures are continuously aligned with best practices and to
enhance clarity and transparency.
Risk Assessment y Please refer Risk Management Framework from page 102 to 109.Control Activities y Audits and investigations are conducted regularly by the Internal Audit Division to
measure adequacy and accuracy of accounting records, on the strength of internal control systems and operational efficiencies; reporting to the Audit Committee on a regular basis.
y The Audit Committee which comprises of Board Members, views report and provides necessary action.
y Investment Committee performs the crucial role of maintaining and monitoring the performance of the investment portfolio. They continuously monitor the markets and macroeconomic developments while reviewing cash flow forecasts regularly.
y Procurement Committee controls the procurement of goods and services that are significant in nature.
Information and Communication
y For enabling the internal control system information on major classes of transactions is made available
y The information provided ensures clarity on how such transactions are initiated. y Financial Statements supplemented by significant accounting records are disclosed and
made available for supporting the internal control measurements. y Right from initiation of transactions and other events leading to their inclusion in
the Financial Statements can be viewed pertaining to the Accounting and financial reporting process.
Monitoring y Audits are performed on a regular and consistent basis by the Internal Audit Division and investigations are initiated as and when required. The reports of the audits and the investigations are viewed by the Audit Committee.

ANNUAL REPORT - 2018CO-OPERATIVE INSURANCE COMPANY 91
Compliance Status
SectionCorporate governance requirement
Compliance Status CICL's level of compliance
A DIRECTORSA.1 THE BOARD
Every company should be headed by an effective Board, which should direct, lead and control the Company.
Compliant The Board consists of thirteen (13) Directors. The majority of them represent Shareholders of co-operative societies being chairpersons of such co-operative societies. The Managing Director is also a member of the Board. Directors’ profiles are presented on pages 26 to 32 of this Annual Report.
A.1.1 The Board should meet regularly. Board meetings should be held at least once in every quarter of a Financial Year.
Compliant The Board of Directors usually meet on a monthly basis to review the Company’s performance and to determine whether its strategies and business practices are in line with the corporate plan. The attendance of the Directors in year 2018 has been 65%. During the year 2018, 12 Board meetings were held.
A.1.2 KEY RESPONSIBILITIES OF THE BOARDFormulation and implementation of the Business Strategy.
Compliant The Board is responsible for steering the Company towards its overall success. The Board delegates the authority to the Managing Director to formulate the required strategy.The Managing Director and the management team develop the Corporate Strategy.Annual Budgets and action plans are developed in order to implement the Corporate Strategy. Those are reviewed by the Board of Directors.
Ensuring that the MD and the Management Team possess the required skills, experience and knowledge to implement the strategy.
Compliant The Board ensures that the MD and the Management Team possess the required skills, experience and knowledge to implement the corporate plan and further to ensure that a proper succession plan is in place.The Board decides the remuneration of the MD and the Management Team ensuring that their performances are recognised equitably in terms of remuneration.
Effective systems to ensure the integrity of information, internal controls and risk management compliance with Laws and Regulations.
Compliant Adequate systems and procedures are implemented to ensure the integrity of information, effectiveness of internal controls and the appropriateness of risk management procedures. The Internal and External Auditors, management team regularly review these systems.Accordingly, the Board has set up the audit committee, investment committee, compliance and risk management committee, human resources and remuneration committee to ensure that the Company has proper systems and controls.The risk management policy has been adopted on the basis of norms set by the IRCSL in terms of RBC, solvency, technical reserves, reinsurance arrangements, actuarial reviews, and also occasional inspection by the Insurance Regulatory Commission officers.In the case of investment risk, the Company has adopted a policy of spreading investments in different institutions and commercial banks recognised by the Insurance Regulatory Commission so as to give a higher contribution to solvency levels.The underwriting risks have been kept within the proper levels of adequate assets and also within the reinsurance arrangements.

ANNUAL REPORT - 2018CO-OPERATIVE INSURANCE COMPANY92
Compliance Status
SectionCorporate governance requirement
Compliance Status CICL's level of compliance
Compliance with Laws and Regulations.
Compliant The Board ensures that all the applicable Laws and Regulations are complied with in the conduct of the affairs of the Company.The Company has submitted the regulatory returns and applicable payments to the IRCSL, Central Bank of Sri Lanka (CBSL), Department of Inland Revenue, Registrar General of Companies, National Council for Road Safety, Employees’ Trust Fund Board, National Insurance Trust Fund and Commissioner of Motor Traffic, within the stipulated time period.
Ensuring all stakeholder interests are considered in corporate decisions.
Compliant The Board ensures that the interests of all stakeholders are considered and safeguarded in making corporate decisions.
Recognising sustainable business development in corporate strategy, decisions and activities.
Compliant The Board recognises the necessity of sustainable business development in the corporate strategy, decisions and activities. Please refer our sustainability impact from page No. 44 to 45 for more information on Company's sustainable business development plan.
Ensuring that the Company’s values and standards are set with emphasis on adopting appropriate accounting policies and fostering compliance with financial regulations.
Compliant The Board ensures that the proper processes are in place and systems of control and procedures are implemented to review accounting policies annually to be in line with the changing business requirements. Company's accounting policies are fully in line with Sri Lanka Accounting Standards (SLFRS/LKAS).Please refer the Independent Auditor’s Report, which evidence that the Company’s Financial Statements are in line with Sri Lanka Accounting Standards, given on page 118.
Fulfilling such other Board functions as are vital, given the scale, nature and complexity of the business concerned.
Compliant Through board meetings and board sub-committee all matters of concerns are properly addressed. The Board takes all its decisions paying due attention to the interests of all stakeholders and paying due attention to all matters of concern.
A.1.3 The Board collectively, and Directors individually, must act in accordance with the laws of the Country, as applicable to the business enterprise.
Compliant The Board recognises the importance of complying with all the applicable laws and regulations in Sri Lanka and the Board are in accordance with the laws of Sri Lanka as applicable to the insurance industry.
A.1.5 All Directors should bring independent judgment to bear on issues of strategy, performance, resources (including key appointments) and standards of business conduct.
Compliant All Directors exercise independent judgment in decisions made by the Board on issues of strategy, performance, resource allocation and the conduct of business. The Board is conscious of its obligation to ensure that the Directors avoid conflicts between their duty towards the Company and towards their other interests. All Directors are expected to make decisions objectively, avoiding conflicts of interest and in the best interests of the Company.
A.1.6 Dedicating adequate time and effort by the Directors.
Compliant All Directors ensure that they are able to render sufficient time and attention to the affairs of the Company.
A.2 CHAIRMAN AND CHIEF EXECUTIVE OFFICERPrinciple: Division of responsibilities at the Head of the Company.
Compliant The posts of Chairperson and CEO were held separately. This segregation ensures a clear distinction between the Chairperson’s responsibility to manage the Board and the CEO’s responsibility to manage the Company’s day to day business, and thereby ensures the balance of power and authority and accountability to the Board of Directors.

ANNUAL REPORT - 2018CO-OPERATIVE INSURANCE COMPANY 93
SectionCorporate governance requirement
Compliance Status CICL's level of compliance
A.2.1 Disclosure required if the positions of the Chairman and the CEO are combined, the position of the Chairperson and the CEO are separated.
N/A -
A.3 CHAIRPERSON’S ROLEPrinciple: The Chairperson should preserve order and facilitate the effective discharge of Board functions.
Compliant The Chairperson is responsible for leading the Board and ensuring that it operates under the highest standards of governance. The Chairperson is charged with encouraging the effective participation of all Directors in the decision making processes and thereby ensuring the effective performance of the Board.
A.3.1 The Chairman should conduct Board proceedings in a proper manner and ensure,Operations of the Board are managed effectively.All key and relevant issues are discussed by the Board in a timely and constructive manner.Taking appropriate steps to provide effective communication with shareholders and to ensure that shareholders’ views are communicated to the Board as a whole.
Compliant The role of the Chairman is to conduct Board meetings in a manner which ensures that there is effective participation of all Directors and that their individual contribution and concerns are objectively assessed prior to making key decisions and the balance of power is maintained. He ensures that the Board is in complete control of the Company’s corporate affairs. Chairman also supports the Managing Director to manage day to day operations of the Company. Chairman is the ultimate point of contact to the shareholders at the AGM.
A.5 BOARD BALANCEPrinciple: The Board should have a balance of Executive and Non-Executive Directors.
Compliant The Board comprises of an Executive Director and Non-Executive Directors, with expertise, experience and knowledge in the insurance industry.
A.5.1 The Board should include at least two Non-Executive Directors or such number of Non-Executive Directors equivalent to one third of the total number of Directors, whichever is higher.
Compliant The Board comprises twelve Non-Executive Directors and one Executive Director who functions as the Managing Director. Details of the Directors of each Category are given on page 111.
A.5.2 Two or one-third of Non-Executive Directors appointed to the Board, should be ‘Independent’.
Compliant Five Directors out of thirteen total Directors are Independent Directors and it is complied with the requirement of the code.
A.6 SUPPLY OF INFORMATIONPrinciple: The Board should be provided with timely information, in a form and of a quality appropriate, to enable it to discharge its duties.

ANNUAL REPORT - 2018CO-OPERATIVE INSURANCE COMPANY94
Compliance Status
SectionCorporate governance requirement
Compliance Status CICL's level of compliance
A.6.1 The Management has an obligation to provide the Board with appropriate and timely information.
Compliant The Senior Management presents adequate information with regard to new developments, proposed strategies, financial operations, investment proposals, etc. to ensure clear communication of information.
A.6.2 The minutes, agenda and papers required for Board Meetings should be provided at least seven days before the meeting.
Compliant Comprehensive Board Papers are sent to Directors in advance (seven days prior to each meeting) of the Board Meetings giving them sufficient time to be prepared for the discussion. The Board Secretary maintains record of Board discussion Minutes of matters discussed by the Board.
A.7 APPOINTMENTS TO THE BOARDPrinciple: There should be a formal and transparent procedure for the appointment of new Directors to the Board.
Compliant All new appointments to the Board are made following a formal and transparent procedure in AGM, annually.
A.7.3 The Company should disclose information to the shareholders upon the new appointment of Directors.
Compliant All appointments of new Directors are informed to the shareholders at AGM. In addition, new appointments to the board are done after obtaining the approval from Insurance Regulatory Commission of Sri Lanka (IRCSL) according to the terms of the Regulations of Insurance Act.
A.8 RE-ELECTIONPrinciple: All Directors should be required to submit themselves for re-election at regular intervals and at least once in every three years.
A.8.2 All Directors including Chairman of the Board should be subject to election by shareholders at the first opportunity after their appointment, and to re-election thereafter at intervals of no more than three years.
Compliant Members of the Board of Directors are elected at the Annual Shareholders’ Meeting, for a three-year term. One-fourth of the Directors (approximately three Directors) retire every year on a rotation basis. This arrangement allows the Company to retain experienced members and to induct new members in order to infuse new ideas.
A.9 APPRAISAL OF BOARD PERFORMANCEPrinciple: Boards should periodically appraise their own performance in order to ensure that Board responsibilities are satisfactorily discharged.
Compliant The Board appraised itself on its performance in the discharge of its key responsibilities in the board meetings held during the year.
A.10 DISCLOSURE OF INFORMATION IN RESPECT OF DIRECTORSPrinciple: Shareholders should be kept advised of relevant details in respect of Directors.
A.10.1 Annual Report should contain details of all Directors.
Compliant Information with respect to all Directors is disclosed in page 26 to page 32 in this Annual Report, where relevant.

ANNUAL REPORT - 2018CO-OPERATIVE INSURANCE COMPANY 95
SectionCorporate governance requirement
Compliance Status CICL's level of compliance
A.11 APPRAISAL OF CHIEF EXECUTIVE OFFICER (CEO)Principle: The Board should be required, at least annually, to assess the performance of the CEO.
A11.1 The Board should set, with consultation of the CEO, the Financial and Non-Financial targets to be achieved by the CEO during the year, in line with short, medium and long-term objectives of the Company.
Compliant The Board sets targets (both Financial and Non-Financial) for each of the Financial Years based on the corporate plan, reviews them on a regular basis and discusses at the Board meetings. If such targets are not met, it also considers whether there are reasonable grounds for such departures and takes relevant action.
A.11.2 The performance of the CEO should be evaluated by the Board at the end of each year.
Compliant The Managing Director is responsible for day to day operations of CICL and accountable to the Board of Directors. The Board evaluates the CEOs performance through monitoring the achievement levels of set objectives during the year.
B DIRECTORS’ REMUNERATION
B.1 REMUNERATION PROCEDUREPrinciple: Companies should establish a formal and transparent procedure for developing policies on executive remuneration and for fixing the remuneration packages of individual Directors. No Director should be involved in deciding his/her own remuneration.
B.1.1 Set up a Remuneration Committee to make recommendations to the Board.
Compliant Human Resources and Remuneration Committee sets remuneration, per-requisites and allowances of the Directors, Management and other employees based on industry and market surveys.
B.1.2 Remuneration Committees should consist exclusively of Non-Executive Directors, and should have a Chairman, who should be appointed by the Board.
Compliant The Chairman of the Board also chairs the Human Resources and Remuneration Committee. Remuneration levels are designed to attract, retain and motivate persons who contribute to the achievement of the corporate plan.
B.1.3 The Chairman and Members of the Remuneration committee should be listed in the Annual Report each year.
Compliant Please refer the Annual Report of the Directors and the Members to the human resources and Remuneration Committee on page 86.
B.1.5 The Remuneration Committee should consult the Chairperson and CEO about its proposals relating to the remuneration of other Executive Directors and have access to professional advice from within and outside the Company, in discharging their responsibilities.
Compliant The Chairperson of the Board is also a member of the Human Resources and Remuneration Committee. The CEO attend meeting by invitation. Remuneration Committee obtain professional advice from within and outside the Company.
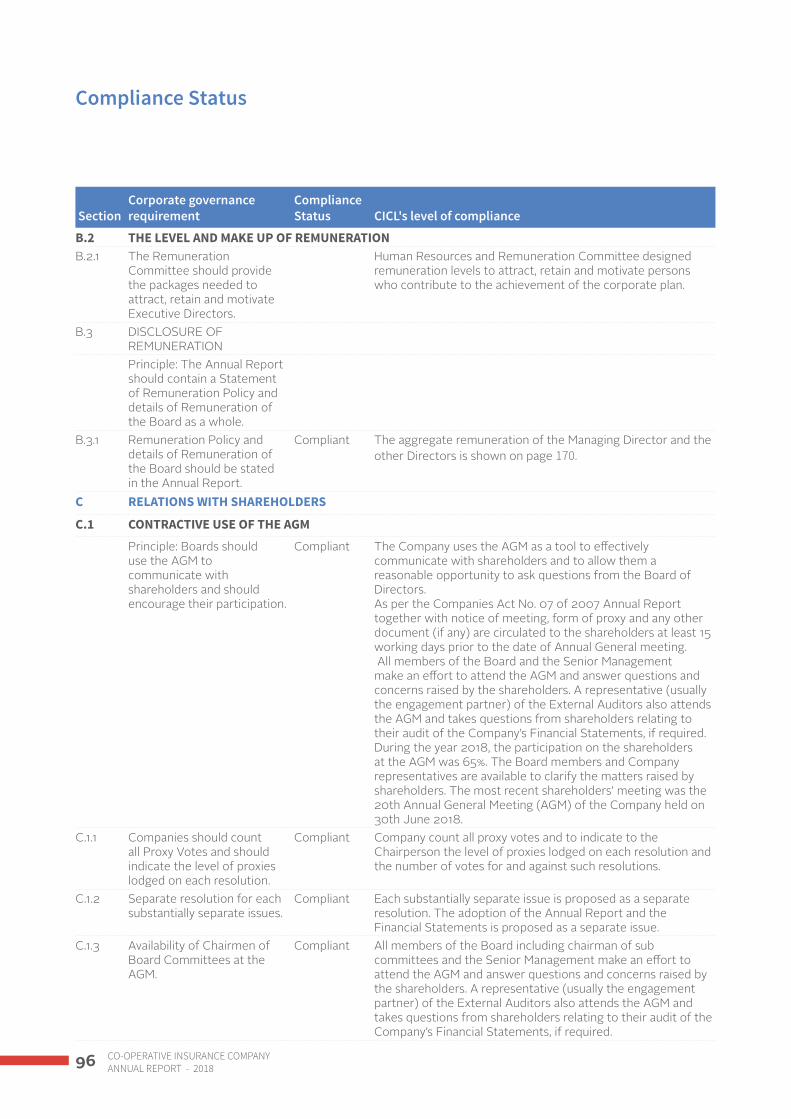
ANNUAL REPORT - 2018CO-OPERATIVE INSURANCE COMPANY96
Compliance Status
SectionCorporate governance requirement
Compliance Status CICL's level of compliance
B.2 THE LEVEL AND MAKE UP OF REMUNERATIONB.2.1 The Remuneration
Committee should provide the packages needed to attract, retain and motivate Executive Directors.
Human Resources and Remuneration Committee designed remuneration levels to attract, retain and motivate persons who contribute to the achievement of the corporate plan.
B.3 DISCLOSURE OF REMUNERATIONPrinciple: The Annual Report should contain a Statement of Remuneration Policy and details of Remuneration of the Board as a whole.
B.3.1 Remuneration Policy and details of Remuneration of the Board should be stated in the Annual Report.
Compliant The aggregate remuneration of the Managing Director and the other Directors is shown on page 170.
C RELATIONS WITH SHAREHOLDERS
C.1 CONTRACTIVE USE OF THE AGMPrinciple: Boards should use the AGM to communicate with shareholders and should encourage their participation.
Compliant The Company uses the AGM as a tool to effectively communicate with shareholders and to allow them a reasonable opportunity to ask questions from the Board of Directors. As per the Companies Act No. 07 of 2007 Annual Report together with notice of meeting, form of proxy and any other document (if any) are circulated to the shareholders at least 15 working days prior to the date of Annual General meeting. All members of the Board and the Senior Management make an effort to attend the AGM and answer questions and concerns raised by the shareholders. A representative (usually the engagement partner) of the External Auditors also attends the AGM and takes questions from shareholders relating to their audit of the Company’s Financial Statements, if required. During the year 2018, the participation on the shareholders at the AGM was 65%. The Board members and Company representatives are available to clarify the matters raised by shareholders. The most recent shareholders’ meeting was the 20th Annual General Meeting (AGM) of the Company held on 30th June 2018.
C.1.1 Companies should count all Proxy Votes and should indicate the level of proxies lodged on each resolution.
Compliant Company count all proxy votes and to indicate to the Chairperson the level of proxies lodged on each resolution and the number of votes for and against such resolutions.
C.1.2 Separate resolution for each substantially separate issues.
Compliant Each substantially separate issue is proposed as a separate resolution. The adoption of the Annual Report and the Financial Statements is proposed as a separate issue.
C.1.3 Availability of Chairmen of Board Committees at the AGM.
Compliant All members of the Board including chairman of sub committees and the Senior Management make an effort to attend the AGM and answer questions and concerns raised by the shareholders. A representative (usually the engagement partner) of the External Auditors also attends the AGM and takes questions from shareholders relating to their audit of the Company’s Financial Statements, if required.

ANNUAL REPORT - 2018CO-OPERATIVE INSURANCE COMPANY 97
SectionCorporate governance requirement
Compliance Status CICL's level of compliance
C.1.4 Adequate notice of the AGM.
Compliant The Annual Report, together with the Notice of Meeting and related documents and other resolutions, if any, is circulated to the shareholders at least 15 working days prior to the date of the AGM.
C.1.5 Summary of procedures governing voting at the AGM.
Compliant A summary of procedures governing voting at the AGM is provided in the Proxy Form which is circulated to the shareholders, fifteen working days prior to the AGM. Please refer page 212 for the Notice of Meeting of the 21st AGM to be held on 7th July 2019. The proxy form which includes a summary of the procedures governing voting at the General Meetings, is circulated to all shareholders.
C.2 COMMUNICATION WITH SHAREHOLDERSPrinciple: The Board should implement effective communication with shareholders.
C.2.1 There should be a channel to reach all shareholders of the Company in order to disseminate timely information.
Compliant All financial information released to the shareholders is authorised by the Chief Executive Officer and/or Chief Financial Officer. Any other information released to the public is approved by the CEO and/or Chief Operating Officer and is communicated through the Head of Marketing.
C.2.2 Disclose the policy and methodology for communication with shareholders.
Compliant The Company keeps informed their shareholders via AGM, responding to inquiries from shareholders and provide feedback .
C.2.3 Disclose how the Company has implemented the above policy and methodology.
Compliant Company uses the Annual Report to inform its shareholders on the affairs of the Company including major Financial and Non-Financial information, regulatory requirements and other assurance reports issued by independent parties like external auditors and etc;
Equal treatments for shareholdersThe Company ensures the equal treatment of all shareholders. Accordingly Annual Report of the Company is translated to Sinhala and distributed among shareholders.
Sustainability reportingInformation on the our sustainability impact which are given on pages 44 to 45 in this Annual Report includes the ways in which the Company seeks to achieve sustained profits for shareholders, develop long-lasting customer relationships, value our employees and manage the social and environmental impacts of our business.
Corporate websiteOur corporate website provides an additional channel for shareholders, customers and other stakeholders to access information about the Company. Financial Statements, details of the Company, names of the Board of Directors and the Executive Committee members, information on new products, which could be accessed at www.ci.lk

ANNUAL REPORT - 2018CO-OPERATIVE INSURANCE COMPANY98
Compliance Status
SectionCorporate governance requirement
Compliance Status CICL's level of compliance
C.2.4 Disclose the contact person for such communication.
Compliant CEO and Company Secretary will be the main contact persons with regard to any public disclosures. Therefore, any clarification or further information with regard to any information published about the Company should be directed to the Chief Executive Officer.Further, clarifications with regard to any Financial information published can also be directed to the Chief Financial Officer of CICL through the details given on page 8.
C.2.5 A process to make all Directors aware of major issues and concerns of shareholders, and this process has to be disclosed by the Company.
Compliant If there are any major issues and/or concerns raised by shareholders, they are brought to the attention of all Directors by the Company Secretary. No such issues and/or concerns were raised by the shareholders during the year.
C.2.7 The process for responding to shareholder matters.
Compliant The Company’s aim is to provide an appropriate reply to written requests from shareholders, within a reasonable time. If those queries raise a matter of general interest to shareholders, the Company will take this into account and will address them in subsequent corporate communications to all shareholders.
C.3 MAJOR AND MATERIAL TRANSACTIONSPrinciple: Directors should disclose to shareholders all proposed material transactions.
The Company’s future strategies and their potential impact, if any, have been disclosed in the Chairman’s Message and the Managing Director’s Review.
C.3.1 Proposed major transactions. N/A There were no major transactions during the year.
D ACCOUNTABILITY AND AUDIT
D.1 FINANCIAL REPORTINGPrinciple: Board responsibility for statutory and regulatory reporting.
D.1.1 Board’s responsibility for interim and other price-sensitive public reports, statutory and regulatory reporting.
Compliant The respective responsibilities of Board of Directors and the External Auditors are described in the Statement of the Directors’ Responsibilities, and the External Auditors’ Report on page 116 and 118 respectively.The Annual Report, which is the main communication tool between the Company and the shareholders, is prepared and presented in compliance with the Sri Lanka Accounting Standards, Companies Act No. 07 of 2007, Regulation of Insurance Industry Act No. 43 of 2000 and other rules and regulations of the Sri Lanka Insurance Regulatory Commission and other applicable rules and regulations of the country. The Annual Financial Statements and Regulatory Reports are submitted to the Authorities on a timely basis.The Compliance Officer is appointed by the Board of Directors.
D.1.2 Declarations by Directors in the Directors’ Report.
Compliant The Annual Report of the Board of Directors on the affairs of the Company is presented on pages 110 to 113.

ANNUAL REPORT - 2018CO-OPERATIVE INSURANCE COMPANY 99
SectionCorporate governance requirement
Compliance Status CICL's level of compliance
D.1.3 Statements by Directors and Auditors.
Compliant The Annual Report of the Board of Directors on the affairs of the Company is presented on pages 110 to 113.The Auditor’s Report is provided on page 118.
D.1.4 The Annual Report should contain a ‘Management Discussion and Analysis’
Compliant The Management Discussion and Analysis is given on pages 54 to 82 of this Annual Report, which covers the disclosure requirement under this Code.
D.1.5 Declaration of going concern by the Directors.
Compliant The Board after conducting necessary reviews and inquiries decided to apply the ‘going concern’ assumption in presenting the Company’s Financial Statements.The declaration of the Company as a ‘going concern’ is given in the Statement of Directors’ Responsibility on page 116.
D.1.6 Summon an Extraordinary General Meeting (EGM)
N/A There has not been any requirement to summon an Extraordinary General Meeting (EGM) to notify serious loss of capital. Although the likelihood of such a situation is remote, if it arises, an EGM would be called to inform shareholders.
D.2 INTERNAL CONTROLPrinciple: The Board should maintain a sound system of internal controls to safeguard shareholders’ investments and the Company’s assets.
The Board is ultimately responsible for the Company’s system of Internal Controls and the continuous review of their effectiveness. Some of these responsibilities are delegated to Audit committee.
D.2.1 Directors to conduct an annual review of the risks facing the Company and the effectiveness of the system of internal controls.
Compliant Investment Committee, Human Resources and Remuneration Committee, Purchasing & Selling Committee and Business Development Committee to ensure effectiveness of internal controls.
D.2.2 Internal audit function. Compliant The internal audit function is carried out by the team of Internal Auditors headed by a person well experienced and competent to carry out the internal audit functions. The Internal Auditor directly reports to the Chairman and the Board of Directors. The Board is of the opinion that the function of the Internal Auditor would provide a more independent view on the Company’s system of internal controls.
D.2.3 Audit Committee to carry out reviews of the process and effectiveness of risk management and internal controls.
Compliant Effective internal control system is ensured by the audit committee. It reviews the effectiveness of the internal control system through the Internal Audits. Risk management committee decisions are discussed audit committee meeting reviews since the Audit Committee carries the responsibility over the Company’s risk management practices.
D.2.4 Statement of internal control Compliant A statement on internal control is given on pages 84 to 90.
D.3 AUDIT COMMITTEEPrinciple: The Board should establish formal and transparent arrangements for considering how they should select and apply accounting policies, financial reporting and internal control principles and maintain an appropriate relationship with the Company’s Auditors.
The Audit Committee is a sub-committee of the Board and comprises of four (04) Non-Executive Directors. The Audit Committee is chaired by a Chartered Accountant who is a professional Director. The term of reference under which the Committee has been appointed sets out its scope and responsibilities and enables it to operate with appropriate authority, independence and objectivity.

ANNUAL REPORT - 2018CO-OPERATIVE INSURANCE COMPANY100
Compliance Status
SectionCorporate governance requirement
Compliance Status CICL's level of compliance
D.3.1 Composition of the Audit Committee.
Compliant Please refer the Report of the Audit Committee on page 117 for details on the functions of the Audit Committee.
D.3.2 Duties of the Audit Committee on the review of objectivity of the External Auditor.
Compliant The Audit Committee monitors and reviews the External Auditor’s independence, objectivity and the effectiveness of the audit process, taking into account the relevant professional and regulatory requirements.Deloitte Sri Lanka, (SJMS Associates), the Auditors of the Company, has given a declaration of its independence to the Audit Committee, as per the relevant rules.
D.3.3 Terms of reference of the Audit Committee.
Compliant The Audit Committee operates with clearly defined terms of reference which are reviewed annually. Key areas of focus are; - Composition - Meetings - Internal audit - External audit - Financial reporting - Compliance and litigation - Risk management and internal control - Reporting responsibilities - Related party transactions - Other responsibilities
D.3.4 Disclosures required by the Audit Committee in the Annual Report.
Compliant Audit committee report on page 117 includes Names of the Directors in audit committee and other disclosure.
D.5 CORPORATE GOVERNANCE DISCLOSURESPrinciple: Directors should be required to disclose the extent to which the Company adheres to established principles and practices of good corporate governance.
D.5.1 Disclosure of Compliance with the Corporate Governance Code.
Compliant Company has included corporate governance report from pages 84 to 101, setting out the manner and extent to which the Company has complied with the principles and provisions of the Code of Best Practice on Corporate Governance issued jointly by the SEC and the CA Sri Lanka.
E INSTITUTIONAL INVESTORS
E.1 SHAREHOLDER VOTINGPrinciple: Should ensure institutional shareholders’ voting intentions are translated into practice.
E.1.1 Communication with Shareholders.
Compliant Please refer details on shareholder communication under C.2.1 and C.2.2 on page 97.

ANNUAL REPORT - 2018CO-OPERATIVE INSURANCE COMPANY 101
SectionCorporate governance requirement
Compliance Status CICL's level of compliance
F OTHER INVESTORSF.1 Principle: Individual
shareholders, investing directly in shares of companies, should be encouraged to carry out adequate analysis or seek independent advice in investing or divesting decisions.
Compliant Individual shareholders are encouraged to carry out adequate analysis or seeking dependent advice on their investing, holding or divesting decisions. The Annual Report contains sufficient information to make an informed decision.
F.2 SHAREHOLDER VOTINGF.2 Principle: The Company
must encourage individual shareholders to participate in General Meetings and exercise voting rights.
Compliant All shareholders are encouraged to participate at General Meetings and cast their votes.
G SUSTAINABILITY REPORTINGG.1 Principle: of sustainability
reporting.Compliant The Company, having identified the importance of
sustainability reporting, provides a detailed review of its sustainability initiatives. Please refer our Sustainability impact on page 44 to 45.

ANNUAL REPORT - 2018CO-OPERATIVE INSURANCE COMPANY102
Risk Management
CICL is staunch in our approach to managing risks across all our internal processes. With a 360 degree approach to mitigating risk and countering them with the least amount of impact, we constantly review and re-evaluate our approaches to all risk elements, ensuring that our stakeholder interests are safeguarded throughout the Financial Year, bearing in mind the volatile nature of the industry and the external environment.
A small player in an increasingly competitive industry, we are also challenged by risks that arise due to determinants that prevail in the macro-economic and regulatory environments. In addition, the nature of our risk-based business compels us to take highly prudent and stringent measures to risk management and mitigation. Our focus on risk mitigation and control is to ensure that the Company’s capital base is safeguarded while ensuring sustainable value creation for all stakeholders. Fundamental in its purpose, CICL’s Risk Management Framework is a core aspect of the Company’s operational processes.
The macro-economic environment in the Financial Year exposed CICL to various risk exposures that was at times inconsistent with our strategies and objectives.
TAX REVISIONSThe tax hikes of various imported vehicles posed a greater threat to the Motor Insurance Business, creating uncertainty given the potentially negative ramifications of the decline in newly registered vehicles. The increasing cost of vehicle insurance in light of the increased taxation of imported vehicles, impacted vehicles which were in high demand over the previous years.
The increments in VAT, added more risk exposure, posing negatively on business growth and expansion objectives. The changes introduced to the Inland Revenue Act, posed a greater risk in lowering the net profit of life insurers. Surplus distributions from policyholder funds to shareholders from are required to be taxed at 28%. According to the ‘investment income minus management fees’ method life insurers were subjected to lower taxation. In addition, a 14% tax is now levied on distributions made to participating life policyholders.
INDUSTRY CONSOLIDATIONSIn the Financial Year, another acquisition took place within the industry: part of a series of mergers and
acquisitions that took place since 2014. These alliances within the domestic market created greater synergies with stronger competitive advantages and economies of scale for competing insurers. The acquisitions that occur between local insurance companies and subsidiaries of global insurers create far higher cost advantages. The reinsurance funds of these foreign companies bring in greater potentials and benefits that can be transferred to customers.
POSITIVE PERFORMANCEThis overall competitive environment created challenging environment, amidst which, CICL still retained an increase in its market share, reporting a positive and progressive financial performance, proving the stealth and vitality of our financial health.
REGULATORY IMPACTSIn 2018, the Risk Based Capital (RBC) adequacy level increased to 160. Nevertheless, CICL has complied with the mandatory level, maintaining the RBC at 178%. However, the increase is expected to lower availability of capital needed for expansion plans in the future.
FUTURE OUTLOOKThe new tax changes imposed on CIF values of vehicles that exceed Rs. 3.5 Mn. is expected to deter imports, while increasing cost of insurance for vehicle owners. This brings in the risk of lowered growth of GWP in the Motor segment. However, the increasing per capita income and the positive perspective on insurance by the general public is expected to maintain industry growth.
CICL currently waits to fulfill the requirement of listing the Company on the Colombo Stock Exchange, in compliance with insurance regulations. However, the non-conducive market conditions compelled the Company to obtain a deferral from authorities in 2018. This prevailing condition has yet to dissipate allowing us to attract potential investors and in providing the right guarantee of returns to fulfill the full capital requirement.
Impacts of tax revisions especially the effect of compounding cost on businesses is expected to weaken demand for motor and other general insurance segments with customers choosing to acquire third party or basic insurance policies, opting out of choosing comprehensive cover policies.
Nevertheless, despite the market volatilities and regulatory changes, CICL is on a progressive path of

ANNUAL REPORT - 2018CO-OPERATIVE INSURANCE COMPANY 103
creating a leaner work culture and efficient operations, while rapidly expanding across the country through a strategy of cost optimization while enhancing brand image through the strategy of expansion. Simultaneously, CICL’s diverse and strong team of field advisers are spearheading promotion of our solutions, creating awareness on insurance at grass-root levels, including rural and urban market holds.
RISK MANAGEMENT FRAMEWORKOur Risk Management Framework ensures risk mitigation through inclusive strategies that are developed for our core processes. Key Risk Areas identified under the Risk Management Framework have a spillover effect that impacts each process. The framework has been adopted based on the areas implied by IRCSL and overlaps with our Governance and Internal Control Processes.
The Risk Management Framework provides the management the necessary direction and protocols in managing risk adversities amidst other core objectives which include: avoiding or mitigating losses from magnifying beyond the forecasted impact, to provide a
cohesive and thorough policy framework that does not overlook crucial aspects across key risk areas, to provide the proper tools to allow management to identify risks and evaluate them according to their risk potentials and impact on the Business. However, the most important objective is to maintain the consistent creation of earnings and to enhance business potentials without little or no disruptions to the value creation process and expected outcomes.
THE THREE TIERS OF RISK MANAGEMENTCICL’s Risk Management structure includes Three Lines of Defense that enable the structured management of risks and proper execution of strategies when risk adversities do arise. Ultimate responsibility rests within the Board of Directors, responsible for the prudent management of the risk framework across all our processes and activities. The Risk Management Framework corresponds with the nature of activities performed by the Company and is embedded into the internal control system of Co-operative Insurance.
THE THREE TIER FRAMEWORK
1st Line of Defence
Business Unit Heads
Monitor external environment for risks and impacts through feedback from field staff, business partners and customers.
Observe variations in business volumes and inform Top Management.
Risk management committee formed at the level of operational management - identifies, evaluates and assesses the potential risks.
2nd Line of Defence
Internal audits &external audits
Internal Audit reports directly to the Audit Committee, which reports to the Board.
Conduct regular audits to measure the adequacy of accounting and internal systems, efficiency of operations and reliability and the accuracy of the accounting records and recommend improvements.Conduct investigations for reported and revealed mal-practices for recovery of losses, strengthen control systems and deterrents
External Audits:
These are conducted by Messrs Deloitte Sri Lanka (SJMS Associates) - Chartered Accountants and reported to shareholders.They report on the strength of the accounting and internal control systems and recommend improvements.
3rd Line of Defence
Compliance Officer/Audit Committee Board of Directors
Monitor effectiveness of risk management methods.
Recommend risk controlling measures to the Board.
Empower the responsible personnel to take appropriate actions to control risks.

ANNUAL REPORT - 2018CO-OPERATIVE INSURANCE COMPANY104
KEY RISK AREAS AND RISK CONTROL MECHANISMRisk areas under the Risk Management Framework address all potential risks that could emanate from regulatory, market and macroeconomic changes and developments. (For key risk areas please refer pages 105-109)
RISK CONTROL MECHANISMCICL and Cooplife follow a thorough and comprehensively devised risk management framework that incorporates Control Mechanisms across all risk exposures. These risk exposures are frequently revisited and steps are taken to realign them with further exposures that may result with macroeconomic and regulatory changes that could affect the insurance business adversely.
The Control Mechanisms are structured to ensure effective monitoring and mitigation of risks. Responsibility for effectively managing risk is shared across the Risk Management Committee, Internal Audit, Audit Committee and Compliance officer, alongside Business Unit Heads and External Audit (Messrs Deloitte Sri Lanka (SJMS Associates).
Risk Management
CICL’s Risk Profile 2018-19
Likelihood of impact
Se
ve
rity o
f imp
act
High
High
Low
Low employee productivity
Impact of new tax regime
Entry of international players and formation of larger players through amalgamation
RBC level to further increasein 2018
Shrinking motor market
Rising underwriting losses
Increasing customer expectations
Risks associated with listing in the stock market

ANNUAL REPORT - 2018CO-OPERATIVE INSURANCE COMPANY 105
KEY RISK AREAS AND RESPONSES Risk Area Description of Risk Control Mechanisms STRATEGIC RISKStrategic risk Inability to implement agreed
strategies and action plans due to conditions such as activities of rivals, insufficient capacities to meet the requirements of the market, resource constraints etc.
CICL has a five year strategic plan approved by the Board.
The Board regularly reviews actual performance against the budget and adjustments action plans in line with the external changes. For closer monitoring the corporate budget is subdivided among each line of business and at branch level and the performance of the management team is linked to the divisional/branch goals.
UNDERWRITING RISKExposure Risk Holding risks beyond the
Company’s net retention capacity and not having sufficient reinsurance arrangements.
The Company Financial Authority Manual, in its sections on underwriting and claims settlements, defines the limits of authority applicable in making decisions relating to the underwriting of risks and settlement of claims.Underwriting is done on a selective basis considering the appropriateness of the return to compensate the risk associated with. Whilst not undertaking loss making businesses the Company maintains records of statistics of transactions of clients.All risks exceeding the Company’s retention levels are reinsured with reinsurers who meet the criteria specified by the regulator, the Insurance Regulatory Commission of Sri Lanka.The Company conducts training programmes for staff involved in underwriting and claims settlements. The Company regularly seeks advice from the Consultant Actuary on terms, conditions and benefits included in insurance policies to ensure appropriate pricing.Review the wording of the policies and promotional materials to prevent claims from causes that are not anticipated.Product prices are set through a financial analysis including review of past experiences of the Company and the industry.Reinsurance is managed to reduce net liability on large individual risks, to have greater diversification of insurance risk and to provide protection against large losses. Underwriting is carried out by trained dedicated staff. The experience and merits of the staff are applied on individual basis in underwriting each and every risk.

ANNUAL REPORT - 2018CO-OPERATIVE INSURANCE COMPANY106
Risk Area Description of Risk Control Mechanisms Credit risk Policyholders who obtain
insurance covers on credit basis, may fail to meet their obligations to the Company on time.
The Company implements the Premium Payment Warranty (PPW) and ceases the liability of policies for which premium settlements are not received within the stipulated period.All premium receivables are monitored and every possible action is taken to collect premiums within the given period and to minimise policy cancellations.Managing Director and the other respective officers meet regularly to review the status of outstanding premiums and monitor collections.The ultimate authority of credit approval is held by the Managing Director. Credit approval authority is delegated to different levels of management as appropriate.
Reinsurance risk Retaining risks beyond the Company’s net retention capacity as against having adequate reinsurance arrangements. This risk also includes the inability of reinsurers to meet their commitments due to insufficient financial strength.
No insurance cover is issued for risks above treaty limits, without a confirmed reinsurance arrangement.We deal with reputed and rated reinsurance brokers to reduce the reinsurance risk in reinsurance placement and claims recovery.Risks relating to riot and terrorism are placed with the Government controlled National Insurance Trust Fund (NITF).
Continuously monitor the reinsurance agreements and the credit risk of the reinsurers.
Claims settlement risk
False or undue claims. Training for claims management team to verify the genuineness of claims.Claims are assessed periodically and appropriate actuarial reserves are established to reflect up to date experience and any anticipated future events. This includes reserves for claims incurred but not yet reported.The Company consults professional loss adjusters and independent assessors.There is a claim panel (non-life) for significant and/or complicated claims and appeals are also reviewed by the claim panel.The Company’s Legal Officers attend to disputes and other legal matters relating to claims and also for third party related claims.
Risk Management

ANNUAL REPORT - 2018CO-OPERATIVE INSURANCE COMPANY 107
Risk Area Description of Risk Control Mechanisms Reserving risk Inadequacy of reserves made to
meet future obligations arising from claims.
Standard claim reserves are made as soon as the required information is received for intimated claims. There is a 24 hour customer care center set up for customers to intimate their claims.Claims are assessed and reserves are made at the earliest, upon claim intimation. A claim is made active for processing for six months in order to ensure the optimality in making provisions.The services of a qualified Independent Actuary is obtained to assess the adequacy of reserves made in relation to incurred but not reported (IBNR) and incurred but not enough reported (IBNER) claims in the general insurance business.The service of a qualified Independent Actuary is obtained to review reserving in the life insurance business.Liability Adequacy Test (LAT) is carried out by an Independent Actuary.The Company conducts regular training for the staff on the reserving process for underwriting and claims.
Investment risk The possibility of the outcome of investments being lower than expected.
The Investment Committee, headed by the Chairman, evaluates the investment opportunities in detail and recommends to the Board. The Company considers different types of risks in investments.
Market risk Impairment in the value of investments due to factors that affect the overall performance on the financial market due to incidents such as natural disasters or conditions such as recessions, political turmoil, interest rate changes and commotions etc.
The Investment Committee keeps a close track on possible occurrences that would have impact on the value of the investments and the market rates. Possible actions are taken to reduce any adverse impact on the value of the investment portfolio within the regulatory limits.The investment portfolio is reviewed by the Investment Committee on a timely basis and analyses the vulnerability of individual investments to market risk. Investment opportunities are analysed in terms of nature of investment and the quality of the investee organisation.
Liquidity risk The inability to meet contractual obligations (claims and reinsurers’ payments) due to a shortfall of liquid assets in the investment portfolio.
The Investment Committee reviews the maturity mix of the investment portfolio on regular basis to ensure that the liquidity levels and other regulatory requirements are maintained.Cash flow movements are studied in advance and monitored on a daily basis. Investment opportunities are selected to meet the short term and long term cash flow requirements.Life Insurance policies with guaranteed returns are secured by investments with higher returns with similar tenure.

ANNUAL REPORT - 2018CO-OPERATIVE INSURANCE COMPANY108
Risk Area Description of Risk Control Mechanisms Credit risk The risk of being unable to
recover the capital and/or the interest relating to the investment from the investee organisation due to declining financial strength.
The credit worthiness of investee organisations is assessed by the Investment Committee via the ratings awarded by the Rating Agencies to the issuing institution as well as the instrument.The Company follows a conservative policy of investing in Government Securities in preference to corporate instruments.All investments in Government Securities are made through primary dealers approved by the Central Bank of Sri Lanka.
Single party exposure limits are decided based on the credibility of the issuing institutions whilst adhering to single party exposure limit rules required by the Regulator.
OPERATIONAL RISKHuman resources risk
Human resources risk refers to the possibility that lack of competent personnel and key employees leaving the organisation. Human resources risk is considered as the most significant element of the operational risk as it ramifies to the other risks within the operation.
Remuneration packages for the staff are set in line with the industry to retain and attract staff with necessary qualifications and experience.Professional and personnel development programs are provided to the staff. The Company encourages continuous education whilst providing relevant training and development opportunities and fosters a culture where all employees can actively contribute to the business.Continuous training and education of staff are further encouraged through the provision of financial and other support.Opportunity is given to the employees to meet the higher level of management to discuss their grievances or matters they wish to deal with confidentiality.
Economic and political risk
Outcome of the socio-economic and political factors have an impact on the expected status of performance of the Company. The impact can directly and mainly affect the insurance business, the investment income and the investment value.The management takes necessary action to mitigate the impact on possible events whilst absorbing the others.
Closely monitor the changes and their trends in the external environment due to political and economic factors and assess their potential risks.
Facilitate the relevant staff to attend to educational and training programs on economic trends, developments and their consequences.
Seek experts’ opinion on outcomes of possible political and economic changes, when necessary.
Ensure that the Company follows a politically neutral policy.
Risk Management

ANNUAL REPORT - 2018CO-OPERATIVE INSURANCE COMPANY 109
Risk Area Description of Risk Control Mechanisms
Information technology risk
Possible losses due to use of inadequate technology, inappropriate use of technology, technical mishaps and disaster situations.
The Company assesses the status of information technology infrastructure to ensure their appropriateness to manage the needs and the scale of operation of the Company.Policy on the security of information and information technology infrastructure is implemented and updated timely.
Disaster recovery methods are planned and ready for implementation on urgent situations.
Fraud risk Fraudulent acts that could take place due to inadequate internal controls.
Internal Audit Team, to report on the strength of the internal control systems with their recommendations on areas that need further strengthening. The Internal Audit Team reports to the Internal Audit Committee that includes four Directors.In cases of frauds, mal-practices and discrepancies etc., immediate investigations are carried out followed by corrective actions to recover any losses. Corrective actions are taken to prevent recurrence.A Procurement Committee comprising five Directors have been appointed. Goods and services that are significant in terms of value and complicated in terms of nature are procured on the approval of the Procurement Committee.Staff is educated about the laid down internal control systems in order for them to execute transactions in the transparent manner and prompt to the management of any doubts. Any such references are investigated and appropriate actions are taken immediately.Provisions in the Anti- Money Laundering Act are followed up strictly.
Regulatory risk Regulatory risk refers to the possibility of being non-compliant to the regulatory requirements laid down from time to time to govern the insurance industry. In addition, there can be risk of non-compliance to the other common laws and accounting standards in relation to presentation of financial status of the Company.
Company culture insists on the achievement of full compliance with legal and regulatory requirements.Internal Auditors review the status of compliance to regulatory requirements and refer any non-compliance to the Board through Audit Committee. Their findings are discussed and addressed on a timely basis.Experts are appointed to review changes to the regulatory regime and assess impact on the business as well as to advise on compliance requirements.A Compliance Officer is tasked with ensuring that regulatory requirements are observed and complied.

ANNUAL REPORT - 2018CO-OPERATIVE INSURANCE COMPANY110
Annual Report of the Directors
The Board of Directors has pleasure in presenting their report to the members together with the Audited Financial Statements for the year ended December 31, 2018 and the Auditor’s Report thereon of Co-operative Insurance Company Ltd., a limited liability company incorporated in Sri Lanka on August 11, 1997 under the Companies Act No. 17 of 1982 and re-registered on December 31, 2008 as required under the provisions of the Companies Act No. 07 of 2007.
PRINCIPAL ACTIVITIESThere was no significant change in the nature of the principal activities of the Company during the year and general insurance remained to be the principal activity of the company. The Company has not engaged in any activity which contravenes the Laws and Regulations of the country.
REVIEW OF BUSINESS AND FUTURE DEVELOPMENTSA review of the financial and operational performance and future developments of the Company is contained in the Chairman’s Report, the Managing Director’s Review and the Management Discussion and Analysis of the Annual Report. These reports form an integral part of the Report of the Directors’ and together with the audited Financial Statements reflect the state of affairs of the Company.
FINANCIAL STATEMENTS AND AUDITOR’S REPORTThe financial statements of the Company are prepared in conformity with the Sri Lanka Accounting Standards laid down by The Institute of Chartered Accountants of Sri Lanka (CA Sri Lanka) and comply with the requirements of the Companies Act No. 07 of 2007 and the Regulation of the Insurance Industry Act No. 43 of 2000 and other rules issued by the Insurance Regulatory Commission of Sri Lanka (IRCSL).
The financial statements duly signed by the Directors are provided on pages 120 to 199 and Auditor’s Report on financial statements is provided on page 118 and 119 of this annual report.
DIRECTORS’ RESPONSIBILITY FOR FINANCIAL REPORTINGThe Statement of Directors’ Responsibilities for Financial Reporting is given on page 116 which forms an integral part of the Annual Report of the Board of Directors.
TURNOVER/GROSS WRITTEN PREMIUM (GWP)The total turnover measured by the Gross Written Premium (GWP) of the group of companies for the financial year under review amounted to Rs. 3,750.83 Mn (Rs. 3,055.83 Mn in 2017).
Group Company
2018 2017 2018 2017
Rs. ‘000’ Rs. ‘000’ Rs. ‘000’ Rs. ‘000’
Net profit before tax 414,748 453,991 405,776 399,111
Income tax (3,102) (83,222) (137,622) (97,678)
Net profit after tax 411,646 370,769 268,154 301,433
Profits attributable to NCI 33,469 13,787 - -
Unappropriated profit brought forward 614,178 398,581 553,311 398,065
Funds available for appropriation 992,355 755,563 821,465 700,038
Effect on partial investment in subsidiary - 1,306 - -
Changes in holding without changing in control (36) - - -
Other comprehensive income 5,038 2,307 4,832 (1,729)
Dividend paid (170,134) (144,998) (170,134) (144,998)
Unappropriated profits carried forward 827,223 614,178 656,163 553,311
Earnings per share (Rs.) 2.93 2.77 2.08 2.34

ANNUAL REPORT - 2018CO-OPERATIVE INSURANCE COMPANY 111
THE BOARD OF DIRECTORSThe Board of Directors consists of 13 Directors and their names and status are stated in the table below. The following Directors held office as at the Balance Sheet date and their profiles are given on pages 26 to 29 of the annual report.
Name of the Director Status
Mr. W. Lalith A. Peiris (Chairman) Non-Executive DirectorMr. K.R.K.N. Jayasinghe (Vice-Chairman) Non-Executive DirectorMr. K.R.W. Ranasinghe (Managing Director) Executive DirectorMr. D.P. Amaradeva Non-Executive DirectorMr. K.J. Sesiri Non-Executive DirectorMr. R. Sooriyaarachchi Non-Executive DirectorMr. C.P. Jayasinghe Non-Executive DirectorMr. R.G.K. Rankothge Non-Executive DirectorMr. A.D.T.S. Palitha Non-Executive DirectorMr. J.M.V.P. Jayasooriya Non-Executive DirectorMr. P.P.D.S. Kularathna Non-Executive DirectorMr. K.S.S. Weerasekara Non-Executive DirectorMr. D.L. Samarawickrama Non-Executive Director
DIRECTORS’ MEETINGS The number of Directors’ meetings which comprises Board meetings, Audit Committee meetings, Investment Committee meetings and Remuneration Committee meetings together with the attendance of each Director at these meetings during the year are tabulated below:
Name of Director
Board Meetings
Audit Committee
Meetings
Investment Committee
Meetings
Human Resources
Committee Meetings
Business Development
Committee
Purchasing Committee
A B A B A B A B A B A B
1 Mr. W. Lalith A. Peiris – Chairman 12 12 - - 03 02 11 08 03 02 10 062 Mr. K.R.K.N. Jayasinghe –
Vice Chairman12 12 - - - - 11 06 - - 10 07
3 Mr. K.R.W. Ranasinghe – Managing Director
12 12 - - 03 03 11 07 03 02 10 09
4 Mr. D.P. Amaradeva 12 12 16 16 - - - - - - - -5 Mr. R. Sooriyaarachchi 12 10 - - 03 03 - - - - 10 106 Mr. K.J. Sesiri 12 12 - - - - 11 11 - - - -7 Mr. C.P. Jayasinghe 12 12 - - - - - - 03 03 10 108 Mr. R.G.K. Rankothge 12 12 16 16 - - - - - - - -9 Mr. A.D.T.S. Palitha 12 12 16 16 - - - - - - - -10 Mr. J.M.V.P. Jayasooriya 12 12 16 13 - - - - - - - -11 Mr. R.M.B.M. Bandara
(Retired on 30.06.2018)07 07 - - - - - - 01 01 - -
12 Mr. P.P.D.S. Kularathna 12 12 - - 03 03 11 10 - - - -13 Mr. K.S.S. Weerasekara 12 11 - - - - - - 03 03 - -14 Mr. D.L. Samarawickrama
(Appointed on 02.08.2018)05 05 - - - - - - 02 02 - -
A – Number of Meetings held during the period while the director was holding officeB – Number of meetings attended

ANNUAL REPORT - 2018CO-OPERATIVE INSURANCE COMPANY112
DIRECTORS’ INTEREST WITH CONTRACTS AND RELATED PARTY TRANSACTIONSThe Directors have no direct or indirect interest in contracts with the Company other than those disclosed in Note 34 to the Financial Statements.
DIRECTORS AND THEIR SHAREHOLDINGSDirectors and their shareholdings as at December 31, 2018 are as follows:
Name of DirectorNumber of
Shares
Mr. W. Lalith A. Peiris - Chairman 13,790Mr. K.R.K.N. Jayasinghe - Vice-Chairman NilMr. K.R.W. Ranasinghe – Managing Director NilMr. R. Sooriyaarachchi 33,381Mr. K.J. Sesiri 8,384Mr. D.P. Amaradeva 7,783Mr. C.P. Jayasinghe 2,894Mr. R.G.K. Rankothge 1,038Mr. A.D.T.S. Palitha NilMr. P.P.D.S. Kularathna NilMr. J.M.V.P. Jayasooriya NilMr. K.S.S. Weerasekara NilMr. D.L. Samarawickrama Nil
DIVIDENDSThe board of directors recommended a dividend of Rs. 1.25 per share as the final dividend for the financial year 2018 to be paid as follows.
• 50% to be paid by cash• 50% to be paid by distribution of ordinary shares of
Rs. 15/- each as provided in clause 122 of the Articles of Association
INVESTMENTSThe details of investments held by the Company are disclosed in Note 6 to the Financial Statements.
PROPERTY, PLANT & EQUIPMENTThe book values of the Property, Plant & Equipment were Rs. 1,138.59 Mn as at the Balance Sheet date. Details of the Property, Plant & Equipment and movement during the year are disclosed in Note 4 to the Financial Statements.
MAJOR SHAREHOLDERSMajor shareholders of the Company as at December 31, 2018 are as follows:
Annual Report of the Directors

ANNUAL REPORT - 2018CO-OPERATIVE INSURANCE COMPANY 113
Name of the Shareholder Number of Ordinary Shares
Wennappuwa Multi-Purpose Co-operative Society Ltd. 18,798,821Post & Telecom Employees Co-operative Bank Society Ltd. 15,039,057Wayamba Co-operative Rural Bank Union Ltd. 9,742,788Gampaha District Co-operative Rural Bank Union Ltd. 9,611,325Public Service Co-operative Credit & Thrift Society Ltd. 8,421,872Matara District Co-operative Tea Producers’ Co-operative Society Ltd. 7,068,083Beliatta Multi-Purpose Co-operative Society Ltd. 6,049,500Matara District Co-operative Rural Bank Union Ltd. 4,688,431Beralapanathara Multi-Purpose Co-operative Society Ltd. 2,925,049Homagama Multi-Purpose Co-operative Society Ltd. 2,775,390Colombo District Co-operative Rural Bank Union Ltd. 2,571,065Kotapola Multi-Purpose Co-operative Society Ltd. 2,553,078Hambantota District Co-operative Rural Bank Union Ltd. 2,419,800Sri Lanka Co-operative Rural Bank Federation Ltd. 2,419,800Panduwasnuwara Multi-Purpose Co-operative Society Ltd. 2,269,530Central Province Co-operative Rural Bank Union Ltd. 2,240,577Puttalam Salt Limited 2,159,398Bingiriya Multi-Purpose Co-operative Society Ltd. 2,050,781Mirigama Multi-Purpose Co-operative Society Ltd. 1,902,670Kolonnawa Multi-Purpose Co-operative Society Ltd. 1,754,168
PROVISIONSThe Directors’ have taken reasonable steps to ensure adequate provisioning for all known liabilities and insurance related reserves i.e. Unearned premiums reserves, Claims outstanding reserve and provisions for Claims Incurred But Not Reported (IBNR) and Claims Incurred But Not Enough Reported (IBNER) in Non-Life Insurance. The Directors also have consulted an Independent Actuary in this process of valuing IBNR and IBNER reserves and his report is given on page 114.
STATED CAPITALThe Company’s issued and fully paid stated capital as of the year end was Rs. 1,430,194,585/-
STATUTORY PAYMENTSThe Directors, to the best of their knowledge, are satisfied that all statutory payments in relation to the Government, the Insurance Regulatory Commission of Sri Lanka (IRCSL) and related to employees have been made on time.
CONTINGENCIES AND EVENTS OCCURRING AFTER THE BALANCE SHEET DATE Details of contingencies and events occurring after the Balance Sheet date are disclosed in Note 35 and Note 36 respectively to the Financial Statements.
AUDITORSA resolution to be paused to appoint Jayasinghe and Company, Chartered Accountants as auditors for the financial year ending December 31, 2019 and to authorise the directors to fix their remuneration will be proposed at the Annual General Meeting.
ANNUAL GENERAL MEETINGThe Annual General Meeting of the Company will be held on July 07, 2019 “Grand Monarch Hotel, 527/7, Borella Road, Thalawathugoda at 10.00 a.m. The Notice of Meeting relating to the 21st Annual General Meeting is given on page 212.
By Order of the Board of Directors,
Business Management Services Ltd.Secretaries to the Company
May 23, 2019

ANNUAL REPORT - 2018CO-OPERATIVE INSURANCE COMPANY114
Certification of IBNR & LAT
23 May 2019
To the shareholders of Co-operative Insurance Company Limited
Co-operative Insurance Company Limited 31 December 2018 Net IBNR and LAT Certification
I hereby certify that the undiscounted Central Estimate IBNR provision, including an allowance for CHE of LKR 178,566,242 is adequate in relation to the Claim Liability of Co-operative Insurance Company Limited as at the 31 December 2018, net of reinsurance. This IBNR provision, together with the Case Reserves held by the Company, is expected to be adequate at a 50th percentile to meet the future liabilities in respect of the Company’s incurred claims obligations as at 31 December 2018, in many but not all scenarios of future experience. (The undiscounted IBNR provision, gross of reinsurance, including an allowance for CHE is LKR 202,878,384).
At the end of each reporting period, companies are required to carry out a Liability Adequacy Test (LAT) as laid out in SLFRS 4. The LAT is performed to assess the adequacy of the carrying amount of the Unearned Premium Reserve (UPR). I hereby certify that the UPR provision of LKR 1,654,770,901 set by the Company, net of reinsurance, is adequate at a 50th percentile in relation to the unexpired risks of Co-operative Insurance Company Limited as at 31 December 2018, in many but not all scenarios of future experience. As such, there is no premium deficiency to be recognised by the Company. (The UPR provision, gross of reinsurance, is LKR 1,918,425,938).
The results have been determined in accordance with internationally accepted actuarial principles.
I have relied upon information and data provided by the management of the Company and I have not independently verified the data supplied, beyond applying checks to satisfy myself as to the reasonability of the data.
Sivaraman KumarFellow of the Institute and Faculty of ActuariesFor and on behalf of NMG ConsultingDated 23 May 2019
T: +65 6325 9855 F: +65 6325 4700 E: [email protected]
www.NMG-Group.com
30 Hill Street, #03-02A, Singapore 179360

Financial Reports

ANNUAL REPORT - 2018CO-OPERATIVE INSURANCE COMPANY116
Statement of Directors’ Responsibilities
The responsibility of Directors in relation to Financial Statements of the company prepared in accordance with the Companies Act No. 07 of 2007 is set out in the following statement. These differ from the responsibilities of the External Auditors in relation to Financial Statements, which are set out in Report of the External Auditors given on pages 118 and 119.
1. The Directors are required by the Companies Act No. 07 of 2007 to prepare Financial Statements for each financial year, which gives a true and fair view of
y the state of affairs of the Company as at the Balance Sheet date; and
y the Profit or Loss of the Company for the financial year ended on the Balance Sheet date.
2. The Directors consider that these Financial Statements have been prepared using appropriate accounting policies consistently applied and material departure, if any, have been disclosed and supported by reasonable and prudent judgments and estimates and in compliance with the applicable Accounting Standards and Directions issued by the Insurance Regulatory Commission of Sri Lanka.
3. The Directors are responsible for ensuring that the Company keeps sufficient accounting records which disclose the financial position of the Company with reasonable accuracy and to enable them to ensure that the Financial Statements have been prepared and presented in accordance with the Sri Lanka Accounting Standards, provide the information required by the Companies Act No. 07 of 2007 and comply with the requirements of the Regulation of Insurance Industry Act No. 43 of 2000.
4. They are also responsible for taking measures to safeguard the assets of the Company and in that context to have proper regard to the establishment of appropriate systems of internal control with a view to prevention and detection of fraud and other irregularities.
5. The Directors are required to prepare the Financial Statements to provide the Auditors with every opportunity to take whatever steps and undertake whatever inspection they may consider appropriate to enable them to give their audit opinion.
6. The Directors continue to adopt the Going Concern basis in preparing the Financial Statements. The Directors, after making inquiries and review of the Company’s budget for 2018, including cash flows and borrowing facilities, consider that the Company has adequate resources to continue in operation.
7. The Directors, to the best of their knowledge and belief, are satisfied that all statutory payments in relation to all relevant regulatory and statutory authorities which were due and payable by the Company as at the Balance Sheet date have been paid or sufficiently provided for.
By Order of the Board,
Business Management Services Ltd.Secretaries to the Company
May 23, 2019

ANNUAL REPORT - 2018CO-OPERATIVE INSURANCE COMPANY 117
Audit Committee Report
ROLE AND OBJECTIVESAudit Committee oversees the financial reporting system with an aim of safeguarding the interest of all the stakeholders of the Co-operative Insurance Company Limited. As defined in the Terms of Reference of Audit Committee, the Committee assist the Board of Directors in carrying out its responsibilities in the areas of financial reporting system, business risk management, internal controls and internal audit, related party transactions, compliance in specially with Sri Lanka Financial Reporting Standards, Companies Act No. 07 of 2007 and Regulation of Insurance Industry Act No. 43 of 2000 and External Audit and Auditor’s independence.
COMPOSITION AND PROCEEDINGS
Composition and proceedingsMr. A. D. T. S. Palitha (Chairman)Mr. D. P. AmaradevaMr. R. G. K. RankothgeMr. J. M. V. P. Jayasuriya
Chairman of the Audit Committee is an Associate Member of the Institute of Chartered Accountants of Sri Lanka. Managing Director, Chief Operating Officer and Heads of Finance, Marketing, Human Resources, Information Technology attend the meeting on invitation. Manager Internal Audit functions as the Secretary to the Audit Committee. During the Financial Year 2018, sixteen meetings have been conducted and all the matters material have been reported to the Board. Audit Committee held two meetings with the External Auditors, Deloitte (S J M S Associates), Chartered Accountants in relation to the audit of financial statements of 2018.
FINANCIAL REPORTINGAudit Committee reviews annual and quarterly financial statements along with their disclosure requirements. Extent of disclosures is discussed and reported to the Board of Directors.
INTERNAL CONTROLS AND INTERNAL AUDITInternal control framework is regularly reviewed and Manager Internal Audit is requested to report on areas of importance. Internal Audit reports were discussed in detail with the presence of respective Heads of Departments and branch level management. Further, a mechanism is in place to follow up actions and feedback. Related Parties and transactions with related parties were also identified and discussed at the meetings.
EXTERNAL AUDITThe Audit Committee perused the independent auditor’s report and Management Letters and other communications during the course of the audit of financial statements 2018. Management Responses are followed up as well in implementing Auditor’s recommendations.
CONCLUSION AND RECOMMENDATIONThe Committee, together with the management reviewed the system of internal controls, risk management procedures and appropriateness and application of accounting policies of the Company and is satisfied with them. Further improvements are also encouraged to meet emerging challenges.
The Company’s Internal Audit has been effective and External Auditors have been independent throughout the year.
A. D. T. S. PalithaChairman - Audit Committee
Colombo 23rd May 2019

ANNUAL REPORT - 2018CO-OPERATIVE INSURANCE COMPANY118
Independent Auditor’s Report
TO THE SHAREHOLDERS OF CO-OPERATIVE INSURANCE COMPANY LIMITED
Report on the Audit of the Financial Statements
Opinion We have audited the financial statements of Co-operative Insurance Company Limited (“the Company”) and the consolidated financial statements of the Company and its subsidiaries (“Group”), which comprise the statement of financial position as at 31 December 2018, and the statement of profit or loss and other comprehensive income, statement of changes in equity and statement of cash flows for the year then ended, and notes to the financial statements, including a summary of significant accounting policies.
In our opinion, the accompanying financial statements of the Company and the Group give a true and fair view of the financial position of the Company and the Group as at 31 December 2018, and of their financial performance and its cash flows for the year then ended in accordance with Sri Lanka Accounting Standards.
Basis for Opinion We conducted our audit in accordance with Sri Lanka Auditing Standards (SLAuSs). Our responsibilities under those standards are further described in the Auditor’s Responsibilities for the Audit of the Financial Statements section of our report. We are independent of the Group in accordance with the ethical requirements of the Code of Ethics issued by CA Sri Lanka (“Code of Ethics”) that are relevant to our audit of the financial statements, and we have fulfilled our other ethical responsibilities in accordance with the Code of Ethics. We believe that the audit evidence we have obtained is sufficient and appropriate to provide a basis for our opinion.
Other Information Management is responsible for the other information. The other information comprises the information included in the Annual report, but does not include the financial statements and our auditor’s report thereon. The annual report is expected to be made available to us after the date of this auditor’s report
Our opinion on the financial statements does not cover the other information and we do not express any form of assurance conclusion thereon.
In connection with our audit of the financial statements, our responsibility is to read the other information identified above when it becomes available and, in doing so, consider whether the other information is materially inconsistent with the financial statements or our knowledge obtained in the audit, or otherwise appears to be materially misstated.
When we read the annual report, if we conclude that there is a material misstatement therein, we are required to communicate the matter to those charged with governance.
Responsibilities of Management and Those Charged with Governance for the Financial StatementsManagement is responsible for the preparation of financial statements that give a true and fair view in accordance with Sri Lanka Accounting Standards, and for such internal control as management determines is necessary to enable the preparation of financial statements that are free from material misstatement, whether due to fraud or error.
In preparing the financial statements, management is responsible for assessing the Group’s ability to continue as a going concern, disclosing, as applicable, matters related to going concern and using the going concern basis of accounting unless management either intends to liquidate the Group or to cease operations, or has no realistic alternative but to do so.
No. 11, Castle Lane,Colombo 04Sri Lanka
Tel: +94 11 2580409, 5444400Fax: +94 11 2582452www.deloitte.com
P.E.A. Jayewickreme, M. B. Ismail, Ms. S. L. Jayasuriya, G. J. David, Ms. F. M. Marikkar, Ms. M. S. J. Henry, R. H. M. Minfaz, Ms. S. Y. Kodagoda

ANNUAL REPORT - 2018CO-OPERATIVE INSURANCE COMPANY 119
Those charged with governance are responsible for overseeing the Group’s financial reporting process.
Auditor’s Responsibilities for the Audit of the Financial Statements Our objectives are to obtain reasonable assurance about whether the financial statements as a whole are free from material misstatement, whether due to fraud or error, and to issue an auditor’s report that includes our opinion. Reasonable assurance is a high level of assurance, but is not a guarantee that an audit conducted in accordance with SLAuSs will always detect a material misstatement when it exists. Misstatements can arise from fraud or error and are considered material if, individually or in the aggregate, they could reasonably be expected to influence the economic decisions of users taken on the basis of these financial statements.
As part of an audit in accordance with SLAuSs, we exercise professional judgment and maintain professional skepticism throughout the audit. We also:
y Identify and assess the risks of material misstatement of the financial statements, whether due to fraud or error, design and perform audit procedures responsive to those risks, and obtain audit evidence that is sufficient and appropriate to provide a basis for our opinion. The risk of not detecting a material misstatement resulting from fraud is higher than for one resulting from error, as fraud may involve collusion, forgery, intentional omissions, misrepresentations, or the override of internal control.
y Obtain an understanding of internal control relevant to the audit in order to design audit procedures that are appropriate in the circumstances, but not for the purpose of expressing an opinion on the effectiveness of the Company and the Group’s internal control.
y Evaluate the appropriateness of accounting policies used and the reasonableness of accounting estimates and related disclosures made by management.
y Conclude on the appropriateness of management’s use of the going concern basis of accounting and, based on the audit evidence obtained, whether a material uncertainty exists related to events or conditions that may cast significant doubt on the Group’s ability to continue as a going concern. If we conclude that a material uncertainty exists, we are required to draw attention in our auditor’s report to the related disclosures in the financial statements
or, if such disclosures are inadequate, to modify our opinion. Our conclusions are based on the audit evidence obtained up to the date of our auditor’s report. However, future events or conditions may cause the Group to cease to continue as a going concern.
y Evaluate the overall presentation, structure and content of the financial statements, including the disclosures, and whether the financial statements represent the underlying transactions and events in a manner that achieves fair presentation.
y Obtain sufficient appropriate audit evidence regarding the financial information of the entities or business activities within the Group to express an opinion on the consolidated financial statements. We are responsible for the direction, supervision and performance of the group audit. We remain solely responsible for our audit opinion.
We communicate with those charged with governance regarding, among other matters, the planned scope and timing of the audit and significant audit findings, including any significant deficiencies in internal control that we identify during our audit.
Report on Other Legal and Regulatory Requirements As required by section 163 (2) of the Companies Act No. 07 of 2007, we have obtained all the information and explanations that were required for the audit and, as far as appears from our examination, proper accounting records have been kept by the Company.
As required by Section 47(2) of the Regulation of Insurance Industry Act, No.43 of 2000, as far as appears from our examination, the accounting records of the Company have been maintained in the manner required by the rules issued by the Insurance Board of Sri Lanka, so as to clearly indicate the true and fair view of the financial position of the Company.
SJMS AssociatesChartered Accountants
Colombo23 May 2019

ANNUAL REPORT - 2018CO-OPERATIVE INSURANCE COMPANY120
Group Company As at 31 December 2018 2017 2018 2017
Note Rs. Rs. Rs. Rs.
AssetsProperty, plant and equipment 4 1,138,599,047 1,102,086,765 856,627,241 827,891,117 Intangible assets 5 5,331,334 2,141,769 2,861,955 2,136,028 Deferred tax asset 20 130,316,665 30,250,575 - 30,250,575 Financial investments 6 4,864,354,265 4,175,076,019 2,887,575,982 2,365,950,814 Investments in subsidiaries 7 - - 445,260,050 410,000,040 Loans to life policy holders 8 20,629,674 19,039,109 - -Reinsurance receivables 9 340,059,225 256,107,387 331,971,907 245,140,054 Premium receivables 10 758,588,418 602,794,567 750,717,081 594,509,280 Related party receivables 34 - - 11,535,904 7,956,942 Other assets 11 140,820,074 138,027,170 85,488,497 68,785,430 Cash at bank and in hand 12 140,830,613 138,643,622 120,708,829 114,938,092 Total assets 7,539,529,315 6,464,166,983 5,492,747,446 4,667,558,372
Equity and liabilitiesEquity attributable to equity holders of the parentStated capital 13 1,430,194,585 1,260,251,770 1,430,194,585 1,260,251,770 Revaluation reserve 382,768,644 381,932,353 322,407,068 333,597,638 Available for sale reserves (82,409,685) (78,884,689) (48,607,352) (67,029,162)Retained earnings 827,222,541 614,177,830 656,163,366 553,311,052
2,557,776,085 2,177,477,264 2,360,157,667 2,080,131,298 Non-controlling interest 16 142,828,874 111,368,634 - -Total equity 2,700,604,959 2,288,845,898 2,360,157,667 2,080,131,298
LiabilitiesRetirement benefit obligations 17 54,230,085 51,876,087 40,738,427 37,993,692 Interest bearing borrowings 14 3,051,458 11,586,461 1,763,819 8,414,249 Insurance liabilities 15 3,838,045,290 3,391,079,301 2,229,943,843 1,900,064,983 Reinsurance creditors 18 302,532,420 216,873,106 291,709,148 196,593,170 Deferred tax liability 20 51,698,297 - 51,698,297 -Other liabilities 19 494,858,519 433,937,937 422,227,958 374,392,787 Bank overdrafts 12 94,508,287 69,968,193 94,508,287 69,968,193 Total liabilities 4,838,924,356 4,175,321,084 3,132,589,779 2,587,427,074 Total equity and liabilities 7,539,529,315 6,464,166,983 5,492,747,446 4,667,558,372
These financial statements are in compliance with the requirements of the Companies Act No. 07 of 2007.
Laksiri NawaratneChief Financial Officer
The Board of Directors is responsible for the preparation and presentation of these financial statements.Signed for and on behalf of the Board on 23 May 2019.
W.L.A. Pieris K.R.W. Ranasinghe Chairman Managing Director
The notes to the financial statements from 1 to 37 form an integral part of these financial statements.
Statement of Financial Position

ANNUAL REPORT - 2018CO-OPERATIVE INSURANCE COMPANY 121
Group Company For the year ended 31 December 2018 2017 2018 2017
Note Rs. Rs. Rs. Rs.
Gross written premium 21 4,368,316,886 3,677,800,345 3,750,838,457 3,055,835,664 Less premium ceded to reinsurers 22 (604,773,448) (584,283,012) (558,940,279) (544,355,201)Net written premium 3,763,543,438 3,093,517,333 3,191,898,178 2,511,480,464 Net change in reserves for unearned premium 23 (347,458,112) (160,160,321) (347,458,112) (160,160,321)
Net earned premium 3,416,085,326 2,933,357,012 2,844,440,066 2,351,320,142
Other revenueInvestment income 24 510,646,589 428,566,994 344,570,627 258,669,236 Unrealised changes in losses of financial Instruments 25 (251,200) (199,920) - - Net realised gain in financial investment 6.4 4,326 18,346,169 - - Policy administration fees 26 161,535,448 123,073,337 161,535,448 123,073,337 Other income 27 25,730,268 21,296,657 25,154,337 22,030,734
697,665,431 591,083,237 531,260,412 403,773,307 Total net revenue 4,113,750,757 3,524,440,249 3,375,700,478 2,755,093,449
Net benefits and claimsGross benefits and claims incurred 28 2,404,324,730 1,952,311,212 2,181,895,843 1,830,737,958 Claims ceded to reinsurers (272,922,102) (314,478,998) (255,028,531) (301,891,061)Change in life contract liabilities 110,736,893 249,255,888 - -
2,242,139,521 1,887,088,102 1,926,867,312 1,528,846,897
Other expensesUnderwriting and policy acquisition cost 29 238,951,866 170,610,120 140,612,881 93,500,473 Other operating and administrative expenses 30 1,217,911,302 1,012,751,129 902,443,863 733,634,684 Profit before income tax 31 414,748,068 453,990,898 405,776,422 399,111,395 Income tax expenses 32 (3,102,128) (83,222,314) (137,622,275) (97,677,827)Profit for the year 411,645,940 370,768,584 268,154,147 301,433,568
Other comprehensive incomeItems that will not be reclassified subsequently to profit or loss ;Revaluation of land and buildings 66,023,329 76,608,536 44,101,987 61,829,307 De-recognition of revaluation reserve - 90,984 - 90,984 Actuarial gains / (loses) on defined benefit plan 5,332,800 777,116 4,584,095 (997,237)
Items that may be reclassified subsequently to profit or loss;Net change in fair value of available-for-sale financial assets (4,536,866) 86,813,932 18,805,805 23,843,539 Tax on other comprehensive income (66,514,968) (16,944,141) (55,428,491) (1,298,100)
304,295 147,346,427 12,063,396 83,468,493 Total comprehensive income for the year, net of tax 411,950,235 518,115,010 280,217,544 384,902,061
Profit attributable to:Equity holders of the company 16 378,176,880 356,981,365 268,154,147 301,433,568 Non controlling interest 33,469,060 13,787,219 - - Profit for the year 411,645,940 370,768,584 268,154,147 301,433,568
Total comprehensive attributable to :Equity holders of the company 380,620,157 491,625,707 280,217,544 384,902,061 Non controlling interest 31,330,079 26,489,303 - -
411,950,235 518,115,010 280,217,544 384,902,061
Earnings per shareBasic earnings per share 33 2.93 2.77 2.08 2.34
The notes to the financial statements from 1 to 37 form an integral part of these financial statements.
Statement of Profit or Loss and Other Comprehensive Income

ANNUAL REPORT - 2018CO-OPERATIVE INSURANCE COMPANY122
Statement of Changes in Equity - GROUP
Group
Stated capital
Rs.
Revaluation reserve
Rs.
Available for sale reserve
Rs.
Retained earnings
Rs.
Non- controlling
interestsRs.
TotalRs.
Balance as at 01 January 2017 1,115,367,950 305,431,791 (135,636,652) 398,581,474 97,100,338 1,780,844,902 Effect on partial investment in subsidiary - (Note 16) - 1,149,320 (234,422) 1,306,108 (12,221,007) (10,000,000)
1,115,367,950 306,581,111 (135,871,074) 399,887,583 84,879,332 1,770,844,901 Total comprehensive incomeProfit for the year - - - 356,981,365 13,787,219 370,768,584
Other comprehensive income for the year- Net change in revaluation of land
and buildings - 73,793,478 - - 2,938,839 76,732,318 - De-recognition of revaluation reserve - (335,898) - 303,100 - 90,984 - Net change in fair value of
available for sale financial assets - - 74,292,313 - 12,521,619 86,813,932 - Actuarial gains / (losses) on
defined benefit plan - - - 424,287 352,829 777,116 Tax on other comprehensive income 1,893,662 (17,305,928) 1,579,330 (3,111,204) (16,944,141)
- 75,351,242 56,986,385 2,306,717 12,702,083 147,346,427 Total comprehensive income for the year - 75,351,242 56,986,385 359,288,081 26,489,303 518,115,011
Issue of shares 144,883,820 - - - - 144,883,820 Ordinary dividends - 2016 - - - (144,997,834) - (144,997,834)Balance as at 31 December 2017 1,260,251,770 381,932,353 (78,884,689) 614,177,830 111,368,634 2,288,845,898
Balance as at 01 January 2018 1,260,251,770 381,932,353 (78,884,689) 614,177,830 111,368,634 2,288,845,898 Changes in holding without changing in control - (110,665) 16,907 (36,403) 130,161 - Total comprehensive incomeProfit for the year - - - 378,176,880 33,469,060 411,645,940
Other comprehensive income for the year- Net change in revaluation of land
and building - 62,035,837 - - 3,987,492 66,023,329 - De-recognition of revaluation
reserve - (1,810,833) - 1,810,833 - - - Net change in fair value of
available for sale financial assets - - (290,834) - (4,246,032) (4,536,866)- Actuarial gains/ (losses) on defined
benefit plan - - - 5,196,611 136,189 5,332,800 Tax on other comprehensive income - (59,278,047) (3,251,069) (1,969,222) (2,016,630) (66,514,968)
- 946,957 (3,541,903) 5,038,222 (2,138,979) 304,296 Total comprehensive income for the year - 946,957 (3,541,903) 383,215,102 31,330,079 411,950,236
Issue of shares 169,942,815 - - - 9,000,000 178,942,815 Ordinary dividends - 2017 - - - (170,133,989) (9,000,000) (179,133,989)Balance as at 31 December 2018 1,430,194,585 382,768,644 (82,409,685) 827,222,541 142,828,874 2,700,604,961
The notes to the financial statements from 1 to 37 form an integral part of these financial statements.

ANNUAL REPORT - 2018CO-OPERATIVE INSURANCE COMPANY 123
Statement of Changes in Equity - COMPANY
Company
Stated capital
Rs.
Revaluation reserve
Rs.
Available for sale reserve
Rs.
Retained earnings
Rs. Total
Rs.
Balance as at 01 January 2017 1,115,367,950 268,847,038 (87,476,248) 398,604,509 1,695,343,249
Total comprehensive incomeProfit for the year - - - 301,433,568 301,433,568
Other comprehensive income for the year- Net change in revaluation of land and buildings - 61,953,089 - - 61,953,089 - De-recognition of revaluation reserve - (335,898) - 303,100 (32,798)- Net change in fair value of available for sale
financial assets - - 23,843,539 - 23,843,539 - Actuarial gains / (losses) on defined benefit plan - - - (997,237) (997,237)Tax on other comprehensive income - 3,133,409 (3,396,454) (1,035,055) (1,298,100)
- 64,750,600 20,447,086 (1,729,192) 83,468,493 Total comprehensive income for the year - 64,750,600 20,447,086 299,704,376 384,902,061
Issue of shares 144,883,820 - - - 144,883,820 Ordinary dividends - 2016 - - - (144,997,834) (144,997,834)Balance as at 31 December 2017 1,260,251,770 333,597,638 (67,029,162) 553,311,052 2,080,131,297
Balance as at 01 January 2018 1,260,251,770 333,597,638 (67,029,162) 553,311,052 2,080,131,297 Total comprehensive incomeProfit for the year - - - 268,154,147 268,154,147
Other comprehensive income for the year- Net change in revaluation of land and building - 44,101,987 - - 44,101,987 - Net change in fair value of available for sale
financial assets - - 18,805,805 - 18,805,805 - Actuarial gains / (losses) on defined benefit plan - - - 4,584,095 4,584,095 - De-recognition of revaluation reserve (1,810,833) - 1,810,833 - Tax on other comprehensive income - (53,481,723) (383,995) (1,562,773) (55,428,491)
- (11,190,569) 18,421,811 4,832,156 12,063,397 Total comprehensive income for the year - (11,190,569) 18,421,811 272,986,303 280,217,544
Issue of shares 169,942,815 - - - 169,942,815 Ordinary dividends - 2017 - - - (170,133,989) (170,133,989)Balance as at 31 December 2018 1,430,194,585 322,407,068 (48,607,352) 656,163,366 2,360,157,667
The notes to the financial statements from 1 to 37 form an integral part of these financial statements.

ANNUAL REPORT - 2018CO-OPERATIVE INSURANCE COMPANY124
Statement of Cash Flows
As at 31 December
Group Company 2018 2017 2018 2017
Rs. Rs. Rs. Rs.
Profit Before taxation 414,748,068 453,990,898 405,776,422 399,111,399 Adjustments for: Interest income (512,067,951) (432,329,293) (345,556,661) (261,652,873) Interest expense 1,421,362 3,762,299 986,035 2,983,636 Depreciation on property, plant and equipment 122,536,062 99,271,691 91,647,523 77,202,128 Impairment loss on premium receivable 19,272,100 6,269,255 5,819,807 6,269,255 Impairment loss on other assets - - - 1,301,348 Impairment loss on property, plant and equipment - (218,341) - - Amortisation of intangible assets 2,227,436 2,333,661 1,401,573 2,159,070 Fair value gains or losses - (18,146,249) - - (Profit) / loss on sale of tangible assets 171,511 534,413 (171,511) 472,084 Write off of intangible assets 995,582 - 995,582 - Provision for employee benefits 12,971,876 12,385,582 9,797,036 7,881,602
62,276,046 127,853,916 170,695,805 235,727,648
Change in operating assets (273,823,158) (402,925,643) (263,321,684) (359,532,362) Change in operating liabilities 250,835,181 284,425,583 142,951,151 275,453,248 Change in general insurance reserves 329,878,860 669,906,970 329,878,861 246,180,595 Cash flows from operating activities 383,698,451 679,260,826 380,204,134 397,829,129 Gratuity paid (5,285,078) (1,433,214) (2,468,206) (3,015,537) Taxation paid (109,453,847) (23,290,713) (100,367,391) (23,290,713) Net cash from operating activities 268,959,527 654,536,899 277,368,537 371,522,879
Cash flows from investing activities Purchase of investments net of sale proceeds (693,658,787) (735,020,876) (513,405,727) (503,084,394) Investment in subsidiary - (10,000,000) - (10,000,000) Interest received 507,085,834 220,719,339 268,798,493 220,719,339 Dividend received 4,982,117 1,385,637 35,682,061 1,385,637 Interest paid (1,421,362) (2,983,636) (986,035) (2,983,636) Proceeds on sale of tangible assets 2,709,314 5,171,597 2,330,527 1,583,599 Purchase of intangible assets (6,412,580) (1,221,418) (3,123,082) (1,221,418) Purchase of tangible assets (96,062,161) (99,340,929) (78,783,699) (61,180,080) Net cash used in from investing activities (282,777,625) (621,290,286) (289,487,462) (354,780,952)
Cash flows from financing activities Repayment of finance lease (8,535,002) (8,354,109) (6,650,430) (6,227,534) Net cash used in from financing activities (8,535,002) (8,354,109) (6,650,430) (6,227,534) Decrease in cash and cash equivalents (22,353,100) 24,892,505 (18,769,355) 10,210,282 Cash and cash equivalents at the beginning of the year 68,675,427 43,782,923 44,969,898 34,759,616 Cash and cash equivalents at the end of the year 46,322,327 68,675,428 26,200,543 44,969,898
Note ACash and cash equivalents at the end of the yearCash at bank 134,585,846 135,767,458 114,990,385 112,359,428 Cash in hand 6,020,944 2,876,164 5,718,444 2,578,664 Cash in transit 223,823 - - - Bank overdrafts (94,508,287) (69,968,193) (94,508,288) (69,968,193)
46,322,327 68,675,428 26,200,542 44,969,898

ANNUAL REPORT - 2018CO-OPERATIVE INSURANCE COMPANY 125
1. REPORTING ENTITY
1.1 Corporate informationCo-operative Insurance Company Limited is a Company incorporated on 11 August 1997 with limited liability and domiciled in Sri Lanka. The registered office and the principal place of business of the Company is situated at 74/5, Grandpass Road, Colombo 14. Registered office of its subsidiary is situated at 455, Co-op House, Galle Road Colombo 03.
1.2 Consolidated financial statementsThe Consolidated Financial Statements for the year ended and as at 31st December 2018 comprise “the Company” referring to Co-operative insurance company limited as the holding company and “the Group” referring to Co-operative insurance company limited and its Subsidiaries listed in note 3.11.
The financial statements of all Companies within the Group are prepared for a common financial year, with uniform accounting policies, which ends on 31 December.
1.3 Principal activities and nature of operationsThe Group is primarily involved in the Non-life and Life insurance business. In compliance with the requirements of the Regulation of Insurance Industry (Amendment) Act No. 3 of 2011, the Company completed the segregation of the life and non-life insurance businesses on 1 January 2015.
Co-operative Insurance Company Limited, provides General Insurance solutions for both individual and corporate customers. Insurance other than ‘Life Insurance’ falls under the category of General Insurance Fire, Motor, Marine and miscellaneous insurance are the main categories under General Insurance.
Coop life Insurance Company limited provides Life Insurance solutions for both individual and corporate customers.
Co-operative Insurance Training Academy is providing Insurance Education Training mostly to the employees and also for the external parties.
There were no significant changes in the nature of the principal activities during the financial year under review.
1.4 Number of employeesThe staff strength of the Company as at 31 December 2018 is 1093 (2017 – 859) and the Group is 1354 (2017 – 1150).
1.5 Approval of financial statementsThe financial statements for the year ended 31 December 2018 were authorised for issue by the Directors on 23 May 2019.
1.6 Responsibility of Financial StatementsThe Board of Directors is responsible for these financial statements as per the provisions of the Companies Act, No. 07 of 2007, the Sri Lanka Accounting Standards and Regulation of Insurance Industry Act, No. 43 of 2000.The responsibility of the Directors in relation to these financial statements is set out in detail in the Annual Report of the Board of Directors, Directors’ Responsibility for financial position appearing in this Annual Report.
2. BASIS OF PREPARATION
2.1 Statement of complianceThe financial statements have been prepared in accordance with Sri Lanka Accounting Standards (here in after referred to as SLFRS/LKAS)as issued by the Institute of Chartered Accountants of Sri Lanka, the requirements of Companies Act No 7 of 2007 and the Regulation of Insurance Industry Act, No. 43 of 2000 with subsequent amendment.
The financial statements have the following components:
Components Page/s
Statement of financial position 120Statement of profit or loss and other comprehensive income 121Statement of changes in equity 122-123Statement of cash flows 124Notes to the financial statements 125-195
2.2 Materiality and aggregationEach material class of similar items is presented separately in the financial statements. Items of a dissimilar nature or function are presented separately unless they are immaterial.
Notes to the Financial Statements

ANNUAL REPORT - 2018CO-OPERATIVE INSURANCE COMPANY126
Notes to the Financial Statements
2.3 Going concernThe management has made an assessment of the parent company’s ability to continue as a going concern and is satisfied that the parent company has the resources to continue in business for the foreseeable future. Furthermore, management is not aware of any material uncertainties that may cast significant doubt upon the parent company’s ability to continue as a going concern. Therefore, consolidated financial statements continue to be prepared on a going concern basis.
2.4 Basis of measurementThe financial statements have been prepared on the historical cost basis except for the following material items which are measured on an alternative basis at the reporting date:
Item Measurement Basis Note No.
Land and buildings Fair value 4Motor vehicles Fair value 4Held to maturity instruments
Amortised cost 6.1
Loan and receivable investments
Amortised cost 6.2
Available for sale financial assets
Fair value 6.3
Non derivative financial instruments at fair value through profit or loss
Fair value 6.4
Policy holder liabilities Actuarial valuation 15Defined benefit liabilities Actuarially valued
and recognised at present value
17
2.6 Functional and presentation currencyThe financial statements are presented in Sri Lankan Rupees (LKR), which is the company’s functional currency and the Group’s presentation currency. Except where indicated, financial information presented in Sri Lankan Rupees has been rounded to the nearest value.
2.7 Comparative informationThe Consolidated financial statements provide comparative amended, where relevant for better presentation and to be comparable with those of the current year.
2.8 Use of estimates and judgments The preparation of financial statements in conformity with Sri Lanka Accounting Standard requires management to make judgments, estimates and assumptions that affect the application of accounting policies and the reported amounts of assets, liabilities, income and expenses. Actual results may differ from these estimates.
Estimates and underlying assumptions are reviewed on an ongoing basis. Revisions to accounting estimates are recognised in the period in which the estimates are revised and in any future periods affected.
Information about significant areas of estimation uncertainty and critical judgments in applying accounting policies that have the most significant effect on the amounts recognised in the financial statements is included in the following notes:
Critical Accounting Estimate/Judgment Disclosure Note Page
Useful lives of property and equipment 3.5.7 133Impairment of non-financial assets 3.3.8 131Classification of financial instruments 3.3 127Unearned premium 3.9.3a 135Insurance provision – Life 3.9.1 135Liability adequacy 3.9.2 135Provision for IBNR/IBNER 3.9.3b 135Employee benefits 3.12 136Deferred taxation 3.19.2 139

ANNUAL REPORT - 2018CO-OPERATIVE INSURANCE COMPANY 127
3. SIGNIFICANT ACCOUNTING POLICIESThe accounting policies set out below have been applied consistently to all periods presented in these financial statements, unless otherwise indicated. The accounting policies of the company have been consistently applied by the Group entities where applicable and deviations if any, have been disclosed accordingly.
3.1 Basis of consolidationThe consolidated financial statements comprise the Financial Statements of the Parent and its investees that are considered as subsidiaries as at 31st December 2018.
3.1.1 Subsidiaries Subsidiaries are entities controlled by the group. The group controls an entity when it is exposed to, or has rights to, variable returns from its involvement with the entity and has the ability to affect those returns through its power over the entity. The financial statements of the subsidiary is included in the consolidated financial statement from the date on which control commences until the date on which control ceases.
Critical judgments in applying the entity’s control
The directors have concluded that the Group controls all subsidiaries as it has majority control and voting rights over its subsidiaries as depicted in Note 3.1.4 below:
Interest in subsidiaries
Set out below is the Group’s principal subsidiary as at 31st December 2018.
Name of entity
Place of business/country of incorporation
Percentage of ownership
Principal activities
2018 2017
CoopLife Insurance Limited
Colombo/ Sri Lanka
82% 82% Life insurance
Co-operative Insurance Training Academy
Colombo/ Sri Lanka
100% - Insurance Training Education
Acquisition
NCI are measured at their proportionate share of acquiree’s identifiable net assets at the date of acquisition.
Transactions eliminated on consolidation
Intra-group balances and transactions, and any unrealised income and expenses arising from intra-group transactions, are eliminated.
3.2 Foreign currency transactionsTransactions in foreign currencies are translated into the respective functional currencies of Group companies at the exchange rates at the date of the transaction.
Monetary assets and liabilities denominated in foreign currencies are translated into the functional currency at the exchange rate at the reporting date. Non-monetary assets and liabilities that are measured at fair value in a foreign currency are translated into the functional currency at the exchange rate when the fair value was determined.
Foreign currency differences arising on retranslation are recognised in Profit or Loss, except for the difference arise on the retranslation of Available For Sale equity instruments, which are recognised in other comprehensive income.
3.3 Financial instrumentsThe Group classifies non-derivative financial assets into the following categories:
y Financial assets at fair value through profit or loss
y Held-to-maturity financial assets
y Loans and receivables
y Available-for-sale financial assets.
Judgments are made in the classification of financial instruments based on the management’s intentions on acquisition.
The company classifies non-derivative financial liabilities into the other financial liabilities category.

ANNUAL REPORT - 2018CO-OPERATIVE INSURANCE COMPANY128
Notes to the Financial Statements
3.3.1 Non-derivative financial assets and financial liabilities – Recognition and de-recognitionThe Group initially recognises loans and receivables and debt securities issued on the date when they are originated. All other financial assets (including assets designated at fair value through profit or loss) are initially recognised on the trade date at which the Group becomes a party to the contractual provisions of the instrument.
A financial asset is measured initially at fair value plus, for an asset not at fair value through profit or loss, transaction costs that are directly attributable to its acquisition or issue.
The Group de-recognises a financial asset when the contractual rights to the cash flows from the asset expire, or it transfers the rights to receive the contractual cash flows in a transaction in which substantially all of the risks and rewards of ownership of the financial asset are transferred, or it neither transfers nor retains substantially all of the risks and rewards of ownership and does not retain control over the transferred asset. Any interest in such de-recognised financial assets that is created or retained by the Company is recognised as a separate asset or liability.
The Group derecognises a financial liability when its contractual obligations are discharged or cancelled or expire.
Financial assets and financial liabilities are offset and the net amount presented in the statement of financial position when, and only when, the company has a legal right to offset the amounts and intends either to settle them on a net basis or to realise the asset and settle the liability simultaneously.
3.3.2 Non-derivative financial assets – Subsequent Measurement
(a) Available-for-sale financial assets (AFS)
Available-for-sale financial investments are those, which are neither classified as held for trading nor designated at fair value through profit or loss.
After initial measurement at fair value, available-for-sale financial investments are subsequently measured at fair value and changes therein are recognised in other comprehensive income and accumulated in the available-for-sale reserve. When these assets are derecognised, the gain or loss accumulated in equity is reclassified to profit or loss.
The Group evaluates its available-for-sale financial assets to determine whether the ability and intention to sell them in the near term would still be appropriate. In the case where the Group is unable to trade these financial assets due to inactive markets and management’s intention significantly changes to do so in the foreseeable future, the Group may elect to reclassify these financial assets in rare circumstances. Reclassification to loans and receivables is permitted when the financial asset meets the definition of loans and receivables and management has the intention and ability to hold these assets for the foreseeable future or until maturity. The reclassification to held-to-maturity is permitted only when the entity has the ability and intention to hold the financial asset until maturity.
Available for sale financial investments of the Group comprise equity and debt securities, which are neither classified as held for trading nor designated at fair value through profit or loss.
(b) Financial assets at fair value through profit or loss (FVTPL)
A financial asset is classified as at fair value through profit or loss if it is classified as held-for-trading or is designated as such on initial recognition. Directly attributable transaction costs are recognised in profit or loss as incurred. Financial assets at fair value through profit or loss are measured at fair value and changes therein, including any interest or dividend income, are recognised in profit or loss.
The assets and liabilities are part of a Group’s financial assets, financial liabilities, or both, which are managed and their performance evaluated on a fair value basis, in accordance with the Group’s investment strategy. Financial assets at fair value through profit or loss of the Group comprise listed equity investments.
(c) Held to maturity financial assets (HTM)
These are non-derivative financial assets with fixed or determinable payments and fixed maturities are classified as held to maturity when the Group has both the intention and ability to hold until maturity. These assets are initially recognised at fair value plus any directly attributable transaction costs. Subsequent to initial recognition, they are measured at amortised cost using the effective interest method.
Held to maturity financial assets comprise treasury bills and treasury bonds investments made by the Group.

ANNUAL REPORT - 2018CO-OPERATIVE INSURANCE COMPANY 129
(d) Loans and receivables
Loans and receivables are financial assets with fixed or determinable payments that are not quoted in an active market. These assets are recognised initially at fair value plus any directly attributable transaction costs. Subsequent to initial recognition, loans and receivables are measured at amortised cost using the effective interest method.
Loans and receivables comprise investments in unquoted corporate debt, term deposits, asset backed securities, development bonds, commercial papers, other loans and receivables, cash and cash equivalents.
y Reinsurance ReceivableGroup cedes insurance risk in the normal course of business to recognised reinsurers through formal reinsurance arrangements.
Reinsurance assets include the balances due from reinsurance companies for paid and unpaid losses and loss adjustment expenses. Amounts recoverable from reinsurers are estimated in a manner consistent with the outstanding claims provision or settled claims associated with the reinsurer’s policies and are in accordance with the related reinsurance contract.
Reinsurance is recorded gross in the statement of financial position unless a right to offset exists.
Reinsurance assets are reviewed for impairment at each reporting date, or more frequently, when an indication of impairment arises during the reporting year. Impairment occurs when there is objective evidence as a result of an event that occurred after initial recognition of the reinsurance asset that the Group may not receive all outstanding amounts due under the terms of the contract and the event has a reliably measurable impact on the amounts that the Group will receive from the reinsurer. The impairment loss, if any is recorded in profit and loss.
Ceded reinsurance arrangements do not relieve the Group from its obligations to policyholders.
Reinsurance assets or liabilities are derecognised when the contractual rights are extinguished or expire or when the contract is transferred to another party.
Insurance receivables are recognised when due and measured on initial recognition at the fair value of the consideration receivable. Collectability of premiums is reviewed on an ongoing basis.
According to the Premium Payment Warranty (PPW) directive issued by the Insurance Board of Sri Lanka (IBSL), Non-Life insurance policies are issued subject to PPW and are cancelled upon the expiry of 90 days if not settled.
The Company decided to account for life insurance premiums on accrual basis in accordance with Sri Lanka Accounting Standards. Accordingly, due Life Insurance premiums (only the premiums due in the 30 day grace period) are recognised at each reporting date and will be reversed if the premiums are not settled during the subsequent month, and thus the policies will be lapsed as per the company policy.
y Other Receivables and Dues from Related PartiesOther receivables and dues from related parties are recognised at cost less allowances for bad and doubtful receivables.
y Cash and cash equivalentsCash and cash equivalents comprise reverse repurchase agreements, cash balances and call deposits with maturities of three months or less from the acquisition date that are subject to an insignificant risk of changes in their fair value, and are used by the Group in the management of its short-term commitments.
3.3.3 Non-derivative financial liabilities - MeasurementNon-derivative financial liabilities are initially recognised at fair value less any directly attributable transaction costs. Subsequent to initial recognition, these liabilities are measured at amortised cost using the effective interest rate method.

ANNUAL REPORT - 2018CO-OPERATIVE INSURANCE COMPANY130
Notes to the Financial Statements
3.3.4 Fair value measurement SLFRS 13 defines fair value as the price that would be received to sell and asset or paid to transfer a liability in an orderly transactions between market participants at the measurement date.
A Fair value measurement requires an entity to determine all the following:
1. The particular asset or liability that is the subject of the measurement.
2. For a non-financial asset, the valuation premise that is appropriate for the measurement (consistently with its highest and best use).
3. The principal (or most advantageous) market for the asset or liability.
4. The valuation technique(s) appropriate for the measurement, considering the availability of data with which to develop inputs that represent the assumptions that market participants would use when pricing the asset or liability and the level of the fair value hierarchy within which the inputs are categorised.
Fair value is a market-based measurement, not an entity-specific measurement. For some assets and liabilities, observable market transactions or market information might be available. For other assets and liabilities, observable market transactions and market information might not be available. However, the objective of a fair value measurement in both cases is the same to estimate the price at which an orderly transaction to sell the asset or to transfer the liability would take place between market participants at the measurement date under current market conditions (i.e. an exit price at the measurement date from the perspective of a market participant that holds the asset or owes the liability).
When a price for an identical asset or liability is not observable, an entity measures fair value using another valuation technique that maximises the use of relevant observable inputs and minimises the use of unobservable inputs. Because fair value is a market-based measurement, it is measured using the assumptions that market participants would use when pricing the asset or liability, including assumptions about risk. As a result, an entity’s intention to hold an asset or to settle or otherwise fulfill a liability is not relevant when measuring fair value.
When an asset is acquired or a liability is assumed in an exchange transaction for that asset or liability, the transaction price is the price paid to acquire the asset or received to assume the liability (an entry price). In contrast, the fair value of the asset or liability is the price that would be received to sell the asset or paid to transfer the liability (an exit price).
When transaction price provides the best evidence of fair value at initial recognition, the financial instrument is initially measured at the transaction price and any difference between this price and the value initially obtained from a valuation model is subsequently recognised in profit or loss on an appropriate basis over the life of the instrument but not later than when the valuation is supported wholly by observable market data or the transaction is closed out.
3.3.5 Determination of fair valuesThe determination of fair value for financial assets and liabilities for which there is no observable market price requires the use of valuation techniques. For financial instruments that trade infrequently and have little price transparency, fair value is less objective, and requires varying degrees of judgment depending on liquidity, concentration, uncertainty of market factors, pricing assumption and other risks affecting the specific instrument.
Level 1 – Fair value measurements using quoted prices (unadjusted) in active markets for identical assets or liabilities;
Level 2 – Fair value measurements using inputs other than quoted prices included within Level 1 that are observable for the asset or liability, either directly (i.e. as prices) or indirectly (i.e. derived from prices); and
Level 3 – Fair value measurements using inputs for the asset or liability that are not based on observable market data (i.e. unobservable inputs).
ANNUAL REPORT - 2018CO-OPERATIVE INSURANCE COMPANY 131
3.3.6 Amortised cost measurementThe amortised cost of a financial asset or liability is the amount at which the financial asset or liability is measured at initial recognition, minus principal repayments, plus or minus the cumulative amortisation using the effective interest rate method of any difference between the initial amount recognised and the maturity amount, minus any reduction for impairment.
3.3.7 ReclassificationReclassifications of financial assets, other than as set out below, or of financial liabilities between measurements categories are not permitted following initial recognition.
Held for trading non-derivative financial assets are transferred out of the held at fair value through profit or loss category in the following circumstances: to the available-for-sale category, where, in rare circumstances, they are no longer held for the purpose of selling or repurchasing in the near term; or to the loan and receivables category, where they are no longer held for the purpose of selling or repurchasing in the near term and they would have met the definition of a loan and receivable at the date of reclassification and the company has the intent and ability to hold the assets for the foreseeable future or until maturity.
Financial assets are transferred out of the available for-sale category to the loan and receivables category where they would have met the definition of a loan and receivable at the date of reclassification and the company has the intent and ability to hold the assets for the foreseeable future or until maturity.
Held-to-maturity assets are reclassified to the available-for sale category if the portfolio becomes tainted following the sale of other than an insignificant amount of held-to-maturity assets prior to their maturity.
Financial assets are reclassified at their fair value on the date of reclassification. For financial assets reclassified out of the available-for-sale category into loans and receivables, any gain or loss on those assets recognised in shareholder’s equity prior to the date of reclassification is amortised to the profit or loss over the remaining life of the financial asset, using the effective interest method.
3.3.8 Impairment
(a) Non-derivative financial assets
Financial assets not classified at fair value through profit or loss, are assessed at each reporting date to determine whether there is objective evidence of impairment.
Objective evidence that financial assets are impaired includes default or delinquency by a debtor, restructuring of an amount due to the company on terms that the company would not consider otherwise, indications that a debtor or issuer will enter bankruptcy, adverse changes in the payment status of borrowers or issuers, the disappearance of an active market for a security; or observable data indicating that there is a measurable decrease in the expected cash flows from a group of financial assets.
In addition, for an investment in an equity security, a significant or prolonged decline in its fair value below its cost is objective evidence of impairment.
y Financial assets measured at amortised cost The company considers evidence of impairment
for these assets at both an individual asset and a collective level. All individually significant assets are individually assessed for impairment.
y Available-for-sale financial assets Impairment losses on available-for-sale financial
assets are recognised by reclassifying the losses accumulated in the fair value reserve to profit or loss. The amount reclassified is the difference between the acquisition cost (net of any principal repayment and amortisation) and the current fair value, less any impairment loss previously recognised in profit or loss. If the fair value of an impaired available-for-sale debt security subsequently increases and the increase can be related objectively to an event occurring after the impairment loss was recognised, then the impairment loss is reversed through statement of profit or loss; otherwise, it is reversed through OCI.

ANNUAL REPORT - 2018CO-OPERATIVE INSURANCE COMPANY132
Notes to the Financial Statements
(b) Non-financial assets
At each reporting date, the company reviews the carrying amounts of its non-financial assets (other than deferred tax assets) to determine whether there is any indication of impairment. If any such indication exists, then the asset’s recoverable amount is estimated.
The recoverable amount of an asset or CGU is the greater of its value in use and its fair value less costs to sell. Value in use is based on the estimated future cash flows, discounted to their present value using a pre-tax discount rate that reflects current market assessments of the time value of money and the risks specific to the asset or CGU.
An impairment loss is recognised if the carrying amount of an asset or CGU exceeds its recoverable amount. Impairment losses are recognised in profit or loss.
An impairment loss in respect of goodwill is not reversed. For other assets, an impairment loss is reversed only to the extent that the asset’s carrying amount does not exceed the carrying amount that would have been determined, net of depreciation or amortisation, if no impairment loss had been recognised.
3.4 Insurance contracts As permitted by SLFRS 4 Insurance Contracts, the company continues to apply the existing accounting policies for Insurance Contracts that were applied prior to the adoption of SLFRS.
3.4.1 Product classificationSLFRS 4 requires contracts written by insurers to be classified as either “insurance contracts” or “investment contracts” depending on the level of insurance risk transferred.
Insurance contracts are those contracts when the company (the insurer) has accepted significant insurance risk from another party (the policyholders) by agreeing to compensate the policyholders if a specified uncertain future event (the insured event) adversely affects the policyholders. As a general guideline, the Company determines whether it has significant insurance risk, by comparing benefits paid with benefits payable if the insured event did not occur. Insurance contracts can also transfer financial risk.
Investment contracts are those contracts that transfer significant financial risk and no significant insurance risk. Financial risk is the risk of a possible future change in one or more of a specified interest rate, financial instrument price, commodity price, foreign exchange rate, index of price or rates, credit rating or credit index or other variable, provided in the case of a non-financial variable that the variable is not specific to a party to the contract.
Once a contract has been classified as an insurance contract, it remains an insurance contract for the remainder of its lifetime, even if the insurance risk reduces significantly during this period, unless all rights and obligations are extinguished or expire. Investment contracts can, however, be reclassified as insurance contracts after inception if insurance risk becomes significant.
All the products sold by the company are insurance contracts and therefore classified as Insurance contracts under the SLFRS 4 – Insurance Contracts. Thus, the Company does not have any investment contracts within its product portfolio as at the reporting date.
3.5 Property plant and equipment
3.5.1 Recognition and measurementAn item of Property, Plant and Equipment that qualifies for recognition as an asset is initially measured at its cost.
Cost includes expenditure that is directly attributable to the acquisition of the asset. The cost of self-constructed assets includes the cost of materials and direct labour, any other costs directly attributable to bringing the assets to a working condition for their intended use. Purchased software that is integral to the functionality of the related equipment is capitalised as part of that asset.
When parts of an item of property or equipment have different useful lives, they are accounted for as separate items (major components) of property plant and equipment.
The gain or loss on disposal of an item of property and equipment is determined by comparing the proceeds from disposal with the carrying amount of the item of property and equipment, and is recognised in other income/other expenses in profit or loss.

ANNUAL REPORT - 2018CO-OPERATIVE INSURANCE COMPANY 133
3.5.2 Cost modelThe Group applies cost model to property, plant and equipment except for freehold land, buildings and motor vehicles and records at cost of purchase or construction together with any incidental expenses thereon less accumulated depreciation and any accumulated impairment losses.
3.5.3 Revaluation modelThe Group applies the revaluation model to the entire class of freehold land, buildings and motor vehicle. Such properties are carried at a revalued amount, being their fair value at the date of revaluation less any subsequent accumulated depreciation and subsequent accumulated impairment losses. Freehold land and buildings are revalued annually on a roll over basis to ensure that the carrying amounts do not differ materially from the fair values at the reporting date. On revaluation of an asset, any increase in the carrying amount is recognised in Other Comprehensive Income and accumulated in equity, under capital reserve or used to reverse a previous revaluation decrease relating to the same asset, which was charged to profit or loss. In this circumstance, the increase is recognised as income to the extent of the previous write down. Any decrease in the carrying amount is recognised as an expense in profit or loss or debited in the Other Comprehensive Income to the extent of any credit balance existing in the capital reserve in respect of that asset. The decrease recognised in Other Comprehensive Income reduces the amount accumulated in equity under capital reserves. Any balance remaining in the revaluation reserve in respect of an asset is transferred directly to Retained Earnings on retirement or disposal of the asset.
3.5.4 Subsequent costsThe cost of replacing a component of an item of property or equipment is recognised in the carrying amount of the item if it is probable that the future economic benefits embodied within the part will flow to the company and its cost can be measured reliably. The carrying amount of the replaced part is derecognised. The costs of the day-to-day servicing of property and equipment are recognised in profit or loss as incurred.
3.5.5 DepreciationDepreciation is recognised in profit or loss on a straight-line basis over the estimated useful lives of each part of an item of property, plant and equipment. Land is not depreciated. The assets are depreciated from the month it is available for use and cease to depreciate from the month of disposal.
The estimated useful lives for the current and comparative years are as follows:
2018 2017
Buildings 60 years-40Years
60 years-40Years
Building improvements 10 years 10 yearsOffice equipment 8 years 8 yearsComputers 6 years 6 yearsMotor vehicles 5 years 5 yearsFurniture and fittings 8 years 8 yearsMotor vehicles – Lease hold 4 years 4 years
The assets’ residual values, useful lives and methods of depreciation are reviewed, and adjusted if appropriate, at each financial year end.
3.5.6 De-recognitionThe carrying amount of an item of Property, Plant and Equipment is de-recognised on disposal or when no future economic benefits are expected from it. The gain or loss arising from de-recognition of an item of Property, Plant and Equipment is included in profit or loss when the item is de-recognised.
3.5.7 Useful lives of property and equipmentAs described in accounting policies the Group reviews the estimated useful lives over which its property and equipment’s are depreciated. The Group’s management is satisfied that the estimates of useful lives are appropriate.

ANNUAL REPORT - 2018CO-OPERATIVE INSURANCE COMPANY134
Notes to the Financial Statements
3.5.8 Gains and losses on disposalGains and losses on disposal of an item of property, plant and equipment are determined by comparing the proceeds from disposal with the carrying amount of property, plant and equipment, and are recognised net within “other income/other expenses” in the Statement of profit or loss and other comprehensive income.
3.5.9 Capital work-in-progress Capital work in progress are carried at cost, in respect of the incomplete projects. Once the project is over and ready for use, it will be transferred to property, plant and equipment and depreciated over the useful life time of the asset.
3.5.10 Leased assets – LesseeLeases in terms of which the Group assumes substantially all the risks and rewards of ownership are classified as finance leases. Upon initial recognition the leased asset is measured at an amount equal to the lower of its fair value and the present value of the minimum lease payments. Subsequent to initial recognition, the asset is accounted for in accordance with the accounting policy applicable to that asset.
For operating leases, the leased assets are not recognised on the Group’s Statement of Financial Position.
3.5.11 Operating leasesLeases that do not transfer to the company substantially all the risks and benefits incidental to ownership of the leased items are operating leases. Operating lease payments are recognised as an expense in profit or loss on a straight line basis over the lease term.
3.6 Intangible assets – Software
3.6.1 Basis of recognition An intangible asset is recognised if it is probable that future economic benefits that are attributable to the asset will flow to the entity and the cost of the asset can be measured reliably.
All computer software cost incurred, licensed to be used by the Company, which are not integrally related to associated hardware, which can be clearly identified, reliably measured and it’s probable that they will lead to future economic benefits, are included in the balance sheet under the category intangible assets and carried at cost less accumulated amortisation and any accumulated impairment losses.
3.6.2 Subsequent expenditureSubsequent expenditure on software assets is capitalised only when it increases the future economic benefits embodied in the specific asset to which it relates. All other expenditure is expensed as incurred.
3.6.3 AmortisationAmortisation is recognised in profit or loss on a straight-line basis over the estimated useful life of the software, from the date that it is available for use since this most closely reflects the expected pattern of consumption of the future economic benefits embodied in the asset. The estimated useful life of software is three years.
Amortisation methods, useful lives and residual values are reviewed at each financial year-end and adjusted if appropriate.
3.6.4 De-recognitionAn Intangible Asset is de-recognised on disposal or when no future economic benefits are expected from it. The gain or loss arising from the de-recognition of such intangible assets is included in profit or loss when the item is derecognised.
Impairment of non-financial assets
An impairment exists when the carrying value of an asset or cash generating unit exceeds its recoverable amount, which is the higher of its fair value less costs to sell and its value in use. The fair value less costs to sell calculation is based on available data from binding sales transactions in an arm’s length transaction of similar assets or observable market prices less incremental costs for disposing of the asset. The value in use calculation is based on a discounted cash flow model. The cash flows are derived from the budget for the next five years and do not include restructuring activities that the Group is not yet committed to or significant future investments that will enhance the asset’s performance of the cash generating unit being tested. The recoverable amount is most sensitive to the discount rate used for the discounted cash flow model as well as the expected future cash-inflows and the growth rate used for extrapolation purposes.
3.7 Inventories Inventories are measured at the lower of cost and net realisable value. The cost of inventories is based on the weighted average cost principle. Value of inventories includes expenditure incurred in acquiring, conversion costs and other costs incurred in bringing them to their existing location and condition.

ANNUAL REPORT - 2018CO-OPERATIVE INSURANCE COMPANY 135
Salvage inventory is recognised based on the salvage value on the claim reporting date supported by realisable values from independent sources or value subsequently sold.
3.8 Stated capital
3.8.1 Ordinary share capitalOrdinary shares are classified as equity. Incremental costs directly attributable to the issue of ordinary shares and share options are recognised as a deduction from equity, net of any tax effects.
3.8.2 Dividends on ordinary sharesDividends on ordinary shares are recognised as a liability and deducted from equity when they are approvedby the Company’s Board of Directorsin accordance with the Articles of Association. Dividends for the year that are approved after the reporting date are dealt with as an event after the reporting date.
3.9 Insurance contract and liabilities
3.9.1 Insurance provision – Life insuranceLife insurance liabilities are recognised when contracts are entered into and premiums are charged. These liabilities are measured by using the gross premium method as specified by the Insurance Regulatory Commission of Sri Lanka (IRCSL) based on the recommendation of the Independent Actuary. The liability is determined as the sum of the discounted value of the expected future benefits, less the discounted value of the expected future premiums that would be required to meet the future cash outflows based on the valuation assumptions used. The liability is computed based on IRCSL specified guidelines and current assumptions which vary based on the contract type. Furthermore, adjustments are performed to capture the likely liabilities that may arise due to currently lapsed contracts reviving in the future
3.9.2 Liability adequacy test (LAT) – Long term InsuranceAs required by SLFRS 4 –Insurance Contracts, the company performed a Liability Adequacy Test (LAT) in respect of Life Insurance contract liabilities with the assistance of an External Actuary. In performing the LAT, current best estimates of future contractual cash flows, including related cash flows such as claims handling and policy administration expenses, policyholder options and guarantees, as well as investment income from assets backing such liabilities, are used.
3.9.3 Insurance provision – Non life insuranceNon-life insurance contract liabilities are recognised when contracts are entered into and premiums are charged. These liabilities, known as the Policy Liability provisions include the Premium and Claim Liabilities. The Premium Liabilities relate to policies for which the premium has been received but the exposure has not fully expired, while the Claim Liabilities relate to that have been incurred but not yet reported (IBNR) / incurred but not enough reported (IBNER).
(a) Unearned Premium
The provision for Unearned Premiums represents premiums received or receivable for risks that have not yet expired at the reporting date. Generally the reserve is released over the term of the contract and is recognised as premium income. The provision is recognised when contracts are entered and is brought to account as premium income over the term of the contract in accordance with the pattern of insurance service provided underthe contract. Provision for unearned premium is calculated on a 1/24 basis except for marine / cargo class which is subject to 60 / 40 basis.
At each reporting date the Group reviews its unexpired risk and a liability adequacy test is performed to determine whether there is any overall excess of expected claims and deferred acquisition costs over unearned premiums. If these calculations show that the carrying amount of the unearned premiums (less related deferred acquisition costs) is inadequate, the deficiency is recognised in the Statement of profit or loss and other comprehensive income by setting up a provision for premium deficiency.
(b) Claims payable including IBNR
The Claim Liabilities are based on the estimated ultimate cost of all claims incurred but not settled at the reporting date, whether reported or not, with a reduction for the expected value of salvage and other recoveries.
Delays can be experienced in the notification and settlement of claims, therefore the ultimate cost of these cannot be known with certainty at the reporting date. The liability is calculated at the reporting date using a range of standard actuarial claim projection techniques, based on empirical data and current assumptions that may include a margin for adverse deviation. No provision for equalisation or catastrophe reserves is recognised. The liabilities are derecognised when the contract expires, is discharged or is cancelled.
IBNR reserve is decided by an independent external Actuary.
ANNUAL REPORT - 2018CO-OPERATIVE INSURANCE COMPANY136
Notes to the Financial Statements
3.9.4 Liability adequacy test (LAT) – Non life insuranceAt each reporting date the Group reviews its unexpired risk and a liability adequacy test is performed as laid out under SLFRS 4 to determine whether there is any overall excess of expected claims and deferred acquisition costs over unearned premiums. This calculation uses current estimates of future contractual cash flows after taking account of the investment return expected to arise on assets relating to relevant non-life insurance technical provisions. If these estimates show that the carrying amount of the unearned premiums (less related deferred acquisition costs) is inadequate, the deficiency is recognised in the Statement of profit or loss and other comprehensive income by setting up a provision for liability adequacy.
3.9.5 Insurance contract liabilities – Non-life insurance Non - Life Insurance contracts, estimates have to be made both for the expected ultimate cost of claims reported at the reporting date and for the expected ultimate cost of claims incurred, but not yet reported, at the reporting date (IBNR). It can take a significant period of time before the ultimate claims cost can be established with certainty. The main assumption underlying estimating the amounts of outstanding claims is the past claims development experience.
3.10 Reinsurance assetsThe Company cedes insurance risk in the normal course of business to recognised reinsurers through formal reinsurance arrangements. These assets consist of short-term balances due from reinsurers, as well as longer term receivables that are dependent on the expected claims and benefits arising under the related reinsured insurance contracts
Reinsurance assets represents balances due from reinsurance companies for paid and unpaid losses and loss adjustment expenses. Amounts recoverable from reinsurers are estimated in a manner consistent with the outstanding claims provision or settled claims associated with the reinsurer’s policies and are in accordance with the related reinsurance contract.
Reinsurance is recorded gross in the statement of financial position unless a right to offset exists.
Reinsurance assets are reviewed for impairment at each reporting date, or more frequently, when an indication of impairment arises during the reporting year. Impairment occurs when there is objective evidence as a result of an event that occurred after initial recognition of the reinsurance asset that the Company may not receive all outstanding amounts due under the terms of the contract and the event has a reliably measurable impact on the amounts that the Company will receive from the reinsurer. The impairment loss, if any is recorded in profit or loss.
3.11 Reinsurance liabilitiesReinsurance liabilities represent balances due to reinsurance companies. Amounts payable are estimated in a manner consistent with the related reinsurance contract.
Ceded reinsurance arrangements do not relieve the company from its obligations to policyholders.
Reinsurance assets or liabilities are de-recognised when the contractual rights are extinguished or expire or when the contract is transferred to another party.
3.12 Employee benefits
3.12.1 Short-term benefitsShort-term employee benefit obligations are measured on an undiscounted basis and are expensed as the related service is provided. A liability is recognised for the amount expected to be paid under short-term cash bonus or profit-sharing plans if the Company has a present legal or constructive obligation to pay this amount as a result of past service provided by the employee and the obligation can be estimated reliably.
3.12.2 Defined contribution plansA defined contribution plan is a post-employment benefit plan under which an entity pays fixed contributions into a separate entity and will have no legal or constructive obligation to pay further amounts. Obligations for contributions to defined contribution plans are recognised as an expense in profit and loss when incurred.

ANNUAL REPORT - 2018CO-OPERATIVE INSURANCE COMPANY 137
(a) Employee Provident Fund
All employees of the company are member of the Employees’ Provident Fund (EPF). The Company and employees contribute 12% and 8% respectively of the salary to EPF.
(b) Employees Trust Fund
All employees of the company are members of the Employees’ Trust Fund (ETF). The company contributes 3% of the salary of each employee to ETF.
3.12.3 Defined benefit plansA defined benefit plan is a post-employment benefit plan other than a defined contribution plan. The defined benefit is calculated by an independent actuary using Projected Unit Credit method as recommended by LKAS 19 “Employee Benefits” The present value of the defined benefit obligation is determined by discounting the estimated future cash outflows using the yield on government bonds at the reporting date and have maturity dates approximating to the terms of the Company’s obligations.
The Group recognises actuarial gains and losses that arise in calculating the Company’s obligation in respect of a plan in other comprehensive income.
The present value of the defined benefit obligation depends on a number of factors that are determined on an actuarial basis using a number of assumptions. Key assumptions used in determining the defined retirement benefit obligations are given in Note 17. Any changes in these assumptions will impact the carrying amount of defined benefit obligations.
3.12.4 Defined benefit planProvision has been made for retirement gratuities from the first year of service for all employees, in conformity with LKAS 19 “Employee Benefits”. However, under the Payment of Gratuity Act No.12 of 1983, the liability to an employee arises only on completion of 5 years of continued service.
The obligation is not externally funded.
3.13 Provisions (Other than insurance provision)A provision is recognised if, as a result of a past event, the Group has a present legal or constructive obligation that can be estimated reliably, and it is probable that an outflow of economic benefits will be required to settle the obligation.
3.14 Capital commitments and contingenciesAll discernible risks are accounted for in determining the amount of all known liabilities. The Company’s share of any contingencies and capital commitments and of its Subsidiary for which the Company is also liable severally or otherwise are also included with appropriate disclosures.
3.15 Revenue recognition –non life insurance
3.15.1 Gross premiums Gross written premiums comprise the total premiums received/ receivable for the whole period of cover provided by contracts entered into during the accounting period. GWP is generally written upon inception of the policy. Rebates that form part of the premium rate, such as no-claim rebates, are deducted from the gross written premium.
3.15.2 Unearned Premium Reserve (UPR)Unearned premiums are those proportions of premiums written in a year that relate to periods of risk after the reporting date. UPR represents the portion of the premium written in the year but relating to the unexpired term of coverage. Unearned premiums are calculated on the 1/24 basis except for the marine and title policies which are computed on a 60-40 basis. The proportion attributable to subsequent period is deferred as a provision for unearned premiums.
3.15.3 Reinsurance premiums Gross reinsurance premiums on insurance contracts are recognised as an expense on the earlier of the date when premiums are payable or when the policy becomes effective. Reinsurance premiums are decided based on rates agreed with reinsurers.
3.15.4 Unearned reinsurance premiumsUnearned reinsurance premiums are those proportions of premiums written in a year that relate to periods of risk after the reporting date. Unearned reinsurance premiums are calculated on the 1/24 basis except for the marine policies which are computed on a 60-40 basis.
3.15.5 Unexpired riskProvision is made where appropriate for the estimated amount required over and above unearned premiums to meet future caims and related expenses on the business in force as at the reporting date.

ANNUAL REPORT - 2018CO-OPERATIVE INSURANCE COMPANY138
Notes to the Financial Statements
3.15.6 Acquisition costsAcquisition costs comprise commissions and other variable costs directly connected with acquisition or renewal of insurance contracts, are deferred to the extent that these costs are recoverable out of future premiums. All other acquisition costs are recognised as an expense when incurred.
3.15.7 Reinsurance commission incomeReinsurance commission income on outwards reinsurance contracts are recognised as revenue when receivable. Subsequent to initial recognition, reinsurance commission income on outwards reinsurance contracts are deferred and amortised on a straight line basis over the term of the expected premiums payable.
3.15.8 Gross benefits and claims Gross benefits and claims for non-life insurance include all claims occurring during the year, whether reported or not, related internal and external claims handling costs that are directly related to the processing and settlement of claims, a reduction for the value of salvage and other recoveries, and any adjustments to claims outstanding from previous years.
Claims expenses and liabilities for outstanding claims are recognised in respect of direct and inward reinsurance business. The liability covers claims reported but not yet paid, Incurred But Not Reported claims (IBNR), Incurred But Not Enough Reserved(IBNER) and the anticipated direct and indirect costs of settling those claims. Claims outstanding are assessed by review of individual claim files and estimating changes in the ultimate cost of settling claims. The provision in respect of IBNR, IBNER is actuarially valued on an annual basis to ensure a more realistic estimation of the future liability based on past experience and trends.
While the Directors consider that the provision for claims is fairly stated on the basis of information currently available, the ultimate liability will vary as a result of subsequent information and events. This may result in adjustment to the amounts provided. Such amounts are reflected in the financial statements for that period. The methods used and the estimates made are reviewed regularly.
Recoveries from salvage sales and the movement in salvage inventory are netted off against claims expense.
3.15.9 Reinsurance claims recoveriesReinsurance claims are recognised when the related gross insurance claim is recognised according to the terms of the relevant contract. This includes reinsurance exposure of IBNR also.
3.16 Revenue recognition -Life insurance
3.16.1 Gross premiums Gross written premiums on life insurance contracts are recognised as revenue when payable by the policyholders (policies within one month grace period are considered as due premium, subject to a provision for premium default).
For single premium business, revenue is recognised on the date on which the policy is effective.
3.16.2 Reinsurance premiums Gross reinsurance premiums on insurance contracts are recognised as an expense on the earlier of the date when premiums are payable or when the policy becomes effective. Reinsurance premiums are decided based on rates agreed with reinsurers.
3.16.3 Acquisition costsAll acquisition cost are recognised as an expense when incurred.
3.16.4 Reinsurance commission incomeGross reinsurance premiums on insurance contracts are recognised as an income on the earlier of the date when premiums are payable or when the policy becomes effective. Reinsurance premiums are decided based on rates agreed with reinsurers.
3.16.5 Gross benefits and claims expenseClaims by death and maturity are charged against revenue on notification of death or on expiry of the term. The interim payments and surrenders are accounted for only at the time of settlement.
Expenses on Life Insurance relates to the acquisition expenses and expenses for maintenance of Life Insurance business, investment related expenses not treated as a part of the capital cost of investment, etc. which are accounted on accrual basis.

ANNUAL REPORT - 2018CO-OPERATIVE INSURANCE COMPANY 139
3.16.6 Reinsurance claims recoveriesReinsurance claims recoveries are recognised when the related gross insurance claim is recognised according to the terms of the relevant contract.
3.17 Other revenue
3.17.1 Interest incomeFinance income comprises interestincome on funds invested (including available-for-sale financial assets) and dividend income. Interest income is recognised in the Income Statement as it accrues and is calculated by using the effective interest rate method (EIR). Fees and commissions that are an integral part of the effective yield of the financial asset or liability are recognised as an adjustment to the effective interest rate of the instrument.
3.17.2 Dividends Dividend income is recognised when the right to receive income is established. Usually this is the ex-dividend date for equity securities.
3.17.3 Finance expenseFinance expenses consist of costsrelating to investment such as custodial fees, bank guarantee fee and brokerage fee etc. These expenses are recognised on an accrual basis.
3.17.4 Realised gains and lossesRealised gains and losses recorded in the Income Statement on investments include gains and losses on financial assets.
Gains and losses on the sale of investments are calculated as the difference between net sales proceeds and the original or amortised cost and are recorded on occurrence of the sale transaction.
3.17.5 Fair value gains and lossesFair value gains and losses recorded in the Income Statement on investments include fair value gains on financial assets at fair value through profit or loss.
3.17.6 Other incomeOther income comprises fees charged for policy administration services, disposal gains on property, plant and equipment, gains on foreign currency translations, and miscellaneous income.
Gains on foreign currency translations are recognised on a net basis.
3.18 Expenses recognitionOther expenses are recognised on accrual basis. All expenditure incurred in the running of the business and in maintaining the property, plant and equipment has been charged to profit or loss.
(a) Expenses are recognised in the profit or loss on the basis of a direct association between the cost incurred and the earning of specific items of income. All expenditure incurred in the running of the business and in maintaining the property, plant & equipment in a state of efficiency has been charged to Statement of profit or loss and other comprehensive income inarriving at the profit for the year.
(b) For the purpose of presentation of the statement of profit or loss and other comprehensive income the directors are of the opinion that function of expenses method presents fairly the elements of the Company’s performance, and hence such presentation method is adopted.
3.19 Income tax expenseTax expense comprises current and deferred tax. Current tax and deferred tax is recognised in items recognised directly in equity or in Income Statement and Statement of Profit or Loss and Other Comprehensive Income.
3.19.1 Current taxationIncome tax expense comprises current and deferred tax. Income tax expense is recognised or profit or loss except to the extent that it relates to items recognised directly in equity, in which case it is recognised in equity or other comprehensive income.
Provisions for taxation is based on the profit for the year adjusted for taxation purposes in accordance with the provisions of the Inland Revenue Act No. 10 of 2006 and the amendments thereto and the Inland Revenue Act No. 24 of 2017 at the rates specified in Note 22.

ANNUAL REPORT - 2018CO-OPERATIVE INSURANCE COMPANY140
Notes to the Financial Statements
3.19.2 Deferred taxationDeferred tax is recognised in respect of temporary differences between the carrying amounts of assets and liabilities for financial reporting purposes and the amounts used for taxation purposes.
Deferred tax is not recognised for the following temporary differences:
y Temporary difference on the initial recognition of assets or liabilities in a transaction that is not a business combination and that affects neither accounting nor taxable profit or loss
y Temporary difference related to investments in subsidiaries, associates and jointly controlled entities to the extent that the Company is able to control the timing of the reversal of the temporary differences and it is probable that they will not reverse in the foreseeable future
y Taxable temporary differences arising on the initial recognition of goodwill.
Deferred tax is measured at the tax rates that are expected to be applied to temporary differences when they reverse, based on the laws that have been enacted or substantively enacted by the reporting date.
Deferred tax assets and liabilities are offset if there is a legally enforceable right to offset current tax liabilities and assets, and they relate to income taxes levied by the same tax authority on the same taxable entity or on different tax entities, but they intend to settle current tax liabilities and assets on a net basis or their tax assets liabilities will be realised simultaneously.
A deferred tax asset is recognised to the extent that it is probable that future taxable profits will be available against which the temporary difference can be utilised. Deferred tax is not recognised for the undistributed profits of subsidiaries as the parent company has control over the dividend policy of its subsidiaries and distribution of those profits. Deferred tax assets are reviewed at each reporting date and are reduced to the extent that it is no longer probable that the related tax benefit will be realised.
3.19.3 Tax exposuresIn determining the amount of current and deferred tax, the Company takes into account the impact of uncertain tax positions and whether additional taxes and interest may be due. This assessment relies on estimates and assumptions and may involve a series of judgments about future events. New information may become available that causes the Company to change its judgment regarding the adequacy of existing tax liabilities and such changes to tax liabilities will impact tax expense in the period that such a determination is made.
3.20 Crop Insurance Levy (CIL)The Crop Insurance Levy was introduced under the provisions of the Section 14 of the Finance Act No. 12 of 2013, and came into effect from 1 April 2013. It is payable to the National Insurance Trust Fund and liable at 1% of the Profit after tax.
3.21 Economic Service Charge (ESC)ESC is payable on the liable turnover at specified rates. As per the provision of the Economic Service Charge Act No. 13 of 2006 and subsequent amendments thereto, ESC is deductible from the income tax liability. Any unclaimed payment can be carried forward within specific time period mentioned in the Act and set off against the income tax payable as per the relevant provision in the Act.
3.22 Cash flow statementThe Cash flow statement has been prepared using the “indirect method” of preparing cash flows in accordance with the Sri Lanka Accounting Standard (LKAS) 7, Cash flow statements.
Cash and cash equivalents comprise short term, highly liquid investments that are readily convertible to known amounts of cash and are subject to an insignificant risk of changes in value. The cash and cash equivalents include cash in-hand, balances with banks and short term deposits with banks.

ANNUAL REPORT - 2018CO-OPERATIVE INSURANCE COMPANY 141
For cash flow purposes, cash and cash equivalents are presented cash at bank and in hand net of bank overdrafts.
3.23 Events occurring after the reporting dateAll material subsequent events have been considered and where appropriate, adjustments or disclosures have been made in the respective notes to the financial statements.
3.24 Earnings per share (EPS)The Company presents basic and diluted Earnings per Share (EPS) data for its ordinary shares. Basic EPS is calculated by dividing the profit or loss attributable to ordinary shareholders of the Company by the weighted average number of ordinary shares outstanding during the period.
3.25 New accounting standards issued but not effective as at the reporting dateThe Institute of Chartered Accountants of Sri Lanka (CA Sri Lanka) has issued the following new Sri Lanka Accounting Standards. However, these standards have not been applied in preparing these financial statements as those were not effective as of the reporting date.
SLFRS 9 – Financial instruments: Classification &measurementSLFRS 9, as issued, reflects the first phase of work on replacement of LKAS 39 and applies to classification and measurement of financial assets & liabilities, depending on the entity’s business model for managing contractual cash flows characteristics of the financial asset.
SLFRS 9 will be effective for financial periods beginning on or after 1 January 2018.
Temporary Exemption from SLFRS 9An insurer that meets the criteria in paragraph 20B of SLFRS 4 (amended) provides a temporary exemption that permits, but does not require, the insurer to apply LKAS 39 – Financial Instruments: Recognition and Measurement rather than SLFRS 9 for annual periods beginning before 1st January 2022.
An insurer may apply the temporary exemption from SLFRS 9 if, and only if:
y It has not previously applied any version of SLFRS 9, other than only the requirements for the presentation of gains and losses of financial liabilities designated as at Faire value through profit or loss and;
y Its activities are predominantly connected with insurance, at its annual reporting date that immediately precedes 1st April 2016, or at a subsequent annual reporting date.
Having considering the above criteria, Co-operative Insurance Company limited and Cooplife Insuracne Limited are predominantly connected with Insurance activities, both the companies may continue to apply LKAS 39 – Financial Instruments: Recognition and Measurement rather than SLFRS 9 for annual periods beginning before 1st January 2022.
SLFRS 16 – LeasesSLFRS 16 – Leases eliminates the current dual accounting model for lessees which distinguishes between on-balance sheet finance leases and off - balance sheet operating leases. Instead there will be a single on balance sheet accounting model that is similar to the current finance lease accounting. The Company is assessing the potential impact on its Financial Statements resulting from the application of SLFRS 16. This standard is effective from 1 January 2019.

ANNUAL REPORT - 2018CO-OPERATIVE INSURANCE COMPANY142
4. PROPERTY, PLANT AND EQUIPMENT - GROUP
Cost Land Buildings Building
improvements Partition Computers Office
equipment Furniture
and fittings Motor vehicles Lease hold Equipment
Lease hold Motor vehicles
Working-in progress -
Furniture and fittings Total
Rs. Rs. Rs. Rs. Rs. Rs. Rs. Rs. Rs. Rs. Rs. Rs.
Balance as at 01 January 2017 202,550,000 406,012,640 64,437,360 2,061,739 200,367,227 99,750,041 208,841,879 91,376,770 7,588,800 42,050,000 16,723,261 1,341,759,717 Additions during the year - - - 5,030,149 29,122,942 41,369,580 39,639,720 6,850,400 (948,600) (5,000,000) 4,918,652 120,982,843 Disposals during the year - - - - - (1,893,000) (798,475) (5,521,000) - - (21,641,913) (29,854,388)Impairments - - - - - - - (617,299) - - - (617,299)Revaluation 20,770,000 1,817,166 14,272,310 - - - - 39,872,841 - - - 76,732,318 Depreciation reversal on revaluation - (7,404,806) (8,054,670) - - - - (41,722,512) - - - (57,181,989)Balance as at 31 December 2017 223,320,000 400,425,000 70,655,000 7,091,888 229,490,170 139,226,621 247,683,124 90,239,200 6,640,200 37,050,000 - 1,451,821,202 Balance as at 01 January 2018 223,320,000 400,425,000 70,655,000 7,091,888 229,490,170 139,226,621 247,683,124 90,239,200 6,640,200 37,050,000 - 1,451,821,202 Additions during the year - - - 12,698,961 28,747,846 21,624,366 24,027,932 27,163,060 - (18,200,000) - 96,062,165 Disposals during the year - - - - - - (701,594) (3,373,000) - - - (4,074,594)Impairments - - - - - - - (295,046) - - - (295,046)Revaluation - 17,465,037 10,949,571 - - - - 36,508,721 - - - 66,023,329 Depreciation reversal on revaluation - (7,421,037) (10,093,571) - - - - (46,085,976) - - - (63,600,584)Balance as at 31 December 2018 224,420,000 410,469,000 71,511,000 19,790,849 258,238,016 160,850,987 271,009,461 104,156,959 6,640,200 18,850,000 - 1,545,936,472
DepreciationBalance as at 01 January 2017 - - - 53,455 112,356,649 52,087,888 99,603,122 24,678,422 1,501,950 22,348,235 - 312,629,722 Depreciation for the year - 7,404,806 8,054,670 534,465 22,173,499 10,096,422 21,002,725 24,886,420 800,766 4,317,916 - 99,271,691 Depreciation on disposal - - - - - (1,893,000) (598,856) (1,690,824) - - - (4,182,680)Depreciation on Impairment - - - - - - - (802,307) - - - (802,307)Depreciation on revaluation - (7,404,806) (8,054,670) - - - - (41,722,512) - - - (57,181,989)Balance as at 31 December 2017 - - - 587,921 134,530,148 60,291,310 120,006,991 5,349,199 2,302,716 26,666,151 - 349,734,437 Balance as at 01 January 2018 - - - 587,921 134,530,148 60,291,310 120,006,991 5,349,199 2,302,716 26,666,151 - 349,73Depreciation impact on impairment - - - - - - - (138,720) - - - (138,720)Depreciation for the year - 7,421,037 10,093,571 1,731,303 27,571,780 14,737,532 24,457,561 28,717,095 800,766 7,005,417 - 122,536,062 Depreciation on disposal - - - - - - (369,822) 17,376,052 - (18,200,000) - (1,193,769)Depreciation on revaluation - (7,421,037) (10,093,571) - - - - (46,085,976) - - - (63,600,584)Balance as at 31 December 2018 - - - 2,319,224 162,101,928 75,028,842 144,094,729 5,217,650 3,103,482 15,471,568 - 407,337,425 Carrying value as at 31 December 2018 224,420,000 410,469,000 71,511,000 17,471,625 96,136,088 85,822,144 126,914,732 98,939,309 3,536,718 3,378,432 - 1,138,599,047 Carrying value as at 31 December 2017 223,320,000 400,425,000 70,655,000 6,503,967 94,960,021 78,935,311 127,676,133 84,890,001 4,337,484 10,383,849 - 1,102,086,765
Notes to the Financial Statements
As at 31 December

ANNUAL REPORT - 2018CO-OPERATIVE INSURANCE COMPANY 143
4. PROPERTY, PLANT AND EQUIPMENT - GROUP
Cost Land Buildings Building
improvements Partition Computers Office
equipment Furniture
and fittings Motor vehicles Lease hold Equipment
Lease hold Motor vehicles
Working-in progress -
Furniture and fittings Total
Rs. Rs. Rs. Rs. Rs. Rs. Rs. Rs. Rs. Rs. Rs. Rs.
Balance as at 01 January 2017 202,550,000 406,012,640 64,437,360 2,061,739 200,367,227 99,750,041 208,841,879 91,376,770 7,588,800 42,050,000 16,723,261 1,341,759,717 Additions during the year - - - 5,030,149 29,122,942 41,369,580 39,639,720 6,850,400 (948,600) (5,000,000) 4,918,652 120,982,843 Disposals during the year - - - - - (1,893,000) (798,475) (5,521,000) - - (21,641,913) (29,854,388)Impairments - - - - - - - (617,299) - - - (617,299)Revaluation 20,770,000 1,817,166 14,272,310 - - - - 39,872,841 - - - 76,732,318 Depreciation reversal on revaluation - (7,404,806) (8,054,670) - - - - (41,722,512) - - - (57,181,989)Balance as at 31 December 2017 223,320,000 400,425,000 70,655,000 7,091,888 229,490,170 139,226,621 247,683,124 90,239,200 6,640,200 37,050,000 - 1,451,821,202 Balance as at 01 January 2018 223,320,000 400,425,000 70,655,000 7,091,888 229,490,170 139,226,621 247,683,124 90,239,200 6,640,200 37,050,000 - 1,451,821,202 Additions during the year - - - 12,698,961 28,747,846 21,624,366 24,027,932 27,163,060 - (18,200,000) - 96,062,165 Disposals during the year - - - - - - (701,594) (3,373,000) - - - (4,074,594)Impairments - - - - - - - (295,046) - - - (295,046)Revaluation - 17,465,037 10,949,571 - - - - 36,508,721 - - - 66,023,329 Depreciation reversal on revaluation - (7,421,037) (10,093,571) - - - - (46,085,976) - - - (63,600,584)Balance as at 31 December 2018 224,420,000 410,469,000 71,511,000 19,790,849 258,238,016 160,850,987 271,009,461 104,156,959 6,640,200 18,850,000 - 1,545,936,472
DepreciationBalance as at 01 January 2017 - - - 53,455 112,356,649 52,087,888 99,603,122 24,678,422 1,501,950 22,348,235 - 312,629,722 Depreciation for the year - 7,404,806 8,054,670 534,465 22,173,499 10,096,422 21,002,725 24,886,420 800,766 4,317,916 - 99,271,691 Depreciation on disposal - - - - - (1,893,000) (598,856) (1,690,824) - - - (4,182,680)Depreciation on Impairment - - - - - - - (802,307) - - - (802,307)Depreciation on revaluation - (7,404,806) (8,054,670) - - - - (41,722,512) - - - (57,181,989)Balance as at 31 December 2017 - - - 587,921 134,530,148 60,291,310 120,006,991 5,349,199 2,302,716 26,666,151 - 349,734,437 Balance as at 01 January 2018 - - - 587,921 134,530,148 60,291,310 120,006,991 5,349,199 2,302,716 26,666,151 - 349,73Depreciation impact on impairment - - - - - - - (138,720) - - - (138,720)Depreciation for the year - 7,421,037 10,093,571 1,731,303 27,571,780 14,737,532 24,457,561 28,717,095 800,766 7,005,417 - 122,536,062 Depreciation on disposal - - - - - - (369,822) 17,376,052 - (18,200,000) - (1,193,769)Depreciation on revaluation - (7,421,037) (10,093,571) - - - - (46,085,976) - - - (63,600,584)Balance as at 31 December 2018 - - - 2,319,224 162,101,928 75,028,842 144,094,729 5,217,650 3,103,482 15,471,568 - 407,337,425 Carrying value as at 31 December 2018 224,420,000 410,469,000 71,511,000 17,471,625 96,136,088 85,822,144 126,914,732 98,939,309 3,536,718 3,378,432 - 1,138,599,047 Carrying value as at 31 December 2017 223,320,000 400,425,000 70,655,000 6,503,967 94,960,021 78,935,311 127,676,133 84,890,001 4,337,484 10,383,849 - 1,102,086,765

ANNUAL REPORT - 2018CO-OPERATIVE INSURANCE COMPANY144
4. PROPERTY, PLANT AND EQUIPMENT - COMPANY
Cost Land Buildings Building
improvements Partition Computers Office
equipment Furniture
and fittings Motor vehicles Lease hold Equipment
Lease hold Motor vehicles
Working-in progress -
Furniture and fittings Total
Rs. Rs. Rs. Rs. Rs. Rs. Rs. Rs. Rs. Rs. Rs. Rs.
Balance as at January 01, 2017 182,325,000 273,237,640 64,437,360 2,061,739 191,088,022 87,350,684 155,159,860 58,852,470 7,588,800 34,825,000 - 1,056,926,575 Additions during the year - - - 5,030,149 22,741,127 24,146,471 8,760,783 6,450,150 (948,600) (5,000,000) - 61,180,080 Disposals during the year - - - - - (1,893,000) (798,475) (471,000) - - - (3,162,475)Write off - - - - - - - (573,000) - - - (573,000)Revaluation 16,575,000 (81,646) 14,272,310 - - - - 31,187,426 - - - 61,953,089 Depreciation reversal on revaluation - (4,710,994) (8,054,670) - - - - (32,090,046) - - - (44,855,710)Balance as at 31 December 2017 198,900,000 268,445,000 70,655,000 7,091,888 213,829,149 109,604,155 163,122,168 63,356,000 6,640,200 29,825,000 - 1,131,468,559 Balance as at 01 January 2018 198,900,000 268,445,000 70,655,000 7,091,888 213,829,148 109,604,155 163,122,168 63,356,000 6,640,200 29,825,000 - 1,131,468,559 Additions during the year - - - 12,698,961 21,254,347 17,657,905 19,019,776 26,352,710 - (18,200,000) - 78,783,699 Disposals during the year - - - - - - (245,558) (3,093,000) - - - (3,338,558)Revaluation 1,100,000 4,672,362 10,949,571 - - - - 27,380,054 - - - 44,101,987 Depreciation reversal on revaluation - (4,628,362) (10,093,571) - - - - (36,060,764) - - - (50,782,697)Balance as at 31 December 2018 200,000,000 268,489,000 71,511,000 19,790,849 235,083,496 127,262,060 181,896,385 77,935,000 6,640,200 11,625,000 - 1,200,232,990
DepreciationBalance as at 01 January 2017 - - - 53,456 108,182,136 48,169,925 82,697,009 13,768,489 1,501,950 20,180,735 - 274,553,700 Depreciation for the year - 4,710,994 8,054,670 534,466 20,635,084 7,657,267 12,783,589 19,152,376 800,766 2,872,916 - 77,202,128 Depreciation on disposal - - - - - (1,893,000) (598,856) (291,153) - - - (2,783,009)Reversal on write off - - - - - - - (539,667) - - - (539,667)Depreciation on revaluation - (4,710,994) (8,054,670) - - - - (32,090,046) - - - (44,855,710)Balance as at 31 December 2017 - - - 587,921 128,817,220 53,934,192 94,881,742 - 2,302,716 23,053,651 - 303,577,442 Balance as at 01 January 2018 - - - 587,921 128,817,220 53,934,192 94,881,742 - 2,302,716 23,053,651 - 303,577,442 Depreciation for the year - 4,628,362 10,093,571 1,731,303 24,642,639 11,051,617 14,574,945 18,563,903 800,766 5,560,417 - 91,647,523 Depreciation on disposal - - - - - - (133,381) (703,139) - - - (836,520)Transfers - - - - - - - 18,200,000 - (18,200,000) - - Depreciation on revaluation - (4,628,362) (10,093,571) - - - - (36,060,764) - - - (50,782,697)Balance as at 31 December 2018 - - - 2,319,225 153,459,859 64,985,808 109,323,306 - 3,103,482 10,414,068 - 343,605,749 Carrying value as at 31 December 2018 200,000,000 268,489,000 71,511,000 17,471,625 81,623,637 62,276,252 72,573,079 77,935,000 3,536,718 1,210,932 - 856,627,241 Carrying value as at 31 December 2017 198,900,000 268,445,000 70,655,000 6,503,967 85,011,930 55,669,963 68,240,426 63,356,000 4,337,484 6,771,349 - 827,891,117
Notes to the Financial Statements
As at 31 December

ANNUAL REPORT - 2018CO-OPERATIVE INSURANCE COMPANY 145
4. PROPERTY, PLANT AND EQUIPMENT - COMPANY
Cost Land Buildings Building
improvements Partition Computers Office
equipment Furniture
and fittings Motor vehicles Lease hold Equipment
Lease hold Motor vehicles
Working-in progress -
Furniture and fittings Total
Rs. Rs. Rs. Rs. Rs. Rs. Rs. Rs. Rs. Rs. Rs. Rs.
Balance as at January 01, 2017 182,325,000 273,237,640 64,437,360 2,061,739 191,088,022 87,350,684 155,159,860 58,852,470 7,588,800 34,825,000 - 1,056,926,575 Additions during the year - - - 5,030,149 22,741,127 24,146,471 8,760,783 6,450,150 (948,600) (5,000,000) - 61,180,080 Disposals during the year - - - - - (1,893,000) (798,475) (471,000) - - - (3,162,475)Write off - - - - - - - (573,000) - - - (573,000)Revaluation 16,575,000 (81,646) 14,272,310 - - - - 31,187,426 - - - 61,953,089 Depreciation reversal on revaluation - (4,710,994) (8,054,670) - - - - (32,090,046) - - - (44,855,710)Balance as at 31 December 2017 198,900,000 268,445,000 70,655,000 7,091,888 213,829,149 109,604,155 163,122,168 63,356,000 6,640,200 29,825,000 - 1,131,468,559 Balance as at 01 January 2018 198,900,000 268,445,000 70,655,000 7,091,888 213,829,148 109,604,155 163,122,168 63,356,000 6,640,200 29,825,000 - 1,131,468,559 Additions during the year - - - 12,698,961 21,254,347 17,657,905 19,019,776 26,352,710 - (18,200,000) - 78,783,699 Disposals during the year - - - - - - (245,558) (3,093,000) - - - (3,338,558)Revaluation 1,100,000 4,672,362 10,949,571 - - - - 27,380,054 - - - 44,101,987 Depreciation reversal on revaluation - (4,628,362) (10,093,571) - - - - (36,060,764) - - - (50,782,697)Balance as at 31 December 2018 200,000,000 268,489,000 71,511,000 19,790,849 235,083,496 127,262,060 181,896,385 77,935,000 6,640,200 11,625,000 - 1,200,232,990
DepreciationBalance as at 01 January 2017 - - - 53,456 108,182,136 48,169,925 82,697,009 13,768,489 1,501,950 20,180,735 - 274,553,700 Depreciation for the year - 4,710,994 8,054,670 534,466 20,635,084 7,657,267 12,783,589 19,152,376 800,766 2,872,916 - 77,202,128 Depreciation on disposal - - - - - (1,893,000) (598,856) (291,153) - - - (2,783,009)Reversal on write off - - - - - - - (539,667) - - - (539,667)Depreciation on revaluation - (4,710,994) (8,054,670) - - - - (32,090,046) - - - (44,855,710)Balance as at 31 December 2017 - - - 587,921 128,817,220 53,934,192 94,881,742 - 2,302,716 23,053,651 - 303,577,442 Balance as at 01 January 2018 - - - 587,921 128,817,220 53,934,192 94,881,742 - 2,302,716 23,053,651 - 303,577,442 Depreciation for the year - 4,628,362 10,093,571 1,731,303 24,642,639 11,051,617 14,574,945 18,563,903 800,766 5,560,417 - 91,647,523 Depreciation on disposal - - - - - - (133,381) (703,139) - - - (836,520)Transfers - - - - - - - 18,200,000 - (18,200,000) - - Depreciation on revaluation - (4,628,362) (10,093,571) - - - - (36,060,764) - - - (50,782,697)Balance as at 31 December 2018 - - - 2,319,225 153,459,859 64,985,808 109,323,306 - 3,103,482 10,414,068 - 343,605,749 Carrying value as at 31 December 2018 200,000,000 268,489,000 71,511,000 17,471,625 81,623,637 62,276,252 72,573,079 77,935,000 3,536,718 1,210,932 - 856,627,241 Carrying value as at 31 December 2017 198,900,000 268,445,000 70,655,000 6,503,967 85,011,930 55,669,963 68,240,426 63,356,000 4,337,484 6,771,349 - 827,891,117

ANNUAL REPORT - 2018CO-OPERATIVE INSURANCE COMPANY146
4. Property, Plant and Equipment - (Contd.)
Revaluation Land and BuildingLand and building of the Group was valued by Mr. Asoka G.D. AIV a professional valuer on 31 December 2018 on “Contractors Basis” and the excess of Rs. 16.72Mn-company over the net book value as at 31 December 2018 has been credited to the revaluation reserve.
The fair value of the freehold land was determined based on the market comparable approach that reflects recent transaction prices for similar properties. The fair value measurement for all the lands has been categorised as a Level 3 fair value based on the inputs to the valuation technique used. A significant increase in the market value per perch used in arriving at fair value would result in a significant increase in fair value, and vice versa.
As at 31 December Land Extent Building Area No. of BuildingsDate of
ValuationFair value
(Rs.)
Property at Grandpass 33.15Perches 28262 sq ft 1 26.12.2018 540,000,000 Property at Ambalanthota 4.27 Perches 2304 sq ft 1 31.12.2018 16,400,000 Property at Nikaveratiya 39.7 Perches 17775 sq ft 1 30.12.2018 150,000,000
706,400,000
Fair value HierarchyThe table below analyse non financial instruments measured at fair value at the end of the reporting period, by the level of the fair value hierarchy.
Land and BuildingsLevel 1
(Rs.)Level 2
(Rs.)Level 3
(Rs.)Total (Rs.)
2018 - - 706,400,000 706,400,000 2017 - - 694,400,000 694,400,000
The fair value measurement has been categorised as level 3 fair value based on the inputs to the valuation techniques used.
Valuation techniques and significant unobservable inputsThe following table shows the valuation techniques used in measuring the fair value of Land and buildings, as well as the significant unobservable input used.
Location Valuation technique Significant unobservable inputsSignificant unobservable inputs - Valued at
Property at Grandpas Open market Price per perch and sq.ft 6,100,000/- per perch and 9,500/- per Sq.ft
Property at Ambalanthota Open market Price per perch and sq.ft 2,000,000/- per perch and 4,000 per Sq.ft
Property at Nikaveratiya Open market Price per perch and sq.ft 400,000/- per perch and 7,500/- per Sq.ft
Notes to the Financial Statements

ANNUAL REPORT - 2018CO-OPERATIVE INSURANCE COMPANY 147
If the revalued land and buildings under property, plant and equipment were stated on the historical cost basis, the carrying amount would be as follows:
Class of Asset
Property at Grandpass
(Rs.)
Property at Ambalanthota
(Rs.)
Property at Nikaveratiya
(Rs.)
LandCost 160,064,000 1,120,415 8,217,758 Accumulated depreciation - - - Net book value as at 31 December 2018 160,064,000 1,120,415 8,217,758 Net book value as at 31 December 2017 160,064,000 1,120,415 8,217,758
BuildingsCost 175,796,923 10,423,590 88,712,132 Accumulated depreciation 35,116,471 3,468,506 9,027,257 Net book value as at 31 December 2018 140,680,452 6,955,084 79,684,875 Net book value as at 31 December 2017 147,921,132 7,143,059 81,380,298
Fully depreciated assetsCompany’s property, plant and equipment includes fully depreciated assets having a gross carrying amount of Rs.155,200,115 (2017 - 155,200,115).
SecurityThere were no items of property, plant and equipment in the Group and Company, pledged as securities for liabilities during the year (2017 - Nill).
Useful life of the property, plant and equipment as follows:
For the year ended 31 December 2018 2017
BuildingsGrandpass 60 years 60 yearsAmbalanthota 40 years 20 yearsNikaveratiya 50 years 20 years
Office equipment 8 years 8 yearsComputers 6 years 6 yearsMotor vehicles 5 years 5 yearsFurniture and fittings 8 years 8 yearsPartitions 8 years 8 yearsImprovements to buildings 10 years 10 years

ANNUAL REPORT - 2018CO-OPERATIVE INSURANCE COMPANY148
5. INTANGIBLE ASSETS
Computer software Development costs TotalCost Group Company Group Company Group Company
Balance as at 1 January 2017 14,431,058 6,089,168 995,582 995,582 15,426,640 7,084,750 Acquisitions - Internally developed - - - - - - Additions 1,221,418 1,221,418 - - 1,221,418 1,221,418 Balance as at 31 December 2017 15,652,476 7,310,586 995,582 995,582 16,648,058 8,306,168
Balance as at 01 January 2018 15,652,476 7,310,586 995,582 995,582 16,648,058 8,306,168 Acquisitions - Internally developed - - - - - - Additions 6,323,082 3,033,582 89,500 89,500 6,412,582 3,123,082 Write off of discontinued developments - - (995,582) (995,582) (995,582) (995,582)Balance as at 31 December 2018 21,975,558 10,344,168 89,500 89,500 22,065,058 10,433,668
AmortisationBalance as at 01 January 2017 12,172,628 4,011,070 - - 12,172,628 4,011,071 Amortisation for the year 2,333,661 2,159,070 - - 2,333,661 2,159,070 Balance as at 31 December 2017 14,506,288 6,170,140 - - 14,506,289 6,170,141 Balance as at 01 January 2018 14,506,288 6,170,140 - - 14,506,289 6,170,141 Amortisation for the year 2,227,436 1,401,573 - - 2,227,436 1,401,573 Balance as at 31 December 2018 16,733,725 7,571,712 - - 16,733,725 7,571,713
Carrying amountsAs at 31 December 2018 5,331,334 2,861,955 As at 31 December 2017 2,141,769 2,136,028
Intangible assetsComputer software represents cost incurred on insurance software development, website development and purchased of web designing and graphic designing tools.
AmortisationThe amortisation of software and development costs included in the operating expenses.
6. FINANCIAL INVESTMENTS
Group Company As at 31 December Note 2018 2017 2018 2017
Rs. Rs. Rs. Rs.
Held to maturity financial assets (HTM) 6.1 1,582,420,859 1,067,084,925 1,212,893,387 1,067,084,925 Loans and receivables (L&R) 6.2 2,565,065,310 2,234,192,681 1,658,902,979 1,283,372,747 Available for sale financial assets (AFS) 6.3 716,136,646 872,876,163 15,779,616 15,493,142 Financial assets at fair value through profit or loss (FVTPL) 6.4 731,450 922,250 - -
4,864,354,265 4,175,076,019 2,887,575,982 2,365,950,814
6.1 Held to maturity financial assets (HTM) Amortised Cost Treasury bonds 6.1(a) 797,257,950 425,470,628 427,730,478 425,470,628 Quoted debentures 6.1(b) 785,162,909 641,614,297 785,162,909 641,614,297
1,582,420,859 1,067,084,925 1,212,893,387 1,067,084,925
Notes to the Financial Statements

ANNUAL REPORT - 2018CO-OPERATIVE INSURANCE COMPANY 149
6.1 (a) Treasury Bonds
As at 31 December 2018 Group CompanyMaturity Date Face Value Amortised Cost Face Value Amortised Cost
Rs. Rs. Rs. Rs.
2019 73,308,307 74,936,228 73,308,307 74,936,228 2022 26,279,623 26,764,723 26,279,623 26,764,723 2024 130,000,000 132,172,408 130,000,000 132,172,408 2026 50,000,000 43,748,344 50,000,000 43,748,344 2029 144,511,428 150,108,775 144,511,428 150,108,775 2028 50,000,000 55,210,741 - - 2030 300,000,000 314,316,731 - -
774,099,358 797,257,950 424,099,358 427,730,478
As at 31 December 2017 Group CompanyMaturity Date Face Value Amortised Cost Face Value Amortised Cost
Rs. Rs. Rs. Rs.
2019 80,572,933 74,136,929 80,572,933 74,136,929 2022 26,279,623 26,553,435 26,279,623 26,553,435 2024 130,000,000 131,471,002 130,000,000 131,471,002 2026 50,000,000 43,073,613 50,000,000 43,073,613 2029 137,700,724 150,235,649 137,700,724 150,235,649
424,553,280 425,470,628 424,553,280 425,470,628
6.1 (b) Quoted Debentures - Group and Company
As at 31 December 2018
IssuerMaturity Date
No. of Debentures
Carrying Value Amortised Cost
Rs.Interest Rate
Sampath Bank PLC 15/12/2022 800,000 85,276,013 12.89%Nations Trust Bank PLC 08/11/2021 383,300 38,537,604 12.65%DFCC Bank PLC 09/11/2021 1,300,000 130,513,180 12.15%Commercial Bank of Ceylon PLC 27/10/2021 890,500 89,519,262 12.00%National Development Bank PLC 19/12/2025 250,000 26,326,691 14.00%National Development Bank PLC 19/12/2023 100,000 10,639,885 13.90%Bank of Ceylon 24/10/2023 26,800 2,547,272 13.75%Hatton National Bank PLC 29/08/2023 120,000 11,332,021 8.00%Pan Asia Banking Corporation PLC 31/10/2019 440,000 43,235,269 9.75%Peoples Leasing & Finance PLC 16/11/2021 987,500 100,093,742 12.60%Janashakthi PLC 19/11/2019 180,000 19,300,591 10.75%Citizen Development Business Finance PLC 28/03/2023 1,100,000 121,698,921 14.20%Lanka Orix Finance PLC 31/07/2023 1,000,000 106,142,459 14.75%
785,162,909

ANNUAL REPORT - 2018CO-OPERATIVE INSURANCE COMPANY150
As at 31 December 2017
IssuerMaturity Date
No. of Debentures
Carrying Value Amortised Cost
Rs.Interest Rate
Sampath Bank PLC 15/12/2022 800,000 80,266,121 12.89%Nations Trust Bank PLC 08/11/2021 383,300 38,405,856 12.65%DFCC Bank PLC 09/11/2021 1,300,000 130,078,653 12.15%Commercial Bank of Ceylon PLC 27/10/2018 890,500 89,152,642 12.00%HDFC Bank Ltd. 23/10/2018 50,000 5,709,277 15.50%HDFC Bank Ltd. 23/10/2018 150,000 17,087,969 15.50%HDFC Bank Ltd. 23/10/2018 20,000 2,278,396 15.50%National Development Bank PLC 19/12/2025 250,000 26,164,434 14.00%National Development Bank PLC 10/12/2023 100,000 10,545,979 13.90%Nations Trust Bank PLC 19/12/2023 50,000 5,227,301 13.00%Bank of Ceylon 24/10/2023 26,800 2,521,572 13.75%Hatton National Bank PLC 29/08/2023 120,000 11,174,843 8.00%Pan Asia Banking Corporation PLC 31/10/2019 440,000 41,695,268 9.75%Peoples Leasing & Finance PLC 16/11/2021 987,500 100,049,017 12.60%Peoples Leasing & Finance PLC 26/03/2018 100,000 10,847,457 16.75%Alliance Finance Company PLC 30/09/2018 50,000 5,351,899 16.50%Senkadagala Finance 10/12/2018 50,000 5,148,948 15.00%Abans Ltd. 20/12/2018 50,000 5,281,889 14.50%Alliance Finance Company PLC 30/09/2018 200,000 21,356,629 16.50%Senkadagala Finance Company PLC 10/12/2018 50,000 5,132,394 15.00%Abans Ltd. 20/12/2018 90,000 9,477,840 14.50%Janashakthi PLC 19/11/2019 180,000 18,659,914 10.75%
641,614,297
6.2 Loans and receivables (L&R)
Group Company As at 31 December 2018 2017 2018 2017
Rs. Rs. Rs. Rs.
Fixed deposits 1,779,692,628 1,483,128,304 1,151,321,324 879,750,778 Investment in repos 342,132,541 608,470,883 250,746,698 319,631,641 Commercial papers 443,240,141 142,593,494 256,834,957 83,990,328
2,565,065,310 2,234,192,681 1,658,902,979 1,283,372,747
Notes to the Financial Statements

ANNUAL REPORT - 2018CO-OPERATIVE INSURANCE COMPANY 151
6.3 Available for sale (AFS)
Group As at 31 December 2018 2017
Note Cost/Face
Value Amortised
Cost Fair value Cost/Face
Value Amortised
Cost Fair value
Unquoted equity instrument Co-operative Leasing Company Ltd 4,086,720 - 5,823,576 3,971,920 - 5,109,542
Quoted equity instrument Peoples Leasing Company PLC 10,322,520 - 9,956,040 10,322,520 - 10,383,600 Treasury bonds 6.3(a) 366,898,962 410,075,023 375,531,498 408,898,962 457,526,832 445,866,891 Quoted debentures 6.3(b) 307,369,124 327,002,743 324,825,532 389,846,975 412,372,448 411,516,130
688,677,326 737,077,766 716,136,646 813,040,377 869,899,280 872,876,163
Company As at 31 December 2018 2017
Cost Amortised
Cost Fair value Cost Amortised
Cost Fair value
Unquoted equity instrument Co-operative Leasing Company Ltd. 4,086,720 - 5,823,576 3,971,920 - 5,109,542
Quoted equity instrument Peoples Leasing Company PLC 10,322,520 - 9,956,040 10,322,520 - 10,383,600
14,409,240 - 15,779,616 14,294,440 - 15,493,142
6.3 (a) Treasury bonds
As at 31 December 2018 Group CompanyFace Value Year of Maturity Amortised Cost Fair Value Amortised Cost Fair Value
89,442,231 2019 94,152,854 92,324,060 - - 23,720,377 2022 27,326,956 24,795,124 - - 70,000,000 2024 81,075,646 73,309,460 - - 83,736,354 2029 103,551,107 90,340,054 - - 100,000,000 2030 103,968,460 94,762,800 - - 366,898,962 410,075,023 375,531,498 - -

ANNUAL REPORT - 2018CO-OPERATIVE INSURANCE COMPANY152
As at 31 December 2017 Group CompanyFace Value Year of Maturity Amortised Cost Fair Value Amortised Cost Fair Value
42,000,000 2018 42,104,780 42,841,764 - - 89,442,231 2019 96,748,767 93,992,962 - - 23,720,377 2022 27,872,053 26,073,225 - - 70,000,000 2024 82,171,296 78,048,320 - - 83,736,354 2029 104,541,093 99,748,420 - - 100,000,000 2030 104,088,843 105,162,200 - - 408,898,962 457,526,832 445,866,891 - -
6.3 (b) Quoted debentures - Group
Debentures
As at 31 December2018Issuer Maturity Date
No. of Debentures Cost Amortised Cost Fair Value
Hatton National Bank PLC 29/08/2023 324,832 21,995,999 26,737,042 33,514,444 Hatton National Bank PLC 28/03/2021 300,000 30,000,000 32,532,336 32,831,130 National Development Bank PLC 19/12/2023 87,500 12,063,125 11,847,550 8,613,553 Bank of Ceylon 21/09/2019 330,000 33,000,000 33,700,632 32,884,500 Pan Asia Bank Corporation PLC 30/10/2019 330,000 33,000,000 33,524,970 32,765,832 DFCC Vardana Bank Ltd. 10/06/2020 263,100 26,310,000 27,660,201 26,699,072 Sampath Bank PLC 10/06/2021 680,000 68,000,000 72,704,829 73,421,028 Janashakthi PLC 19/11/2019 330,000 33,000,000 36,557,987 32,116,623 Siyapatha Finance PLC 20/10/2019 500,000 50,000,000 51,737,196 51,979,350
3,145,432 307,369,124 327,002,743 324,825,532
Debentures
As at 31 December 2017Issuer Maturity Date
No. of Debentures Cost Amortised Cost Fair Value
Hatton National Bank PLC 29/08/2023 324,832 21,995,999 25,783,935 34,965,897 Hatton National Bank PLC 28/03/2021 300,000 30,000,000 32,534,426 31,721,987 HDFC Bank of Sri Lanka 23/10/2018 250,000 25,000,000 29,032,044 29,363,160 HDFC Bank of Sri Lanka 23/10/2018 50,000 5,000,000 5,781,867 5,872,632 HDFC Bank of Sri Lanka 23/10/2018 30,000 3,506,374 3,559,616 3,523,579 National Development Bank PLC 19/12/2023 87,500 12,063,125 12,143,443 10,317,905 Bank of Ceylon 21/09/2019 330,000 33,000,000 33,688,250 31,774,495 Pan Asia Bank Corporation PLC 30/10/2019 330,000 33,000,000 33,524,986 32,054,237 DFCC Vardana Bank Ltd. 10/06/2020 263,100 26,310,000 27,661,551 25,655,614 Sampath Bank PLC 10/06/2021 680,000 68,000,000 72,710,140 71,982,314 People's Leasing & Finance PLC 26/03/2018 200,000 20,000,000 21,695,174 21,870,465 Senkadagala Finance Company PLC 10/12/2018 250,000 28,971,477 25,970,287 25,444,581 Janashakthi PLC 19/11/2019 330,000 33,000,000 36,549,533 35,412,897 Siyapatha Finance PLC 20/10/2019 500,000 50,000,000 51,737,196 51,556,368
3,925,432 389,846,975 412,372,448 411,516,130
Notes to the Financial Statements

ANNUAL REPORT - 2018CO-OPERATIVE INSURANCE COMPANY 153
6.4 Fair value through profit or loss
Group CompanyAs at 31 December 2018 2017 2018 2017
Fair Value Fair Value Rs. Rs. Rs. Rs.
Quoted shares 731,450 922,250 - - 731,450 922,250 - -
During the year, net realised gain of Rs. 4,326 (2017 - Rs. 18,346,169) has been recognised in the statement of profit or loss.
7. INVESTMENTS IN SUBSIDIARIES
Company As at 31 December 2018 2017
Rs. Rs.
Cooplife Insurance Limited (Note 7.1) 445,260,040 410,000,040 Co-operative Insurance Training Academy (Pvt) Limited (Note 7.2) 10 -
445,260,050 410,000,040
7.1 Cooplife Insurance LimitedBalance as at 01 January 410,000,040 400,000,040 Add: Investments made during the year 35,260,000 10,000,000 Balance at 31st December 445,260,040 410,000,040
7.2 Co-operative Insurance Training Academy (Pvt) LimitedBalance as at 01 January - - Add: Investment made during the year 10 - Balance at 31st December 10 -
During the year company has acquired CITA 100% shareholdings for Rs. 10 Consideration.
8. LOANS TO LIFE POLICYHOLDERS
Group Company As at 31 December 2018 2017 2018 2017
Rs. Rs. Rs. Rs.
Loans 15,618,751 14,345,591 - - Interest receivable 5,010,923 4,693,518 - -
20,629,674 19,039,109 - -
9. REINSURANCE RECEIVABLES
Group Company As at 31 December 2018 2017 2018 2017
Rs. Rs. Rs. Rs.
Reinsurance receivables on claims 315,747,083 246,194,482 307,659,765 235,227,149 Reinsurance recoveries on IBNR 24,312,142 9,912,905 24,312,142 9,912,905 Balance at 31 December 340,059,225 256,107,387 331,971,907 245,140,054

ANNUAL REPORT - 2018CO-OPERATIVE INSURANCE COMPANY154
Notes to the Financial Statements
Fair value of reinsurance receivablesThe carrying values disclosed above approximate the fair value at the reporting date.
Impairment of reinsurance receivablesNo impairment observed for the reinsurance receivables.
Collateral detailsThe Company does not hold any collateral as security against potential default by reinsurance counter parties.
10. PREMIUM RECEIVABLES
Group Company As at 31 December 2018 2017 2018 2017
Rs. Rs. Rs. Rs.
Premium receivable - Non life insurance 764,713,045 602,685,436 764,713,045 602,685,436 Premium receivable - Life insurance 13,147,473 10,925,663 - - Impairment allowance on premium receivables (19,272,100) (10,816,532) (13,995,964) (8,176,157)
758,588,418 602,794,567 750,717,081 594,509,280
Movement in impairment allowance on premium receivablesBalance at 1st January 10,816,532 20,813,680 8,176,157 18,049,834 Impairment losses recognised during the year 19,272,100 10,816,532 13,995,964 8,176,157 Amounts written off during the year as uncollectable 7,753,584 (1,097,238) 7,753,584 (945,297)Amounts recovered during the year (18,570,116) (19,716,442) (15,929,741) (17,104,537)Balance as at 31 December 19,272,100 10,816,532 13,995,964 8,176,157
Fair value of premium receivableThe carrying amount disclosed above approximates the fair value at the reporting date.
Impairment of premium receivableImpairment charges for the year are recognised in other operating and administrative expenses.
Collateral detailsThe Company does not hold any collateral as security against potential default by policyholders or intermediaries.
11. OTHER ASSETS
Group Company As at 31 December 2018 2017 2018 2017
Rs. Rs. Rs. Rs.
Deposits, advances and prepayments 40,755,733 38,342,211 40,755,733 38,342,211 Withholding tax receivable 19,427,437 29,849,335 - - Staff loans 28,054,353 34,783,567 16,477,333 21,946,292 Salvage inventory 14,445,874 7,900,000 14,445,874 7,900,000 Inventory - complementary items 8,918,124 7,117,632 456,946 567,016 Other receivables 29,218,553 21,335,772 13,352,611 1,331,259 (-) Impairment - Other assets - (1,301,348) - (1,301,348)
140,820,074 138,027,169 85,488,497 68,785,430

ANNUAL REPORT - 2018CO-OPERATIVE INSURANCE COMPANY 155
Fair valueThe fair value of staff loans are based on cash flow discounting rate. Discount rate is equal to AWPLR plus appropriate risk margin.
12. CASH AND CASH EQUIVALENTS
Group Company As at 31 December 2018 2017 2018 2017
Rs. Rs. Rs. Rs.
Cash at bank 134,585,846 135,767,458 114,990,385 112,359,428 Cash in hand 6,020,944 2,876,164 5,718,444 2,578,664 Cash in transit 223,823 - - - Cash at bank and in hand 140,830,613 138,643,622 120,708,829 114,938,092 Bank overdrafts (94,508,287) (69,968,193) (94,508,288) (69,968,193)Cash and cash equivalents (net) in the statement of cash flows 46,322,327 68,675,429 26,200,542 44,969,899
13. STATED CAPITAL
Group Company As at 31 December 2018 2017 2018 2017
Note Rs. Rs. Rs. Rs.
Ordinary shares 13.1 1,430,194,585 1,260,251,770 1,430,194,585 1,260,251,770 No. of shares 13.2 137,354,891 126,025,177 137,354,891 126,025,177
13.1 Voting Ordinary SharesBalance at 1st January 1,260,251,770 1,115,367,950 1,260,251,770 1,115,367,950 Share issues 169,942,815 144,883,820 169,942,815 144,883,820 Balance at 31st December 1,430,194,585 1,260,251,770 1,430,194,585 1,260,251,770
13.2 Reconciliation of Number of Shares - Voting Ordinary SharesNo of shares at 1st January 126,025,177 111,536,795 126,025,177 111,536,795 Shares issued during the year 11,329,714 14,488,382 11,329,714 14,488,382 No of shares at 31st December 137,354,891 126,025,177 137,354,891 126,025,177
13.3 Ordinary sharesAll issued shares are fully paid. There is one class of ordinary shares. All shares issued carry equal voting rights. The holders of ordinary shares are entitled to receive dividends as declared from time to time, and are entitled to one vote per share at meetings of the Company.

ANNUAL REPORT - 2018CO-OPERATIVE INSURANCE COMPANY156
Notes to the Financial Statements
14. INTEREST BEARING BORROWINGS
Group Company2018 2017 2018 2017
Rs. Rs. Rs. Rs.
Finance lease (Note 14.1) 3,051,458 11,586,461 1,763,819 8,414,249 3,051,458 11,586,461 1,763,819 8,414,249
14.1 Finance leaseFinance lease liabilities are payable as follows;
Group Future
minimum lease
payments Interest
Present value of future
lease payments
Future minimum
lease payments Interest
Present value of future
lease payments
2018 2018 2018 2017 2017 2017
Less than one year 3,223,549 172,091 3,051,458 10,149,689 1,421,479 8,728,210 Between one and five years - - - 3,030,342 172,091 2,858,251
3,223,549 172,091 3,051,458 13,180,031 1,593,570 11,586,461
Company Future
minimum lease
payments Interest
Present value of future
lease payments
Future minimum
lease payments Interest
Present value of future
lease payments
2018 2018 2018 2017 2017 2017
Less than one year 1,870,274 106,455 1,763,819 7,636,464 986,152 6,650,312 Between one and five years - - - 1,870,392 106,455 1,763,937
1,870,274 106,455 1,763,819 9,506,856 1,092,607 8,414,249
15. INSURANCE LIABILITIES
Group Company2018 2017 2018 2017
Rs. Rs. Rs. Rs.
Life insuranceInsurance provision (Note 15.1) 1,570,024,385 1,459,287,492 - - Unclaimed benefits 38,077,062 31,726,826 - -
1,608,101,447 1,491,014,318 - -
Non Life insurancePremium Unearned premium (Note 15.2) 1,654,770,901 1,307,312,789 1,654,770,901 1,307,312,789 Net deferred acquisition cost (Note 15.3) (109,850,493) (56,032,546) (109,850,493) (56,032,546)Gross claims reserve (Note 15.4) - - - - Claims outstanding 482,145,051 481,310,252 482,145,051 481,310,252 Claims incurred but not reported (IBNR) - Net 202,878,384 167,474,488 202,878,384 167,474,488
2,229,943,844 1,900,064,983 2,229,943,843 1,900,064,983 3,838,045,291 3,391,079,301 2,229,943,843 1,900,064,983

ANNUAL REPORT - 2018CO-OPERATIVE INSURANCE COMPANY 157
15.1 Long term insurance fundThe movement in the life insurance fund is as follows:
2018 2017 Rs. Rs.
Balance as at 1 January 1,459,287,492 1,210,031,604 Increase in long term insurance fund 111,925,893 249,255,888 Transfer to shareholder fund (1,189,000) - Balance as at 31st December 1,570,024,385 1,459,287,492
The valuation of the long term insurance business as at 31 December 2018 was performed by Mr. M. Poopalanathan of Actuarial and Management Consultants (Private) Limited. In accordance with the Consultant Actuary’s report, the fund for the year amounted to Rs. 1,584 Million (2017 - 1,459 Million). In the opinion of the Appointed Actuary, this is adequate to cover the liabilities pertaining to the life insurance business.
In the opinion of the Appointed actuary, the Company maintains a Capital Adequacy Ratio (CAR) and Total Available Capital (TAC) as at 31st December 2018, as per the Solvency Margin (Risk Based Capital) Rules 2015 requirement prescribed under section 26 (1) of the Regulation of Insurance Industry Act No. 43 of 2000.
15.2 Unearned premium
Group Company2018 2017 2018 2017
Rs. Rs. Rs. Rs.
Balance as at 01 January 1,307,312,789 1,147,152,468 1,307,312,789 1,147,152,468 Transferred to income statement during the year 347,458,112 160,160,321 347,458,112 160,160,321 Balance as at 31st December 1,654,770,901 1,307,312,789 1,654,770,901 1,307,312,789
15.3 Net deferred acquisition cost Deferred acquisition cost
Balance as at 01 January 135,143,936 117,687,865 135,143,936 117,687,865 Transfer during the year 43,079,391 17,456,071 43,079,391 17,456,071 Balance as at 31st December 178,223,327 135,143,936 178,223,327 135,143,936
Deferred reinsurance commission
Balance as at 01 January (79,111,389) (56,360,917) (79,111,389) (56,360,917)Transfer during the year 10,738,555 (22,750,473) 10,738,555 (22,750,473)Balance as at 31st December (68,372,834) (79,111,389) (68,372,834) (79,111,389)
Net deferred acquisition cost 109,850,493 56,032,546 109,850,493 56,032,546

ANNUAL REPORT - 2018CO-OPERATIVE INSURANCE COMPANY158
Notes to the Financial Statements
15.4 Gross claim reserve
Group Company2018 2017 2018 2017
Rs. Rs. Rs. Rs.
Balance at 1 January 481,310,252 437,168,188 481,310,252 437,168,188 Increase/ (decrease) in outstanding claims 834,799 44,142,064 834,799 44,142,064 Balance at 31 December 482,145,051 481,310,252 482,145,051 481,310,252
IBNR/IBNER balance at 1 January 167,474,488 130,890,680 167,474,488 130,890,680 Increase/ (decrease) in IBNR/IBNER 35,403,896 36,583,808 35,403,896 36,583,808 IBNR/IBNER balance at 31 December 202,878,384 167,474,488 202,878,384 167,474,488 Total reserve for gross outstanding claims 685,023,435 648,784,740 685,023,435 648,784,740
15.5 Reconciliation between insurance provision and technical reserve
Company2018 2017
Rs. Rs.
Insurance provision - Non life 2,229,943,844 1,900,064,983 Reinsurance on claims reserves (307,659,765) (235,227,149)
1,922,284,079 1,664,837,834
Significant delays occur in the notification of claims and a substantial measure of experience and judgement is involved in assessing outstanding liabilities, the ultimate cost of which cannot be known with certainty as of the reporting date. The reserves are determined based on the information currently available. However, it is inherent to the nature of the business written that the ultimate liability may vary as a result of subsequent development.
The Incurred But Not Reported (IBNR) and Incurred But Not Enough Reported (IBNER) claims reserve has been actuarially computed by Mr. Sivaraman Kumar for and on behalf of NMG Financial Services Consulting Pte Limited. The valuation is based on internationally accepted actuarial methods and is performed on an annual basis.
The Non life insurance technical reserve of Rs.1,922,284,079 as at 31 December 2018 includes the provision of IBNR claims of Rs.202,878,384 that has been certified by the independent consultants actuaries, NMG Financial Services Consulting Pte Limited.
Liability adequacy testAs per the Liability adequacy test performed by Mr. Sivaraman Kumar for and on behalf of NMG Financial Services Consulting Pte Limited. It was concluded that the liability value is sufficient to meet future benefits and expenses. Hence no provision was made for premium deficiency.
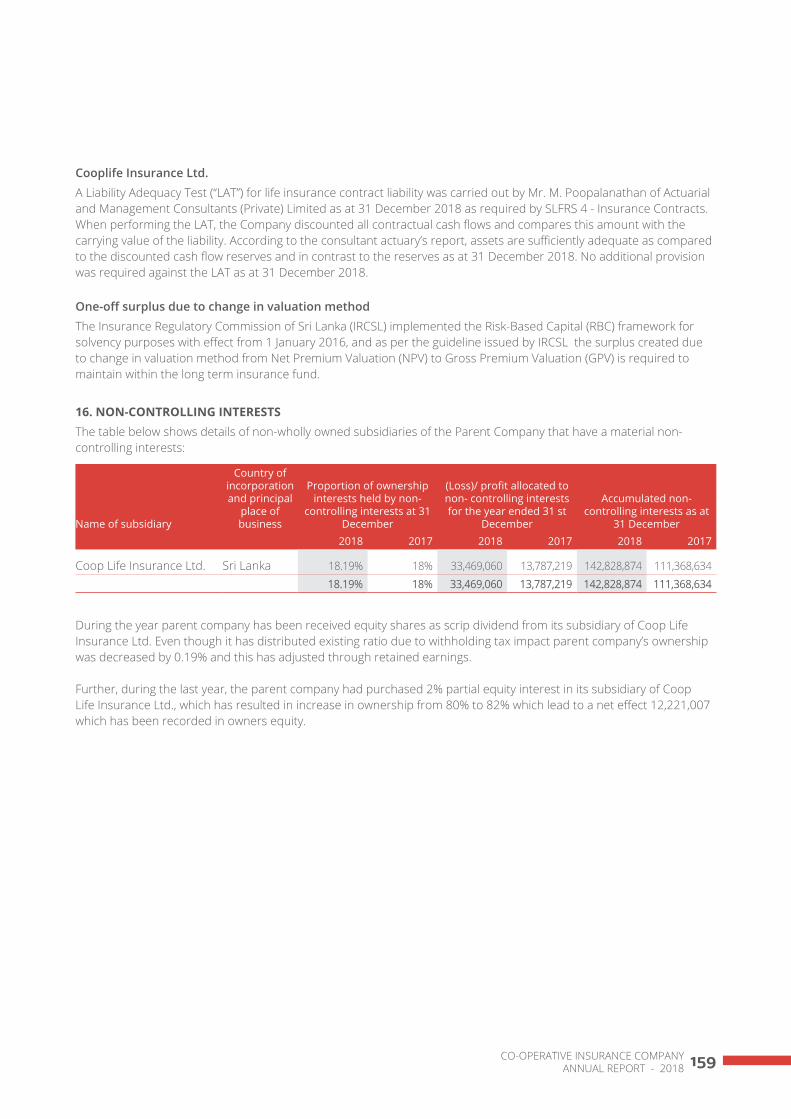
ANNUAL REPORT - 2018CO-OPERATIVE INSURANCE COMPANY 159
Cooplife Insurance Ltd.A Liability Adequacy Test (“LAT”) for life insurance contract liability was carried out by Mr. M. Poopalanathan of Actuarial and Management Consultants (Private) Limited as at 31 December 2018 as required by SLFRS 4 - Insurance Contracts. When performing the LAT, the Company discounted all contractual cash flows and compares this amount with the carrying value of the liability. According to the consultant actuary’s report, assets are sufficiently adequate as compared to the discounted cash flow reserves and in contrast to the reserves as at 31 December 2018. No additional provision was required against the LAT as at 31 December 2018.
One-off surplus due to change in valuation methodThe Insurance Regulatory Commission of Sri Lanka (IRCSL) implemented the Risk-Based Capital (RBC) framework for solvency purposes with effect from 1 January 2016, and as per the guideline issued by IRCSL the surplus created due to change in valuation method from Net Premium Valuation (NPV) to Gross Premium Valuation (GPV) is required to maintain within the long term insurance fund.
16. NON-CONTROLLING INTERESTSThe table below shows details of non-wholly owned subsidiaries of the Parent Company that have a material non-controlling interests:
Name of subsidiary
Country of incorporation and principal
place of business
Proportion of ownership interests held by non-
controlling interests at 31 December
(Loss)/ profit allocated to non- controlling interests for the year ended 31 st
December
Accumulated non-controlling interests as at
31 December2018 2017 2018 2017 2018 2017
Coop Life Insurance Ltd. Sri Lanka 18.19% 18% 33,469,060 13,787,219 142,828,874 111,368,634 18.19% 18% 33,469,060 13,787,219 142,828,874 111,368,634
During the year parent company has been received equity shares as scrip dividend from its subsidiary of Coop Life Insurance Ltd. Even though it has distributed existing ratio due to withholding tax impact parent company’s ownership was decreased by 0.19% and this has adjusted through retained earnings.
Further, during the last year, the parent company had purchased 2% partial equity interest in its subsidiary of Coop Life Insurance Ltd., which has resulted in increase in ownership from 80% to 82% which lead to a net effect 12,221,007 which has been recorded in owners equity.

ANNUAL REPORT - 2018CO-OPERATIVE INSURANCE COMPANY160
Notes to the Financial Statements
17. RETIREMENT BENEFIT OBLIGATIONSAmounts recognised in the statement of financial position are made as follows;:
Group Company2018 2017 2018 2017
Rs. Rs. Rs. Rs.
Provision as at 1 January 51,876,087 45,713,609 37,993,692 32,130,390 Interest cost 5,187,612 3,934,565 3,799,372 2,267,904 Current service cost 7,784,264 7,453,780 5,997,664 5,613,698 Actuarial (gain)/ loss on obligation (5,332,800) (777,116) (4,584,095) 997,237 Payments made during the year (5,285,078) (4,448,751) (2,468,206) (3,015,537)Balance as at 31 December 54,230,085 51,876,087 40,738,427 37,993,692
Expenses on retirement benefit obligation Recognised in profit or lossInterest cost 5,187,612 3,934,565 3,799,372 2,267,904 Current service cost 7,784,264 7,453,780 5,997,664 5,613,698
Recognised in other comprehensive incomeNet actuarial (gain)/ loss on obligation (5,332,800) (777,116) (4,584,095) 997,237
(5,332,800) (777,116) (4,584,095) 997,237
As at 31 December 2018 the gratuity liability was actuarially valued under the Projected Unit Credit (PUC) method by Mr. M. Poopalanathan of Actuarial and Management Consultants (Private) Limited (Consultant and Actuaries) as required by LKAS 19 - Employee Benefits.
The liability is not externally funded. The valuation is performed on an annual basis.
Principal Assumptions as at reporting date
As at 31 December 2018 2017
Discount rate 11% 10%Future salary increase 18% 10%Retirement age (years) 55 55
Assumptions regarding future mortality are based on published statistics and mortality tables.

ANNUAL REPORT - 2018CO-OPERATIVE INSURANCE COMPANY 161
Sensitivity of assumptions used in actuarial valuationThe following table demonstrates the sensitivity to a reasonably possible change in the key assumptions employed with all other variables held constant in the employment benefit liability measurement.
The sensitivity of the statement of profit or loss and other comprehensive income statement of financial position is the effect of the assumed changes in discount rate and salary increment rate on the profit or loss and employment benefit obligation for the year.Group
2018
Effect on charge to the Statement profit or loss and
other comprehensive incomeEffect on employee benefit
obligationIncrease Decrease Increase Decrease
Discount rate (change by 1%) (2,933,005) 3,272,287 (2,933,005) 3,272,287 Salary increment rate (change by 1%) 1,420,062 (1,365,657) 1,420,062 (1,365,657)
2017
Effect on charge to the Statement profit or loss and
other comprehensive incomeEffect on employee benefit
obligationIncrease Decrease Increase Decrease
Discount rate (change by 1%) (2,873,945) 3,211,976 (2,873,945) 3,211,976 Salary increment rate (change by 1%) 3,370,121 (3,068,706) 3,370,121 (3,068,706)
Company
2018
Effect on charge to the Statement profit or loss and other comprehensive income
Effect on employee benefit obligation
Increase Decrease Increase Decrease
Discount rate (change by 1%) (2,430,828) 2,730,499 (2,430,828) 2,730,499 Salary increment rate (change by 1%) 1,185,230 (1,136,318) 1,185,230 (1,136,318)
2017
Effect on charge to the Statement profit or loss and
other comprehensive incomeEffect on employee benefit
obligationIncrease Decrease Increase Decrease
Discount rate (change by 1%) (2,341,379) 2,634,928 (2,341,379) 2,634,928 Salary increment rate (change by 1%) 2,762,118 (2,497,603) 2,762,118 (2,497,603)
18. REINSURANCE CREDITORS
Group Company As at 31 December 2018 2017 2018 2017
Rs. Rs. Rs. Rs.
Local and foreign 302,532,420 216,873,106 291,709,148 196,593,170 302,532,420 216,873,106 291,709,148 196,593,170

ANNUAL REPORT - 2018CO-OPERATIVE INSURANCE COMPANY162
Notes to the Financial Statements
19. OTHER LIABILITIES
Group Company As at 31 December 2018 2017 2018 2017
Rs. Rs. Rs. Rs.
Commission payable 44,615,892 35,335,624 39,484,809 32,463,802 Government levies and taxes payables (Note 19.1) 106,229,385 93,397,544 106,033,097 93,334,921 Dividends - Ordinary 53,649 53,649 53,649 53,649 Accrued expenses 72,658,806 77,776,830 56,811,327 64,398,235 Deposits and other funds 271,300,787 227,374,291 219,845,077 184,142,181
494,858,520 433,937,938 422,227,959 374,392,787
19.1 Government levies and taxes payable
Income tax payable 69,605,793 58,680,117 69,605,793 58,680,117 Value added tax payable 30,651,340 30,123,245 30,651,340 30,123,245 Economic service charge 4,217,306 3,360,634 4,217,306 3,360,634 PAYE payable 161,264 410,548 91,921 347,926 Withholding tax payable 865,559 - 738,614 - Diesel tax payable 728,123 823,000 728,123 823,000
106,229,385 93,397,544 106,033,097 93,334,922
20. DEFERRED TAX ASSET / (LIABILITY)The amount shown in the statement of financial position represents the following:
Group Company As at 31 December 2018 2017 2018 2017
Rs. Rs. Rs. Rs.
Deferred tax comprise of Deferred tax asset-Subsidiary company 130,316,665 - - - Deferred tax liability-Parent company (51,698,297) 30,250,576 (51,698,297) 30,250,576
78,618,368 30,250,576 (51,698,297) 30,250,576
Deferred tax liabilities (107,266,829) (36,921,379) 34,009,649 (1,878,347)Deferred tax assets 185,885,196 67,171,954 (85,707,946) 32,128,923
78,618,368 30,250,576 (51,698,297) 30,250,576
The movement in the deferred tax account is as follows:
Group Company2018 2017 2018 2017
Rs. Rs. Rs. Rs.
As at 1 January 30,250,576 39,207,757 30,250,576 39,207,757 Recognised in profit or loss 114,882,756 7,986,960 (26,520,382) (7,659,081)Recognised in other comprehensive (66,514,966) (16,944,141) (55,428,491) (1,298,100)As at 31 December 78,618,365 30,250,576 (51,698,298) 30,250,576

ANNUAL REPORT - 2018CO-OPERATIVE INSURANCE COMPANY 163
Differed tax assets / liabilities - Group
Assets Liabilities Net As at 31 December 2018 2017 2018 2017 2018 2017
Rs. Rs. Rs. Rs. Property plant and equipment - - (107,266,829) (19,729,373) (107,266,829) (19,729,373)Intangible assets 184,968 (46,059) - - 184,968 (46,059)Reserve for available for sale financial assets 18,499,052 50,206,548 - - 18,499,052 50,206,548 Employee benefits 11,406,759 14,357,764 - - 11,406,759 14,357,764 Carry forward tax loss 151,875,547 - - (17,192,006) 151,875,547 (17,192,006)Provisions 3,918,870 2,653,701 - - 3,918,870 2,653,701 Net tax assets (liabilities) 185,885,196 67,171,954 (107,266,829) (36,921,379) 78,618,368 30,250,576
Movement in deferred tax balances during the year - Group
Balance as at 1 January
2017Recognised
in P/LRecognised
in OCI
Balance as at December 31
2017
Balance as at 1 January
2018Recognised
in P/LRecognised
in OCI
Balance as at December 31
2018Property plant and equipment (19,253,865) (9,101,772) 1,893,662 (26,461,975) (26,461,975) (20,238,029) (60,566,827) (107,266,829)Intangible assets 914,331 (960,390) - (46,059) (46,059) 231,027 - 184,968 Available for sale financial assets 39,693,527 - (17,305,928) 22,387,599 22,387,599 - (3,888,547) 18,499,052 Employee benefits 12,799,809 3,257,368 (1,531,874) 14,525,303 14,525,303 (1,058,952) (2,059,592) 11,406,759 Carry forward tax loss - 17,192,006 - 17,192,006 17,192,006 134,683,541 - 151,875,547 Provisions 5,053,953 (2,400,252) - 2,653,701 2,653,701 1,265,169 - 3,918,870
39,207,756 7,986,960 (16,944,141) 30,250,575 30,250,575 114,882,756 (66,514,966) 78,618,367
Deferred tax assets / liabilities - Company
Assets Liabilities Net2018 2017 2018 2017 2018 2017
Rs. Rs. Rs. Rs. Rs. Rs. Property plant and equipment - - (85,707,946) (1,878,347) (85,707,946) (1,878,347)Intangible assets 184,968 (46,059) - - 184,968 (46,059)Available for sale financial assets 18,499,052 18,883,047 - - 18,499,052 18,883,047 Employee benefits 11,406,759 10,638,233 - - 11,406,759 10,638,233 Provisions 3,918,870 2,653,701 - - 3,918,870 2,653,701 Net tax assets (liabilities) 34,009,649 32,128,922 (85,707,946) (1,878,347) (51,698,298) 30,250,575
Movements in deferred tax balances during the year - Company
Balance as at 1 January
2017Recognised
in P/LRecognised
in OCI
Balance as at December 31
2017
Balance as at 1 January
2018Recognised
in P/LRecognised
in OCI
Balance as at December 31
2018Property plant and equipment 1,963,462 (6,975,218) 3,133,409 (1,878,347) (1,878,347) (30,347,876) (53,481,723) (85,707,946)Intangible assets 914,331 (960,390) - (46,059) (46,059) 231,027 - 184,968 Available for sale of financial assets 22,279,501 - (3,396,454) 18,883,047 18,883,047 - (383,995) 18,499,052 Employee benefits 8,996,509 2,676,780 (1,035,055) 10,638,233 10,638,233 2,331,298 (1,562,773) 11,406,759 Provisions 5,053,953 (2,400,252) - 2,653,701 2,653,701 1,265,169 - 3,918,870
39,207,756 (7,659,081) (1,298,100) 30,250,575 30,250,575 (26,520,382) (55,428,491) (51,698,298)

ANNUAL REPORT - 2018CO-OPERATIVE INSURANCE COMPANY164
21. GROSS WRITTEN PREMIUM
Group Company For the year ended 31 December 2018 2017 2018 2017
Rs. Rs. Rs. Rs.
Life insurance 619,881,069 625,573,542 - - Non life insurance
Motor 3,254,307,502 2,679,565,294 3,254,676,122 2,680,389,734 Fire 120,612,097 114,123,380 121,113,473 115,244,016 Marine 7,790,680 4,485,193 7,790,680 4,485,193 Miscellaneous 365,725,537 254,052,936 367,258,182 255,716,721
4,368,316,886 3,677,800,345 3,750,838,457 3,055,835,664
22. PREMIUM CEDED TO REINSURERS
Group Company For the year ended 31 December 2018 2017 2018 2017
Rs. Rs. Rs. Rs.
Life insurance 45,833,169 39,927,811 Non life insurance
Motor 303,374,550 277,157,406 303,374,550 277,157,406 Fire 75,816,077 62,021,163 75,816,077 62,021,163 Marine 2,463,399 3,192,735 2,463,399 3,192,735 Miscellaneous 119,142,608 112,828,133 119,142,608 112,828,133
Riot and strike premium
Motor 28,063,252 49,539,656 28,063,252 49,539,656 Fire 26,937,372 26,088,791 26,937,372 26,088,791 Marine 87,135 6,029,108 87,135 6,029,108 Miscellaneous 3,055,886 7,498,209 3,055,886 7,498,209
604,773,448 584,283,012 558,940,279 544,355,201
23. NET CHANGE IN RESERVES FOR UNEARNED PREMIUM
Group Company For the year ended 31 December 2018 2017 2018 2017
Rs. Rs. Rs. Rs.
Unearned premiumMotor 251,939,865 154,614,775 251,939,865 154,614,775 Fire 1,259,094 2,003,920 1,259,094 2,003,920 Marine 3,990,718 (1,935,591) 3,990,718 (1,935,591)Miscellaneous 90,268,435 5,477,217 90,268,435 5,477,217
347,458,112 160,160,321 347,458,112 160,160,321
Notes to the Financial Statements

ANNUAL REPORT - 2018CO-OPERATIVE INSURANCE COMPANY 165
24. INVESTMENT INCOME
Group Company For the year ended 31 December 2018 2017 2018 2017
Rs. Rs. Rs. Rs.
Available-for-sale Treasury bonds 39,483,294 34,894,558 - - Debentures 42,353,695 47,462,039 - - Dividend income 422,061 1,385,637 422,061 1,385,637
Held to maturityTreasury bonds 71,305,204 45,339,789 41,071,166 45,339,789 Debentures 91,649,899 82,338,424 91,649,899 82,338,424
Loans and receivablesFixed deposits 186,988,391 121,648,366 120,891,697 82,581,235 Repo 12,534,810 5,336,898 1,410,182 3,665,721 Overnight deposit 2,846,321 2,873,082 2,721,366 2,834,949 Commercial papers 58,377,419 84,791,908 50,149,089 41,450,534 Money market 1,117,588 1,550,336 - -
Fair value through profit or lossQuoted shares - dividend 7,151 24,394 - -
Dividend from subsidiary - - 35,260,000 - Interest income on
Savings deposits 122,976 187,976 122,976 187,976 Policy loans 2,230,401 1,966,693 - - Staff loans 2,628,741 2,529,192 1,858,226 1,868,607
Total Finance income 512,067,951 432,329,293 345,556,662 261,652,872 Interest on lease agreements 1,421,362 3,762,299 986,035 2,983,636 Total Finance cost 1,421,362 3,762,299 986,035 2,983,636 Net finance income 510,646,589 428,566,994 344,570,627 258,669,236
24.1 Notional tax credit for withholding tax on treasury bills and bondsAccording to section 137 of the Inland Revenue Act No. 10 of 2006, a company which derives interest income from secondary market transactions in Government securities is entitled to a notional tax credit (being the one fourth of the net interest income) provided such interest income forms a part of the statutory income of the company for that year of assessment.
Accordingly, net interest income earned from secondary market transactions in Government securities for first quarter of the year by the Company has been grossed up in the financial statements and resulting notional tax credit amounted to Rs.1,199,714 (6,074,565 - 2017) for the year ended 31st December 2018.

ANNUAL REPORT - 2018CO-OPERATIVE INSURANCE COMPANY166
Notes to the Financial Statements
25. UNREALISED CHANGES IN FINANCIAL INSTRUMENTS
Group Company For the year ended 31 December 2018 2017 2018 2017
Rs. Rs. Rs. Rs.
Financial investments at fair value through profit or lossQuoted shares (251,200) (199,920) - -
(251,200) (199,920) - -
26. POLICY ADMINISTRATION FEES
Group Company For the year ended 31 December 2018 2017 2018 2017
Rs. Rs. Rs. Rs.
Motor 154,378,579 116,906,820 154,378,579 116,906,820 Fire 1,302,260 1,077,965 1,302,260 1,077,965 Marine 248,423 103,781 248,423 103,781 Miscellaneous 5,606,186 4,984,771 5,606,186 4,984,771
161,535,448 123,073,337 161,535,448 123,073,337
27. OTHER INCOME
Group Company For the year ended 31 December 2018 2017 2018 2017
Rs. Rs. Rs. Rs.
Gain on foreign currency transaction 263,750 91,167 263,750 91,167 Gain on sale of property, plant and equipment (171,511) 472,084 (171,511) 472,084 Miscellaneous income (Note 27.1) 25,638,029 20,733,406 25,062,098 21,467,483
25,730,268 21,296,657 25,154,337 22,030,734
27.1 Miscellaneous income
Group Company For the year ended 31 December 2018 2017 2018 2017
Rs. Rs. Rs. Rs.
Other income 4,188,737 2,016,888 4,135,004 3,606,888 Sundry income 1,291,223 855,923 769,025 - Policy fee charges 731,273 809,100 731,273 809,100 Unidentified receipts written back 16,707,971 15,563,162 16,707,971 15,563,162 Profit commission 1,129,130 - 1,129,130 - Non refundable tender fees 1,589,695 1,488,332 1,589,695 1,488,332
25,638,029 20,733,406 25,062,098 21,467,483

ANNUAL REPORT - 2018CO-OPERATIVE INSURANCE COMPANY 167
28. GROSS BENEFITS AND CLAIMS INCURRED
Group Company For the year ended 31 December 2018 2017 2018 2017
Rs. Rs. Rs. Rs.
Life insurance contractsDeath, disability and hospitalisation 33,793,872 37,377,001 - - Policy surrenders 41,379,052 38,022,942 - - Pension benefits 2,739,406 1,883,036 - - Policy maturity 135,703,811 38,456,296 - - Survival benefits 8,812,746 5,833,981 - -
222,428,887 121,573,256 - -
Non life insurance contractsMotor 2,123,344,558 1,709,897,033 2,123,344,558 1,709,897,033 Fire 23,703,632 119,908,383 23,703,632 119,908,383 Marine 6,517,802 211,214 6,517,802 211,214 Miscellaneous 167,415,530 82,118,652 167,415,530 82,118,652
2,320,981,523 1,912,135,282 2,320,981,522 1,912,135,282 Less: Salvage income (139,085,679) (81,397,324) (139,085,679) (81,397,324)
Movement in salvage stock - - - - 2,181,895,844 1,830,737,958 2,181,895,843 1,830,737,958 2,404,324,730 1,952,311,214 2,181,895,843 1,830,737,958
29. UNDERWRITING AND POLICY ACQUISITION COST
Group Company For the year ended 31 December 2018 2017 2018 2017
Rs. Rs. Rs. Rs.
Net underwriting and policy acquisition cost 458,158,219 329,417,718 353,386,235 239,413,802 Increase/ (decrease) in deferred acquisition cost (53,817,947) 5,294,402 (53,817,947) 5,294,402 Reinsurance commission (165,388,408) (164,102,000) (158,955,409) (151,207,731)
238,951,866 170,610,120 140,612,881 93,500,473
30. OTHER OPERATING AND ADMINISTRATIVE EXPENSES
Group Company For the year ended 31 December 2018 2017 2018 2017
Rs. Rs. Rs. Rs.
Staff expenses (Note 30.1) 519,688,873 428,169,138 385,354,573 305,966,142 Administrative and establishment expenses 363,123,476 289,923,557 275,031,317 215,862,387 Selling expenses 195,647,601 193,271,422 149,008,875 132,444,956 Depreciation 122,536,063 99,446,282 91,647,524 77,202,129 Amortisation of intangible assets 2,227,435 2,159,070 1,401,573 2,159,070 Reversal of impairment on motor vehicle (19,354) (322,651) - - Impairment on motor vehicle 175,680 104,310 - - Notional tax write off 14,531,528 - - -
1,217,911,302 1,012,751,129 902,443,863 733,634,684

ANNUAL REPORT - 2018CO-OPERATIVE INSURANCE COMPANY168
Notes to the Financial Statements
30.1 Staff expenses
Group Company For the year ended 31 December 2018 2017 2018 2017
Rs. Rs. Rs. Rs.
Salaries and wages 405,532,046 328,832,162 294,995,024 230,265,754 Contributions to defined contribution plans 54,363,864 43,232,608 40,650,600 30,964,036 Contributions to defined benefit plans 12,884,825 11,388,345 9,709,985 7,881,602 Contribution for staff group term assurance 2,254,800 633,917 1,758,450 1,532,367 Staff welfare 8,734,876 6,568,608 6,176,710 4,431,294 Staff bonus 18,413,893 22,044,975 18,413,893 19,244,975 Staff training and development 4,431,781 5,061,428 2,849,628 3,885,859 Other staff expenses 13,072,788 10,407,095 10,800,284 7,760,254
519,688,873 428,169,138 385,354,573 305,966,142
31. PROFIT BEFORE INCOME TAXThe profit from operations for the year is stated after charging the following expenses.
Group Company For the year ended 31 December 2018 2017 2018 2017
Rs. Rs. Rs. Rs.
Directors remuneration 22,724,336 15,899,391 15,280,250 14,452,250 Directors medical insurance 133,617.44 133,617 133,617 133,617 Auditor's remuneration 2,531,600 1,767,210 1,335,180 1,257,210 Impairment loss on premium receivable 13,995,964 11,798,044 13,995,964 8,176,157 Depreciation 122,536,063 121,690,436 91,647,523 77,202,129 Amortisation of intangible assets 2,227,435 2,333,661 1,401,573 2,088,916
32. INCOME TAX EXPENSES
Group CompanyFor the year ended 31 December 2018 2017 2018 2017
Rs. Rs. Rs. Rs.
Current tax expense Current year 106,857,705 91,209,275 105,714,714 90,018,746 (Over)/under provision for the last year 5,387,179 - 5,387,179 - Withholding tax on dividend 5,740,000 - - -
117,984,884 91,209,275 111,101,893 90,018,746
Deferred tax expenseOrigination/(reversal) of deferred tax assets (135,120,784) (18,049,122) (3,827,494) (276,528)Origination/(reversal) of deferred tax liabilities 20,238,028 10,062,162 30,347,876 7,935,608
(114,882,756) (7,986,960) 26,520,382 7,659,081 Income tax expense 3,102,128 83,222,314 137,622,275 97,677,827

ANNUAL REPORT - 2018CO-OPERATIVE INSURANCE COMPANY 169
32.1 Reconciliation of accounting profit and taxable income
Group Company For the year ended 31 December 2018 2017 2018 2017
Rs. Rs. Rs. Rs.
Profit for the year 411,645,940 370,768,584 268,154,147 301,433,568 Current tax expense 117,984,885 91,209,275 111,101,893 90,018,746 Origination/(reversal) of deferred tax assets (135,120,784) (18,049,122) (3,827,494) (276,528)Origination/(reversal) of deferred tax liabilities 20,238,028 10,062,162 30,347,876 7,935,608 Profit before tax 414,748,069 453,990,898 405,776,422 399,111,395
At the statutory income tax rate of 28% (2017-28%) 116,129,459 127,117,452 113,617,398 111,751,192 Less: Exempted interest income (8,790,851) (41,671,568) (5,599,017) (23,054,759)Less: Surplus transferred from long term insurance fund (332,920) - - - Add: Disallowable expenses 33,299,053 36,987,298 31,070,952 26,634,294 Less: Allowable expenses (9,684,086) (30,703,745) (17,784,625) (24,791,819)Less: Profit from life insurance (8,172,956) (42,474,216) - - Less: Other income considered separately (97,378,553) (51,007,548) (96,235,562) (49,817,019)Business income 25,069,146 (1,752,327) 25,069,146 40,721,889 Other sources of income 81,788,559 50,487,386 80,645,568 49,296,857 Assessable income 106,857,705 48,735,059 105,714,714 90,018,746 Less: DeductionsTax loss/gain on long term insurance - 42,474,216 - - Total current tax 106,857,705 91,209,275 105,714,714 90,018,746
33. EARNINGS PER SHAREBasic earning per shareThe basic earnings per share is based on net profit attributable to ordinary shareholders for the year divided by the weighted average number of ordinary shares outstanding for the year and is calculated as follows;
Group Company For the year ended 31 December 2018 2017 2018 2017
Rs. Rs. Rs. Rs.
Profit attributable to ordinary shareholders (Rs.) 378,176,880 356,981,365 268,154,147 301,433,568 Weighted average number of ordinary shares in issue applicable to basic earnings per share (Nos.) 129,075,485 129,075,485 129,075,485 129,075,485 Earnings per share (Rs.) 2.93 2.77 2.08 2.34
33.1 Weighted average number of ordinary shares
Group Company2018 2017 2018 2017
Rs. Rs. Rs. Rs.
No. of shares held as at 1 January 126,025,177 126,025,177 126,025,177 126,025,177 Add: Weighted average number of shares issued due to scrip dividend 2018 3,050,308 3,050,308 3,050,308 3,050,308 No. of shares held as at 31 December 129,075,485 129,075,485 129,075,485 129,075,485

ANNUAL REPORT - 2018CO-OPERATIVE INSURANCE COMPANY170
Notes to the Financial Statements
34. RELATED PARTY TRANSACTIONS
34.1 Transactions with key management personnelThe board of directors of the Company have the authority and responsibility of planning, directing and controlling the activities of the Company. Accordingly, the Board of directors of the Company have been identified as the key management personnel. (“KMP”) of the Company.
The emoluments paid to the KMP of the Company are disclosed as follows;
For the year ended 31 December 2018 2017 Rs. Rs.
Short term employee benefits 15,039,973 15,037,064
Post employment benefits accrued are not included above as it cannot be identified separately due to the actuarial valuation.
Loans given to DirectorsCompany has not given any loans for the Directors of the Company during the year ended 31 December 2018.
Loans obtained from DirectorsCompany has not obtained any loans from the Directors of the Company during the year ended 31 December 2018.
34.2 Directors and their directorships in other entities are listed below as the societies represented by the directors on the Board are considered as related parties.
Director Company Relationship
Mr. W. Lalith A. Peiris Wennappuwa MPCS Ltd. Chairman National Co-operative Council Of Sri Lanka Chairman Chilaw District Co-operative Council Chairman Co-op life Insurance Company Ltd Chairman Sri Lanka Co-operative Rural Bank Federation Director National Institute of Co-operative Development - Polgolla Director Co-operative Insurance Training Academy Director
Mr. K.R.W Ranasinghe Sirioya Hydro Power (Pvt) Ltd Director Prime Engineering lanka (Pvt) Ltd Director Co-op life Insurance Company Ltd Managing Director Co-operative Insurance Training Academy Director
Mr. K.J. Sesiri Beralapanatara MPCS Chairman Matara Dist. Co-operative Rural Bank Union Director Matara Dist.Co-operative Council Vice Chairman Matara Dist. Tea Producers Co-operative Society Union Vice Chairman Co-op life Insurance Company Ltd Director
Mr. R.G.K. Rankothge Pujapitiya MPCS Chairman Sri Lanka Marketing Federation Chairman
Mr. K.R.K.N. Jayasinghe Post & Telecom Employees Co-op Bank Society Ltd Chairman

ANNUAL REPORT - 2018CO-OPERATIVE INSURANCE COMPANY 171
Director Company Relationship
Mr. C.P. Jayasinghe Dambadeniya MPCS Ltd Chairman Wayaba Co-operative Consumer Society LTD Vice Chairman Wayaba Co-operative Rural Bank union LTD Chairman Kurunegala District Co-operative Board Director Co -operative Leasing Company Ltd Vice Chairman Sri lanka Co-operative Rural bank Federation limited Director
Mr. A.D.T.S. Palitha TSP Associates Partner
Mr. J.M.V.P. Jayasooriya Galigamuwa MPCS Chairman Kegalle Dist. Co-operative Rural Bank Union Ltd Director District Cooperative Council of Kegalle Director Lanka Electricity Company Ltd Director
Mr. R.M.B.M. Bandara Polonnaruwa Dist. Co-operartive Rural ank Union Ltd. Chairman Polonnaruwa Dist. Co-operative Council Director
K Susil Shantha Weerasekara Weligama MPCS LTD Chairman Matara District co-operative Council Director CAPRO Coop Southern LTD Chairman Matara District Tea Producers co-operative Society LTD Chairman Sri lanka national Co-operative Council Vice Chairman
D L Samarawikrama Jayawardhanpura MPCS ChairmanColombo District Rural Bank Federation DirectorColombo South Co-operative Society Ltd DirectorPublic Service Co-operative Credit & Thrift Society Ltd TreasurerPublic Service Cooperative Credit & Thrift Society Ltd TreasurerCo-op life Insurance Company Ltd Director
34.3 Transactions and balances with related partiesThe Multi-Purpose Co-operative Societies represented on the Board are considered as related parties due to the joint shareholdings and representation on the Board. Related party balances and transactions are listed bellow;
Entity Nature of Transaction Transaction Amount Paid/(Received) Balance as at 31 December
2018 2017 2018 2017 Rs. Rs. Rs. Rs.
Coop Life Insurance Ltd. Equity investment 35,260,000 - 445,260,040 410,000,040 Receiver for shared service expenses (28,820,657) (27,483,911) 10,757,248 7,956,943 Insurance premiums (708,342) (3,608,861) - - Life GTA 2,930,750 2,331,250 - - Vehicle rent (3,305,350) (3,030,000) - - Building rent 2,760,437 2,811,888 - - Water and electricity 445,153 - - Claims 60,705 - - - Salary Deduction 1,430,240 1,540,081 - - Others 800,770 - - -

ANNUAL REPORT - 2018CO-OPERATIVE INSURANCE COMPANY172
Notes to the Financial Statements
Entity Nature of Transaction Transaction Amount Paid/(Received) Balance as at 31 December
2018 2017 2018 2017 Rs. Rs. Rs. Rs.
Co-operative Insurance Training Academy
Equity investment 10 - 10 -
Payments reimbursement 593,315 - 554,831 -
MPCS Wennappuwa Office rent 1,022,450 943,800 - - Fuel - 3,800 - - Others - 31,300 - - Commission 273,083 350,316 - - Claims 256,723 170,322 - -
National Co-operative Council of Sri Lanka
Sales promotions - 45,000 - -
Transport charges 40,700 - - - Others - 9,384 - - Rent advance - - - 483,819
Sri Lanka Co-operative Marketing
Fuel 474,839 624,696 - -
Federation Transport 104,620 1,005,790 - -Claims 45,080 56,123 - -Others 12,870 798,692 - -
Sri Lanka Co-operative Rural Bank Federation
Sales promotion - 16,667 - -
Refunds and other - 25,000 - - Vehicle rental/Card machine rent 7,636,465 1,786,155 - - Dividends - 2,886,000 - - Claims 78,225 7,300 - - Lease payments - 9,142,843 - -
Dambadeniya MPCS Ltd. Commission 213,206 19,967 - - Incentive - 194,798 - - Claims 9,840 72,771 - -
Post & Telecom Employees Co-op Bank Society Ltd.
Commission & Incentive 3,118 26,270 - -
Claims 33,000 - - Advertisement 30,000 25,000 - -
Beralapanatara MPCS Claims 41,530 1,415,854 - - Commission - 331,889 - - Commission incentive 306,605 - - -
Matara Dist. Tea Producers Co-operative Society Union
Claims 33,606 128,375 - -
Weligama MPCS Claims 54,470 31,055 - -

ANNUAL REPORT - 2018CO-OPERATIVE INSURANCE COMPANY 173
35. CONTINGENCIESThere were no material contingent liabilities outstanding as at the date of reporting.
36. EVENTS OCCURRING AFTER THE REPORTING DATEThere were no material events that occurred after the reporting date that required adjustment to or disclosure in the financial statements.
37. FINANCIAL RISK MANAGEMENTPrimary objective of the company’s business and financial risk management frame work is to protect the company’s shareholders from events that could hinder the delivery of financial objectives. The risk management process comprises the identification and evaluation of existing and potential risks associated with the company’s operations and strategy, followed by appropriate management responses such as tolerance, mitigation, transfer, avoidance, termination or a combination of such responses. It is of paramount importance that the management identify the uncertainties that hinder achievement of financial objectives of the company and implement effective mitigating strategies to safeguard the financial expectations of the stakeholders.
Entity Nature of Transaction Transaction Amount Paid/(Received) Balance as at 31 December
2018 2017 2018 2017 Rs. Rs. Rs. Rs.
Galigamuwa MPCS Dividends - - - - Claims 138,151 19,250 - - Commission - 35,139 - -Commission incentive - 30,855 - -Others 50,000 - - -
Co-operative Leasing Company Ltd
Commission 1,560,840 - - -
Polonnaruwa Dist. Co operative Rural Bank Union
Commission 98,684 97,190 - - Salary deductions 104,400 104,400 - - Sales promotion 25,000 - - - Claims 384,210 181,355 - - Others 6,000 - - -
Prime Engineering Claims - 277,052 - -
Lanka Electricity Company Ltd
Claims - 1,967,515 - -
Wayamba Co operative Rural Bank Union
Sales promotion 197,000 - - -
Claims 107,693 - - - Commission 220,944 - - -

ANNUAL REPORT - 2018CO-OPERATIVE INSURANCE COMPANY174
Notes to the Financial Statements
Financial Instruments – Fair values and risk management
A. Accounting classification and fair valuesThe following table shows the carrying amounts and fair values of financial assets and financial liabilities, including their levels in the fair value hierarchy. It does not include fair value information for financial assets and financial liabilities not measured at fair value if the carrying amount is reasonable approximation of fair value.
Group 31 December 2018
Note FVTPLHeld to
Maturity
Loans & Receivables and other Financial
assetsAvailable for Sale
Other Financial Liabilities Total Level 1 Level 2 Level 3 Total
Rs.000 Rs.000 Rs.000 Rs.000 Rs.000 Rs.000 Rs.000 Rs.000 Rs.000 Rs.000
Financial assets measured at fair value/amortised cost
Treasury bonds6.1 (a) & 6.3 (a) - 797,258 - 375,531 - 1,172,789 375,531 - - 375,531
Unquoted equity instrument 6.3 - - - 5,824 - 5,824 - - 5,824 5,824 Quoted equity instrument 6.4 731 - - 9,956 10,687 10,687 - - 10,687
Quoted debentures6.1 (b) & 6.3 (b) - 785,163 - 324,826 - 1,109,988 324,826 - - 324,826
Financial assets not measured at fair value Fixed deposits 6.2 - - 1,779,693 - - 1,779,693 - - - - Investments in Repo 6.2 - - 342,133 - - 342,133 - - - - Commercial papers 6.2 - - 443,240 - - 443,240 - - - - Reinsurance receivable 9 - - 340,059 - - 340,059 - - - 340,059 Premium receivable 10 - - 758,588 - - 758,588 - - - - Cash and cash equivalents 12 - - 140,831 - - 140,831 - - - 140,831 Total Assets 731 1,582,421 3,045,955 716,136 - 5,345,244 711,044 - 5,824 1,197,757
Financial liabilities not measured at fair value Financial lease 14 - - - - 3,051 3,051 - - - Re-insurance creditors 18 - - - - 302,532 302,532 - - - Bank overdrafts 12 - - - - 94,508 94,508 - - - Total Liabilities - - - - 400,092 400,092 - - -

ANNUAL REPORT - 2018CO-OPERATIVE INSURANCE COMPANY 175
Group 31 December 2017
Note FVTPLHeld to
Maturity
Loans & Receivables and other Financial
assetsAvailable for Sale
Other Financial Liabilities Total Level 1 Level 2 Level 3 Total
Rs.000 Rs.000 Rs.000 Rs.000 Rs.000 Rs.000 Rs.000 Rs.000 Rs.000 Rs.000
Financial assets measured at fair value/ amortised cost
Treasury bonds6.1 (a) & 6.3 (a) - 425,471 - 445,867 - 871,338 445,867 - - 445,867
Unquoted equity instrument 6.3 - - - 5,110 - 5,110 - - 5,110 5,110 Quoted equity instrument 6.4 922 - - 10,384 - 11,306 11,306 - - 11,306 Quoted debentures 6.3(b) - - - 411,516 - 411,516 - 411,516 - 411,516
Financial assets not measured at fair valueFixed deposit 6.2 - - 1,483,128 - - 1,483,128 - - - - Quoted debentures 6.3 - 641,614 - - 641,614 - - - - Investments in repo 6.2 - - 608,471 - - 608,471 - - - - Commercial papers 6.2 - - 142,593 - - 142,593 - - - - Reinsurance receivable 9 - - 256,107 - - 256,107 - - - - Premium receivable 10 - - 602,794 - - 602,794 - - - - Cash and cash equivalents 12 - - 138,643 - - 138,643 - - - - Total Assets 922 1,067,085 3,231,736 872,877 - 5,172,620 457,173 411,516 4,940 873,799
Financial liabilities not measured at fair valueFinancial lease 14 - - - - 11,586 11,586 - - - - Reinsurance creditors 18 - - - - 216,873 216,873 - - - - Bank overdrafts 12 - - - - 69,968 69,968 - - - - Total Liabilities - - - - 298,427 298,427 - - - -
Company 31 December 2018
Note FVTPLHeld to
Maturity
Loans & Receivables and other Financial
assetsAvailable for Sale
Other Financial Liabilities Total Level 1 Level 2 Level 3 Total
Rs.000 Rs.000 Rs.000 Rs.000 Rs.000 Rs.000 Rs.000 Rs.000 Rs.000 Rs.000
Financial assets measured at fair value Treasury bonds 6.1 (a) - 427,730 - - 427,730 - - - - Unquoted equity instrument 6.3 - - - 5,824 - 5,824 - - 5,824 5,824 Quoted equity instrument 6.3 - - - 9,956 - 9,956 9,956 - - 9,956 Quoted debentures 6.1(b) - 785,163 - - 785,163 - - - -
Financial assets not measured at fair value Fixed deposit 6.2 - - 1,151,321 - 1,151,321 - - - - Investments in repo 6.2 - - 250,747 - 250,747 - - - - Commercial papers 6.2 - - 256,835 - 256,835 - - - - Reinsurance receivable 9 - - 331,972 - 331,972 - - - - Premium receivable 10 - - 750,717 - 750,717 - - - - Cash and cash equivalents 12 - - 120,709 - 120,709 - - - - Total Assets - 1,212,893 2,862,301 15,780 - 4,090,974 9,956 - 5,824 15,780

ANNUAL REPORT - 2018CO-OPERATIVE INSURANCE COMPANY176
Notes to the Financial Statements
As at 31 December
Company 31 December 2018
Note FVTPLHeld to
Maturity
Loans & Receivables and other Financial
assetsAvailable for Sale
Other Financial Liabilities Total Level 1 Level 2 Level 3 Total
Rs.000 Rs.000 Rs.000 Rs.000 Rs.000 Rs.000 Rs.000 Rs.000 Rs.000 Rs.000
Financial liabilities not measured at fair valueFinancial lease 14 - - - - 1,764 1,764 - - - - Reinsurance creditors 18 - - - - 291,709 291,709 - - - -
Bank overdrafts 12 - - - - 94,508 94,508 - - - - Total Liabilities 387,981 387,981 - - - -
Company 31 December 2017
Note FVTPLHeld to
Maturity
Loans & Receivables and other Financial
assetsAvailable for Sale
Other Financial Liabilities Total Level 1 Level 2 Level 3 Total
Rs.000 Rs.000 Rs.000 Rs.000 Rs.000 Rs.000 Rs.000 Rs.000 Rs.000 Rs.000
Financial assets measured at fair value Treasury bonds 6.1 (a) - 425,471 - - 425,471 - - - - Unquoted equity instrument 6.3 - - - 5,110 - 5,110 - - 5,110 5,110 Quoted equity instrument 6.3 - - - 10,384 - 10,384 10,384 - - 10,384
Financial assets not measured at fair value Quoted debentures 6.1 (b) - 641,614 - - - 641,614 - - - - Fixed deposits 6.2 - - 879,751 - - 879,751 - - - - Investments in repo 6.2 - - 319,632 - - 319,632 - - - - Commercial papers 6.2 - - 83,990 - - 83,990 - - - - Reinsurance receivable 9 - - 245,140 - - 245,140 - - - - Premium receivable 10 - - 594,509 - - 594,509 - - - - Cash and cash equivalents 12 - - 114,938 - - 114,938 - - - - Total Assets - 1,067,085 2,237,960 15,494 - 3,320,539 10,384 - 5,110 15,494
Financial liabilities not measured at fair valueFinancial lease 14 - - - - 8,414 8,414 - - - -Reinsurance creditors 18 - - - - 196,593 196,593 - - - -Bank overdrafts 12 - - - - 69,968 69,968 - - - -Total Liabilities - - - - 274,975 274,975 - - - -

ANNUAL REPORT - 2018CO-OPERATIVE INSURANCE COMPANY 177
B. Measurement of Fair Value
i. Valuation techniques and significant unobservable inputs
The following tables show the valuation techniques used in measuring Level 2 and Level 3 fair values, as well as the significant unobservable inputs used.
Financial Instruments measured at fair value
Type Valuation technique Significant unobservable inputs Inter-relationship between significant
Equity instruments- Unquoted Net Assets based valuation
Net Assets Value and Number of Share Outstanding Positive
DebenturesFuture Cash Flow based
valuation Discounting Factor Negative
ii. Level 3 fair values
Reconciliation of Level 3 fair value
The following table shows a reconciliation from the opening balances to the closing balances for Level 3 fair values.
Group/CompanyAvailable for
sale financial assets
Balance as at 1st January 2017 4,940,411 Total gains or losses recognised in OCI 169,132 Closing balance as at 31st December 5,109,542 Balance as at 1st January 2018 5,109,542 Total gains or losses recognised in OCI 714,034 Closing balance as at 31st December 5,823,576
37.1 Financial risk management
Introduction and overviewEffective risk management is very important for an organisation to identify, measure, mitigate and manage the various types of risk falling within group and industry. CICL group recognises the importance of sound risk management in every aspect of our business and to our stakeholders.
For Regulators
Comply with regulatory requirements and build-up public trust on industry
Ensure that the company will always be with their customers
Consistently maximise returns to shareholders through a strong financial performance
For Policy Holders
Sound Risk Management
For Shareholders

ANNUAL REPORT - 2018CO-OPERATIVE INSURANCE COMPANY178
Notes to the Financial Statements
37.1.1 Risk and Capital Management
(A) Governance Framework
The Company’s board of directors has overall responsibility for the establishment and oversight of the Group’s risk management framework. The board of directors has established the risk management committee, which is responsible for developing and monitoring the Group’s risk management policies. The committee reports regularly to the board of directors on its activities.
The Group’s risk management policies are established to identify and analyse the risks faced by the Group, to set appropriate risk limits and controls and to monitor risks and adherence to limits. Risk management policies and systems are reviewed regularly to reflect changes in market conditions and the Group’s activities. The Group, through its training and management standards and procedures, aims to maintain a disciplined and constructive control environment in which all employees understand their roles and obligations.
The Group audit committee oversees how management monitors compliance with the Group’s risk management policies and procedures, and reviews the adequacy of the risk management framework in relation to the risks faced by the Group. The Group audit committee is assisted in its oversight role by internal audit. Internal audit undertakes both regular and ad hoc reviews of risk management controls and procedures, the results of which are reported to the audit committee.
(B) Regulatory framework
Insurance regulatory commission of Sri Lanka, (IRCSL) safeguards the policy holders through the supervisory control of insurance companies in Sri Lanka. The Group operates according to the regulatory requirements set out by the IRCSL. The Group successfully implemented the Risk Based Capital (RBC) framework on solvency margin as required by IRCSL. The capital positions of the Group’s operating companies as of 31st December 2018 and 2017 are as follows.
31st December 2018 31st December 2017Total
AvailableCapital
(TAC)
MinimumCapital
Requirement
Risk-basedCapital
AdequacyRatio (CAR)
RegulatoryMinimum
CAR
TotalAvailable
Capital(TAC)
MinimumCapital
Requirement
Risk-basedCapital
AdequacyRatio (CAR)
RegulatoryMinimum
CAR
CICL 1,353,242 500,000 178% 120% 1,299,737 500,000 180% 120%
Total Available Capital and Risk based Capital Adequacy Ratio of CICL was maintained in excess of the minimum requirements as prescribed by the IRCSL throughout the year. Thus, the operations of the Group are in compliance with the regulatory requirements of the IRCSL. Further Group is in compliance with other regulators such as Central Bank of Sri Lanka (CBSL), Department of Inland Revenue (IRD) and etc. The Group is also regulated by the Companies Act, No. 07 of 2007.
(C) Capital Management Framework
The Group’s approach to managing capital involves managing assets, liabilities and risks in a co-ordinated way, assessing shortfall between reported and required capital levels on a regular basis and taking appropriate actions to influence the capital position of the Group in the light of changes in economic conditions and risk characteristics. The capital requirements are forecasted on a periodic basis by the Management and the Board of Directors.
There were no any significant changes from the previous year, to its policies and process of its capital structure. Those thre were no changes in the capital structure in the Company during the year.
Company and its subsidiary subject to regulatory guidelines and framework which includes minimum Capital Requirement, Solvency Margin, Approved Assets Requirements, etc. to minimise the risk of default and insolvency on the part of the insurance company to meet unforeseeable liabilities as they arise. Group comply with all regulatory requires during the year.

ANNUAL REPORT - 2018CO-OPERATIVE INSURANCE COMPANY 179
(D) Asset and Liability Management (ALM) framework
The Group manages Assets and Liabilities to achieve long-term investment returns in excess of its obligations under insurance contracts. Financial risks arise from interest rates, currency and equity products, all of which are exposed to general and specific market movements will have an impact on Asset and Liability Management (ALM). The main risk that the Group faces, due to the nature of its investments and liabilities, is interest rate risk. The Group manages these positions within a clearly defined ALM framework.
37.2 Insurance and financial risksThis section deals in detail with the various risks from insurance contracts and describe uncertainties in measuring them. In accordance with the requirements of SLFRS 4, the effects of a change in the assumptions underlying the measurement of insurance contracts and / or in the market environment are also quantified.
CICL Group
Financial RiskInsurance risk (Business risk)
Credit Risk Liquidity Risk Market Risk
Operational Risk
- Interest Rate Risk- Foreign Exchange Risk- Equity Price Risk
37.2.1 Insurance risk (Business risk)By the very nature of an insurance contract, risk is based on fortuity and is therefore unpredictable. The risk under any insurance contract is the possibility that the insured event occurs and the uncertainty regarding the amount of the resulting claim.
For a portfolio of insurance contracts where the theory of probability is applied to pricing and provisioning, the principal risk that the Company faces is that the actual claim and benefit payments exceed the carrying amount of the insurance liabilities. This could occur because the frequency or severity of claims and benefits are greater than estimated. Insurance events are random, and the actual number and amount of claims and benefits will vary from year to year from the level established using statistical techniques.
37.2.1.1 Life Insurance contracts
(A) Risk management identification
Life insurance products include protection and annuity covers. Protection products carry mortality, longevity and morbidity risks as well as market and credit risk. The most significant factors that could increase the frequency of mortality claims are epidemics, such as strains of influenza, or lifestyle changes such as eating, drinking and exercise habits, resulting in earlier or more claims than expected. Morbidity claims experience would not only be affected by the factors mentioned above, but because disability is defined in terms of the ability to perform an occupation, it could also be affected by economic conditions. In order to reduce cross-subsidies in the pricing basis, premiums are differentiated, where permitted, for example by product, age, gender and smoker status.

ANNUAL REPORT - 2018CO-OPERATIVE INSURANCE COMPANY180
Notes to the Financial Statements
The policy terms and conditions and the disclosure requirements contained in insurance applications are designed to mitigate the risk arising from non-standard and unpredictable risks that may result in severe financial loss.
In the life annuity business, the most significant insurance risk is continued medical advances and improvement in social conditions that lead to increase in longevity. Annuitant mortality assumptions include allowance for future mortality improvements.
In addition to the specific risks listed above, the Company is exposed to policyholder behaviour and expense risks. Policyholder behaviour risk is mitigated by product designs that match revenue and expenses associated with the contract as closely as possible. Expense risk is mitigated by careful control of expenses and by regular expense analyses and allocation exercises.
The Company is exposed to two main types of concentration risks in its life business:
Market risk: Interest rate guarantees expose the Company to financial losses that may arise as a result of adverse movements in financial markets.
Insurance risk: Main factors include mortality risk, morbidity risk, longevity risk, policyholder behaviour risk (lapse, anti-selection) and expense risk.
Accordingly having a well-diversified portfolio of products reduces risk associated with the life business.
The Company’s exposure to life insurance risks varies significantly by product lines and may change over time. The insurance risk described above is also affected by the contract holder’s right to pay reduced premiums or no future premiums, to terminate the contract completely. As a result, the amount of insurance risk is also subject to contract holder behaviour.
Following table illustrate the strategies followed by the company to mitigates risk associates with life insurance.
Strategies associated with Life insurance undertaking
• Focused training is provided to Insurance Advisors on proper selling in Sinhala, Tamil and English.
• Maximum input is obtained from the Consultant Actuary and Reinsurer in deciding on the terms and conditions of products in order to ensure that products are adequately priced.
Strategies associated with Life insurance claims to manage within expected level
• Claims are reserved immediately at the intimation or on the availability of information of the death or injury of an insured.
• The support of the reinsurers is obtained on reserving such claim liability and the share of reinsurers.
Reinsurance strategies associated with Life insurance undertaking
• A very close and professional relationship is maintained with all reinsurers and reinsurance brokers
• Frequent review of the outstanding Reinsurance receivables.
(B) Concentration risk
The Company defines concentration risk in the life business as the risk of exposure to increased losses associated with inadequately diversified portfolios of assets and /or obligations.
A more diversified portfolio of risks is less likely to be affected across the board by a change in any subset of risks.
Any potential change in the mix of the portfolio could significantly alter the nature of the overall risk. Hence the Executive Committee reviews risks inherent in all new business propositions against the risk appetite of the life business.

ANNUAL REPORT - 2018CO-OPERATIVE INSURANCE COMPANY 181
Concentration risk within the life business
The following table shows the concentration of the Participating and Non-Participating funds position of the Company.
Insurance contract
liabilities As at 31 Dec 2018
Insurance contract
liabilities As at31 Dec 2017
Rs. Rs.
Participating 1,126,615 1,001,644 Non-participating 443,410 457,643 Total 1,570,025 1,459,287
(C) Assumptions in determining Life insurance contract liabilities
Life insurance contracts, estimates are made in two stages. At inception of the contract, the Company determines assumptions in relation to future deaths, voluntary terminations, investment returns and administration expenses. Subsequently, new estimates are developed at each reporting date to determine whether liabilities are adequate in the light of the latest current estimates. Improvements in estimates have no impact on the value of the liabilities and related assets, while significant enough deteriorations in estimates have an impact.
The Assumptions used for the insurance contracts are as follows:
Assumption Description
Mortality The mortality table used was the A67 / 70 ultimate for all assurances and deferred annuities before vesting and, a (90) ultimate table of annuitants after vesting.
Investment returns Investment returns affect the assumed level of future benefits due to the contract holders and the selection of the appropriate discount rate.
(D) Sensitivity Analysis
Following table presents the sensitivity of the value of insurance liabilities disclosed in this note to movements in the assumptions used in the estimation of insurance liabilities. For liabilities under life insurance contracts with fixed and guaranteed terms, changes in assumptions will not cause a change to the amount of the liability, unless the change is severe enough to trigger a liability adequacy test adjustment.
No adjustments were required in 2018 or 2017, based on the results of the liability adequacy test. Following table D indicates the level of the respective variable that will trigger an adjustment and then indicates the liability adjustment required as a result of a further deterioration in the variable.
Sensitivity of the value of insurance liabilities
The table below presents the sensitivity of the value of insurance liabilities to movements in the key assumptions used in the estimation of insurance liabilities with other assumptions held constant.
Change in assumptions
Impact on liabilities2018 2017
Mortality 10% 1,431,599 1,331,603 -10% 1,401,095 1,300,091
Discount rate 10% 1,282,301 1,250,390 -10% 1,574,058 1,386,749

ANNUAL REPORT - 2018CO-OPERATIVE INSURANCE COMPANY182
Notes to the Financial Statements
37.2.1.2 General insurance contracts
(A) Risk management identification
General insurance risks include the reasonable possibility of significant loss due to uncertainty in the frequency of the occurrence of the insured event as well as in the severity of the resulting claim. An overview of the Group’s main lines of business is as follows;
Line of business Description
Motor Includes automobile physical damage, loss of the insured vehicle and automobile third party liability insurance
Fire and engineering Includes fire risks (for example fire, explosion and business interruption), natural perils (for example earthquake and flood), engineering lines (for example boiler explosion, machinery breakdown and construction)
Accident and liability Includes general/public and product liability, excess and professional liability including medical malpractice, errors and omissions of liability.
Marine/ Cargo Coverage for special risk insurance and trip cargo insurance. Contracts with open policy cargo insurance that covers all of a shipper’s good in transit.
The Group’s underwriting strategy is to take advantage of the diversification of General insurance risks across industries. The Group seeks to optimise shareholder value by achieving its equity goals. Doing so necessitates a prudent, stable underwriting philosophy that aims to take advantage of its competitive strengths while avoiding risks with disruptive volatility. At the core of the Group’s underwriting is a robust governance process.
Following table illustrate the strategies followed by the company to mitigates risk associates with life insurance.
Strategies associated with general insurance undertaking
y Limits are set on underwriting capacity, and authority granted to individuals based on their specific expertise.
y Appropriate pricing guidelines have been set, with a focus on consistent technical pricing across the organisation.
y Diversified large portfolio of insurance contracts and geographical areas.
y Careful selection and implementation of underwriting strategies.Strategies associated with general insurance claims to manage within expected level
y Claims are assessed immediately upon intimation and reserved accordingly..
y The service of a qualified Independent Actuary is obtained to assess the adequacy of reserves made in relation to Incurred But Not Reported (IBNR) and Incurred But Not Enough Reported (IBNER) claims.
Reinsurance strategies associated with general insurance undertaking
y There are strict controls to ensure that no insurance cover is issued without a proper reinsurance arrangement backing the cover.
y Review adequacy of reinsurance support for catastrophe / extreme events on a regular basis
y Periodic review of the credit rating and ensuring all reinsurers maintain the rating throughout the year.

ANNUAL REPORT - 2018CO-OPERATIVE INSURANCE COMPANY 183
(B) Reinsurance risk
The Company obtains reinsurance to limit its exposure to individual risks and aggregation of risks arising from individual large claims and catastrophe events. The types of reinsurance obtained are as follows;
- Excess of loss reinsurance obtained to protect a range of individual inwards contracts which could give rise to individually large claims.
- Facultative reinsurance obtained to reduce risk relating to an individual specific inwards contract.
Notwithstanding to the advantages reinsurance provides insurers, it can expose them, at varying degrees, to various risks inherent in its use. A new or continuing reinsurance contract could give rise to one or more of the following risks;
- Residual insurance risk
- Legal risk
- Counterparty risk
- Liquidity risk
Considering the above factors the overall risk management strategy cedes insurance risk through proportional, non-proportional and specific reinsurance treaties.
As at 31 December 2018, 99% of our reinsurance receivable were due from reinsurers with a rating of ‘A-’ or better and from the National Insurance Trust Fund (NITF). There were no collateral against reinsurance receivables as at the reporting date.
The ratings of reinsurer’s and their related rating agencies are as follows;
Reinsurer Country of origin Rating Rating agency
General Insurance Corporation of India India A- A M BestAfrican Reinsurance Corporation Nigeria A A M BestMalaysian Reinsurance Berhad Malaysia A- A M BestHannover Re (Bermuda) Ltd Bermuda AA A M BestSwiss Re International SE Luxembourg AA A M BestFirst Capital Insurance Limited Singapore A A M BestSantam Re South Africa AA- Standard & Poor's
National Insurance Trust Fund Sri Lanka Government security Not applicable
(C) Concentration risk
For General insurance contracts, the most significant risks arise from the Motor Class.
The above risk exposure is mitigated by diversification across a large portfolio of insurance contracts into different classes as mentioned earlier. The variability of risks is improved by careful selection and implementation of underwriting strategies, which are designed to ensure that risks are diversified in terms of type of risk and level of insured benefits.
Concentration risk based on classes within the general insurance busines based on the gross written premium is as follows;
Class
2018 2017Gross Written
Premium Re-insuranceNet written Premium %
Gross Written Premium Re-insurance
Net written Premium %
Rs.'000' Rs.'000' Rs.'000' Rs.'000' Rs.'000' Rs.'000'
Motor 3,254,676 331,438 2,923,238 87% 2,680,390 326,697 2,353,693 88%Fire and engineering 121,113 102,753 18,360 3% 115,244 88,110 27,134 4%Marine 7,791 2,551 5,240 0% 4,485 9,222 (4,737) 0%Accident and liability 367,258 122,198 245,060 10% 255,717 120,326 135,390 8%Total 3,750,838 558,940 3,191,898 100% 3,055,836 544,355 2,511,480 100%

ANNUAL REPORT - 2018CO-OPERATIVE INSURANCE COMPANY184
Notes to the Financial Statements
(D) Sources of uncertainty in the estimation of future claim payments
The Company is liable for all insured events that occurred during the term of the contracts, even if the loss is discovered after the end of the contract term. As a result, liability claims are settled over a long period of time and large element of the claims provision related to incurred but not reported (IBNR) claims. There are several variables that affect the amount and timing of cash flows from these contracts. These mainly relate to the inherent risks of the business activities carried out by individual contract holders and the risk management they adopt.
(E) Estimation of IBNR reserve
The IBNR claims reserve has been actuarially computed by NMG Consulting (NMG). The valuation is determined using internationally accepted actuarial techniques.
The risk associated with these insurance contracts are complex and subject to a number of variables that complicate the quantitative sensitivity analysis. NMG use several statistical methods to incorporate the various assumptions made in order to estimate the ultimate costs of claims. The two methods more commonly used are the Chain-Ladder and the Bornhuetter-Ferguson methods.
Generally, NMG has given higher credibility to the chain ladder method on a cumulative claims reported basis for each class of business. In general, the reported basis would display more stability relative to the paid basis, especially for more recent accident years. To increase consistency, the BF method uses results from the 31 December 2011 analysis as the seed loss ratio for each accident year and a projected loss ratio for the latest accident year. Loss development factors, NMG has used loss development factors based on weighted averages except where;
- The weighted average is contrary to a trend in the recent ratios. For some classes, the trend in loss development factors applies only to certain development years.
- Payments in particular years are clearly out of line relative to those in other years, in which case such outliers are disregarded in selecting the loss development factors.
Sensitivity of Profit Before Tax and net assets due to increase in net claims ratio:
+1% in claim ratio 2018 2017Rs.’000 Rs.’000
Net impact to profit before tax 5,990 7,057 Impact to Net assets 34,841 35,580
37.2.2 Credit risk
(A) Introduction to risk
Credit risk is the risk of financial loss to the Group if a customer or counterparty to a financial instrument fails to meet its contractual obligations, and arises principally from the Group’s loans and advances to customers and other banks, and investment debt securities. For risk management reporting purposes, the Group considers and consolidates all elements of credit risk exposures (such as individual obligor default risk, country and sector risk). The Group is exposed to credit risk on securities issued by third parties. The debt security investments are broadly categorised into investments in Government securities and investments in corporate debt securities.
The Group’s credit risk could mainly arise from;
- Financial investments in debt securities
- Reinsurance receivable
- Premiums receivable
- Loans to Life policyholders and others
- Cash and cash equivalents, excluding cash in hand
- Other financial receivables

ANNUAL REPORT - 2018CO-OPERATIVE INSURANCE COMPANY 185
The Group manages credit risk exposure within parameters that reflect the Group’s strategic objectives and risk tolerance. Sources of credit risk are identified, assessed and monitored, and the Group has policies to manage the specific risks within the various subcategories.
(B) Credit risk exposure
Group’s exposure to credit risk as at the financial position date is given in the tables below with the comparative figures and has been derived as per the Group risk management policy of using the carrying values in the statement of financial positions.
Note
2018 2017
Group% of
allocation Company% of
allocation Group% of
allocation Company% of
allocation
Debt securities - Loans and receivables 6.2 785,373 27% 507,582 28% 751,064 27% 751,064 42%Debt securities - Available for sale 6.3 700,357 24% - 0% 857,383 31% - 0%Total debt securities 1,485,730 51% 507,582 28% 1,608,447 58% 751,064 42%
Life policyholders loans 8 20,630 1% - - 19,039 1% - 0%Reinsurance receivable 9 340,059 12% 331,972 18% 256,107 9% 245,140 14%Premiums receivable 10 758,588 26% 750,717 42% 602,795 22% 594,509 34%Other financial assets 11 140,820 5% 85,488 5% 138,027 5% 68,785 4%Cash and cash equivalents 12 140,831 5% 120,709 7% 138,643 5% 114,938 6%Total credit risk exposure 2,886,658 100% 1,796,468 100% 2,763,058 100% 1,774,437 100%
The Group is exposed to credit risk on securities issued by third parties. The Group limits its exposure by analysing the creditworthiness of each debt security investment. The credit worthiness of a potential debt security investment is assessed mainly through ratings assigned to the issuing institution or the ratings assigned to an issue. The debt security investments are broadly categorised into investments in government securities and investments in corporate debt securities.

ANNUAL REPORT - 2018CO-OPERATIVE INSURANCE COMPANY186
Notes to the Financial Statements
The tables below set out information about the credit quality of financial investments (government securities and corporate debt securities) and the allowance for impairment loss held by the Group against the assets.
Group Carrying Amount As at 31 December 2018
Held to maturity
financial assetsLoans and
receivables
Available for sale financial
assets
Financial assets at fair value
though profit or loss
Cash and cash equivalents Total %
Rs.'000' Rs.'000' Rs.'000' Rs.'000' Rs.'000' Rs.'000'
AAA - - - - 135 135 0%AA+ to AA- 334,005 179,620 66,399 - - 580,024 12%A+ to A- 266,923 1,229,279 193,544 - - 1,689,746 34%BBB+ to BBB- 184,235 735,110 64,882 - - 984,227 20%BB+ to BB- - 78,924 - - - 78,924 2%Government guaranteed 797,258 342,133 375,531 - - 1,514,922 31%Not rated - - 15,780 731 45,964 62,475 1%Total 1,582,421 2,565,065 716,137 731 46,099 4,910,453 100%Allowance for impairment - - - - - - -As at 31 December 2018 1,582,421 2,565,065 716,137 731 46,099 4,910,453 100%
Group Carrying Amount As at 31 December 2017
Held to maturity
financial assetsLoans and
receivables
Available for sale financial
assets
Financial assets at fair value
though profit or loss
Cash and cash equivalents Total %
Rs.'000' Rs.'000' Rs.'000' Rs.'000' Rs.'000' Rs.'000'
AAA - - - - - - - AA+ to AA- 343,824 85,898 98,995 - - 528,717 12%A+ to A- 160,610 882,886 191,234 - - 1,234,730 29%BBB+ to BBB- 137,180 598,750 131,671 - - 867,601 20%BB+ to BB- - 58,188 - - - 58,188 1%Government guaranteed 425,471 608,471 445,867 - - 1,479,809 35%Not rated - - 5,110 922 68,675 74,708 2%Total 1,067,085 2,234,193 872,877 922 68,675 4,243,753 100%Allowance for impairment - - - - - - -As at 31 December 2017 1,067,085 2,234,193 872,877 922 68,675 4,243,753 100%

ANNUAL REPORT - 2018CO-OPERATIVE INSURANCE COMPANY 187
Company Carrying Amount As at 31 December 2018
Held to maturity
financial assetsLoans and
receivables
Available for sale financial
assets
Financial assets at fair value
though profit or loss
Cash and cash equivalents Total %
Rs.'000' Rs.'000' Rs.'000' Rs.'000' Rs.'000' Rs.'000'
AA+ to AA- 334,005 179,620 - - - 513,625 18%A+ to A- 266,923 644,527 - - - 911,450 31%BBB+ to BBB- 184,235 505,085 - - - 689,320 24%BB+ to BB- - 78,924 - - - 78,924 3%Government guaranteed 427,730 250,747 - - - 678,477 23%Not rated - - 15,780 - 26,201 41,980 1%Total 1,212,893 1,658,903 15,780 - 26,201 2,913,777 100%Allowance for impairment - - - - - As at 31 December 2018 1,212,893 1,658,903 15,780 - 26,201 2,913,777 100%
Company Carrying Amount As at 31 December 2017
Held to maturity
financial assetsLoans and
receivables
Available for sale financial
assets
Financial assets at fair value
though profit or loss
Cash and cash equivalents Total %
Rs.'000' Rs.'000' Rs.'000' Rs.'000' Rs.'000' Rs.'000'
AAA - - - - - - - AA+ to AA- 343,824 - 10,384 - - 354,208 15%A+ to A- 160,610 469,855 - - - 630,465 26%BBB+ to BBB- 137,180 435,698 - - - 572,878 24%BB+ to BB- - 58,188 - - - 58,188 2%Government guaranteed 425,471 319,632 - - - 745,103 31%Not rated - - 5,110 - 44,970 50,080 2%Total 1,067,085 1,283,373 15,494 - 44,970 2,410,922 100%Allowance for impairment - - - - - - -As at 31 December 2017 1,067,085 1,283,373 15,494 - 44,970 2,410,922 100%
Following are some strategies followed by the company to mitigate credit risk in investments.
y Checking the credit worthiness of potential investees, mainly through ratings assigned to the issuing institution or the ratings assigned to the issue.
y Deciding on single party exposure limits based on the credit ratings and regulatory requirements and monitoring them closely at different levels.
y Adhering to the guidelines on selection of Primary dealer with regard to Government security investments.
y Conducting a detailed analysis of individual counterparties for each equity and corporate debt investment before taking the investment decision.

ANNUAL REPORT - 2018CO-OPERATIVE INSURANCE COMPANY188
Notes to the Financial Statements
The following table provides information relating to credit risk exposure of other financial assets:
Group Reinsurance receivable Premium receivable2018 2017 2018 2017
Rs.'000' Rs.'000' Rs.'000' Rs.'000'
Maximum exposure to credit riskNeither past due nor impaired 68,721 77,918 662,689 542,995
Past due but not impaired61-90 days 27,841 32,213 97,861 59,155 91-365 days 188,877 126,997 6,407 8,100 365 days + 30,308 9,066 10,903 3,361 Total 315,747 246,194 777,861 613,611 Impaired - - (19,272) (10,817)IBNR 24,312 9,913 - -Total 340,059 256,107 758,588 602,795
Company Reinsurance receivable Premium receivable2018 2017 2018 2017
Rs.'000' Rs.'000' Rs.'000' Rs.'000'
Maximum exposure to credit riskNeither past due nor impaired 65,583 75,021 654,817 534,710
Past due but not impaired61-90 days 27,774 31,832 96,463 58,963 91-365 days 185,546 120,793 5,123 7,773 365 days + 28,757 7,581 8,309 1,239 Total 307,660 235,227 764,713 602,685 Impaired - - (13,996) (8,176)IBNR 24,312 9,913 - -Total 331,972 245,140 750,717 594,509
(C) Credit risk relating to reinsurance receivable
As part of its overall risk management strategy, The Group cedes insurance risk through proportional, non-proportional and specific risk reinsurance treaties. While these mitigate insurance risk, the recoverable from reinsurers and receivables arising from ceded reinsurance exposes the Group to credit risk.
Reinsurance is placed in line with policy guidelines approved by the Board of Directors on an annual basis in line with the guidelines issued by the Insurance Board of Sri Lanka and concentration of risk is managed by reference to counterparties’ limits that are set each year and are subject to regular reviews.
There were no collateral against reinsurance receivable as at the reporting date.
The group follow policies and procedures to mitigate credit risk in premium receivable as conducting follow-up meetings on debt collection on a monthly basis and processing claims only for the premium settled policies.
Credit risk of reinsurance receivables by rating class have been illustrated below in order to ensure that the Company has significant control over managing them.

ANNUAL REPORT - 2018CO-OPERATIVE INSURANCE COMPANY 189
2018 2017On paid claims On reserve Total %
On paid claims On reserve Total %
Rs.’000’ Rs.’000’ Rs.’000’ Rs.’000’ Rs.’000’ Rs.’000’
AAA 21,381 7,096 28,477 9% 6,958 5,174 12,132 5%AA- - - - 0% - - - 0%A+ - - - 0% - 59 59 0%A 1,439 330 1,769 1% 2,044 803 2,847 1%A- 137,921 43,159 181,080 59% 67,831 54,385 122,216 52%BBB+ - - - 0% - - - 0%B+ - - - 0% - - - 0%NITF 74,653 21,679 96,333 31% 72,089 25,895 97,984 42%Unrated - - - 0% - - 0%Total - - 307,660 100% 148,922 86,315 235,237 100%IBNR - - 24,312 0% - - 9,913 0%Total reinsurance receivable 235,395 72,265 331,972 100% 148,922 86,315 245,150 100%
2018 2017On paid claims On reserve Total %
On paid claims On reserve Total %
Ratings - Life Rs.’000’ Rs.’000’ Rs.’000’ Rs.’000’ Rs.’000’ Rs.’000’
AA 4,914 3,173 8,087 100%AA- - - - 0% 4,264 6,704 10,968 100%Total reinsurance receivable 4,914 3,173 8,087 100% 4,264 6,704 10,968 100%
(D) Credit risk relating to reinsurance receivable
Group Up to 30 days 31-60 days Above 60 daysTotal
receivables
As at December 2018 (Rs. ’000) 37,339 31,383 247,026 315,747 As at December 2017 (Rs. ’000) 25,888 52,030 168,277 246,194
Company Up to 30 days 31-60 days Above 60 daysTotal
receivables
As at December 2018 (Rs. ’000) 34,366 31,217 242,077 307,660 As at December 2017 (Rs. ’000) 23,230 51,791 160,206 235,227
(E) Credit risk relating to loans
The following table illustrates how the loans have been segregated amongst different categories.
Group Company 2018 2017 2018 2017
Loan categories Rs. Rs. Rs. Rs.
Staff loans 28,054 27,239 16,477 21,946 Loans to policy holders 20,630 19,039 - - Loans to Field Staff 6,437 12,837 - - Total 55,121 59,116 16,477 21,946

ANNUAL REPORT - 2018CO-OPERATIVE INSURANCE COMPANY190
Notes to the Financial Statements
(E) Credit risk relating to loans - (Contd.)
The Group grants loan facilities to staff including field staff after a robust process of evaluating the credit worthiness of the individual, value of the facility and the related collateral. The field staff loan and 45% of staff loan portfolio is largely made-up of vehicle loans and Group has undertaken the absolute ownership of those vehicles as collateral.
(F) Credit risk relating to cash and cash equivalents
The Group held cash and cash equivalents of Rs. 140.60 at 31 December 2018 (2017 - 138.643 Mn). The cash and cash equivalents are held with banks and financial institutional counterparties, which are rated BBB+ or better except for cash in hand of Rs. 6.02Mn (2017- 2.876 Mn)
(G) Collateral of debt securities
Reverse repo investments which fall under government securities is backed up by treasury bills and bonds which are provided as collateral. Management monitors the market value of the collateral, requests additional collateral when needed and performs an impairment valuation when applicable. As at the financial position date, Group holds treasury bonds and bills worth Rs. 1,172.78 Million as collateral for reverse repo investments amounting to Rs. 342.13 Million.
(H) Concentration of Credit risk - financial investments in Debt securities
The Group actively manages its investment mix to ensure that there is no significant concentration of credit risk. The Group monitors concentrations of credit risk by sector and instruments. An analysis of concentrations of credit risk from financial investments is shown below:
Group Company As at 31 December 2018 2017 2018 2017
Government securities and related institutions 31% 35% 23% 31%Corporate debt securities. 32% 29% 36% 31%Equity instruments - 0% 1% 1%Others 37% 36% 40% 37%Total 100% 100% 100% 100%
37.2.3 Liquidity RiskLiquidity risk is the risk that the Group may not have sufficient liquid financial resources to meet its obligations when they fall due, or would have to incur excessive costs to do so. In respect of catastrophic / unexpected large claim events there is also a liquidity risk associated with the timing differences between gross cash outflows and expected reinsurance recoveries.
The following policies and procedures are in place to mitigate the exposure to liquidity risk:
The Investment Committee manages this risk by diversifying investment durations and reviewing cash flow projections regularly.
y Guidelines are set for asset allocations, portfolio limit structures and maturity profiles of assets, in order to ensure availability of sufficient funding to meet insurance and investment contract obligations.
y Maintaining sufficient cash balances, repurchase agreement and other short tenure investments to accommodate expected obligations and commitments of the Group.
y Reviewing the maturity mix of the investment portfolio by the management and the Investment Committee on a regular basis.
(A) Maturity analysis
Following table summarises the maturity profiles of non-derivative financial assets and financial liabilities based on remaining undiscounted contractual obligations, including interest payable and receivable. For insurance contract liabilities and reinsurance receivables, maturity profiles are determined based on estimated timing of net cash outflows from the recognised insurance liabilities.

ANNUAL REPORT - 2018CO-OPERATIVE INSURANCE COMPANY 191
(B) Maturity profile
Group
31-Dec-2018 31-Dec-2017
Current Non-CurrentCarrying Amount Current Non-Current
Carrying Amount
Rs.'000' Rs.'000' Rs.'000' Rs.'000' Rs.'000' Rs.'000'
Insurance contract liabilities - life - 1,608,101 1,608,101 - 1,491,014 1,491,014Insurance contract liabilities- non life 2,229,944 - 2,229,944 1,900,065 - 1,900,065Reinsurance payable 302,532 - 302,532 216,873 - 216,873Other financial liabilities 494,859 57,281.54 552,140 433,938 63,463 497,400Bank overdrafts 94,508 - 94,508 69,968 69,968Total undiscounted liabilities 3,121,843 1,665,383 4,787,226 2,620,844 1,554,477 4,175,320
Company
31-Dec-2018 31-Dec-2017
Current Non-CurrentCarrying Amount Current Non-Current
Carrying Amount
Rs.'000' Rs.'000' Rs.'000' Rs.'000' Rs.'000' Rs.'000'
Insurance contract liabilities- non life 2,229,944 - 2,229,944 1,900,065 - 1,900,065 Reinsurance payable 291,709 - 291,709 196,593 - 196,593 Other financial liabilities 422,228 94,201 516,429 374,393 46,408 420,801 Bank overdrafts 94,508 - 94,508 69,968 - 69,968 Total undiscounted liabilities 3,038,389 94,201 3,132,590 640,954 46,408 2,587,427
Financial assets pledged as collateral
There were no financial assets pledged as collateral during the year ended 31 December 2018.
37.2.4 Market riskMarket risk is the risk that the fair value or future cash flows of a financial instrument will fluctuate because of changes in market prices. Market risk comprises three types of risks:
37.2.4.1 Equity price risk
37.2.4.2 Foreign exchange risk
37.2.4.3 Interest rate risk
The following policies and procedures are in place to mitigate the group’s exposure to market risk.
y Macro-economic indicators and their impact on the Group’s Investment Portfolio are monitored closely by the Management.
y Impact from the market movement is monitored and warnings are sent to MD and board of directors of high volatilities in the market
y Total exposure to equity investments is made strictly within the agreed target asset allocation and sectorial equity limits.
y Equity investments are made in fundamentally sound stocks which are identified after an in-depth research and evaluation process

ANNUAL REPORT - 2018CO-OPERATIVE INSURANCE COMPANY192
Notes to the Financial Statements
37.2.4.1 Equity price risk
Listed equity securities are susceptible to market price risk arising from uncertainties of future values of the investment securities. The Group manages the equity price risk through diversification and placing limits on individual and total equity portfolio investments. The Group’s equity risk management policies are;
Equity investment decisions are based on fundamentals rather than on speculation.
Decisions are based on in depth macroeconomic and industry analysis as well as research reports on Group performance.
The risk exposure to listed equity securities as at 31st December 2018 with the comparatives are as follows;
Segment Life Non-Life2018 2017 2018 2017
Rs. Rs. Rs. Rs.
Listed Equity Investment 731 922 9,956 10,384
Following table shows the sector diversity of quoted equity investments of the Group.
Group Company2018 2017 2018 2017
Sector Rs. % Rs. % Rs. % Rs. %
Construction and engineering 111 - 177 2% - - - - Diversified Holdings 214 2% 203 2% - - - - Trading 60 - 43 0.4% - - - - Beverage Food and Tobacco 209 2% 266 2% - - - - Banks Finance and Insurance 9,956 93% 10,384 92% 9,956 100 10,384 100Hotel and Travels 138 1% 234 2% - - - - Total 10,687 98% 11,306 100 9,956 100 10,384 92
The table below shows the estimated impact from a 10 percent decline in the stock markets, on net assets of the Company.
Net impact on Net AssetsGroup Company
2018 2017 2018 2017 10% decline in stock markets Rs.'000' Rs.'000' Rs.'000' Rs.'000'
Investments 10,687 10,384 9,956 10,384 Net impact on Net Assets (1,063) (1,038) (990) (1,038)

ANNUAL REPORT - 2018CO-OPERATIVE INSURANCE COMPANY 193
37.2.4.2 Foreign exchange risk
Foreign exchange risk is the risk of loss resulting from changes in exchange rates. The Group’s principal operation is based in Sri Lanka, therefore it is not exposed to the financial impact arising from changes in the exchange rates of various currencies.
(A) Foreign currency exposures other than in respect of foreign operations
Group Company2018 2017 2018 2017
Amount in Foreign Currency
USD
Amount in local
currency Rs.
Amount in Foreign Currency
USD
Amount in local
currency Rs.
Amount in Foreign Currency
USD
Amount in local
currency Rs.
Amount in Foreign Currency
USD
Amount in local
currency Rs.
Foreign currency deposits 8,472 1,547,299 12,085 1,853,008 8,472 1,547,299 12,085 1,853,008
(B) Sensitivity analysis
The table below shows the estimated impact to the profitability when the foreign currency rates movement against the domestic currency.
Impact to PBTGroup Company
2018 2017 2018 2017 10% decline in stock markets Rs. Rs. Rs. Rs.
5% strengthening of rupee (89,236) 188,745 (89,236) 188,745 5% weakening of rupee 64,245 13,559 64,244 13,559 +/- impact on profit 0.016% 0.003% 0.016% 0.003%
37.2.4.3 Interest rate risk
Interest rate risk is the risk of fluctuation of the value or cash flows of an instrument due to changes in market interest rates.
The Group has adopted the following policies to manage interest rate risk
- The Investment Committee members keep a regular track of macroeconomic scenarios and their likely impact on interest rates
- Initial recognition of investments is closely monitored
Floating rate instruments expose the Group to cash flow fluctuations, whereas fixed interest rate instruments expose the Group to changes in fair values.
As at 31 December 2018 there were no cash flow interest rate exposures, as the Group did not have any floating rate investments. However, The Group is exposed to fair value fluctuations on fixed rate investments which are measured at fair value. The following table present the financial assets and financial liabilities which are subjective to the interest rate risk by the group and the company.

ANNUAL REPORT - 2018CO-OPERATIVE INSURANCE COMPANY194
Notes to the Financial Statements
Exposure to Interest Rate Risk
2018 2017Variable interest
rate
Fixed interest
rate
Non- Interest bearing Total
Variable interest
rate
Fixed interest
rate
Non- Interest bearing Total
Financial Assets - Group Rs.'000' Rs.'000' Rs.'000' Rs.'000' Rs.'000' Rs.'000' Rs.'000' Rs.'000'
Financial instruments- Loans and receivable - 2,565,065 2,565,065 - 2,234,193 - 2,234,193 Financial instruments- Available for sale - 386,531 340,605 727,137 - 445,867 427,009 872,876 Financial instruments- FVTP - 731,450 731,450 - - 922 922 Loans to life policyholders - 20,630 20,630 - 19,039 - 19,039 Staff and other loans - 28,054 28,054 - 34,784 - 34,784 Cash and cash equivalents - 134,586 6,021 140,607 - 135,767 2,876 138,644 Total Assets - Group - 3,134,867 1,078,076 4,212,943 - 2,869,650 430,808 3,300,457
Commission payable - 44,616 - 44,616 - 35,336 - 35,336 Bank overdrafts 94,508 - 94,508 69,968 - 69,968 Total Liabilities - Group 94,508 44,616 - 139,124 69,968 35,336 - 105,304
2018 2017Variable interest
rate
Fixed interest
rate
Non- Interest bearing Total
Variable interest
rate
Fixed interest
rate
Non- Interest bearing Total
Financial Assets - Company Rs.'000' Rs.'000' Rs.'000' Rs.'000' Rs.'000' Rs.'000' Rs.'000' Rs.'000'
Financial instruments- Loans and receivables - 1,658,903 - 1,658,903 - 1,283,373 - 1,283,373 Financial instruments- Available for sale - - 15,780 15,780 - - 15,493 15,493 Staff and other loans - 16,477 - 16,477 - 21,946 - 21,946 Cash and cash equivalents - 114,990 5,718 120,709 - 112,359 2,579 114,938 Total Assets - Company - 1,790,371 21,498 1,811,869 - 1,417,678 18,072 1,435,750
Commission payable - 39,485 - - - 32,464 - 32,464 Bank overdrafts - 94,508 - - - 69,968 - 69,968 Total Liabilities - Company - 133,993 - - - 102,432 - 102,432
Sensitivity analysis
The table below shows the estimated impact on profitability and equity due to fluctuation of interest rates on the fixed rate available for sale financial assets.
Sensitivity of profit before tax and equity to changes in interest rates.
Group
2018 2017Impact
on profit before tax
Impact on equity change in variablesImpact
on profit before tax
Impact on equity change in variables
Up to one year 1-5 years
Over 5 years Total
Up to one year 1-5 years
Over 5 years Total
(+) 100 basis points - 755 4,393 12,960 18,108 - (727) (7,709) (17,608) (26,044)(-) 100 basis points - (2,599) (4,557) (14,024) (21,180) - 738 7,954 19,143 27,835
There is no impact of changing interest rates, since company has reclassified investments in 2017 and now all the investments are in fixed rates.

ANNUAL REPORT - 2018CO-OPERATIVE INSURANCE COMPANY 195
37.2.4 Operating riskThis is the risk of direct or indirect loss arising from a wide variety of causes associated with the Group’s processes, personnel, technology and infrastructure, and from external factors other than credit, market and liquidity risks, such as those arising from legal and regulatory requirements and generally accepted standards of corporate behaviour.
Operational failures could result in dire consequences such as producing misleading financial information, loss of return, financial penalties from regulators or damage to the reputation of the Group. Operational risks arise from all operations of the Group.
While it is acknowledged that the Group cannot eliminate all operational risks, it is in a position to manage such risks by initiating a rigorous control framework and by monitoring and responding to potential risks.
Group’s Risk Management team assesses all foreseeable risk involved in its operation and they develop and implement action plan to control those identified operational risk. These action plans recommended by the team is to manage the operational risk in the following areas:
- requirements for having appropriate segregation of duties, including the independent authorisation of transactions;
- requirements for the reconciliation and monitoring of transactions\
- compliance with regulatory and other legal requirements
- documentation of controls and procedures
- requirements for the periodic assessment of operational risks faced, and the adequacy of controls and procedures to address the risks identified
- training and professional development
- Risk mitigation, including insurance where this is cost effective.

ANNUAL REPORT - 2018CO-OPERATIVE INSURANCE COMPANY196
As at 31 December
Company (Non Life)
Rest.
Subsidiary (Coop life)
Rs.
Subsidiary (CITA)
Consolidation Adjustments
Rs. Total
Rs.
AssetsProperty, plant and equipment 856,627,241 281,971,805 - - 1,138,599,047 Intangible assets 2,861,955 2,469,379 - - 5,331,334 Financial investments 2,887,575,983 1,976,778,282 - - 4,864,354,265 Investment in subsidiaries 445,260,050 - - (445,260,050) - Loans to policyholders - 20,629,674 - - 20,629,674 Deferred tax asset - 130,316,663 - 130,316,663 Reinsurance receivable 331,971,907 8,087,319 - - 340,059,226 Premium receivable 750,717,081 7,871,338 - - 758,588,419 Related party receivables 11,535,904 - - (11,535,894) - Other assets 85,488,497 55,331,578 - - 140,820,075 Cash and cash equivalents 120,708,829 18,848,359 1,049,600 223,823 140,830,613 Total assets 5,492,747,448 2,502,304,396 1,049,600 (456,572,121) 7,539,529,315
Equity and liabilitiesEquityStated capital 1,430,194,585 544,260,040 10 (544,260,050) 1,430,194,585 Revaluation reserve 322,407,068 73,081,201 - (12,719,624) 382,768,645 Available for sale reserves (48,607,352) (35,745,659) - 1,943,325 (82,409,685)Retained earnings 656,163,365 203,616,980 494,759 (33,052,568) 827,222,535 Non controlling interest - - - 142,828,875 142,828,875 Total equity 2,360,157,666 785,212,563 494,769 (445,260,042) 2,700,604,955
LiabilitiesInterest bearing borrowings 1,763,819 1,287,639 - - 3,051,458 Insurance liabilities 2,229,943,844 1,608,101,447 - - 3,838,045,291 Retirement benefit obligations 40,738,427 13,491,658 - - 54,230,085 Reinsurance creditors 291,709,148 10,823,272 - - 302,532,420 Related party payables - 10,757,248 554,831 (11,312,079) - Other liabilities 422,227,957 72,630,569 - - 494,858,521 Deferred tax liability 51,698,298 - - 51,698,298 Bank overdrafts 94,508,288 - - - 94,508,288 Total liabilities 3,132,589,781 1,717,091,833 554,831 (11,312,079) 4,838,924,358 Total equity and liabilities 5,492,747,447 2,502,304,396 1,049,600 (456,572,121) 7,539,529,315
SEGMENTAL REVIEW STATEMENT OF FINANCIAL POSITION - 2018

ANNUAL REPORT - 2018CO-OPERATIVE INSURANCE COMPANY 197
STATEMENT OF FINANCIAL POSITION - 2017
As at 31 December
Company (Non Life)
Rest.
Subsidiary (Coop life)
Rs.
Consolidation Adjustments
Rs. Total
Rs.
AssetsProperty, plant and equipment 827,891,117 274,195,647 - 1,102,086,765Intangible assets 2,136,027 5,742 - 2,141,769Financial investments 2,365,950,814 1,809,125,206 - 4,175,076,019Investment in subsidiary 410,000,040 - (410,000,040) - Loans to policyholders - 19,039,109 - 19,039,109Deferred tax asset 30,250,575 - - 30,250,575Reinsurance receivable 245,140,054 10,967,333 - 256,107,387Premium receivable 594,509,280 8,285,288 - 602,794,568Related party receivables 7,956,943 - (7,956,943) -Other assets 68,785,431 69,241,748 - 138,027,170Cash at bank and in hand 114,938,091 23,705,530 - 138,643,621Total assets 4,667,558,372 2,214,565,602 (417,956,983) 6,464,166,982
Equity and liabilitiesEquityStated capital 1,260,251,770 500,000,040 (500,000,040) 1,260,251,770Revaluation reserve 333,597,638 58,244,963 (9,910,248) 381,932,353Available for sale reserves (67,029,162) (8,898,434) (2,957,093) (78,884,689)Retained earnings 553,311,055 69,368,070 (8,501,295) 614,177,830Non controlling interest - - 111,366,434 111,366,434Total equity 2,080,131,301 618,714,639 (410,000,042) 2,288,845,898
LiabilitiesInterest bearing borrowings 8,414,249 3,172,212 - 11,586,461Insurance liabilities 1,900,064,983 1,491,014,318 - 3,391,079,301Retirement benefit obligations 37,993,692 13,882,395 - 51,876,087Reinsurance creditors 196,593,172 20,279,934 - 216,873,106Related party payables - 7,956,942 (7,956,942) - Other liabilities 374,392,781 59,545,163 - 433,937,937Bank overdrafts 69,968,193 - - 69,968,193Total liabilities 2,587,427,071 1,595,850,963 (7,956,942) 4,175,321,084Total equity and liabilities 4,667,558,372 2,214,565,602 (417,956,984) 6,464,166,982

ANNUAL REPORT - 2018CO-OPERATIVE INSURANCE COMPANY198
SEGMENTAL REVIEW STATEMENT OF PROFIT OR LOSS AND OTHER COMPREHENSIVE INCOME - 2018
Company (Non Life)
Rest.
Subsidiary (Coop life)
Rs.
Subsidiary (CITA)
Consolidation Adjustments
Rs. Total
Rs.
Gross written premium 3,750,838,457 619,881,069 - (2,402,641) 4,368,316,885 Less: Premium ceded to reinsurers (558,940,279) (45,833,169) - - (604,773,448)Net written premium 3,191,898,178 574,047,900 - (2,402,641) 3,763,543,437
Net change in reserves for unearned premium (347,458,112) - - - (347,458,112)Net earned premium 2,844,440,065 574,047,900 - (2,402,641) 3,416,085,325
Other incomeNet finance income 344,570,627 201,335,961 - (35,260,000) 510,646,588 Unrealised changes in losses of financial instruments - (251,200) - - (251,200)Net realised gain in financial investment - 4,326 - - 4,326 Policy administration fees 161,535,448 - - - 161,535,448 Other Income 25,154,337 4,946,454 1,652,815 (6,023,338) 25,730,268
531,260,412 206,035,541 1,652,815 (41,283,338) 697,665,430 Total revenue 3,375,700,477 780,083,442 1,652,815 (43,685,979) 4,113,750,755
Net benefits and claimsGross benefits and claims incurred 2,181,895,843 222,428,887 - - 2,404,324,729 Claims ceded to reinsurers (255,028,531) (17,893,571) - - (272,922,102)Change in life contract liabilities - 110,736,893 - - 110,736,893
1,926,867,312 315,272,209 - - 2,242,139,521
Other expensesUnderwriting and policy acquisition cost 140,612,881 98,338,985 - - 238,951,866Other operating and administrative expenses 902,443,863 322,735,364 1,158,056 8,425,979 1,217,911,302
1,043,056,744 421,074,348 1,158,056 8,425,979 1,456,863,168Profit before tax 405,776,421 43,736,885 494,759 (35,259,998) 414,748,068Income tax expenses (137,622,275) 140,260,147 - (5,740,000) (3,102,128)Profit for the year 268,154,147 183,997,032 494,759 (40,999,998) 411,645,940
Other comprehensive income Items that will not be reclassified subsequently to profit or loss ;Revaluation of land and buildings 44,101,987 21,921,342 - - 66,023,329 Actuarial gains / (loses) on defined benefit plan 4,584,095 748,705 - - 5,332,800
- Items that may be reclassified subsequently to profit or loss ;Net change in fair value of available for sale of financial assets 18,805,805 (23,342,671) - - (4,536,866)Tax on other comprehensive income (55,428,491) (11,086,473) - - (66,514,964)Total comprehensive income for the year 280,217,544 172,237,935 494,759 (40,999,998) 411,950,237
For the year ended 31 December

ANNUAL REPORT - 2018CO-OPERATIVE INSURANCE COMPANY 199
As at 31 December
STATEMENT OF PROFIT OR LOSS AND OTHER COMPREHENSIVE INCOME - 2017
Company (Non Life)
Rest.
Subsidiary (Coop life)
Rs.
Consolidation Adjustments
Rs. Total
Rs.
Gross written premium 3,055,835,664 626,972,292 (5,007,611) 3,677,800,345Less: Premium ceded to reinsurers (544,355,201) (39,927,811) - (584,283,012)Net written premium 2,511,480,464 587,044,481 (5,007,611) 3,093,517,334
Net change in reserves for unearned premium (160,160,321) - - (160,160,321)Net earned premium 2,351,320,143 587,044,481 (5,007,611) 2,933,357,014
Other incomeNet finance income 258,669,237 169,897,757 - 428,566,994Realised gains/ (losses) - 18,346,169 - 18,346,169Net fair value gains/ (losses) - (199,920) - (199,920)Policy administration fees 123,073,337 - - 123,073,337Other operating revenue 22,030,734 5,107,811 (5,841,889) 21,296,656
403,773,308 193,151,817 (5,841,889) 591,083,236Total revenue 2,755,093,451 780,196,298 (10,849,500) 3,524,440,250
Net benefits and claimsGross benefits and claims incurred 1,830,737,956 121,573,256 - 1,952,311,212Claims ceded to reinsurers (301,891,061) (12,587,937) - (314,478,998)Change in life contract liabilities - 249,255,888 - 249,255,888
1,528,846,896 358,241,207 - 1,887,088,1031,226,246,555 421,955,091 (10,849,500) 1,637,352,147
Other expensesUnderwriting and policy acquisition cost 93,500,473 77,109,647 - 170,610,120Other operating and administrative expenses 733,634,684 289,965,945 (10,849,499) 1,012,751,129
827,135,157 367,075,592 (10,849,499) 1,183,361,249Profit before tax 399,111,399 54,879,499 - 453,990,898Income tax expenses (97,677,827) 14,455,512 - (83,222,314)Profit for the year 301,433,572 69,335,011 - 370,768,584
Other comprehensive income Items that will not be reclassified subsequently to profit or loss;Revaluation of land and buildings 61,829,307 14,779,229 - 76,608,536De-recognition of revaluation reserve 90,984 - - 90,984Actuarial gains/ (loses) on defined benefit plan (997,237) 1,774,353 - 777,116
- Items that may be reclassified subsequently to profit or loss;Net change in fair value of available for sale of financial assets 23,843,539 62,970,392 - 86,813,932Tax on other comprehensive income (1,298,100) (15,646,040) - (16,944,141)Total comprehensive income for the year 384,902,065 133,212,946 - 518,115,010


Supplementary InformationStatement of Value Added 202
Insurance Revenue Account 203
Ten Year Summery - Statement of Income 204
Ten Year Summery - Statement of Financial Position 205
Glossary of Insurance Terms 206
Contact List of CICL Branch Network 209
Contact List of Cooplife Branch Network 211
Notice of Annual General Meeting 212
Form of Proxy Enclosed
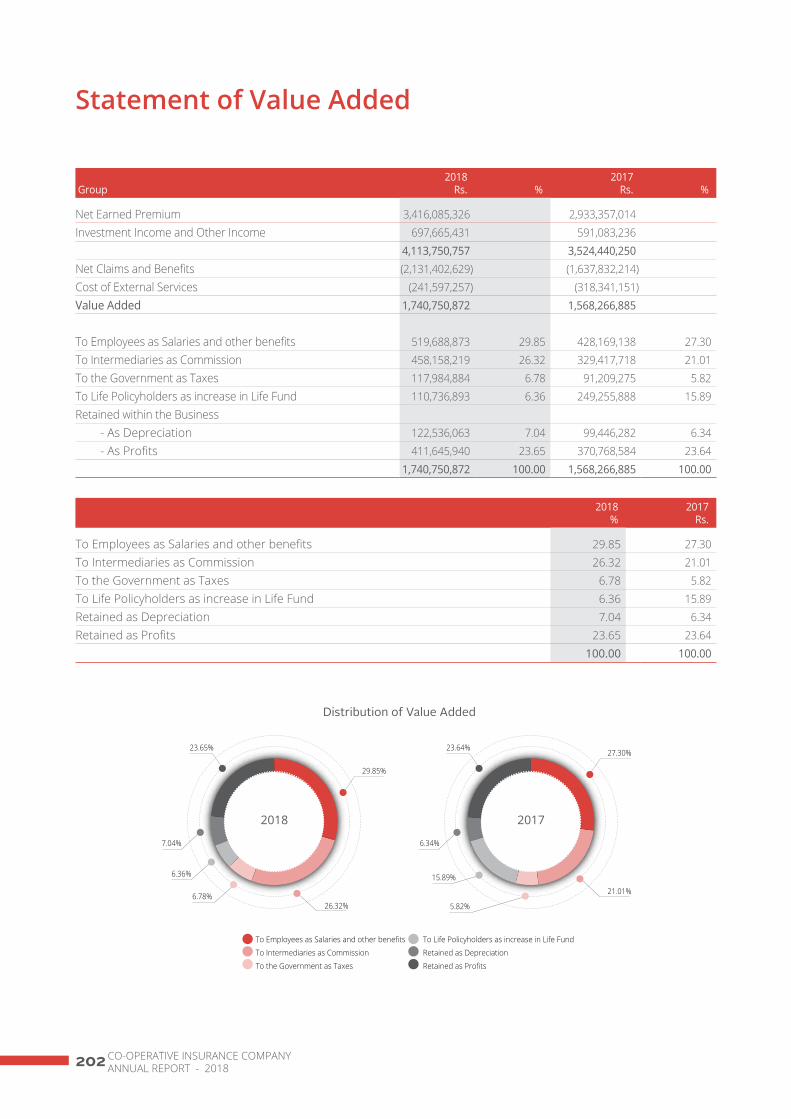
ANNUAL REPORT - 2018CO-OPERATIVE INSURANCE COMPANY202
Statement of Value Added
Group2018
Rs. %2017
Rs. %
Net Earned Premium 3,416,085,326 2,933,357,014Investment Income and Other Income 697,665,431 591,083,236
4,113,750,757 3,524,440,250Net Claims and Benefits (2,131,402,629) (1,637,832,214)Cost of External Services (241,597,257) (318,341,151)Value Added 1,740,750,872 1,568,266,885
To Employees as Salaries and other benefits 519,688,873 29.85 428,169,138 27.30To Intermediaries as Commission 458,158,219 26.32 329,417,718 21.01To the Government as Taxes 117,984,884 6.78 91,209,275 5.82To Life Policyholders as increase in Life Fund 110,736,893 6.36 249,255,888 15.89Retained within the Business - As Depreciation 122,536,063 7.04 99,446,282 6.34 - As Profits 411,645,940 23.65 370,768,584 23.64
1,740,750,872 100.00 1,568,266,885 100.00
2018%
2017Rs.
To Employees as Salaries and other benefits 29.85 27.30To Intermediaries as Commission 26.32 21.01To the Government as Taxes 6.78 5.82To Life Policyholders as increase in Life Fund 6.36 15.89Retained as Depreciation 7.04 6.34Retained as Profits 23.65 23.64
100.00 100.00
Distribution of Value Added
26.32%
6.36%
6.78%
7.04%
29.85%
23.65%
To Employees as Salaries and other benefits
To Intermediaries as Commission
To the Government as Taxes
To Life Policyholders as increase in Life Fund
Retained as Depreciation
Retained as Profits
2018
21.01%
15.89%
5.82%
6.34%
27.30%23.64%
2017

ANNUAL REPORT - 2018CO-OPERATIVE INSURANCE COMPANY203
Insurance Revenue Accounts
For the year ended 31 December2018
Rs.2017
Rs.
Non - Life insurance businessGross written premium 3,750,838,457 3,055,835,664Less: Premium ceded to reinsurers (558,940,279) (544,355,201)Net written premium 3,191,898,178 2,511,480,464Net change in reserves for unearned premium (347,458,112) (160,160,321)Net earned premium 2,844,440,065 2,351,320,143Finance income 345,556,662 261,652,873Net fair value gains/(losses) - - Policy administration fees 161,535,448 123,073,337Other operating revenue 25,154,337 22,030,734Total Other income 532,246,447 406,756,944Total revenue 3,376,686,512 2,758,077,087Gross benefits and claims incurred 2,181,895,843 1,830,737,956Claims ceded to reinsurers (255,028,531) (301,891,061)Underwriting and policy acquisition cost 140,612,881 93,500,473Other operating and administrative expenses 902,443,863 733,634,684Total expenses 2,969,924,056 2,355,982,052Operating profit from Non - Life insurance business (before interest) 371,502,457 402,095,034
Life insurance businessGross written premium 619,881,069 626,972,292Less: Premium ceded to reinsurers (45,833,169) (39,927,811)Net written premium 574,047,900 587,044,481Finance income 201,335,961 170,676,420Net realised gains/ (losses) 4,326 18,346,169Net fair value gains/ (losses) (251,200) (199,920)Other operating revenue 4,946,454 5,107,811Total other income 206,035,541 193,930,480Total revenue 780,083,442 780,974,961Gross benefits and claims incurred 222,428,887 121,573,256Claims ceded to reinsurers (17,893,571) (12,587,937)Change in contract liabilities - Life 110,736,893 249,255,888Underwriting and policy acquisition cost 98,338,985 77,109,647Other operating and administrative expenses 322,735,364 289,965,945Total other expenses 736,346,557 725,316,798Operating profit from - Life insurance business (before interest) 44,172,210 55,658,162
Reconciliation of Statement of insurance revenue accountOperating profit from Non - Life Insurance Business 371,502,457 402,095,034Surplus from Life Insurance Business 44,172,210 55,658,162Profit from operations 415,674,668 457,753,197Interest expenses (1,421,362) (3,762,299)Profit before taxation 414,253,305 453,990,898Income tax (expenses)/Reversal (3,102,128) (83,222,315)Net profit for the year 411,151,178 370,768,583
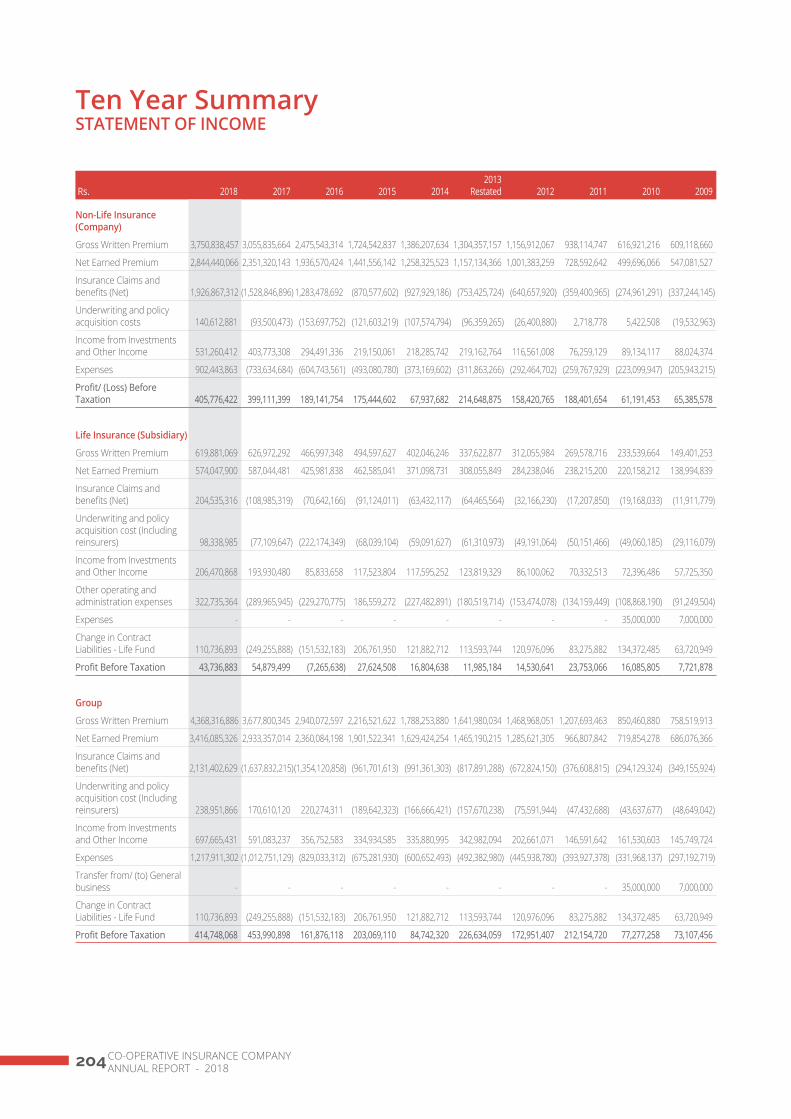
ANNUAL REPORT - 2018CO-OPERATIVE INSURANCE COMPANY204
Ten Year Summary STATEMENT OF INCOME
Rs. 2018 2017 2016 2015 20142013
Restated 2012 2011 2010 2009
Non-Life Insurance (Company)
Gross Written Premium 3,750,838,457 3,055,835,664 2,475,543,314 1,724,542,837 1,386,207,634 1,304,357,157 1,156,912,067 938,114,747 616,921,216 609,118,660
Net Earned Premium 2,844,440,066 2,351,320,143 1,936,570,424 1,441,556,142 1,258,325,523 1,157,134,366 1,001,383,259 728,592,642 499,696,066 547,081,527
Insurance Claims and benefits (Net) 1,926,867,312 (1,528,846,896) 1,283,478,692 (870,577,602) (927,929,186) (753,425,724) (640,657,920) (359,400,965) (274,961,291) (337,244,145)
Underwriting and policy acquisition costs 140,612,881 (93,500,473) (153,697,752) (121,603,219) (107,574,794) (96,359,265) (26,400,880) 2,718,778 5,422,508 (19,532,963)
Income from Investments and Other Income 531,260,412 403,773,308 294,491,336 219,150,061 218,285,742 219,162,764 116,561,008 76,259,129 89,134,117 88,024,374
Expenses 902,443,863 (733,634,684) (604,743,561) (493,080,780) (373,169,602) (311,863,266) (292,464,702) (259,767,929) (223,099,947) (205,943,215)
Profit/ (Loss) Before Taxation 405,776,422 399,111,399 189,141,754 175,444,602 67,937,682 214,648,875 158,420,765 188,401,654 61,191,453 65,385,578
Life Insurance (Subsidiary)
Gross Written Premium 619,881,069 626,972,292 466,997,348 494,597,627 402,046,246 337,622,877 312,055,984 269,578,716 233,539,664 149,401,253
Net Earned Premium 574,047,900 587,044,481 425,981,838 462,585,041 371,098,731 308,055,849 284,238,046 238,215,200 220,158,212 138,994,839
Insurance Claims and benefits (Net) 204,535,316 (108,985,319) (70,642,166) (91,124,011) (63,432,117) (64,465,564) (32,166,230) (17,207,850) (19,168,033) (11,911,779)
Underwriting and policy acquisition cost (Including reinsurers) 98,338,985 (77,109,647) (222,174,349) (68,039,104) (59,091,627) (61,310,973) (49,191,064) (50,151,466) (49,060,185) (29,116,079)
Income from Investments and Other Income 206,470,868 193,930,480 85,833,658 117,523,804 117,595,252 123,819,329 86,100,062 70,332,513 72,396,486 57,725,350
Other operating and administration expenses 322,735,364 (289,965,945) (229,270,775) 186,559,272 (227,482,891) (180,519,714) (153,474,078) (134,159,449) (108,868,190) (91,249,504)
Expenses - - - - - - - - 35,000,000 7,000,000
Change in Contract Liabilities - Life Fund 110,736,893 (249,255,888) (151,532,183) 206,761,950 121,882,712 113,593,744 120,976,096 83,275,882 134,372,485 63,720,949
Profit Before Taxation 43,736,883 54,879,499 (7,265,638) 27,624,508 16,804,638 11,985,184 14,530,641 23,753,066 16,085,805 7,721,878
Group
Gross Written Premium 4,368,316,886 3,677,800,345 2,940,072,597 2,216,521,622 1,788,253,880 1,641,980,034 1,468,968,051 1,207,693,463 850,460,880 758,519,913
Net Earned Premium 3,416,085,326 2,933,357,014 2,360,084,198 1,901,522,341 1,629,424,254 1,465,190,215 1,285,621,305 966,807,842 719,854,278 686,076,366
Insurance Claims and benefits (Net) 2,131,402,629 (1,637,832,215)(1,354,120,858) (961,701,613) (991,361,303) (817,891,288) (672,824,150) (376,608,815) (294,129,324) (349,155,924)
Underwriting and policy acquisition cost (Including reinsurers) 238,951,866 170,610,120 220,274,311 (189,642,323) (166,666,421) (157,670,238) (75,591,944) (47,432,688) (43,637,677) (48,649,042)
Income from Investments and Other Income 697,665,431 591,083,237 356,752,583 334,934,585 335,880,995 342,982,094 202,661,071 146,591,642 161,530,603 145,749,724
Expenses 1,217,911,302 (1,012,751,129) (829,033,312) (675,281,930) (600,652,493) (492,382,980) (445,938,780) (393,927,378) (331,968,137) (297,192,719)
Transfer from/ (to) General business - - - - - - - - 35,000,000 7,000,000
Change in Contract Liabilities - Life Fund 110,736,893 (249,255,888) (151,532,183) 206,761,950 121,882,712 113,593,744 120,976,096 83,275,882 134,372,485 63,720,949
Profit Before Taxation 414,748,068 453,990,898 161,876,118 203,069,110 84,742,320 226,634,059 172,951,407 212,154,720 77,277,258 73,107,456
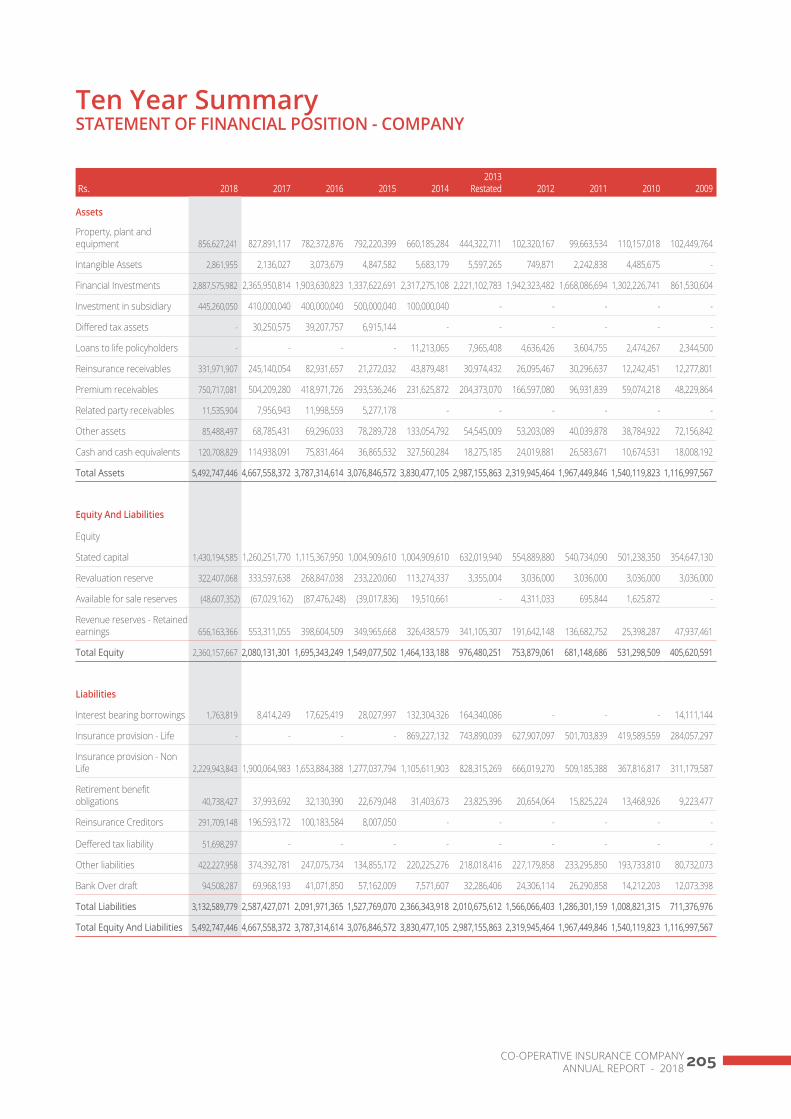
ANNUAL REPORT - 2018CO-OPERATIVE INSURANCE COMPANY205
Ten Year Summary STATEMENT OF FINANCIAL POSITION - COMPANY
Rs. 2018 2017 2016 2015 20142013
Restated 2012 2011 2010 2009
Assets
Property, plant and equipment 856,627,241 827,891,117 782,372,876 792,220,399 660,185,284 444,322,711 102,320,167 99,663,534 110,157,018 102,449,764
Intangible Assets 2,861,955 2,136,027 3,073,679 4,847,582 5,683,179 5,597,265 749,871 2,242,838 4,485,675 -
Financial Investments 2,887,575,982 2,365,950,814 1,903,630,823 1,337,622,691 2,317,275,108 2,221,102,783 1,942,323,482 1,668,086,694 1,302,226,741 861,530,604
Investment in subsidiary 445,260,050 410,000,040 400,000,040 500,000,040 100,000,040 - - - - -
Differed tax assets - 30,250,575 39,207,757 6,915,144 - - - - - -
Loans to life policyholders - - - - 11,213,065 7,965,408 4,636,426 3,604,755 2,474,267 2,344,500
Reinsurance receivables 331,971,907 245,140,054 82,931,657 21,272,032 43,879,481 30,974,432 26,095,467 30,296,637 12,242,451 12,277,801
Premium receivables 750,717,081 504,209,280 418,971,726 293,536,246 231,625,872 204,373,070 166,597,080 96,931,839 59,074,218 48,229,864
Related party receivables 11,535,904 7,956,943 11,998,559 5,277,178 - - - - - -
Other assets 85,488,497 68,785,431 69,296,033 78,289,728 133,054,792 54,545,009 53,203,089 40,039,878 38,784,922 72,156,842
Cash and cash equivalents 120,708,829 114,938,091 75,831,464 36,865,532 327,560,284 18,275,185 24,019,881 26,583,671 10,674,531 18,008,192
Total Assets 5,492,747,446 4,667,558,372 3,787,314,614 3,076,846,572 3,830,477,105 2,987,155,863 2,319,945,464 1,967,449,846 1,540,119,823 1,116,997,567
Equity And Liabilities
Equity
Stated capital 1,430,194,585 1,260,251,770 1,115,367,950 1,004,909,610 1,004,909,610 632,019,940 554,889,880 540,734,090 501,238,350 354,647,130
Revaluation reserve 322,407,068 333,597,638 268,847,038 233,220,060 113,274,337 3,355,004 3,036,000 3,036,000 3,036,000 3,036,000
Available for sale reserves (48,607,352) (67,029,162) (87,476,248) (39,017,836) 19,510,661 - 4,311,033 695,844 1,625,872 -
Revenue reserves - Retained earnings 656,163,366 553,311,055 398,604,509 349,965,668 326,438,579 341,105,307 191,642,148 136,682,752 25,398,287 47,937,461
Total Equity 2,360,157,667 2,080,131,301 1,695,343,249 1,549,077,502 1,464,133,188 976,480,251 753,879,061 681,148,686 531,298,509 405,620,591
Liabilities
Interest bearing borrowings 1,763,819 8,414,249 17,625,419 28,027,997 132,304,326 164,340,086 - - - 14,111,144
Insurance provision - Life - - - - 869,227,132 743,890,039 627,907,097 501,703,839 419,589,559 284,057,297
Insurance provision - Non Life 2,229,943,843 1,900,064,983 1,653,884,388 1,277,037,794 1,105,611,903 828,315,269 666,019,270 509,185,388 367,816,817 311,179,587
Retirement benefit obligations 40,738,427 37,993,692 32,130,390 22,679,048 31,403,673 23,825,396 20,654,064 15,825,224 13,468,926 9,223,477
Reinsurance Creditors 291,709,148 196,593,172 100,183,584 8,007,050 - - - - - -
Deffered tax liability 51,698,297 - - - - - - - - -
Other liabilities 422,227,958 374,392,781 247,075,734 134,855,172 220,225,276 218,018,416 227,179,858 233,295,850 193,733,810 80,732,073
Bank Over draft 94,508,287 69,968,193 41,071,850 57,162,009 7,571,607 32,286,406 24,306,114 26,290,858 14,212,203 12,073,398
Total Liabilities 3,132,589,779 2,587,427,071 2,091,971,365 1,527,769,070 2,366,343,918 2,010,675,612 1,566,066,403 1,286,301,159 1,008,821,315 711,376,976
Total Equity And Liabilities 5,492,747,446 4,667,558,372 3,787,314,614 3,076,846,572 3,830,477,105 2,987,155,863 2,319,945,464 1,967,449,846 1,540,119,823 1,116,997,567

ANNUAL REPORT - 2018CO-OPERATIVE INSURANCE COMPANY206
Glossary of Insurance Terms
ActuaryAn expert concerned with the application of probability and statistical theory to problems of insurance, investment, financial management and demography.
Actuarial ValuationA determination by an actuary at a specific date of the value of a life insurance company’s assets and its liabilities. The purpose of a valuation is to determine if the Company holds adequate assets to fund the Company’s liabilities.
Admissible AssetsValue of assets that are included in determining an insurer’s statutory solvency margin specified under the rules made by the Insurance Board of Sri Lanka under Regulation of Insurance Industry Act No. 43 of 2000.
AnnuityA contract that provides an income for a specific period.
Approved AssetsAssets that represent the technical reserve and the long-term insurance fund as per the determination made under Regulation of Insurance Industry Act No. 43 of 2000.
BeneficiaryA person or financial institution named by the policyholder as the recipient of the sum insured and other benefits due in the event of the policyholder’s death.
BonusBonus is a method of distribution of surplus amongst the participating policyholders of a life insurance company. A bonus is an enhancement to the basic sum assured under a contract, and is declared as a percentage of the sum assured.
BrokerA sales and service representative who handles insurance for clients, generally selling insurance of various kinds and for several companies.
ClaimsThe amount payable under a contract of insurance arising from the occurrence of an insured event such as destruction or damage of property and related death or
injuries, the insuring of hospital or medical bills, death or disability of the insured and gratuity claims.
Claims IncurredThe aggregate of all claims paid during the accounting period together with attributable claims handling expenses, where appropriate adjusted by the gross claims reserve at the beginning and end of the accounting period.
Claim Incurred But Not Reported (IBNR)A reserve to cover the expect cost of losses that have occurred by the Balance Sheet date but have not yet been reported to the insurer.
Claims Incurred But Not Enough Reported (IBNER)A reserve made in respect of to cover expected cost of losses that have occurred but no comprehensive information is available to make adequate provision as at the Balance Sheet date.
Claims Outstanding - Life InsuranceThe amounts provided to cover estimated ultimate cost of settling claims arising out of events which have been notified by the Balance Sheet date, being sums due to beneficiaries together with claims handing expenses, less amounts already paid in respect of those claims.
Claims Outstanding - Non-Life InsuranceThe amount provided to cover the estimated ultimate cost of settling claims arising out of events which have occurred by the Balance Sheet date, including IBNR and IBNER claims and claims handling expenses.
CommissionRemuneration to an intermediary for services such as selling and servicing an insurer’s products. This is one component of acquisition expenses.
Deferred Acquisition Expense ReserveExpenses which vary with and primarily related to the acquisition of new insurance contracts and renewal of existing contracts, which are deferred as they related to a period of risk subsequent to the Balance Sheet date.
Deposit PremiumA premium paid on the inception of a contract of insurance or reinsurance, which is subject to adjustment at a latter date. A deposit premium may represent the minimum amount payable.

ANNUAL REPORT - 2018CO-OPERATIVE INSURANCE COMPANY207
Earned PremiumWritten premium adjusted by the unearned premium reserve at the beginning and end of the accounting period.
EndowmentLife Insurance payable to the policyholder if living on the maturity date in the policy or to a beneficiary if the insured dies before that date.
Events Occurring after the BalanceSheet Date Those events, both favourable and unfavourable, that occurs between the Balance Sheet date and the date when the Financial Statements are authorised for issue.
Ex-gratia PaymentsA payment by an insurer to an insured for which there is no liability under the contract. In some cases an insurer may feel there has been a mistake or a misunderstanding and he may pay a claim, even though he does not appear to be liable.
Facultative ReinsuranceOldest form of reinsurance. This is the reinsurance of an individual risk on terms and conditions agreed with the reinsurer specially for that risk. Particulars of each risk are submitted by the ceding company to the reinsurer who may accept or decline at will. This is useful when dealing with risks outside the ceding company’s treaty arrangements.
Gross Claims Reserve - Non-LifeThe amount provided, including claims incurred but not reported and claims handling expenses, to cover the estimated cost, arising out of events occurred by the end of the accounting period, less amounts already paid in respect of those claims.
Gross Written Premium - LifePremium to which the insurer is contractually entitled and received in the accounting period.
Gross Written Premium - Non-LifePremium which an insurer is contractually entitled to receive from the insured in relation to contracts of insurance.
InsuranceInsurance is a contract whereby one party the insurer, in return for a consideration, i.e., the premium, undertakes to pay to the other party the insured, a sum of money or its equivalent in kind, upon the happening of a specified event that is contrary to the interest of the insured.
Insurance Provision - Non-LifeThis comprises of the gross claims reserve, unearned premium reserve net of reinsurance and the deferred acquisition expenses.
Insurance Provision - Long-TermThe fund or funds to be maintained by an insurer in respect of its longterm insurance business in accordance with Act No. 43 of 2000
Interim PaymentsPeriodic payments to the policyholders on a specific type of policy.
Life SurplusThe excess of the assets cover the liabilities as determined by the actuary (taking into account the solvency requirements) and after distribution of Bonus to policyholders.
Long-Term InsuranceCommonly referred to as life insurance contracts, as opposed to annual non-life Insurance policies.
MaturityThe time at which payment of the sum insured under a life insurance policy falls due at the end of its term.
Net AssetsTotal assets less total liabilities. Also equal to the shareholders’ equity.
Net Combined Ratio - Non-LifeThis ratio indicates the profitability of the insurer’s operations by combining the net loss ratio with net expense ratio. The combined ratio does not take account of investment income.
Formula:
(Net claims incurred + Expenses) x 100
Net earned premium

ANNUAL REPORT - 2018CO-OPERATIVE INSURANCE COMPANY208
Glossary of Insurance Terms
Net Earned PremiumGross written premium adjusted for the reinsurance incurred and for the increase or decrease in unearned premium.
Net Expense Ratio - Non-LifeA formula used by insurance companies to relate income to acquisition and administrative expenses (e.g. commissions, taxes, staff, operating expenses).
Formula:
Net Expenses x 100
Net earned premium
Net Claims Ratio - Non-LifeA formula used by insurers to relate net claims incurred to net earned premium (i.e., after deducting relevant reinsurances).
Formula:
Net claims incurred x 100
Net earned premium
Net Written PremiumGross written premium less reinsurance premium payable. Net Claims Incurred Claims incurred less reinsurance recoveries.
Policy LoansA loan given to the policyholder on the security of the surrender value of a Life Insurance policy. The loan is limited to a percentage of the current surrender value of the policy and interest is charged on such loan.
PremiumThe consideration payable by the insured for an insurance contract.
Profit CommissionCommission received from the reinsurer based on the net profit of the reinsurer as defined in the accounting period.
ReinsuranceTransfer of all or part of the risk assumed by an insurer under one or more insurance to another insurer, called the reinsurer.
Reinsurance CommissionCommission received or receivable in respect of premium paid or payable to a reinsurer.
Reinsurance PremiumThe premium payable to the reinsurer.
Revenue AccountAn account which shows a financial summary of the insurance related revenue transactions for the accounting period.
SegmentConstituent business units grouped in terms of nature and similarity of operation.
SurrenderTermination of an insurance policy by the insured before the expiry of its term (more common in life insurance).
Surrender ValueThe sum payable by an insurance company upon the surrender of a life insurance policy before it has run its full course.
Technical ReserveThis comprises of the claims reserve net of reinsurance, unearned premium reserve net of reinsurance and the deferred acquisition costs.
Title InsuranceInsurance which indemnifies the owner of real estate in the event that his clear ownership of property is challenged by the discovery of fault in the title that was passed to him.
Underwriting ResultThis is the profit generated purely from the non-life insurance business without taking into account the investment income and expenses.
Unearned PremiumIt represents the portion of premium already entered in the account as due but which relates to a period of risk subsequent to the Balance Sheet date.
Unearned Premium ReserveA fund kept by the general insurer to provide for claims that may arise in the future under insurance that are still in course.

ANNUAL REPORT - 2018CO-OPERATIVE INSURANCE COMPANY209
Contact List of CICL
NAME ADDRESS TELE. NO. FAX NO.
1 Akuressa D.C. Wanigasekara Mawatha, New Bangam Road, Akuressa 041-2284973 041-2284974041-2285574
2 Akkaraipattu Main Street, Akkaraipattu (Near the Education Office) 067-2055122 067-20551233 Ambalangoda 26B ½, Galle Road, Ambalangoda 091-2256500 091-22555814 Ambalantota 59, Main Street, Ambalantota 047-2225045 047-22255115 Aluthgama 3/160, Galle Road, Aluthgama 034-2296166 034-22961676 Ampara 16, D S Senanayake Mawatha, Ampara 063-2223122 063-22235867 Anuradhapura 08, Maithreepala Senanayake Mawatha, Anuradhapura 025-2226777-8 025-2225457
025-22275338 Agency unite No. 70, Grandpass Road, Colombo 149 Avissawella No. 35, Gem Land, Kudagama Road, Avissawella 036-2233881 036-223370410 Badulla 81, 2nd Floor, Bank Road, Badulla 055-2222620 055-222551211 Balangoda 133A 1/1, Brans Rathwaththa Mawatha, Balangoda 045-2287494 045-228843812 Batticaloa Dist. Co-op Council Bldg, Pioneer Road, Batticaloa 065-2227984 065-222884413 Bandarawela Shopping Complex, Thanthiriya, Bandarawela 057-2221657 057-222170114 Battaramulla No. 153, Pannipitiya Road, Battaramulla 011-2872791 011-287279215 Baddegama “Abeywickrama Building, No. 60, Near the Bus Stand, Baddegama 091-229441116 Bibila HNB Building, Bibila 055-226503617 Broker division No. 70, Grandpass Road, Colombo 1418 Chilaw No. 05, Bauddaloka Mawatha, Chilaw 032-2224745 032-222036019 City No. 327, Ceyesta Bld, Galle Road, Colombo 03 011-2372384 011-2577245
011-237237020 Corporate division No. 70, Grandpass Road, Colombo 1421 Corporate Branch No. 70, Grandpass Road, Colombo 14 011-2337427 011-2337449
011-243239422 Colo. Metropoliton No. 327, Ceyesta Bld, Galle Road, Colombo 03 011-2372763 011-237276423 Dambulla No. 719 (717), Anuradhapura Road, Dambulla 066-2285624 066-228562524 Dankotuwa Dankotuwa MPCS Building, Dankotuwa 031-226568525 Deniyaya No. 98/02, Near the Bridge, Main Street, Deniyaya 041-2273353 041-227351926 Dehiwala No. 11, Galle Road, Mount Lavinia 011-2725265 011-272526127 Elpitiya Elpitiya M P C S Bldg, Pituwala Road, Elpitiya 091-2297019 091-229709528 Embilipitiya 66 1/1, Pallegama Road, Embilipitiya 047-2230177 047-226139429 Galle 36, Sri Dewamiththa Mawatha, China Garden, Galle 091-2227688 091-2227687
091-223225830 Galewela No. 45, Kalawewa Road, Galewela 066-2287282 066-228728331 Gampaha No. 114/1/1, Bauddaloka Mawatha, Gampaha 033-2248600
033-2231618 033-223112232 Gampola Gampola MPCS Bldg, 1/78, Kandy Road, Gampola 081-2077121 081-207712233 Giriulla No. 105/B, 1st Floor, Negombo Road, Giriulla 037-2288710 037-228871134 Hatton No. 245, Dimbulla Road, Hatton 051-2225146 051-222517535 Homagama 77, High Level Road, Homagama 011-2895270-1 011-2855392
011-2748307011-2098740
36 Ja-Ela No. 68, Negombo Road, Kandana 011-2234817 011-223481637 Horana No. 257, Rathnapura Road, Horana 034-2260310 034-226044438 Jaffna No. 570, Hospital Road, Jaffna 021-2224561 021-221749539 Kadawatha 645/G/2, Bandarawaththa, Kandy Road, Kadawatha 011-2927501 011-292750240 Kalawana 1st Floor, No. 76, Mathugama Road, Kalawana 045-2256033 045-225608840 Kaduwela No. 51, Avissawella Road, Kaduwela 011-2548544 011-254866641 Kaluthara 219/3, Galle Road, Kaluthara 034-2238131-2 034-222345042 Kandy 100/2/1, Vindana Learner’s Bldg, Yatinuwara Veediya, Kandy 081-2205661/3 081-220205543 Katugastota No. 288A, Katugastota Road, Kandy 081-2226687 081-222668844 Kalmunai No. 122, Main Street, Kalmunai 067-2059996 067-205999745 Kamburupitiya Sub Kamburupitiya MPCS Bldg, Kamburupitiya 041-229449546 Karapitiya 249/A2, Labuduwa Road, Karapitiya 091-2228586 091-222871147 Kegalle No. 261/1, Kandy Road, Kegalle 035-2221461 035-223191148 Kekirawa 12, Dambulla Road, Kekirawa 025-2265333 025-226533249 Kelaniya 369, Kandy Road, Peliyagoda 011-2918312 011-291831150 Kolonnawa No. 166, Kolonnawa Road, Kolonnawa 011-2533372 011-253337351 Kiribathgoda 67 D/3, Kandy Road, Kiribathgoda 011-2907858 011-290785952 Kilinochchi C/O Pillaiyar Arul Vanachcholai, A9 Road, Kilinochchi 021-2285790 021-228579153 Kuliyapitiya No. 285, Madampe Road, Kuliyapitiya 037-2282249 037-228224854 Kirindiwela 27/16/1, Nugahena Waththa, Kirindiwela 033-2253100 033-225310155 Kurunegala 13 1/1, Rajapihilla Road, Kurunegala 037-2233601-2 037-2221749
Our Branch Network

ANNUAL REPORT - 2018CO-OPERATIVE INSURANCE COMPANY210
Contact List of CICL Branch Network
NAME ADDRESS TELE. NO. FAX NO.
56 Maharagama 218A 1/1, High Level Road, Maharagama 011-2845144 011-2843422011-2089007011-2089010
59 Mahiyanganaya Sub Mahiyangana M P C S Ltd., Mahiyanganaya 055-225745160 Malabe 878/B, Athurugiriya Road, Malabe 011-2156045 011-2742058
011-274250161 Mathugama No. 203, Agalawaththa Road, Mathugama 034-2240972 034-224097362 Mannar No. 45, Hospital Road, Mannar 023-2250833 023-225168263 Matale No. 577, Trincomalee Street, Matale 066-2224498 066-223222264 Melsiripura Near the Fuel Station, Dambulla Road, Melsiripura 037-225018365 Matara 45A/2, Anagarika Dharmapala Mawatha, Matara 041-2234701-2 041-223064966 Minuwangoda No. 39 1/1, Airport Road, Minuwangoda 011-2299151 011-228804467 Metro No. 327, Ceyesta Bld, Galle Road, Colombo 03 011-2372763 011-237276468 Monaragala 210, Wellawaya Road, Monaragala 055-2277534 055-2276113
055-227740169 Moratuwa 177 2/1, New Galle Road, Moratuwa 011-2644891 011-2644893
011-264905470 Negombo No. 160/A, Thaladuwa Road, Negombo 031-2222426 031-222827071 Nelliady No. 82, Point Pedro Road, Nelliady, Karaveddy 021-226573772 Neluwa Manuka Building, Dellawa Road, Neluwa 091-2285410 091-228541173 Nikaweratiya No. 79, Maho Road, Nikaweratiya 037-2260946 037-2260994
037-226099574 Nittambuwa No. 48/4, Kandy Road, Nittambuwa 033-2246294 033-228774875 Nugegoda No. 36, Nawala Road, Nugegoda 011-2890851 011-289085076 Nuwara Eliya 72, Park Road, Nuwara Eliya 052-2235570 052-222281177 Nugegoda South 272/B, High Level Road, Jambugasmulla 011-2814234 011-281425478 Pelmadulla No. 118, Main Street, Pelmadulla 045-2276216 045-227473279 Panadura No. 36A, Cyril Janz Mawatha, Panadura 038-2234133 038-223493380 Piliyandala No. 165, Moratuwa Road, Piliyandala 011-2615702 011-261570181 Polonnaruwa No. 292/1, Batticaloa Road, Polonnaruwa 027-2226880 027-222731082 Pottuvil Main Street, Pottuvil 063-2248858 063-224885983 Postal Division No. 70, Grandpass Road, Colombo 1484 Puttalam No. 114/1, Kurunegala Road, Puttalam 032-2267211 032-226733685 Rikillagaskada MPCS Building, Ragala Road, Rikillagaskada 081-2071622 081-207133086 Rathnapura Coop House, Bandaranayake Mawatha, Rathnapura 045-2222983-4
045-2221042 045-222533587 Trincomalee No. 316, Inner Harbor Road, Trincomalee 026-2226751 026-222112688 Siyambalanduwa Sub Siyambalanduwa Ethimale M P C S Ltd., Dombagahawela 055-227912389 Thalawathugoda No. 1136, Pannipitiya Road, Thalawathugoda 011-2774261 011-277426290 Thambuttegama No. 141, Kurunegala Road, Business Town, Thambuttegama 025-2275689 025-227568891 Thissamaharama Medaweediya, New Town, Thissa 047-2239820 047-4545559
047-3221115047-3221116
92 Vauniya 2nd Floor, Sathya Bld, 1st Cross Street, Vavuniya 024-2225536-7 024-222412293 Wariyapola 92/A, Puttalam Road, Wariyapola 037-2268206 037-226820594 Walasmulla No. 60, Beliatta Road, Walasmulla95 Wellawaya No. 167, Tissa Road, Wellawaya 055-227421496 Welimada 115/1, Badulla Road, Welimada 057-2245627 057-224562897 Welligama Sub No. 172/B, Hettiweediya, Weligama 041-225493598 Wennappuwa Wenco Super Market, Chilaw Road, Wennappuwa 031-2253541 031-2253363
031-224500099 Warakapola Sub Warakapola MPCS Building, Warakapola 035-2269575
REGIONAL OFFICESREGIONAL OFFICE FOR GENERAL INSURANCE
REGION REGIONAL OFFICE ADDRESS TELE. NO. MOBILE NO.
1 Colombo (North) Ceyesta Building, No. 327, Galle Road, Colombo 03 011-2675469 071-68407902 Colombo (South) 77, High Level Road, Homagama 011-28952713 ARM (Gampaha) 114/1/1, Bauddaloka Mawatha, Gampaha 033-2238574 071-68407814 North Central 08, Maithreepala Senanayake Mawatha, Anuradhapura 025-2227429 071-45629925 North 2nd Floor, Sathya Bld, 1st Cross Street, Vavuniya 024-22280356 Southern 45A/2, Anagarika Dharmapala Mawatha, Matara 041-22347037 ARM Kurunegala 13 1/1, Rajapihilla Road, Kurunegala 037-2226370

ANNUAL REPORT - 2018CO-OPERATIVE INSURANCE COMPANY 211
Contact List of Cooplife Branch Network
NAME ADDRESS TELE. NO. FAX NO.
1 Akuressa D.C. Wanigasekara Mawatha, New Bangam Road, Akuressa 041-2285564 041-22848782 Ambalangoda 26B ½, Galle Road, Ambalangoda 091-22558753 Ambalantota 59, Main Street, Ambalantota 047-22253464 Ampara 16, D S Senanayake Mawatha, Ampara 063-2222887 063-22228775 Anuradhapura No. 521/116, II Part, 7th Avenue, Anuradhapura 025-2227638 025-22276376 Avissawella No. 35, Gem Land, Kudagama Road, Avissawella 036-22348627 Badulla 81, 2nd Floor, Bank Road, Badulla 055-2231692 055-22316938 Balangoda 133A 1/1, Brans Rathwaththa Mawatha, Balangoda 045-22895229 Batticaloa Dist. Co-op Council Bldg, Pioneer Road, Batticaloa 065-2229896 065-222987510 Chilaw No. 05, Bauddaloka Mawatha, Chilaw 032-2224252 032-222426311 Dambulla No. 719 (717), Anuradhapura Road, Dambulla 066-2285377 066-228547712 City Office Ground Floor, “Co-op House”, No. 455, Galle Road, Colombo 03 011-2504801 011-250480213 Embilipitiya 66 1/1, Pallegama Road, Embilipitiya 047-2262162 047-226216314 Galle 36, Sri Dewamiththa Mawatha, China Garden, Galle 091-2223155 091-222329515 Gampaha No. 114/1/1, Bauddaloka Mawatha, Gampaha 033-2248601 033-223161716 Homagama 79/1, High Level Road, Homagama 011-2893916 011-289542417 Horana No. 257, Rathnapura Road, Horana 034-2265984 034-226598518 Jaffna No. 570, Hospital Road, Jaffna 021-2228071 021-221749619 Kaluthara 358/A, Kaluthara North, Kaluthara 034-223825220 Kandy No. 45/3/1, Katugastota Road, Kandy 081-2223440 081-220566221 Kegalle No. 261/1, Kandy Road, Kegalle 035-2231912 035-222221522 Kekirawa 12, Dambulla Road, Kekirawa 025-2264995
025-2265945 025-226499623 Kiribathgoda 67 D/3, Kandy Road, Kiribathgoda 011-2907920 011-298733224 Kilinochchi C/O Pillaiyar Arul Vanachcholai, A9 Road, Kilinochchi 021-228579225 Kuliyapitiya No. 194, Main Street, Kuliyapitiya 037-2281630 037-228163326 Kurunegala 11 1/1, Rajapihilla Road, Kurunegala 037-2221915
037-2225463 037-222546227 Maharagama 218A 2/1, High Level Road, Maharagama 011-2088744 011-208950828 Malabe 894/4A, Athurugiriya Road, Malabe 011-2077454 011-218584129 Mannar No. 45, Hospital Road, Mannar 023-2251336 023-225168130 Matale No. 577, Trincomalee Street, Matale 066-2224499 066-223222231 Matara 45A/2, Anagarika Dharmapala Mawatha, Matara 041-223776532 Metro 60/1/1, Maligawaththa New Road, Colombo 10 011-2554358 011-255435733 Monaragala 72, Wellawaya Road, Monaragala 055-2276155 055-227753334 Moratuwa 177 2/1, New Galle Road, Moratuwa 011-2644841 011-264451035 Negombo No. 160/A, Thaladuwa Road, Negombo 031-2228446 031-223032036 Nelliady No. 82, Point Pedro Road, Karaveddi, Nelliadi 021-2261351 021-226494537 Nikaweratiya No. 79, Maho Road, Nikaweratiya 037-2260996
037-2260945 037-226092338 Nuwara Eliya 72, Park Road, Nuwara Eliya 052-2235590 052-223559439 Polonnaruwa No. 292/1, Batticaloa Road, Polonnaruwa 027-2226696 027-222731140 Puttalam No. 114/2, Kurunegala Road, Puttalam 032-2265292 032-226536641 Rathnapura No. 22, Kiriella Bld, Panadura Road, Moragahayata, Rathnapura 045-2233237 045-223323842 Trincomalee No. 316, Inner Harbor Road, Trincomalee 026-2062121 026-206212243 Vauniya 2nd Floor, Sathya Bld, 1st Cross Street, Vavuniya 024-2227961 024-222796244 Wennappuwa Wenco Super Market, Chilaw Road, Wennappuwa 031-2255910
REGIONAL OFFICE FOR LIFE INSURANCEREGION REGIONAL OFFICE ADDRESS TELE. NO. MOBILE NO.
1 Nikaweratiya No. 81, Maho Road, Nikaweratiya 037-22603212 North No. 521/116, II Part, 7th Avenue, Anuradhapura 025-2227638 071-38421783 East 81, 2nd Floor, Bank Road, Badulla 055-2231694 071-75463904 Southern 36, Sri Dewamiththa Mawatha, China Garden, Galle 091-2223295 071-45411635 DGM - SSU Zone 1 13 1/1, Rajapihilla Road, Kurunegala 071-6810926

ANNUAL REPORT - 2018CO-OPERATIVE INSURANCE COMPANY212
Notice of Annual General Meeting
Notice is hereby given that the 21st Annual General Meeting of Co-operative Insurance Company Limited is convened on July 07, 2019 at “Grand Monarch Hotel, 527/7, Borella Road, Thalawathugoda at 10.00 a.m. when the following ordinary business will be transacted.
1. To receive and adopt the Report of the Directors and the Statement of Accounts for the year ended 31st December 2018 with the Report of the Auditor’s thereon.
2. To declare a dividend of Rs. 1.25 per share as the final dividend for the financial year 2018 subject to the recommendation of Insurance Regulatory Commission of Sri Lanka to be paid as follows.
y 50% to be paid by cash
y 50% to be paid by distribution of ordinary shares of Rs. 15/- each as provided in clause 122 of the Articles of Association
3. To appoint Jayasinghe and Company., Chartered Accountants, as auditors of the company for the financial year ending December 31, 2019 and to authorise the Board of Directors to determine their remuneration.
4. To appoint new Directors to fill three vacancies created as a result of the rotation of three directors, Mr. P.P.D.S. Kularathna, Mr. C.P. Jayasinghe and Mr. K.S.S. Weerasekara in terms of the Article 95,96 and 97 of the Articles of Association of the company.
By Order of the Board,
Business Management Services Ltd.Secretaries to the Company
June 07, 2019
Notes1. A member is entitled to appoint a proxy to attend
and vote on behalf of him/her. One ordinary share carries one voting right. If a member is a corporate body, its representative must be appointed by a proxy.
2. A proxy need not be a member of the company.
3. A proxy form is enclosed for this purpose.
4. The completed proxy form should be deposited at the Head office of the company at No. 74/5, Co-operative Insurance House, Grandpass Road, Colombo 14 or at the office of the secretaries, Business Management Services Limited, No. 94 1/2, York Street, Colombo 01 not less than 48 hours before holding of the meeting.

ANNUAL REPORT - 2018CO-OPERATIVE INSURANCE COMPANY 213
Notes

ANNUAL REPORT - 2018CO-OPERATIVE INSURANCE COMPANY214
Notes

ANNUAL REPORT - 2018CO-OPERATIVE INSURANCE COMPANY 215
Form of Proxy
I/We .…………...............................................…..........................................…..………........................................................................................... of
………………………………………………………….………………………………………….....….………………………………...…. being member / members of
CO-OPERATIVE INSURANCE COMPANY LIMITED, hereby appoint ….…………………………………………………………………………………
NIC No. ………………………………………………………………… of ………………………………………………………………………….….. as my / our proxy
to represent me / us and vote on my / our behalf at the 21st Annual General Meeting of the company to be held at
“Grand Monarch Hotel, No. 527/7, Borella Road, Thalawathugoda on July 07, 2019 at 10.00 a.m. and at any adjournment
thereof, and every poll which may be taken in consequence thereof.
Signed this ………………………………….………………………. day of ………………………………….………………………. two thousand nineteen.
…………………………………….…….…….Signature of shareholder
…………………………………….…….…….Signature of participant
INSTRUCTIONS AS TO COMPLETION1. Please perfect the form of proxy by filling in legibly your full name and address, signing in the space provided and
filling in the date of signature.
2. If the appointer is a company or corporation, the form of proxy should be executed under its common seal or by a duly authorised officer of the company or corporation in accordance with its articles of association or constitution.
3. The completed form of proxy should be deposited at the registered office of the company at No. 74/5, Co-operative Insurance House”, Grandpass Road, Colombo 14 or at the office of the secretaries, Business Management Services Limited 94 ½, York Street, Colombo 01 not less than 48 hours before holding of the meeting.

ANNUAL REPORT - 2018CO-OPERATIVE INSURANCE COMPANY


![THE DISTINCTIVENESS OF A FASHION MONOPOLY - …jipel.law.nyu.edu/wp-content/uploads/2015/05/NYU_JIPEL_Vol-3-No-1... · Acquired Distinctiveness ... 2013] THE DISTINCTIVENESS OF A](https://img.pdfslide.us/doc/110x75/5af7d8f87f8b9a9e59914356/the-distinctiveness-of-a-fashion-monopoly-jipellawnyueduwp-contentuploads201505nyujipelvol-3-no-1acquired.jpg)