Embed Size (px)
Citation preview
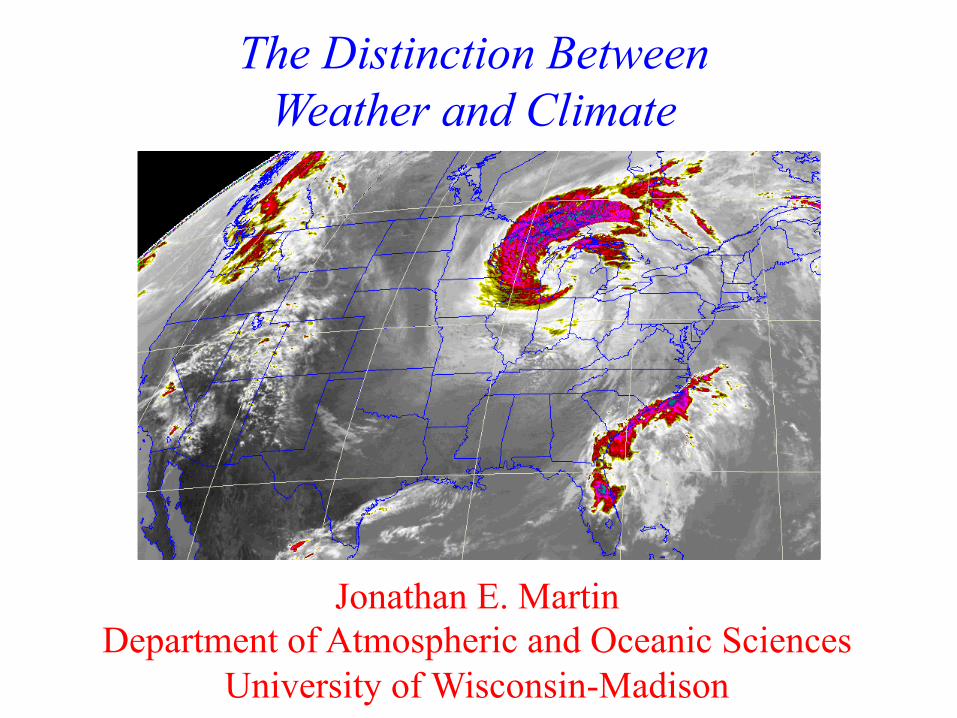
The Distinction Between Weather and Climate
Jonathan E. Martin Department of Atmospheric and Oceanic Sciences
University of Wisconsin-Madison
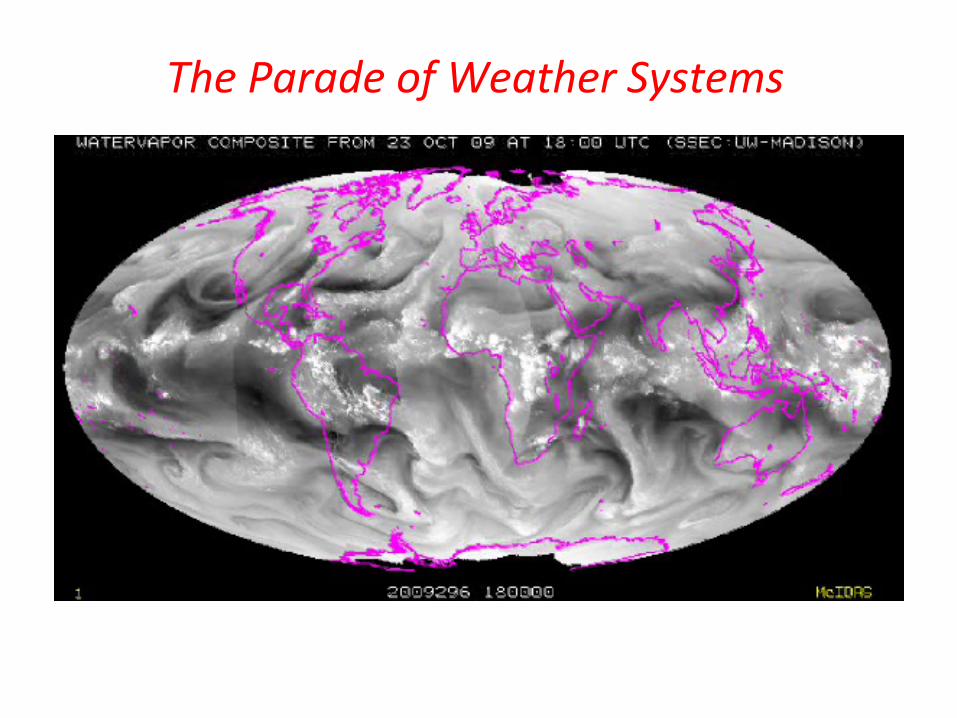
The Parade of Weather Systems
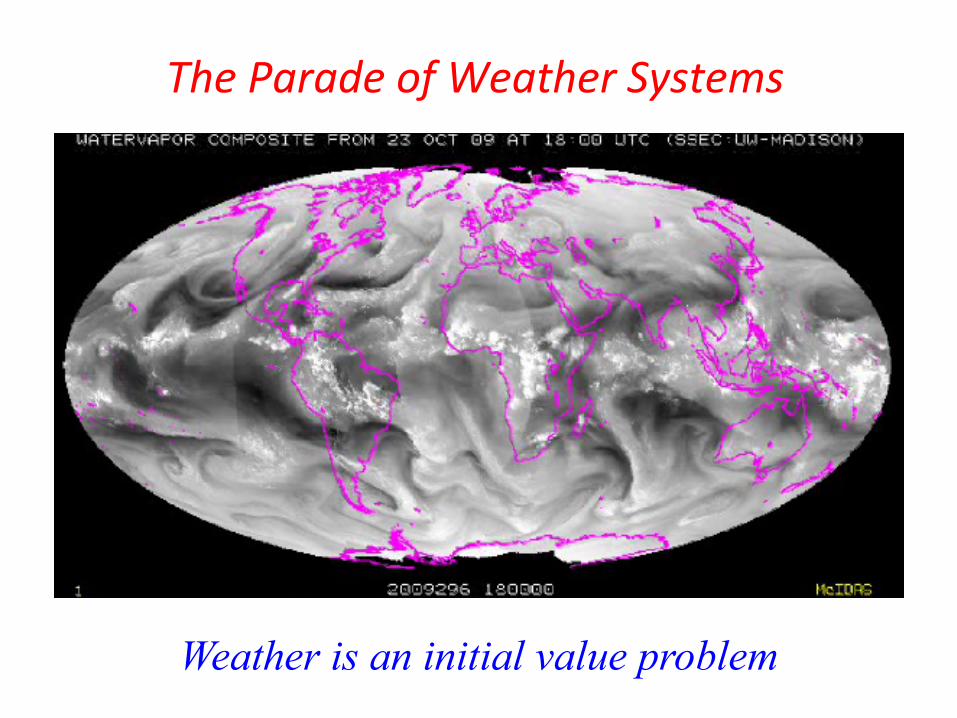
The Parade of Weather Systems
Weather is an initial value problem
What is Climate?
“ . . represents a composite of day-‐to-‐day weather condi8ons . . is more than ‘average weather’ . .” (Trewartha and Horn, 1980)
“Climate is the synthesis of the weather in a par8cular region”
(Hartmann, 1994)
“ . . understood to imply the ensemble of events at a loca8on . . As represented by the mean value and appropriate sta8s8cs of the
frequency distribu8ons of weather elements.” (Barry and Carleton, 2001)
“ . . mean state of the atmosphere and related components of the Earth system . .” (Wallace and Hobbs, 2006)
“Climate is the thermodynamic/hydrodynamic status of the global boundary condi8ons that determine the concurrent array of weather
paCerns.” (Bryson, 1997)
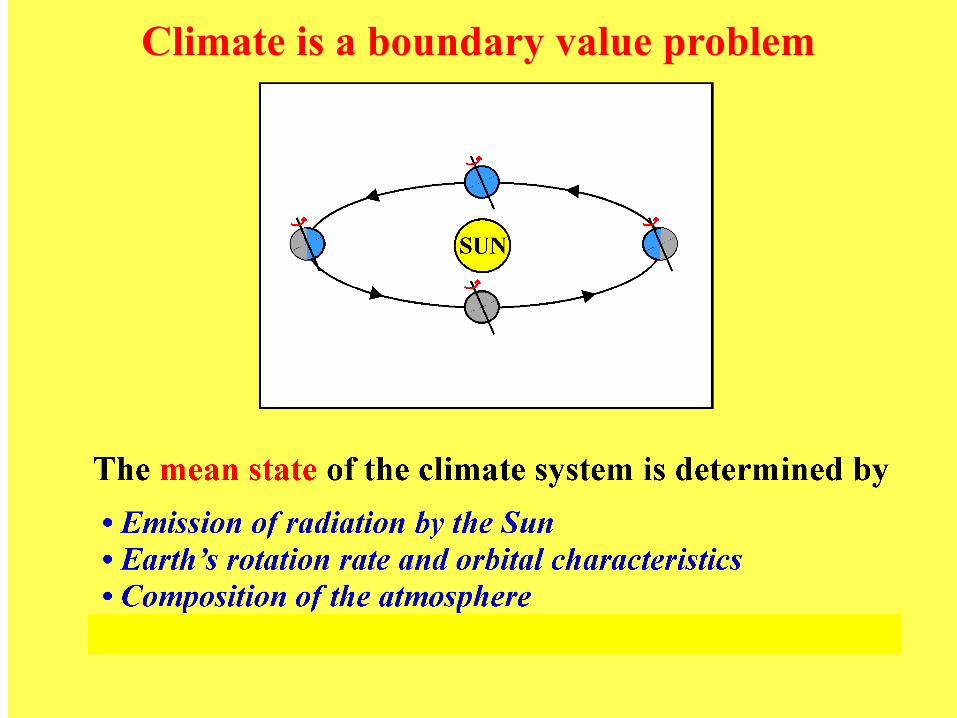
Climate is a boundary value problem

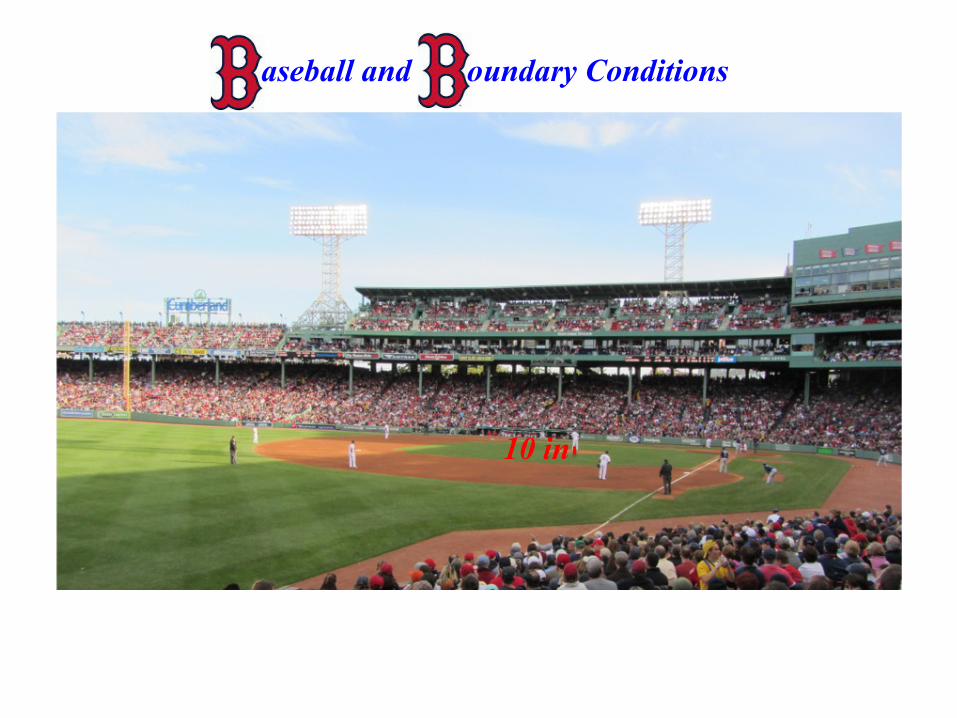
aseball and oundary Conditions

aseball and oundary Conditions
90 ft

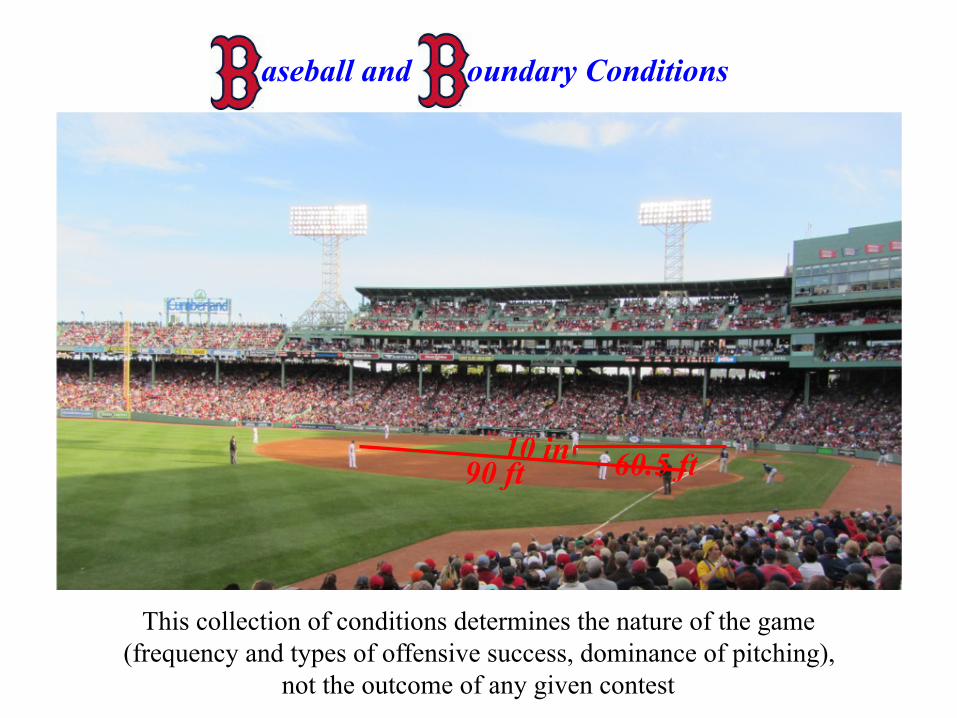
aseball and oundary Conditions
60.5 ft
aseball and oundary Conditions
10 in
aseball and oundary Conditions
90 ft 60.5 ft 10 in
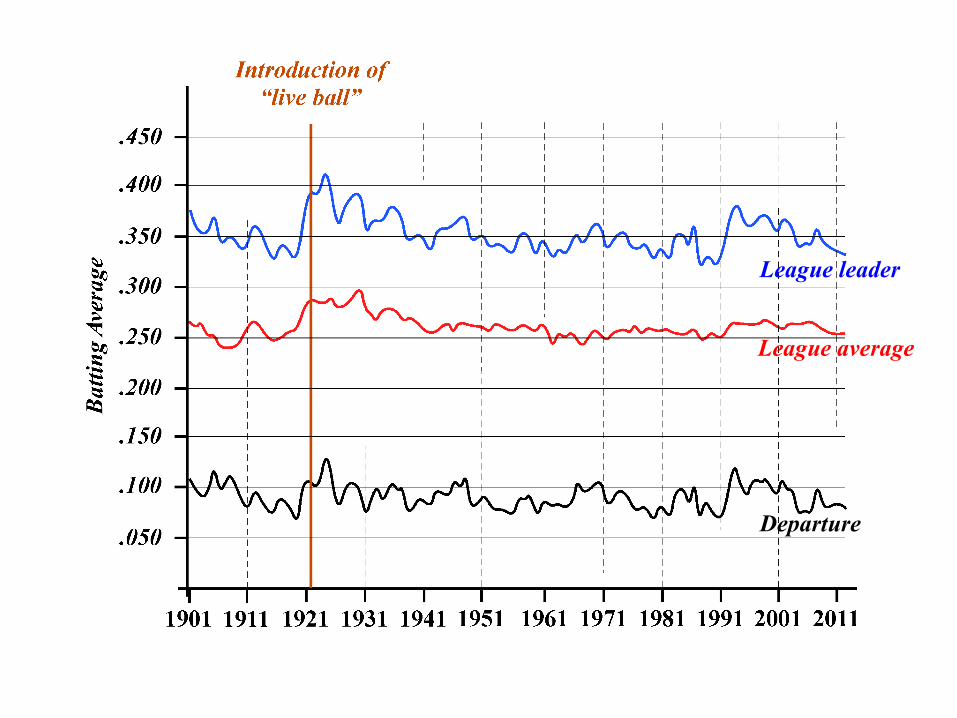
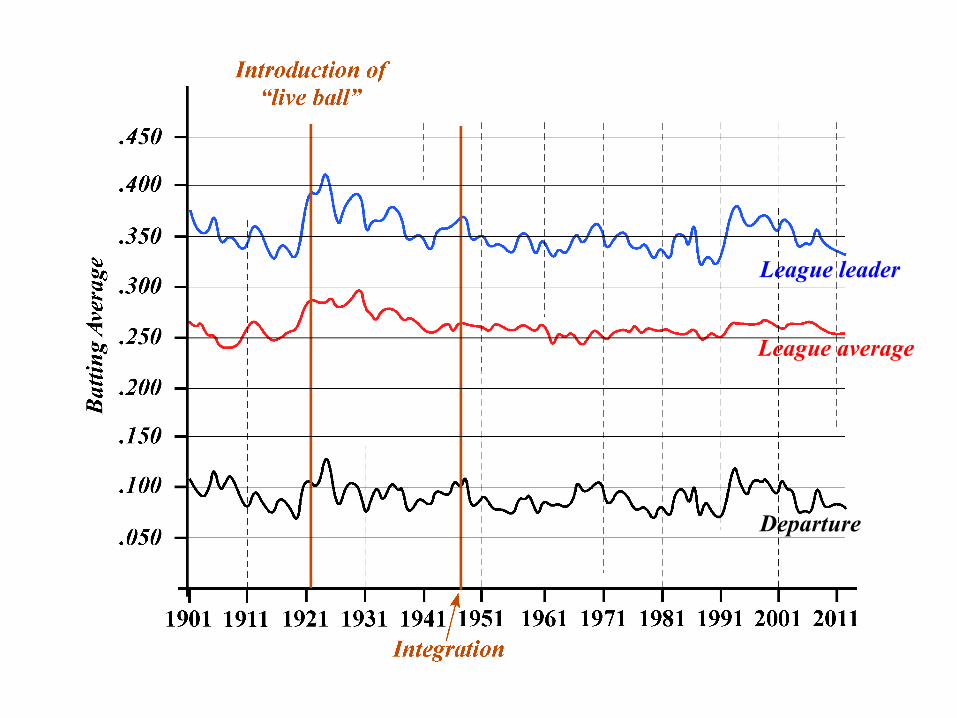
This collection of conditions determines the nature of the game (frequency and types of offensive success, dominance of pitching),
not the outcome of any given contest
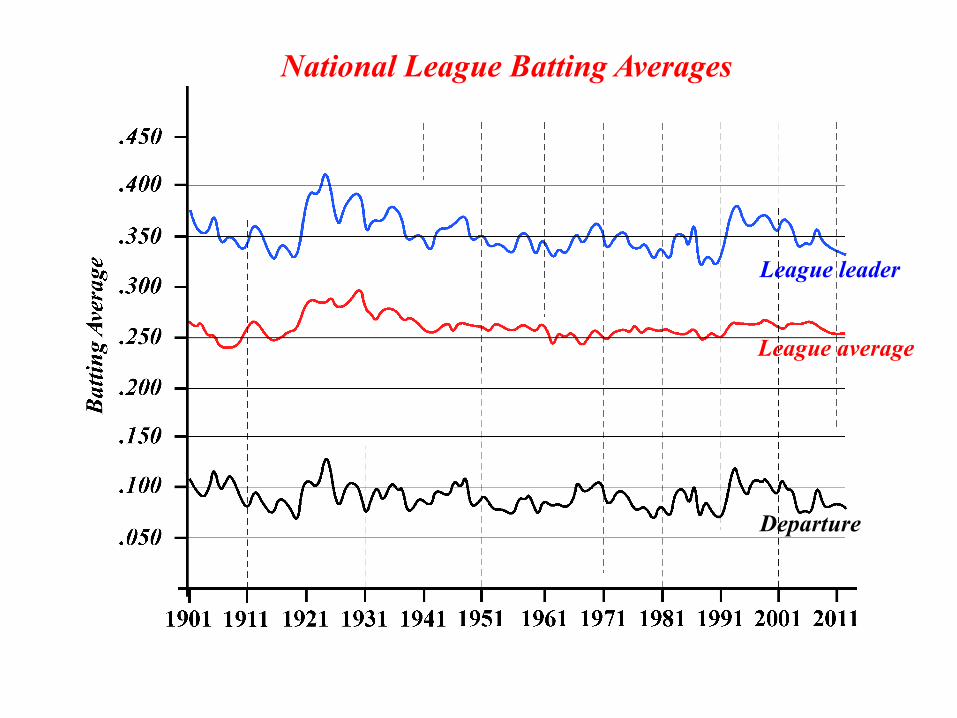
League average
League leader
Departure
National League Batting Averages
League average
League leader
Departure
League average
League leader
Departure

League average
League leader
Departure

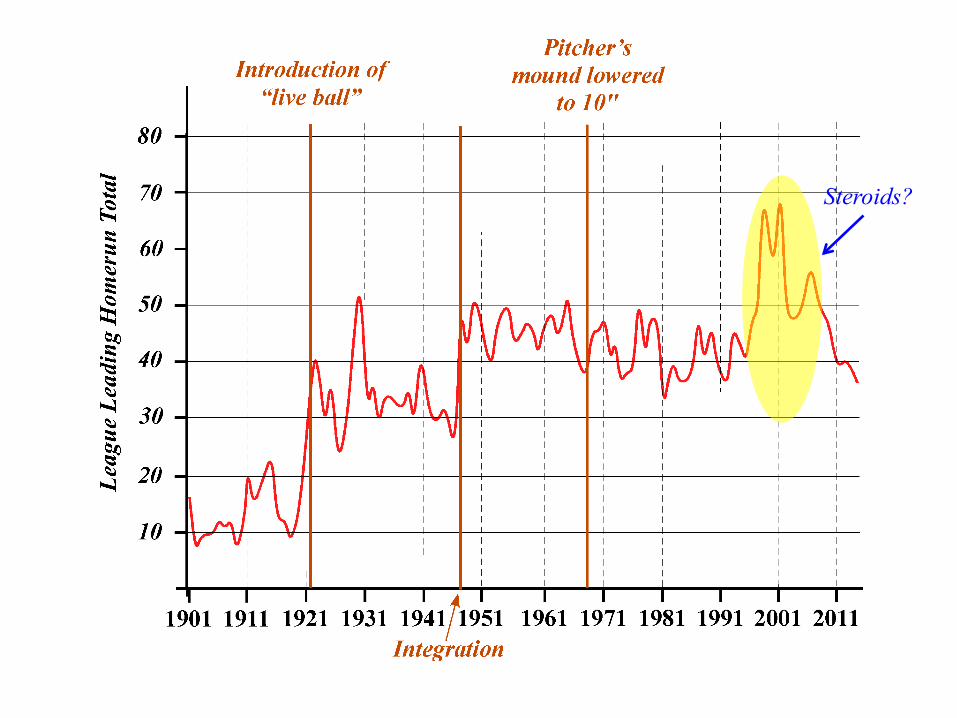
Steroids?
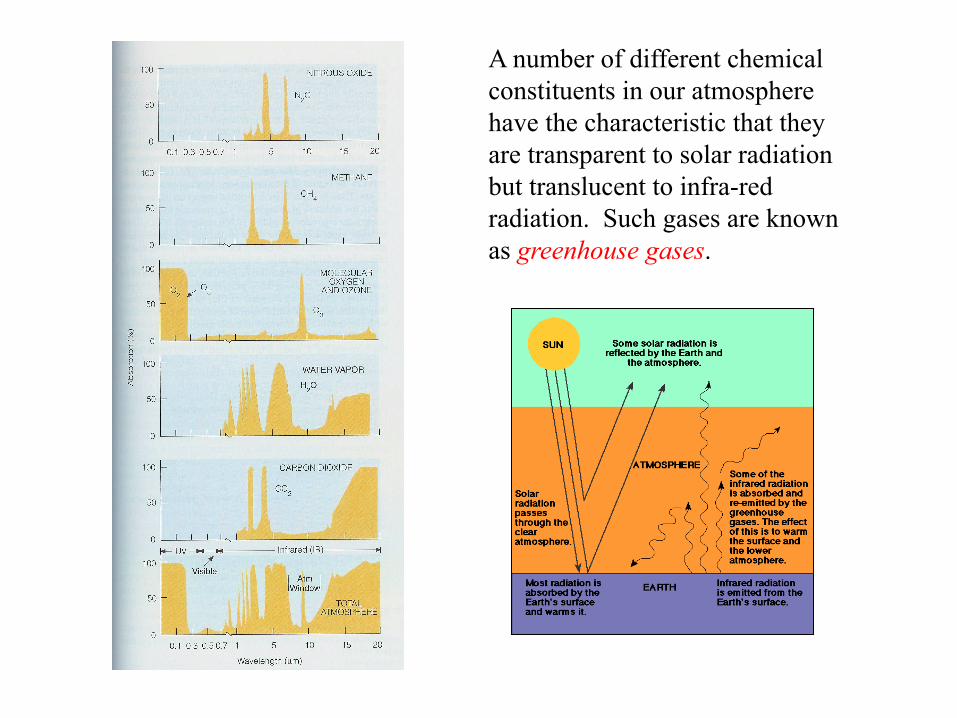
A number of different chemical constituents in our atmosphere have the characteristic that they are transparent to solar radiation but translucent to infra-red radiation. Such gases are known as greenhouse gases.
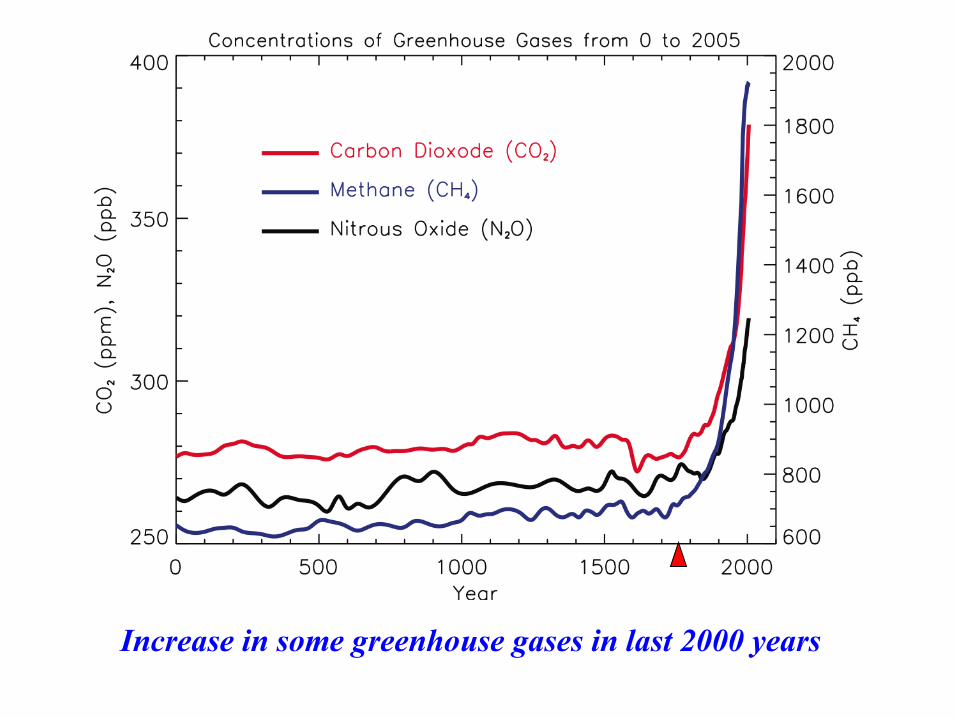
Increase in some greenhouse gases in last 2000 years
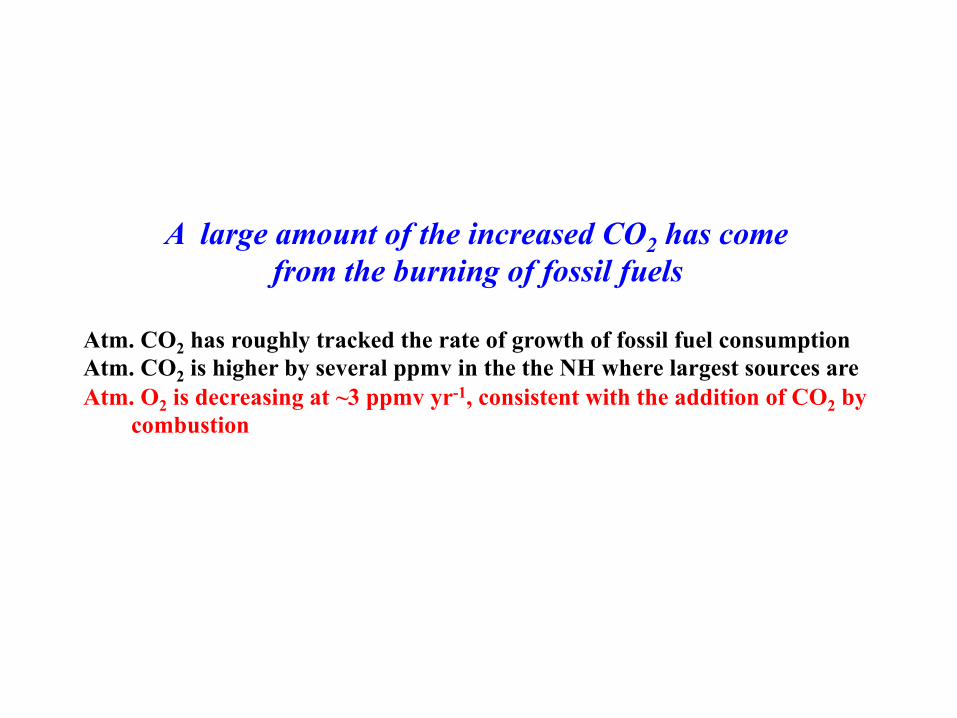
A large amount of the increased CO2 has come from the burning of fossil fuels
Atm. CO2 has roughly tracked the rate of growth of fossil fuel consumption Atm. CO2 is higher by several ppmv in the the NH where largest sources are Atm. O2 is decreasing at ~3 ppmv yr-1, consistent with the addition of CO2 by
combustion
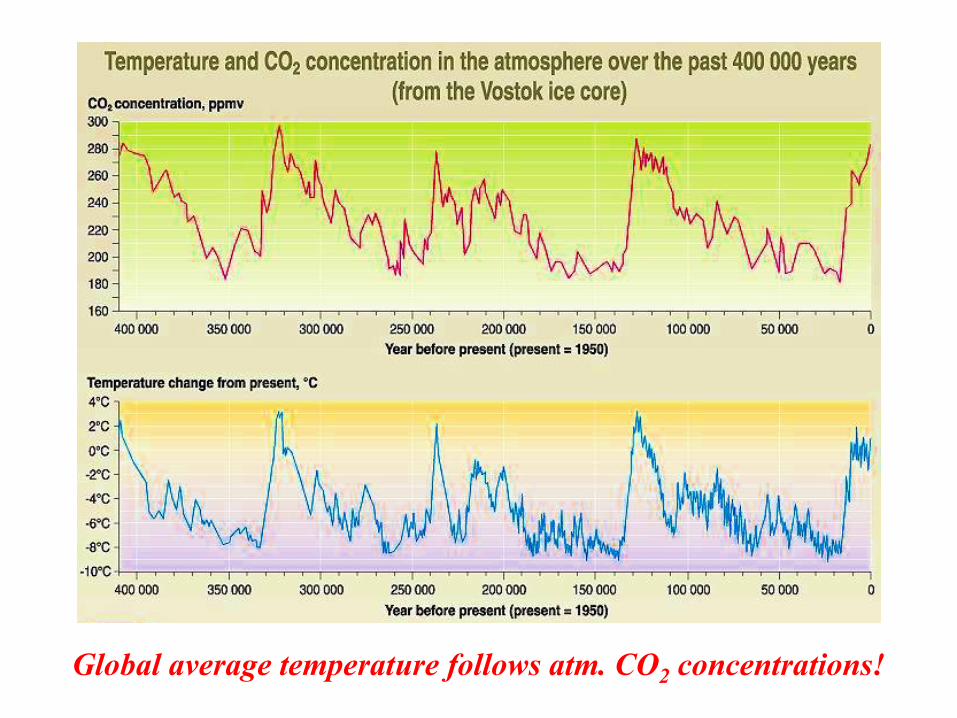
Global average temperature follows atm. CO2 concentrations!
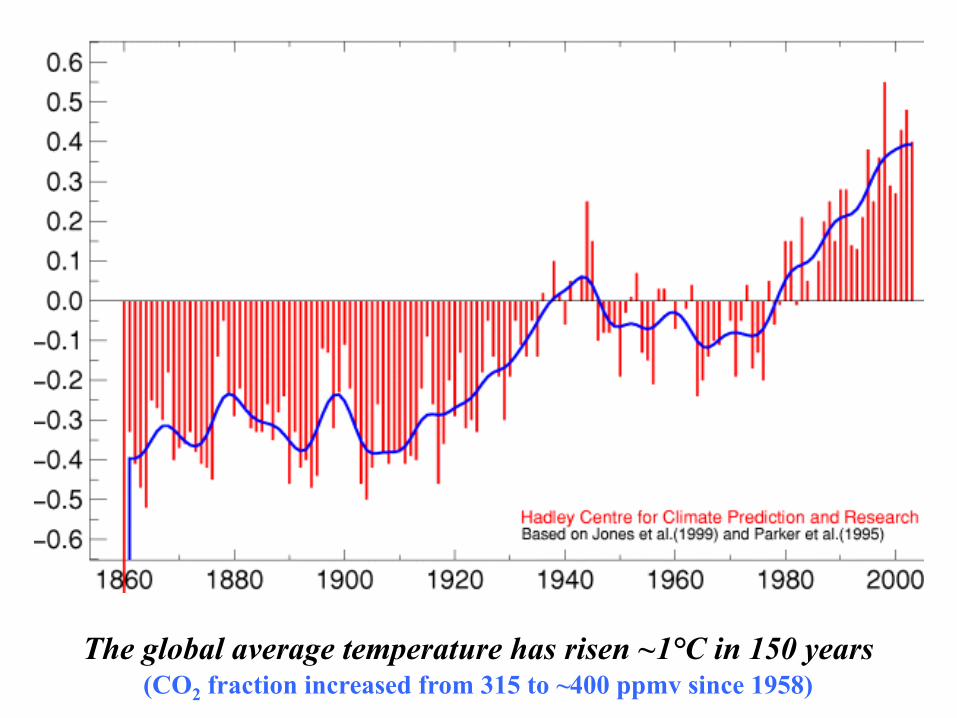
The global average temperature has risen ~1°C in 150 years (CO2 fraction increased from 315 to ~400 ppmv since 1958)
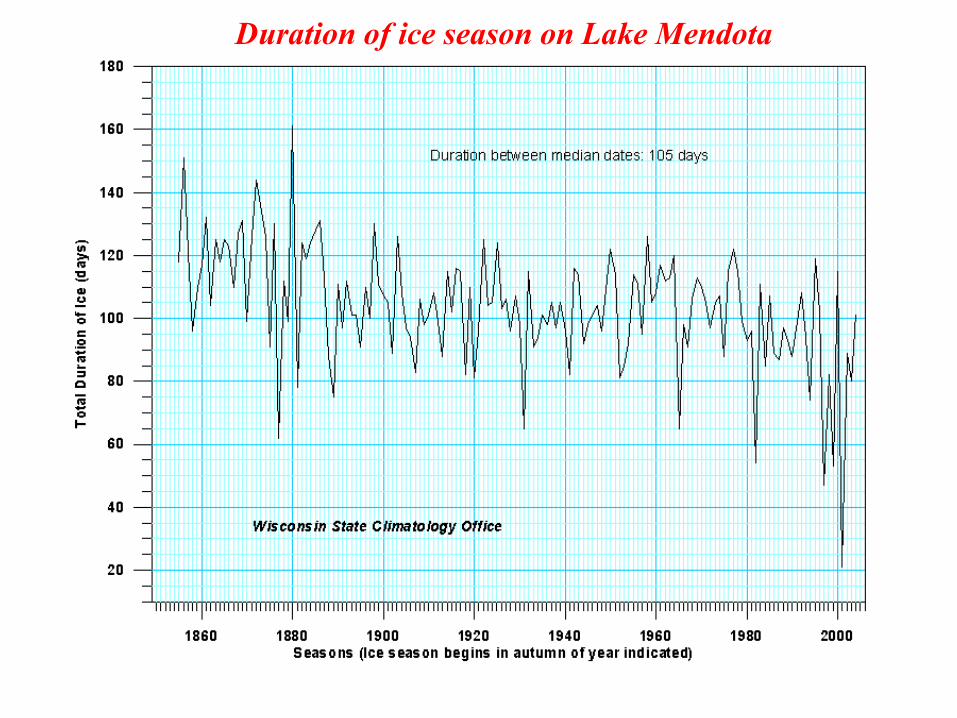
Duration of ice season on Lake Mendota
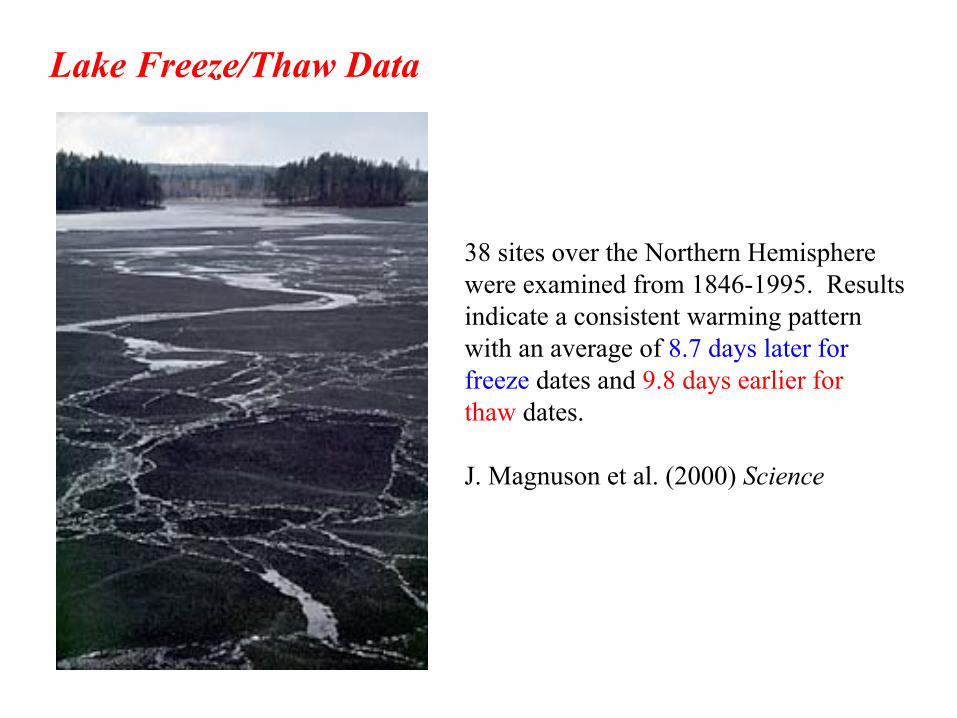
Lake Freeze/Thaw Data
38 sites over the Northern Hemisphere were examined from 1846-1995. Results indicate a consistent warming pattern with an average of 8.7 days later for freeze dates and 9.8 days earlier for thaw dates. J. Magnuson et al. (2000) Science

Trends in the Lower Tropospheric Wintertime Cold Pool Over the Past 65 Years
Areal extent of -5°C air at 850 hPa
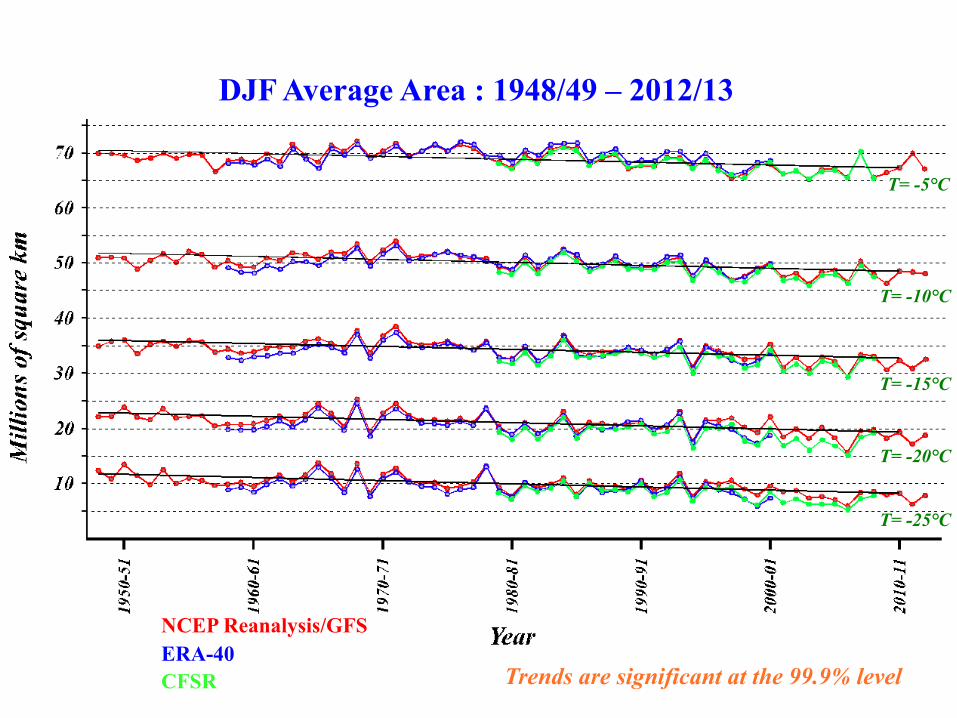
DJF Average Area : 1948/49 – 2012/13
NCEP Reanalysis/GFS ERA-40 CFSR Trends are significant at the 99.9% level
T= -5°C
T= -15°C
T= -25°C
T= -20°C
T= -10°C

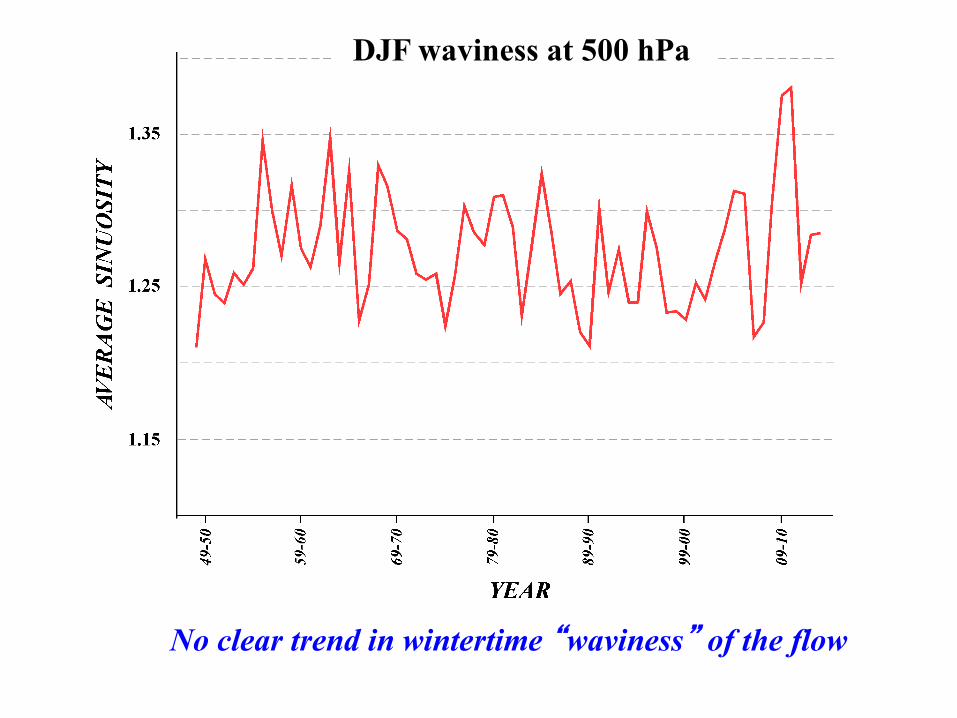
No clear trend in wintertime “waviness” of the flow
DJF waviness at 500 hPa
Climate is colloquially thought of as the statistics of the day-to-day weather

Climate is colloquially thought of as the statistics of the day-to-day weather
Climate bounds the array of possible meteorological phenomena that the atmosphere can deliver
Climate is colloquially thought of as the statistics of the day-to-day weather
Climate bounds the array of possible meteorological phenomena that the atmosphere can deliver
Thus, the likelihood, but not the occurrence, of extreme weather events is determined by the climate
Climate is colloquially thought of as the statistics of the day-to-day weather
Climate bounds the array of possible meteorological phenomena that the atmosphere can deliver
Thus, the likelihood, but not the occurrence, of extreme weather events is determined by the climate
The actual occurrence of an extreme weather event is determined by the initial conditions of the atmosphere that precede the development
The chemical composition boundary condition has changed and so the bounds on possible extremes have also changed