Embed Size (px)
Citation preview
The Disintermediation of Financial Markets: Direct Investing in Private Equity*
Lily Fang
INSEAD
Victoria Ivashina** Harvard University and NBER
Josh Lerner
Harvard University and NBER
This draft: September 3, 2014
Forthcoming in Journal of Financial Economics
Abstract We examine twenty years of direct private equity investments by seven large institutions. These direct investments perform better than public market indices, especially buyout investments and those made in the 1990s. Outperformance by the direct investments, however, relative to the corresponding private equity fund benchmarks is limited and concentrated among buyout transactions. Co-investments underperform the corresponding funds with which they co-invest, due to an apparent adverse selection of transactions available to these investors, while solo transactions outperform fund benchmarks. Investors’ ability to resolve information problems appears to be an important driver of solo deal outcomes. Keywords: Financial intermediation; private equity; direct investment; co-investment JEL classification: G20, G23
* We thank a number of institutional investors for making this analysis possible by generously sharing their data and answering our many follow-on questions. We thank the anonymous referee, Jean-Nöel Barrot (discussant), Steven Kaplan (discussant), Ludovic Phalippou, Morten Sorensen (discussant), and Per Strömberg, as well as participants at the American Finance Association meetings, the Greenwich Roundtable, the London Business School Private Equity Symposium, the NBER Summer Institute, the New York Fed/NYU Conference on Private Equity, the University of Chicago, and the University of North Carolina Private Equity Conference, for their insightful comments. Lilei Xu and Chris Allen provided remarkable assistance with the analysis. We thank Per Strömberg and Rüdiger Stucke for access to unpublished data. Harvard Business School’s Division of Research provided financial support. All errors and omissions are our own.
** Corresponding author. E-mail address: [email protected] (V. Ivashina).
1. Introduction
In recent years, institutional investors have increasingly invested directly in private
equity, bypassing the traditional intermediated fund structure. These direct investments include
transactions in which an institutional investor co-invests in a deal that is originated by a private
equity fund manager (which we term co-investments) and ones in which the institutional investor
originates and invests in the transaction alone (solo investments). According to Preqin survey
data, in 2014, 52% of investors in private equity funds intended to increase their direct
investment activity, and a further 36% planned to maintain their current level.1 The growing
appetite for direct investments is spread across all types of institutional investors, often at the
expense of allocations toward traditional private equity investing. Lower fees—and,
consequently, the promise of higher net returns—appear to be the primary reason behind this
trend. Yet, as we will show, running a successful direct investing program can be challenging.
Our main contribution is a pioneering empirical assessment of the relative performance of
direct and intermediated investing in private equity for a large sample of investments over two
decades. In broader terms, this study relates to one of the enduring questions in the corporate
finance literature: why intermediaries are ubiquitous in financial markets. The widely offered
explanations are two-fold.2 The first involves transaction costs. By pooling capital across
1 Preqin, “The State of Co-Investments,”
https://www.preqin.com/docs/newsletters/pe/Preqin_PESL_Mar_14_Co_Investments.pdf, 2014. Also see “South Carolina to Start an Investment Firm for Its Private Equity Bets,” http://www.nytimes.com/2010/09/28/business/28carolina.html, September 27, 2010; “Abu Dhabi Sovereign Wealth Fund Eyes Direct Investment in Indian Real Estate,” http://www.altassets.net/private-equity-news/by-news-type/firm-news/abu-dhabi-sovereign-wealth-fund-eyes-direct-investment-in-indian-real-estate.html, March 9, 2012; and “NY State: Interested in More Direct Private-Equity Investments,” http://online.wsj.com/article/BT-CO-20120518-713093.html, May 18, 2012.
2 For a more detailed discussion of the role of financial intermediaries see Allen (2001), Allen and Santomero (1998), and Gorton and Winton (2003).
2
multiple individuals and institutions, the costs associated with assessing and undertaking
investments can be shared, thereby enhancing investors’ returns. The second explanation
highlights the information advantages of financial intermediaries. Notably, Leland and Pyle
(1977) argue that intermediaries invest in assets where they have special knowledge, while
Diamond (1984) suggests that these financial actors serve as “delegated monitors.” Chan (1982)
and Admati and Pfleiderer (1994) highlight how informational advantages may motivate
investors to deploy equity capital through private equity funds.
Against this theoretical backdrop, private equity might appear to be a textbook case
where the benefits from financial intermediation would be substantial. The transaction costs
associated with structuring these investments are large (for example, see Kaplan and Strömberg,
2003, 2004), and substantial information asymmetries surround the monitoring and nurturing of
the investments, giving rise to potential information advantages for specialized investors.
However, intermediaries are far from a panacea. A key concern is the classic principal-agent
problem: the intermediary may behave in its own interest, rather than that of the investor.3 In the
private equity setting, funds may grow fees at the expense of returns (Kaplan and Schoar, 2005;
Lopez-de-Silanes, et al., 2011), invest aggressively at market peaks when expected returns are
modest (Axelson, et al., 2013b), and exit transactions prematurely to facilitate fundraising
(Gompers, 1996). Moreover, the consequences of these behaviors on the part of the managers
(agents), which are attributable to agency problems, are compounded by the evidence that many
3 A voluminous literature on the behavior of banks during the run-up to the financial
crisis has highlighted how agency problems led them to neglect the interests of their capital providers. Mutual funds and insurance companies have also been shown to engage in behaviors that benefit portfolio managers at the expense of their investors (e.g., Chevalier and Ellison, 1997 and Becker and Ivashina, 2013).
3
classes of institutional investors (principals) appear to sub-optimally choose which private equity
groups to invest with (Lerner, et al., 2007; Hochberg and Rauh, 2011).
In this context, the interest on the part of institutional investors in undertaking direct
investments—and thus bypassing intermediaries—calls for a detailed evaluation. Towards this
end, we compile a proprietary dataset of direct investments from seven large institutional
investors. For these investors, we have complete coverage of their direct investment programs,
including solo investments (those deals originated and completed by the limited partners (LPs)
on their own) and co-investments (deals where LPs invest alongside general partners (GPs)). Our
dataset consists of complete and detailed cash flows for 390 direct investments made by these
institutions between 1991 and 2011. We examine the investing patterns, as well as the
performance of these direct investments. We compare the performance of these direct
investments against that of public market indices and private equity funds, thus directly assessing
whether the trend towards “going direct” is economically justified. We use a number of different
benchmarks from various data sources and performance metrics, with a particular emphasis on
market-adjusted performance (PME, or public market equivalent).
Our analysis suggests several conclusions:
• The direct investments perform better than tailored public market indices. The best
performance is concentrated in the buyout fund investments and those made in the 1990s.
• There is limited evidence of outperformance of the direct investments relative to the
corresponding private equity fund benchmarks. For venture capital (VC) deals, we find
that direct investments underperform the fund benchmark, especially in the1990s. This is
consistent with the evidence on unique skills of VC funds—as reflected in the persistence
4
of their returns (e.g., Kaplan and Schoar, 2005; Harris, Jenkinson, Kaplan, and Stucke,
2013; Korteweg and Sorensen, 2014).
• Co-investments underperform the investments of the corresponding funds with which
they co-invest, with the performance gap widening in the latter half of our sample. This
under-performance of co-investments, which are executed alongside private equity
groups (often the same ones where the institutions have fund investments) and are the
cornerstone of most institutions’ direct investment programs, is surprising.4 We provide
evidence that this underperformance appears to be driven by selection (a “lemons
problem”): institutional investors can only co-invest in deals that are available to them. In
particular, these transactions are substantially larger than an average sponsor’s deal and
appear to be concentrated at times when ex post performance is relatively poor. At the
same time, it is important to acknowledge that these direct investments allow firms to put
substantially more funds to work.
• We find that solo transactions, i.e., investments initiated and executed by investors alone,
outperform fund investments. Like co-investments, the performance of solo transactions
also exhibited deterioration over time. Investors’ ability to resolve information problems
appears to be an important driver of solo deal outcomes: the performance of solo deals
over co-investments is greater in settings where information problems are less intense,
such as local and later-stage transactions.
Our results illustrate the theoretical literature summarized above in several ways. First,
the findings highlight the power of intermediation in the private equity setting. Our findings
4 It is common for selected co-investments to be offered as a “sweetener” for the large
LPs participating in the traditional fund.
5
show that the net returns of the direct investments are in many cases similar to partnership
transactions. Because private equity funds charge higher fees, this implies that the gross returns
for investments intermediated by fund managers are substantially larger. Second, as predicted by
theory, the power of intermediation is especially evident in information-sensitive environments.
The performance of the direct deals deteriorates in settings where information problems make
either deal selection or monitoring more difficult, for example VC investments and those that are
geographically distant from the investor, consistent with the theoretical arguments in Leland and
Pyle (1977) and Diamond (1984). Third, our results hint at a complex set of agency problems
between intermediaries and the ultimate investors that are not fully captured by most models of
financial intermediation: for instance, the tendency of co-investments undertaken by these groups
to cluster in the most overheated markets and largest deals. This is surprising from a theoretical
perspective, as one would expect managers’ reputation concerns should curtail this behavior.
One limitation of our data is that the time series is not long enough to investigate this issue in a
repeated setting. Overall, our results suggest that it is difficult for investors to capture the “rent”
that private equity managers earn by investing directly.
The rest of the paper is organized as follows. In Section 2, we discuss the economics of
direct investing. In Section 3, we present the data set that was assembled for this study. Sections
4 and 5 evaluate the performance differentials between the direct investment sample and several
benchmarks. Section 6 concludes the paper.
2. The economics of direct investments
Traditionally, institutional investors make private equity investments by committing
capital to private equity funds. The funds are managed by professional investors (e.g., the
6
Blackstone Group), GPs. The institutional investors (e.g., South Carolina’s pension fund) are
known as LPs. The GPs are in charge of the entire investing process, including deal selection,
execution, monitoring, and exiting. The LPs play a passive role as capital providers. In fact, in
many nations, they need to remain passive in order to maintain their limited liability status.
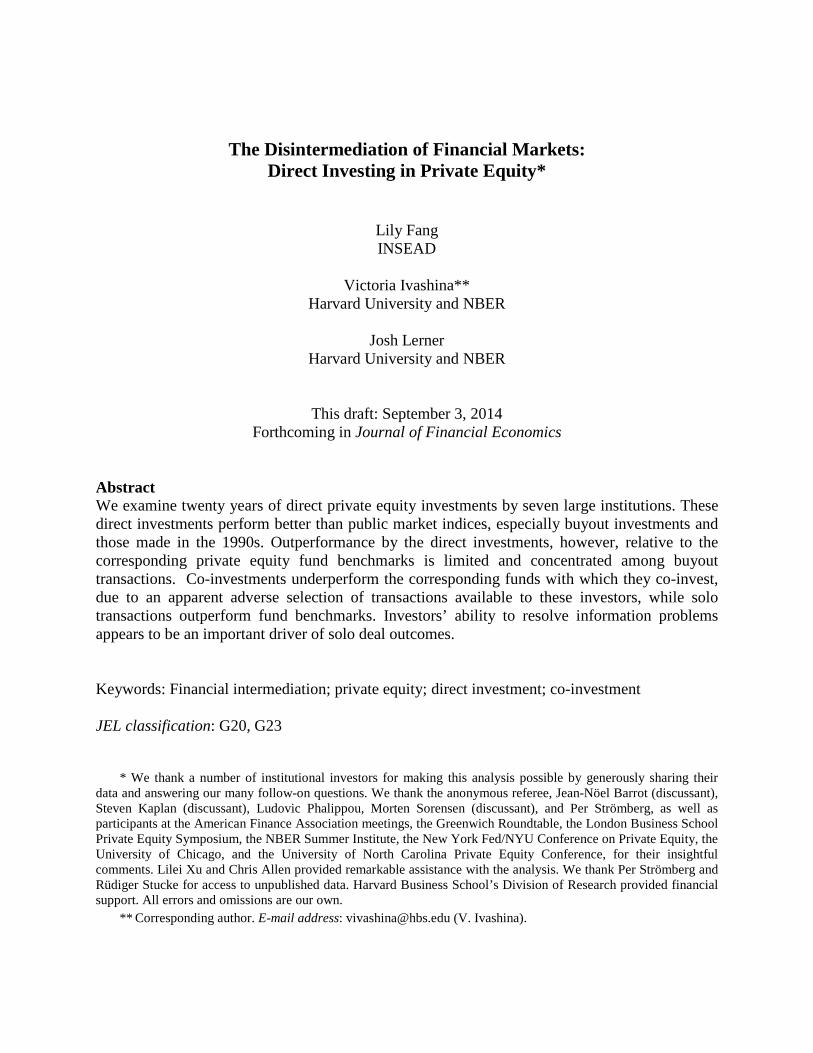
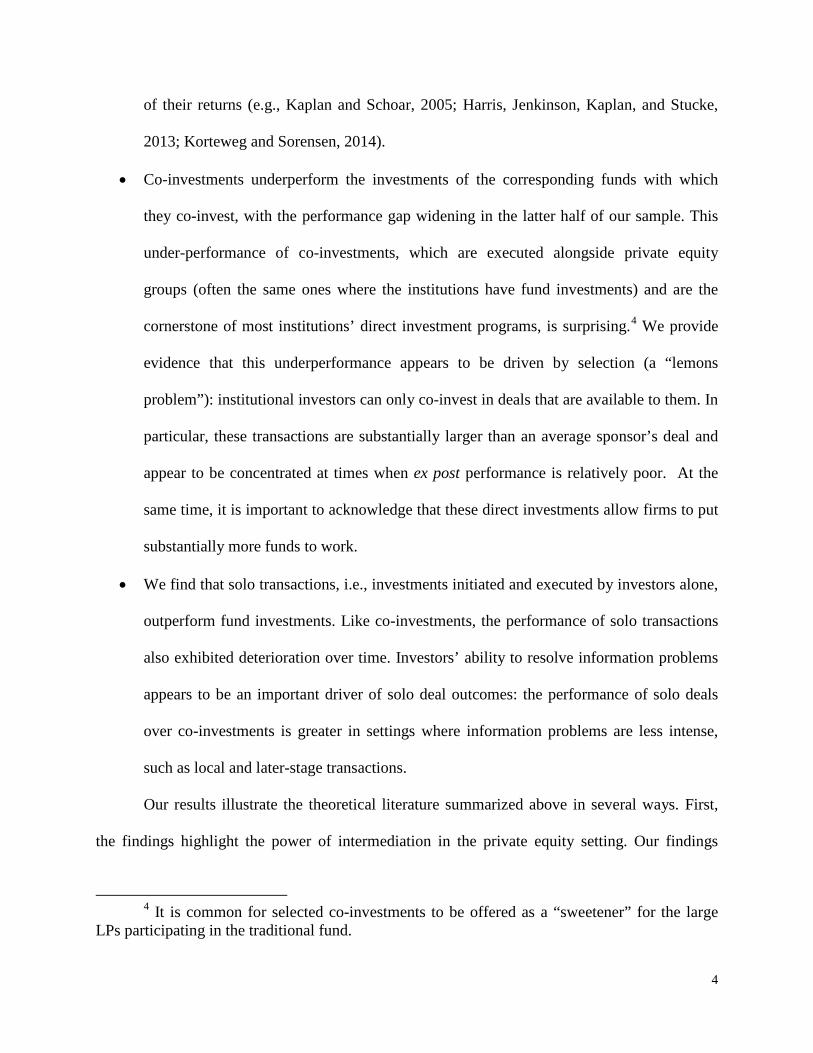
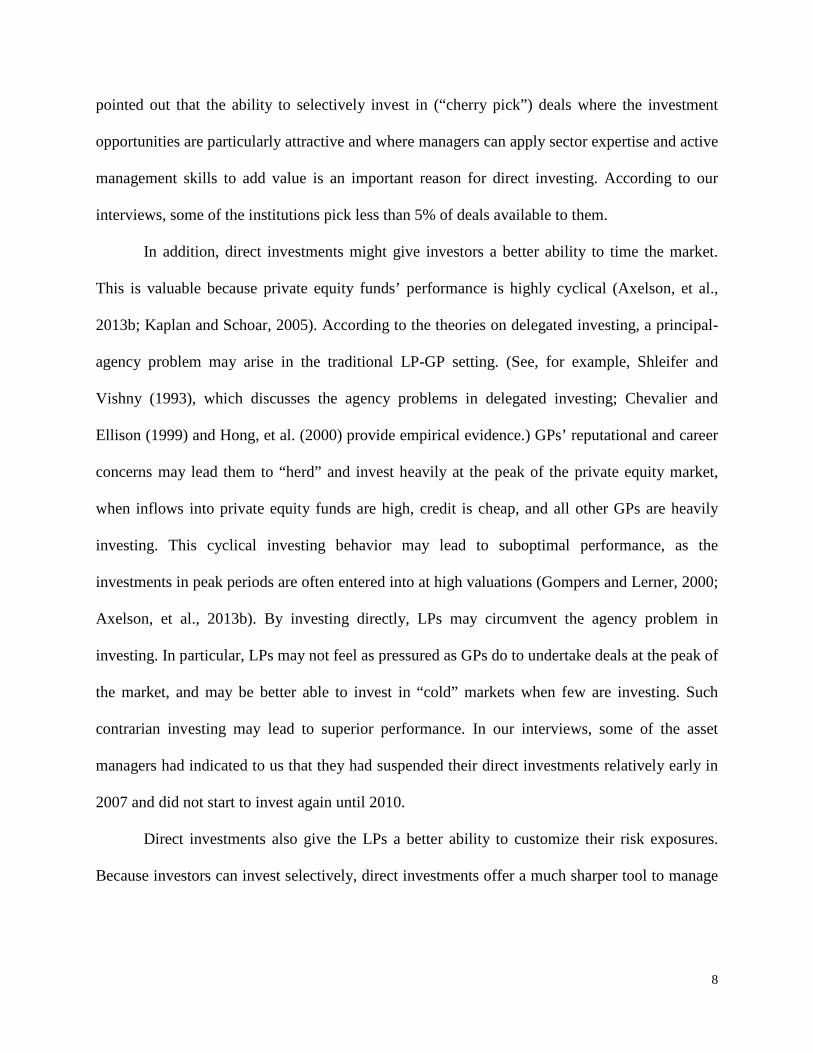
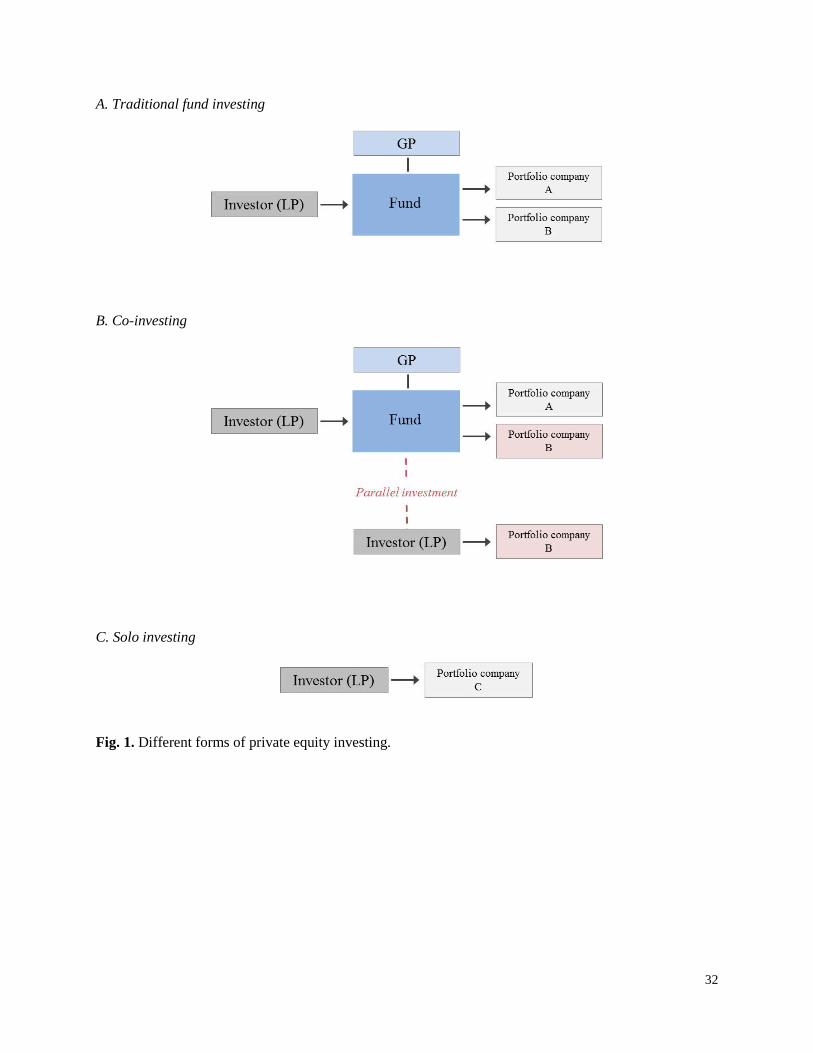
Fig. 1 depicts different variants of direct investment arrangements. The key feature of co-
investments (relative to investments by partnerships) is that the LP plays an active role in
deciding whether to invest and typically pays the GP reduced fees and carried interest, if any. (In
addition, there are hybrid cases where an institution co-leads a deal with a GP or another
institutional investor; we are unable to distinguish these in our sample.) In solo investments, the
LP sources and executes the transactions on its own, bypassing the GP and thus pays no fees and
carry.
[FIGURE 1]
Why are LPs increasingly interested in making investments directly? One clear
motivation is the high cost of investing in private equity funds. In the traditional LP-GP setting,
GPs are compensated through an annual management fee (typically 1.5 to 2% of committed
capital or assets under management) and “carried interest,” a percentage (typically 20%) of the
fund’s investment profits. This “2-and-20” compensation structure implies a cumulative
investment cost of 5 to 7 percentage points per year under a wide range of performance
assumptions, a large economic magnitude (Gompers and Lerner, 1999; Metrick and Yasuda,
2010).
In the years after the private equity boom of 2005 to 2007, the high levels of GP
compensation attracted increasing attention. A number of earlier papers have suggested that
many private equity LPs do not outperform public market benchmarks (e.g., Kaplan and Schoar,
7
2005; Gottschalg and Phalippou, 2009). In particular, while managers exhibited investment
skill—as their gross returns were higher than public equity benchmarks—the lack of superior
return for the LPs implied that “rents” were earned by private equity managers. Recently, using
more comprehensive data, Harris, et al. (2013), Robinson and Sensoy (2013), and Axelson, et al.
(2013a) show that on a net basis, private equity funds out-perform public benchmarks. However,
the results are mixed if one accounts for the higher leverage and illiquidity in private equity
transactions. Furthermore, not all LPs benefit from GPs’ outperformance: many of the best
returns have been at least historically concentrated among funds selected by endowments and
foundations, arguably sophisticated investors that started investing in private equity early and
built and maintained access to top managers, rather than those that dominate the portfolios of
banks, insurance companies, and pension funds (Lerner, et al., 2007).
Fees in direct deals are different from the “2-and-20” compensation structure. Solo
investments typically do not involve fees and carry. In the case of co-investments, fees and carry
are negotiated on a deal-by-deal basis. LPs typically resent paying additional charges for
transactions originated by fund managers with whom they have invested (see Hoye and Lerner
(1996) for an illustrative case). In general, large institutions (which dominate our sample) have a
great deal of market power, and are unlikely to be charged such fees by their GPs. The
significant savings on fees and carry in direct investments imply that all else being equal, direct
investors should enjoy better net returns.
While cost savings are important, our conversations with institutional investors suggested
additional motivations behind the movement towards direct investing. In the traditional LP-GP
setting, GPs are in charge of deal selection as well as the timing of investments, leaving LPs with
little control and flexibility. Direct investments give LPs more control. Investors we interviewed
8
pointed out that the ability to selectively invest in (“cherry pick”) deals where the investment
opportunities are particularly attractive and where managers can apply sector expertise and active
management skills to add value is an important reason for direct investing. According to our
interviews, some of the institutions pick less than 5% of deals available to them.
In addition, direct investments might give investors a better ability to time the market.
This is valuable because private equity funds’ performance is highly cyclical (Axelson, et al.,
2013b; Kaplan and Schoar, 2005). According to the theories on delegated investing, a principal-
agency problem may arise in the traditional LP-GP setting. (See, for example, Shleifer and
Vishny (1993), which discusses the agency problems in delegated investing; Chevalier and
Ellison (1999) and Hong, et al. (2000) provide empirical evidence.) GPs’ reputational and career
concerns may lead them to “herd” and invest heavily at the peak of the private equity market,
when inflows into private equity funds are high, credit is cheap, and all other GPs are heavily
investing. This cyclical investing behavior may lead to suboptimal performance, as the
investments in peak periods are often entered into at high valuations (Gompers and Lerner, 2000;
Axelson, et al., 2013b). By investing directly, LPs may circumvent the agency problem in
investing. In particular, LPs may not feel as pressured as GPs do to undertake deals at the peak of
the market, and may be better able to invest in “cold” markets when few are investing. Such
contrarian investing may lead to superior performance. In our interviews, some of the asset
managers had indicated to us that they had suspended their direct investments relatively early in
2007 and did not start to invest again until 2010.
Direct investments also give the LPs a better ability to customize their risk exposures.
Because investors can invest selectively, direct investments offer a much sharper tool to manage

9
targeted risk profiles than fund commitments, where the timing and amount of investments—and
hence the risk exposures—are controlled by the private equity fund.
Finally, direct investing may also better align the interests between the LPs and GPs to
achieve higher investment quality. GPs can be distracted—for example, by underperforming
portfolio companies or plans for some portfolio companies to go public—and thus not be wholly
focused on investing during potentially attractive times to deploy capital. In direct investments,
because the LPs play a more active role, the principal-agent problem between the GPs and LPs
may be reduced.
Direct investments, however, have downsides as well. For solo investments, the biggest
challenge is investment skill. In traditional fund investing, the LPs’ main task is to select the
right managers. Thus, historically LPs’ skills relate to manager selection. But to do solo deals,
the LPs need to step into the GPs’ roles, which require deal-level due diligence, operational, and
monitoring capabilities that are not in their traditional skillset. To the extent that the LPs’ internal
staff is less skilled and/or experienced in transaction-related activities than the GPs, solo
investments may on average be of worse quality than portfolio companies in funds, generating
lower gross returns. If this skill gap is large enough, fee savings alone may not reverse the
performance difference, and investors’ rationale for “going direct” will be ultimately unjustified.
Co-investments present different challenges. On the one hand, co-investments are
executed alongside private equity groups, often the same ones where the institutions have fund
investments. The existing relationship between the LP and GP should reduce potential agency
problems. Co-investments are offered to LPs whose continued support is sought after by the GPs.
GPs’ reputational concerns should thus imply that the “best” investments are offered as co-
investments; coupled with reduced fees and carry, these investments should out-perform. On the
10
other hand, co-investments are virtually by definition larger deals where additional capital is
required. Larger deals generally perform more poorly (Lopez-de-Silanes, et al., 2011). Moreover,
the LP is typically offered the investment opportunity with only a limited amount of time to
undertake due diligence. It might also be the case that in these instances, the greater information
of the private equity group relative to that of the LP creates a “lemons problem”: i.e., GPs offer
LPs investments in below-average quality deals. The resulting adverse selection would translate
into lower gross returns, which may not be offset by reduced fees and carry.
In sum, the different approaches to private equity investing—the traditional intermediated
partnership versus direct investing—present a tradeoff between cost and investment quality.
Fund investing is high cost, but the average deal invested by funds may be of higher quality;
direct investing is lower cost, but the typical transaction may be of worse quality. Reinforcing
this type of equilibrium is the fact that the staff of the LPs typically receives lower compensation
than investment professionals in funds, reflecting the frequent association of institutional
investors with government or non-profit bodies. If the labor market for investment skills is
reasonably efficient, one would expect that direct investments might on average be of worse
quality than the portfolio companies chosen by funds. If the investment quality gap (or gross
return gap) is large enough, lower fees and carried interest may not offset this gap. In this case,
investors will find “going direct” ultimately unjustified.
3. Data
The data used for the analysis was obtained from seven institutional investors. Getting
access to these data posed certain complexities. As the information was highly sensitive, the
institutional investors wanted to be sure that neither the individual transactions nor themselves
could be identified. This concern necessitated negotiating in each case a data protection
11
agreement. Given these high transaction costs, we focused on eliciting participation from
institutions with long-standing direct investment programs (and typically, considerable
experience with private equity in general). Thus, it can be anticipated that the participating firms
are among the more sophisticated private equity investors in the industry.
Each of the seven contributing investors provided us the complete history of their direct
investments in private equity. While the groups were generally larger and more sophisticated
than the typical LP, we sought to ensure that they were representative in other respects. The
investors were based in North America, Europe, and Asia. No more than two groups were from
any individual country. They included university, corporate, and government-affiliated entities.
In each case, the institution provided us with two sets of data:
• The first dataset contained the characteristics of the investments made (date, amount of
equity and debt invested, etc.). The total sample contains 390 investments made between
1991 and 2011.5 For five investors, the firms receiving the funds were identified by
name; for the other two investors, they were identified only by code number. In the
former cases, we researched the investments’ characteristics at the time of the transaction
using CapitalIQ and other business databases. In the latter cases, the institution provided
us with their characteristics (e.g., industry and headquarters location).
• The second data set contains the performance of the investments. This typically consisted
of a series of cash flows and valuations for each transaction, running from the time of the
investment until either its exit or the time the data was provided (the second or third
5 From the data provided to us, we exclude one observation, an exceedingly small
investment which originated as a dividend from another transaction. The institutional investor felt the peculiar circumstances behind the transaction consequently led to cost basis being mischaracterized, resulting in an extremely high performance.
12
quarter of 2011). We were able to replicate the performance calculations provided us by
the LPs, and resolved any discrepancies through discussions with them. Consequently,
the differences in performance cannot be attributed to methodological differences.
As with any self-reported data, our sample is likely not representative of the direct
investment universe. In Table 1, we evaluate the nature of the reporting bias. Panel A compares
basic statistics of the participating institutions in our sample with all others listed in the Thomson
Reuters VentureXpert Limited Partners Database. It should be noted that even the data compiled
in this database are far from an exhaustive depiction of LP activity, reflecting institutional
investors’ unwillingness to communicate their investment choices and the lack of a statutory
requirement for most LPs and GPs to reveal fundraising activity (see the discussion in Lerner, et
al., 2007, and Hochberg and Rauh, 2011).
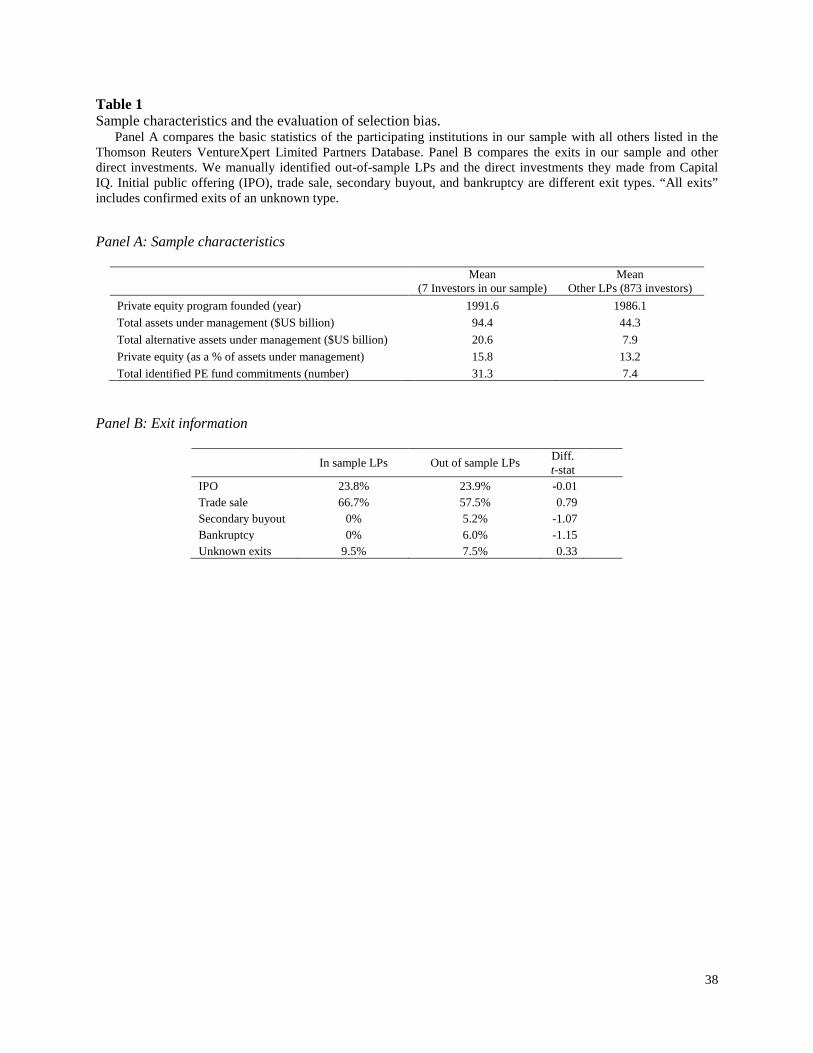
The comparison suggests that the private equity programs in our sample are newer and
larger than the other LPs in the Thomson database. The average year that a private equity
investment program was founded in our sample institutions was 1992, five years after the overall
Thomson LP universe. On the other hand, total assets under management in mid-2012 averaged
$94 billion for our participating institutions, more than double the average size of the investors in
the overall Thomson LP universe. Total alternative assets under management averaged $21
billion among our participating groups, 2.6 times the overall average of $8 billion. The average
private equity allocation was also slightly higher among our sample than overall: 15.8% versus
13.2%. Finally, our sample investors on average have 31 fund commitments that have been
identified by Thomson (their compilations are highly incomplete), more than four times the 7
average in the overall LP universe. Thus, overall, our sample represents large institutional
13
investors who are particularly active in alternative investing and have significant private equity
exposures.
[TABLE 1]
A specific concern for our sample is that investors who collaborated with our study could
be more experienced or more skilled in direct investing than the average LP. This means that the
direct investments in our sample could be better performing than the overall population
undertaking direct investments. Note that because we have complete information for the
investors in our sample, there are insights that we can learn from comparing solo and co-
investments by the same investors, even if the set of the investors in our sample is biased.6
To understand better if our results are generalizable, we compared the performance of our
direct investment sample with a broader sample of direct investments obtained from Capital IQ
made by other LPs. For the seven investors in our sample, we observe complete cash flow data
for their direct investments, but such performance data are not available for a broader set of
investors. Instead, we compare the type of exit.7 The basic idea is that a higher propensity to exit
investments through an initial public offering (IPO), on average, would be associated with the
highest returns, and bankruptcy with the lowest returns. To do this analysis, we first manually
identified 150 LPs (other than our seven LPs) from over 6,000 private equity investors appearing
in Capital IQ. Then we searched for deals that involve one of these 150 LPs as an investor. In
this way, we identified 651 direct investment transactions in Capital IQ. We compare the exit
6 One potential concern is whether self-reported net asset values (NAVs) could differ between the solo and co-investments. The former is determined by the LPs, while the latter is largely in the hands of the GPs. It could be that the LPs have more incentives to set high NAVs than the GPs. However, as will be shown below, the outperformance of solo deals comes mainly from early years, while the NAVs are most relevant for the later investments (many of which are still not exited).
7 Exit data was generously provided by Per Strömberg, and is used in Strömberg (2008). We supplemented his data with manual searches of recent exits.
14
outcomes of this sample with our sample. The results reported in Panel B of Table 1 show that
there are no significant differences in terms of the exit patterns between the direct investments
done by our seven LPs and the other LPs, alleviating the sample selection concern that our
results might be mischaracterizing the general performance of direct investment programs.
4. The performance of direct investments
In this section, we undertake a series of univariate comparisons between the performance
of direct and partnership investments, beginning with PMEs and then turning to other
performance measures. We employ a variety of adjustments to address issues such as the costs of
running the direct investment programs.
4.1. Investment patterns
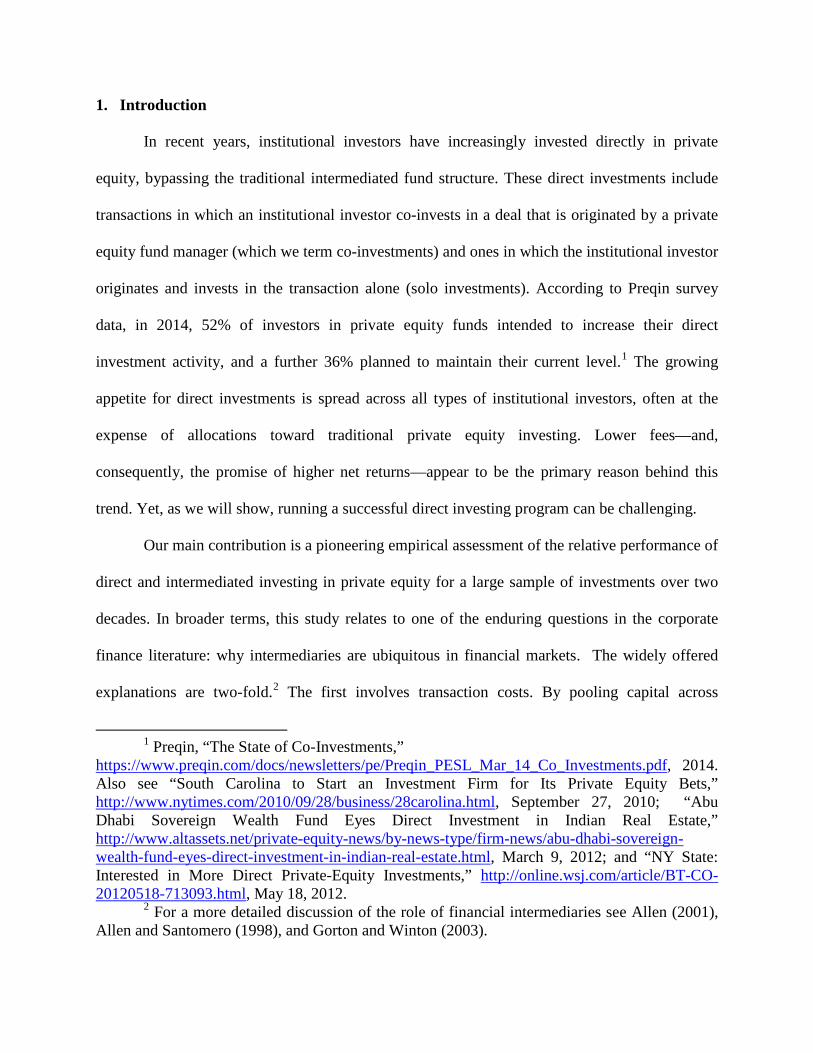
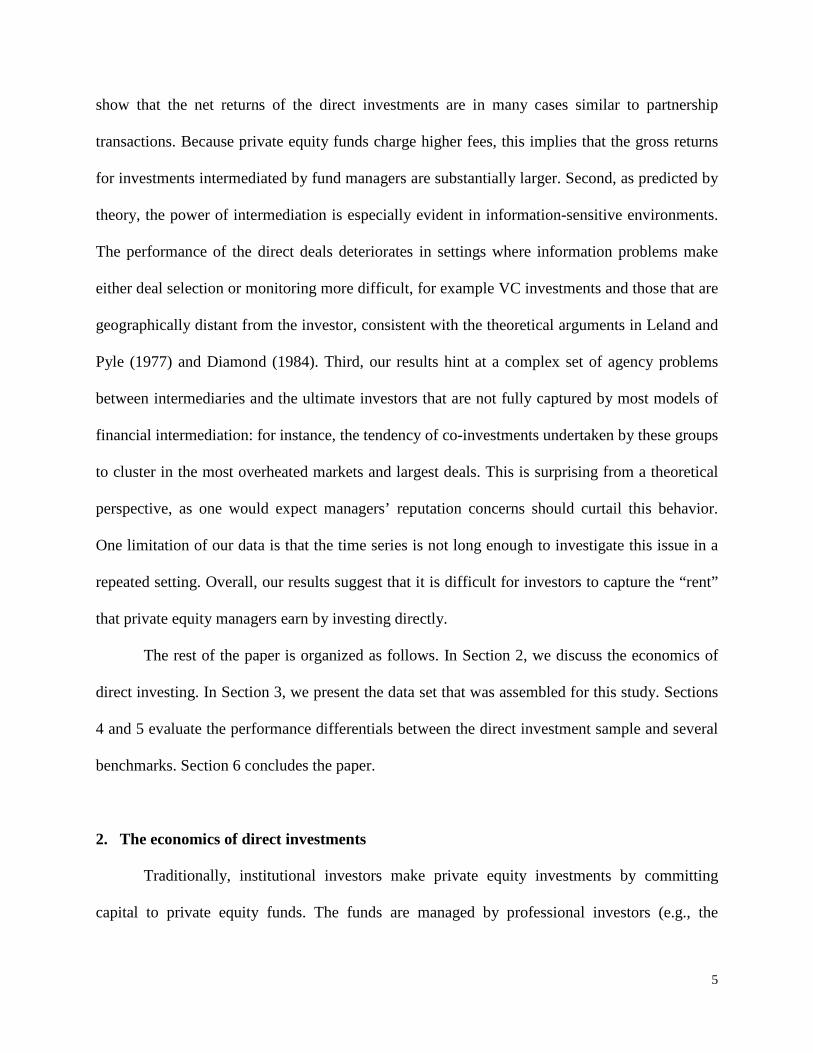
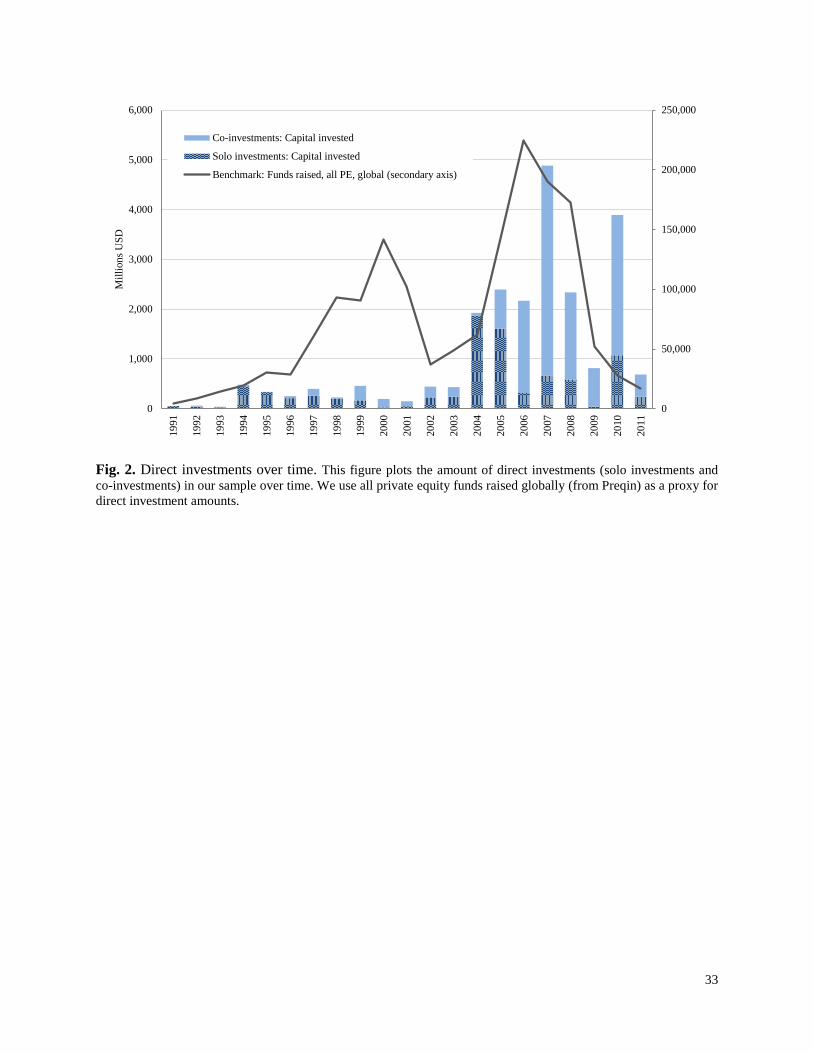
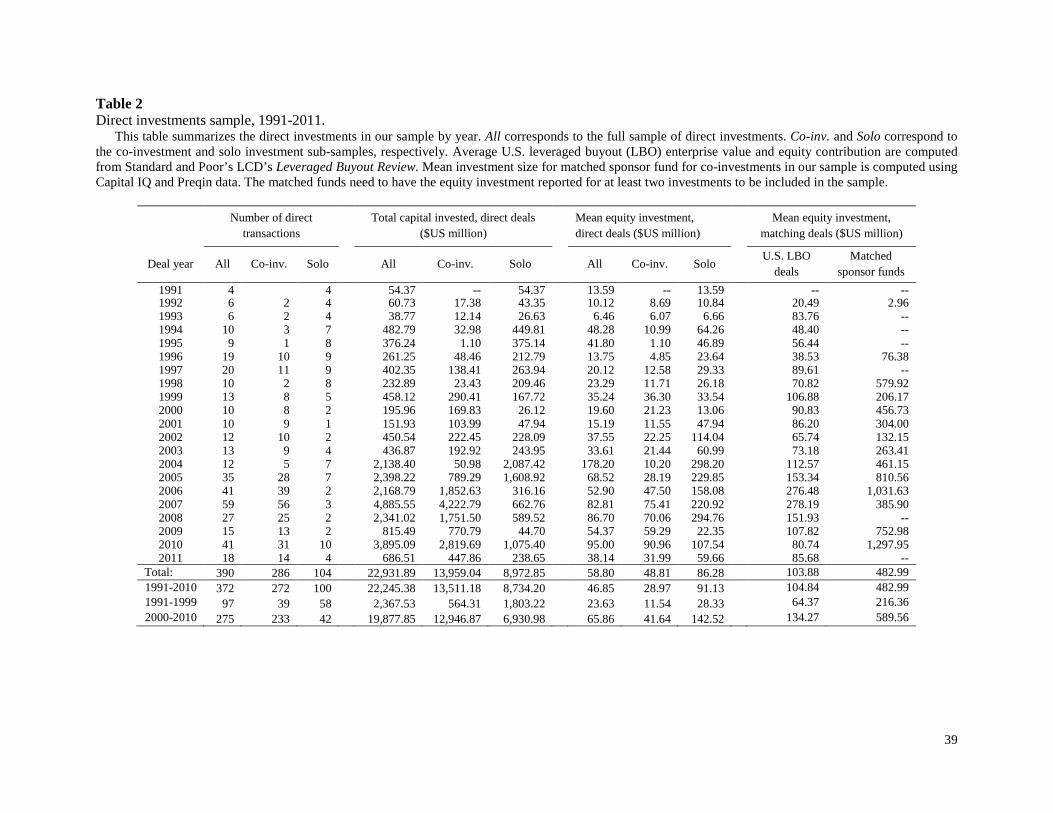
The time-series distribution of the 390 direct investments in our sample is presented in
Table 2 and Fig. 2. The investments are significant in magnitude, totaling nearly 23 billion
dollars. Roughly 73% of the sample by the number of deals and 61% by the amount invested are
co-investments. By way of comparison, over the same period from the beginning of 1991 and the
third quarter of 2011, LPs’ total commitment to private equity funds globally was $1.6 trillion, as
estimated by Thomson Reuters.
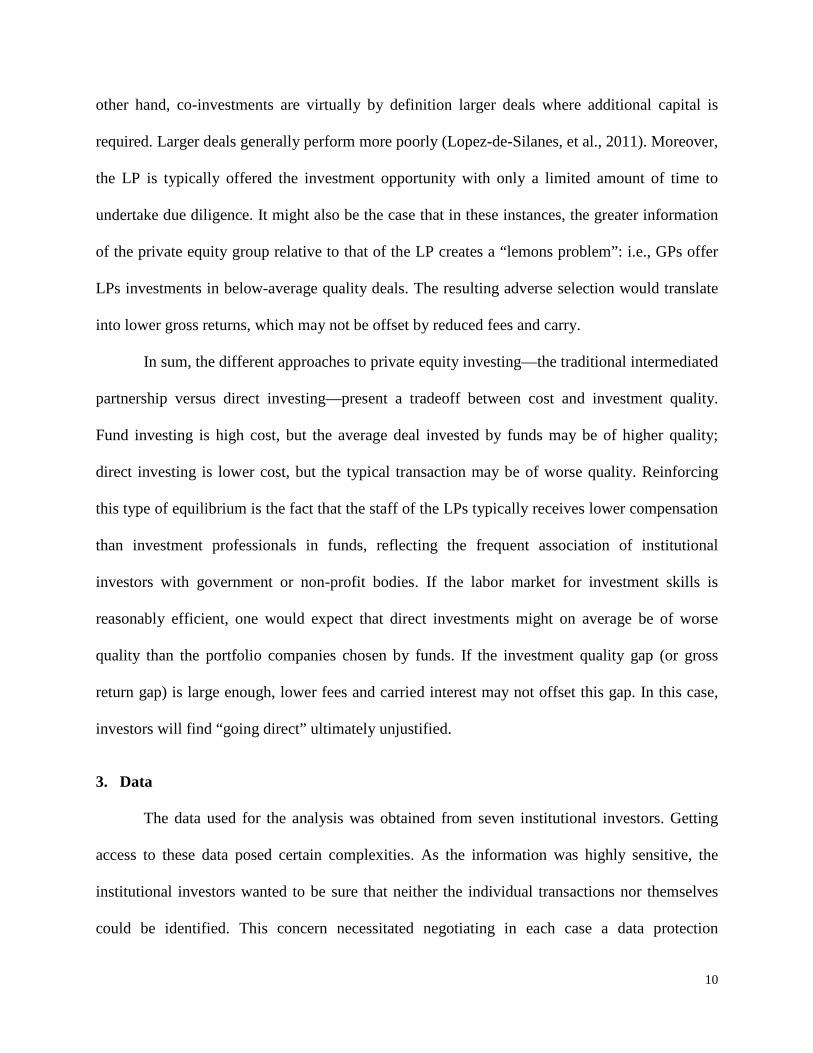
As Fig. 2 and Table 2 show, the majority of the direct investments in our sample are
concentrated in the second half of the sample, especially after 2004. Thus, direct investing
represents still a still small but growing part of institutional investors’ total private equity
investing. One striking pattern is the manner in which the number, and especially the dollar
volume, of investments appears to crest around years that are peaks of private equity investing
(2005-2008), particularly in 2007.
15
[TABLE 2 & FIGURE 2]
The eighth through tenth columns of Table 2 report the average size of the direct
investments in the sample. The typical solo investment is larger ($91 million) than the typical co-
investment ($29 million). To help calibrate these amounts, in the last two columns, we also
report the mean equity investment for all U.S. buyouts and for the matched funds (i.e., those
where our seven investors co-invested in at least one deal made by the fund).8 The matched
funds invest in significantly larger deals than the typical U.S. buyout transaction, likely reflecting
the large size of the institutions in our sample. Both the matched funds and the mean U.S. LBO
are on average larger than the typical direct investment in our sample. But because each fund has
a considerable number of LPs (and each investment may be syndicated across multiple funds),
the actual amount of exposure by a given institutional investor in a single fund investment is
likely to be much less than its exposure in the average direct investment.
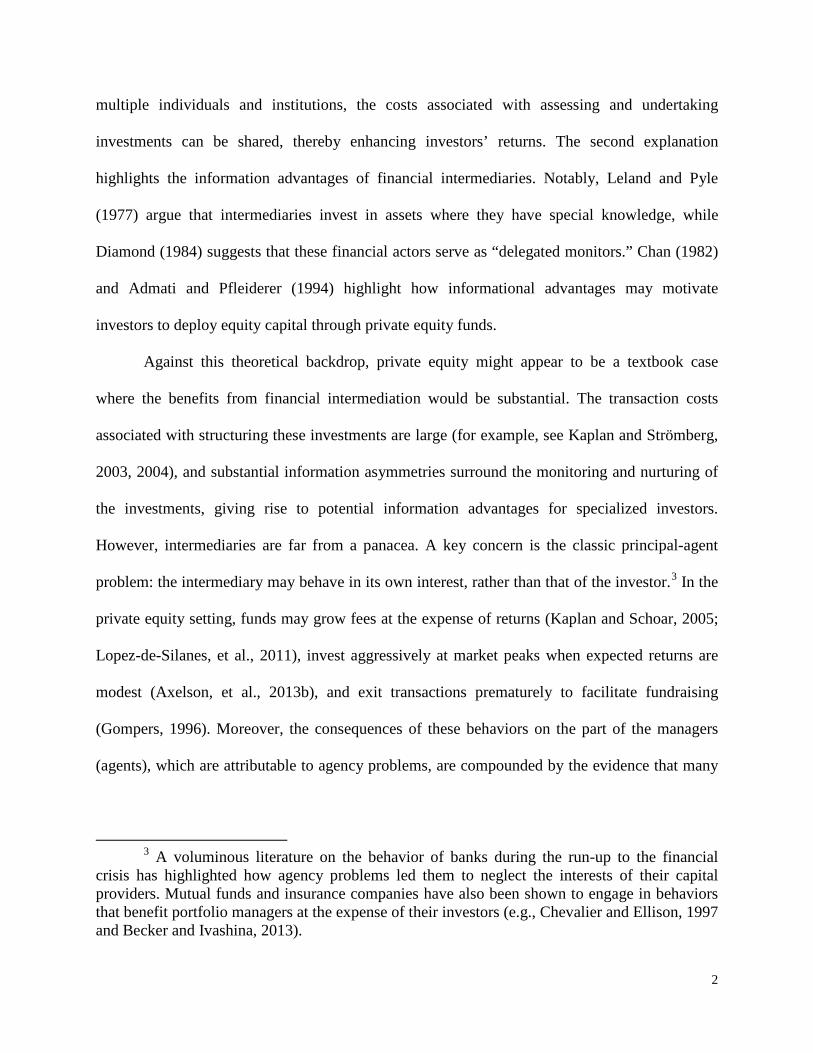
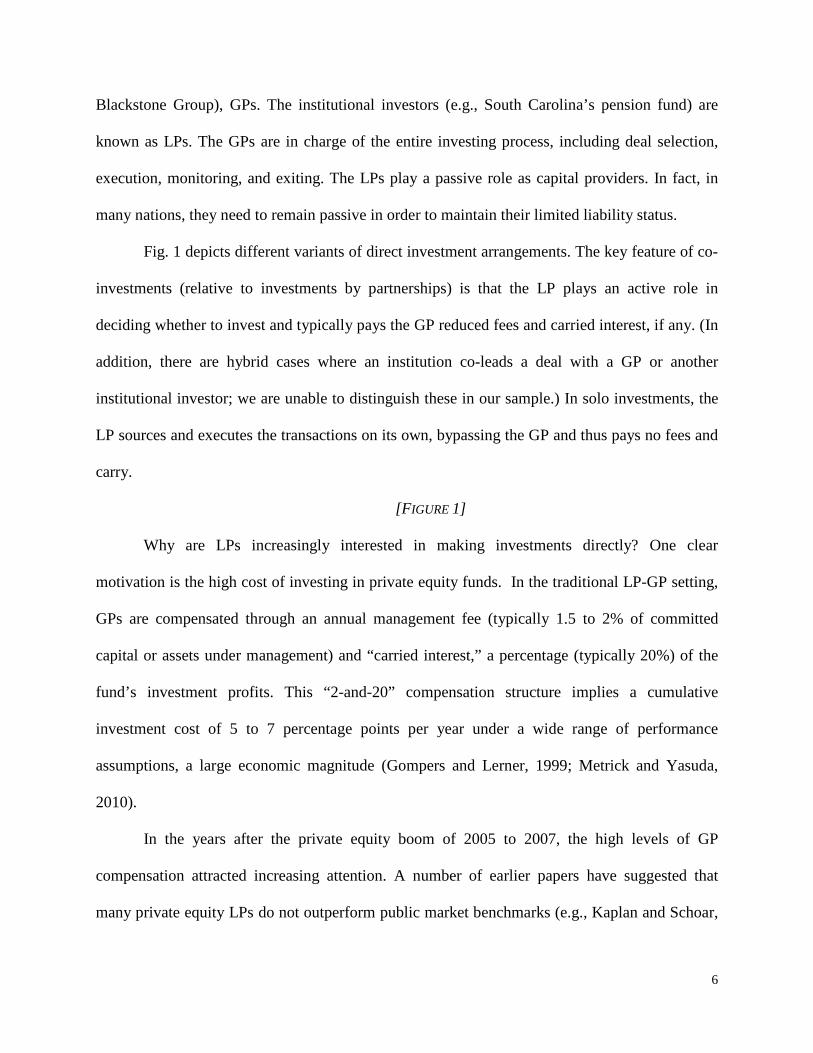
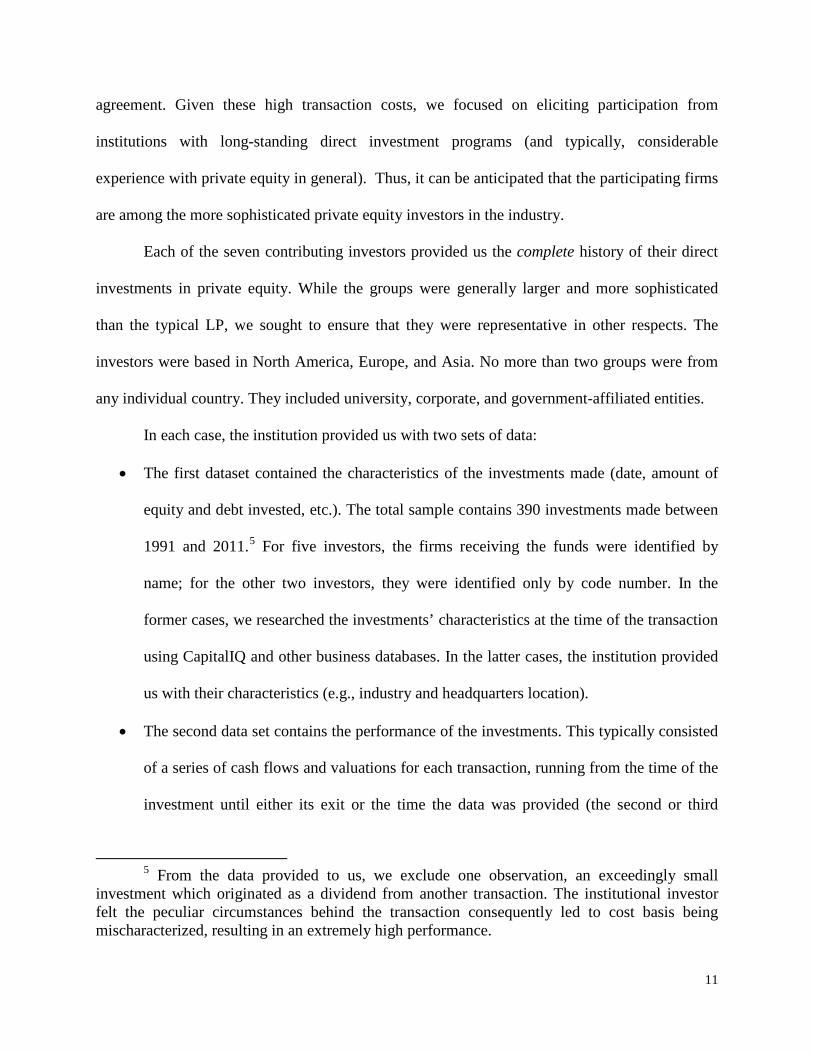
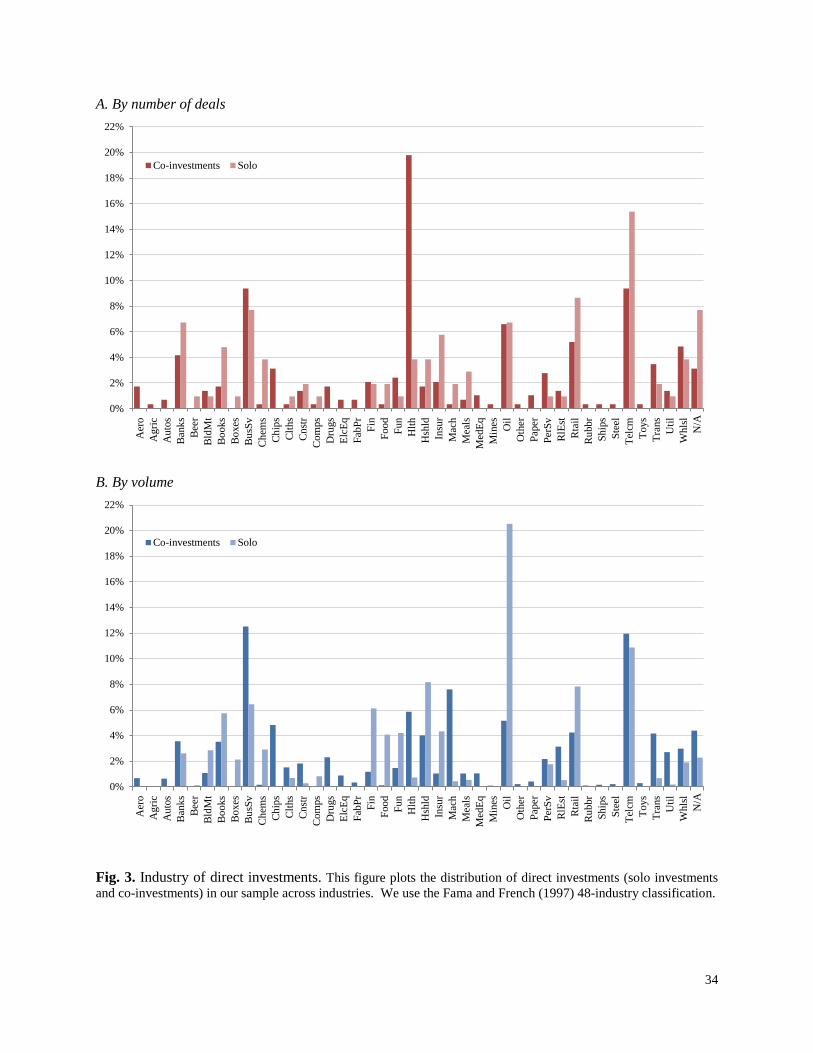
Fig. 3 presents summary of the data by industry, using the Fama and French (1997) 48-
industry classification. In Panel A, we look at the number of transactions: co-investments are
dominated by transactions in healthcare, telecommunications, and business services. Solo deals
most frequently are in telecommunications, retail, and business services. In Panel B, we examine
the total amount invested by our seven investors. Here, the most popular industries for the two
classes of investments diverge to a greater extent. Co-investments are most frequently in
8 We compute the size of the average equity investments in U.S. LBO by multiplying the
mean percentage equity stake in all U.S. LBOs with high-yield debt outstanding reported by Standard & Poor’s Leveraged Commentary & Data’s Leveraged Buyout Review by the mean enterprise value for transactions for the 250 most active U.S. buyout funds (by transaction volume) in this period downloaded from Capital IQ. For co-investments, the mean equity investment by the fund is computed for all matching funds with information for at least two transactions reported by Preqin. This explains the scarce information for the matched funds in the earlier years of the sample.
16
telecommunications, business services, and machinery. Solo investments, on the other hand, are
dominated by oil, telecommunications, and household goods.
[FIGURE 3]
4.2. Baseline performance results
We focus on three measures of performance: (i) the market-adjusted performance of
private equity relative to public equity markets (PME), (ii) the ratio of LPs’ total value—
measured as the sum of distributed and residual capital—to the amount paid into the fund
(TV/PI), and (iii) the internal rate of return (IRR). The PME methodology compares the (present
value of) proceeds generated by the private equity investment with those from investing the same
amount in a public market index. If the proceeds from the private equity investments exceed the
reference return from the public investment, the value of the PME exceeds 1 and indicates that
the private equity investment outperforms the public market; otherwise, the PME is below one
and private equity underperforms. While the PME is a relative measure, TV/PI and IRR are
absolute measures widely used in practice.
Although each of these three measures has limitations, the PME with an appropriately
tailored benchmark has enjoyed the widest acceptance in academic circles: see Sorensen and
Jagannathan (2013) for a derivation of its appropriateness as a performance metric under fairly
general conditions. Recent work such as Harris, et al. (2013) and Robinson and Sensoy (2013)
report average PMEs for buyout and venture funds, with which we can compare the performance
of the direct investments in our sample. The limitations of IRRs and multiples as performance
metrics have been widely discussed, but certainly the vast majority of reported private equity
benchmarks continue to employ these performance metrics. Thus, while we focus primarily on
PMEs, we use all three performance metrics.
17
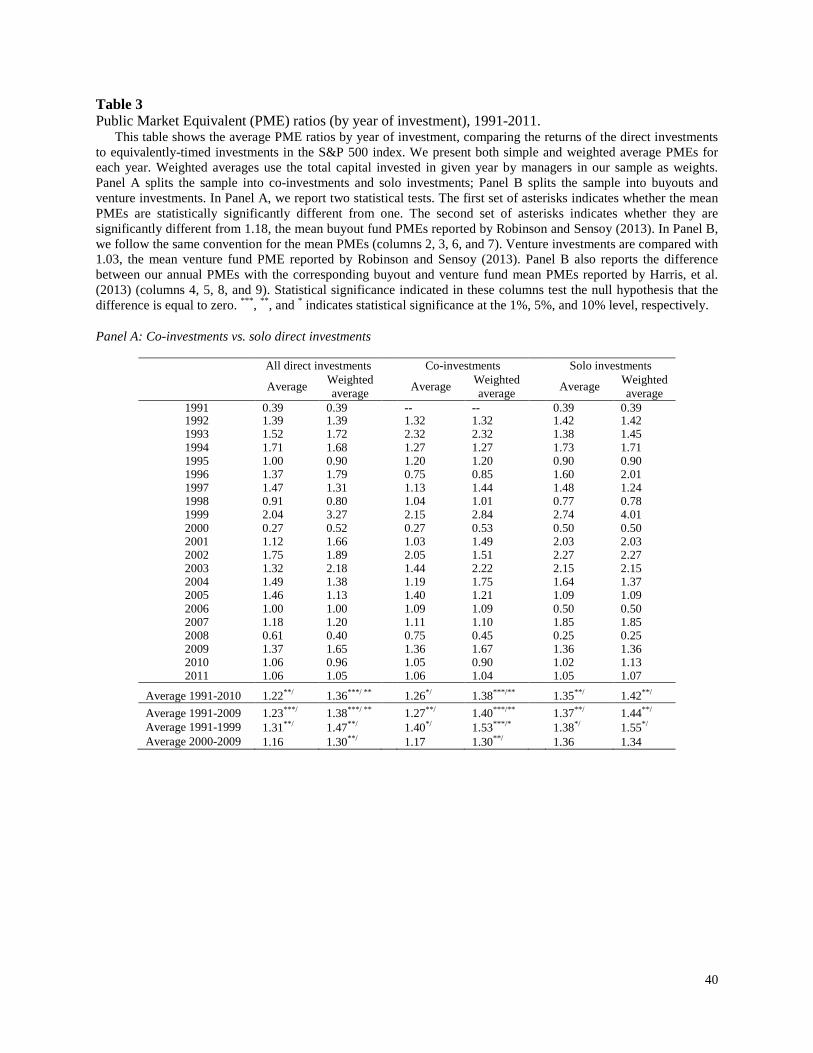
Table 3 shows the average PME ratios of the investments in our sample by year of
investment, comparing private equity returns to equivalently timed investments in the market
index. Throughout this table, we use the S&P 500 index as the market benchmark, which is also
used in Harris, et al. (2013) and Robinson and Sensoy (2013) to calculate the average private
equity fund PME. We present the simple average of each year’s PME, as well as weighted
averages, using the total capital invested in direct deals in a given year by the seven institutions
in our sample as weights. 9 These calculations are presented in Panel A for all direct investments,
as well as for co-investments and solo investments separately. In Panel B, we present the results
for buyout and VC direct investments separately. To facilitate comparisons, we also present in
Panel B the annual average PMEs for buyout and venture direct deals less those computed for
buyout and venture funds by Harris, et al. (2013), which are derived from Burgiss data. In these
cases, we only include direct investments through 2009 to facilitate comparisons to their
numbers.
For the PME numbers reported in Panel A of Table 3, we test the following two null
hypotheses: (a) the mean PME is equal to one, and (b) the mean PME is equal to the mean PME
of private equity funds reported by Robinson and Sensoy (2013).10 These tests inform us
whether the direct investments outperform the S&P 500 index, and whether they out-perform the
9 All performance metrics are weighted within investors. Because categories are not evenly distributed (e.g., there are more co-investments than solo investments), a simple average of the subsamples is not equal the mean of the entire sample in this and subsequent tables.
10 One subtle issue relates to the differing timing of direct and fund investments. For the direct deals, we have the dates when the transactions were undertaken: the year of the direct deals corresponds to the actual year of the investment. The performance of private equity partnerships, however, is compiled by the major data vendors using the date of closing of the fund. Private equity partnerships do not typically invest all their capital in the year that they close, but instead over several subsequent years. To deal with this issue, we compare the performance of the direct deals to funds raised in the year before the transaction. (We proceed similarly in all the other tables.) The results are robust to undertaking comparisons to funds raised in the same year and two years before the direct investment was made.
18
average private equity fund, both relevant questions for LPs assessing direct investments. We use
here the overall average buyout fund PME of 1.18 reported in Robinson and Sensoy (2013) as
the private equity fund benchmark. In Panel B, where we separately report the buyout and
venture direct investments PMEs, we compare the mean of each with the mean S&P 500 PMEs
for buyout and venture funds reported in Robinson and Sensoy (2013), which are 1.18 and 1.03
respectively. In addition, since Harris et al. (2013) also report annual fund PMEs for buyout and
venture funds, we are able to calculate and report the annual PME differences between the
buyout and venture deals in our sample and the relevant fund sample (these differences are
reported in the fourth and fifth columns for buyout investments and the eighth and ninth columns
for venture investments in Panel B). The results suggest that most direct investments have PMEs
greater than one. Thus, direct investments generally outperform the S&P 500. The
outperformance is in general weaker in the second half of the sample. This is true for both co-
investments and solo investments (Panel A), and for buyouts (Panel B). The exception is venture
direct investments: their PMEs are lower and not significantly different from one.
The outperformance relative to the Robinson and Sensoy (2013) fund benchmark is
inconsistent across computation methods, generally only significant when the results are
weighted (Panel A). When the differences with the Harris, et al. (2013) fund PMEs are examined
(Panel B), the buyout direct deals do not differ significantly (the fourth and fifth columns), while
the venture directs generally underperform (the last two columns).
In sum, while direct investments consistently outperform the market, they do not
regularly outperform other private equity investments.
[TABLE 3]
19
4.3. Tailored public equity benchmarks
Table 3 suggests that in most cases, the direct investments return more than the public
markets: the PMEs generally exceed one when the S&P 500 is used as the public market
benchmark. But many would contend that S&P 500 has different risk-return characteristics from
the typical private equity investment and as such it is not the appropriate public equity
benchmark. To address this issue, Table 4 examines the sensitivity of the results to the use of
PMEs computed with alternative public market benchmarks. We use four alternative
benchmarks, corresponding to the notion of tailored PMEs used by Robinson and Sensoy (2013).
These alternative benchmarks are as follows:
• For buyouts, returns on the top 30% size equally-weighted size portfolio in Kenneth
French’s data library; for venture, NASDAQ returns.11
• For buyouts, returns on the top 30% size equally-weighted size portfolio in Kenneth
French’s data library; for venture, Russell 2000 returns.
• For U.S. buyouts, return on the top 30% size equally-weighted size portfolio in Kenneth
French’s data library; for U.S. venture, Russell 2000 returns; MSCI EAFE Standard and
Small Cap returns for non-U.S. buyout and venture.
• For all firms, return on the corresponding Fama and French (1997) 48 industry portfolios
(value-weighted) from Kenneth French’s data library.
Following the methodology in Panel A of Table 3, we test the null hypotheses that the PMEs do
not differ from one and that there is no difference between the reported direct investment PMEs
and the fund PMEs reported by Robinson and Sensoy (2013).12
11 We assume that the deals in our sample are well-matched to large firms because the
investors in our sample (and the typical transactions they directly invest in) are large.
20
Consistent with Table 3, Table 4 shows a strong pattern of outperformance across all time
periods for the buyout direct investments, regardless of the benchmark employed. This is true
whether the investment is compared to a PME of one, or the mean fund PME as computed by
Robinson and Sensoy (2013). The outperformance is much weaker when it comes to venture
direct investments: they generally only exceed the benchmarks during the 1990s, and even then
inconsistently. Another pattern apparent from Table 4 is the general deterioration of performance
of direct investments during the 2000s. The PME numbers are smaller and their out-performance
relative to public indices weaker, regardless of the performance metric employed.
[TABLE 4]
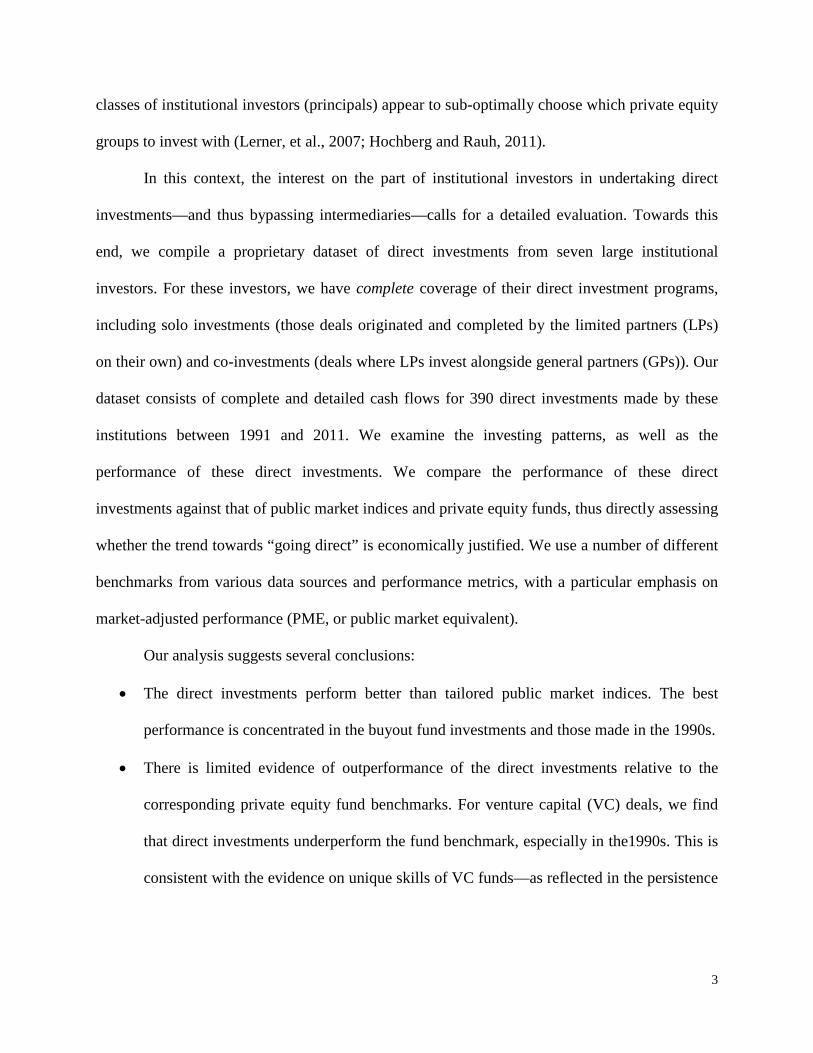
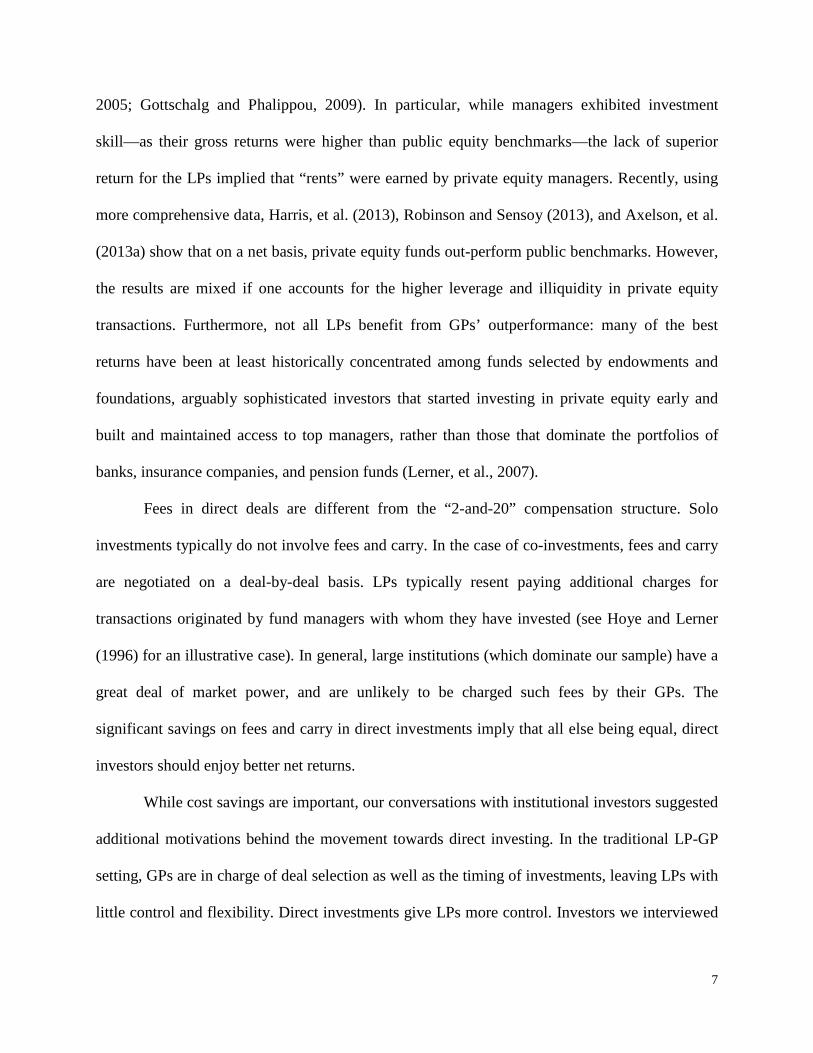
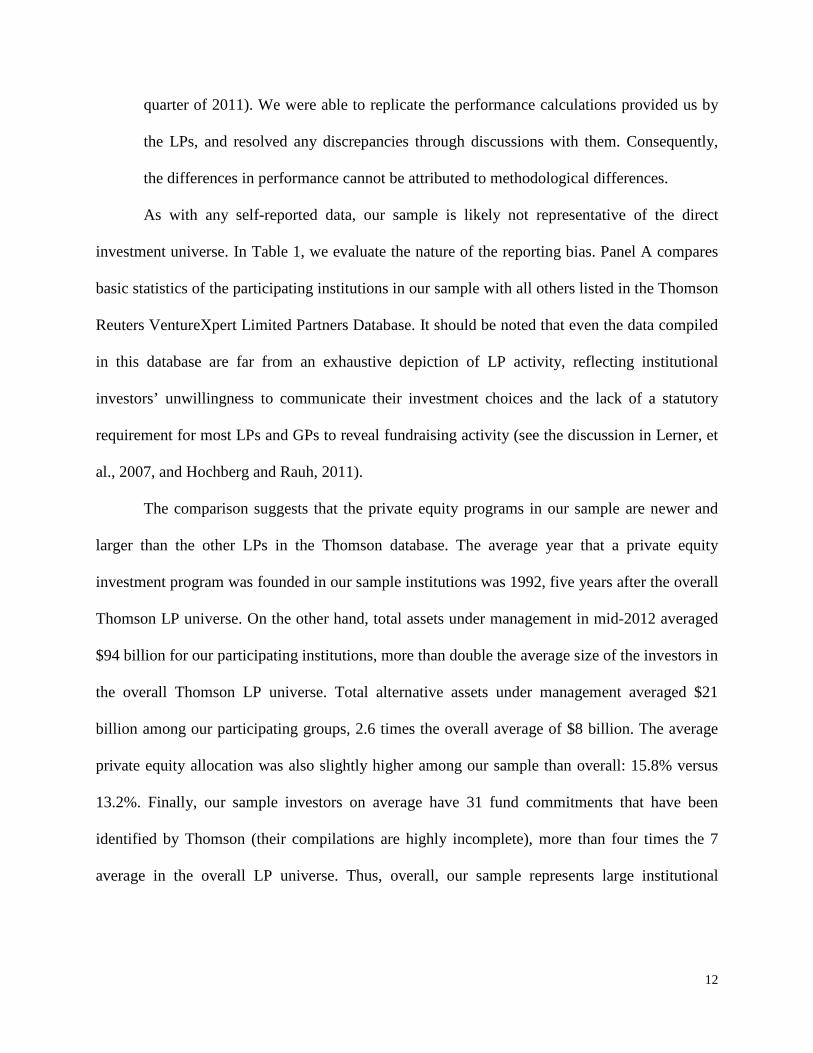
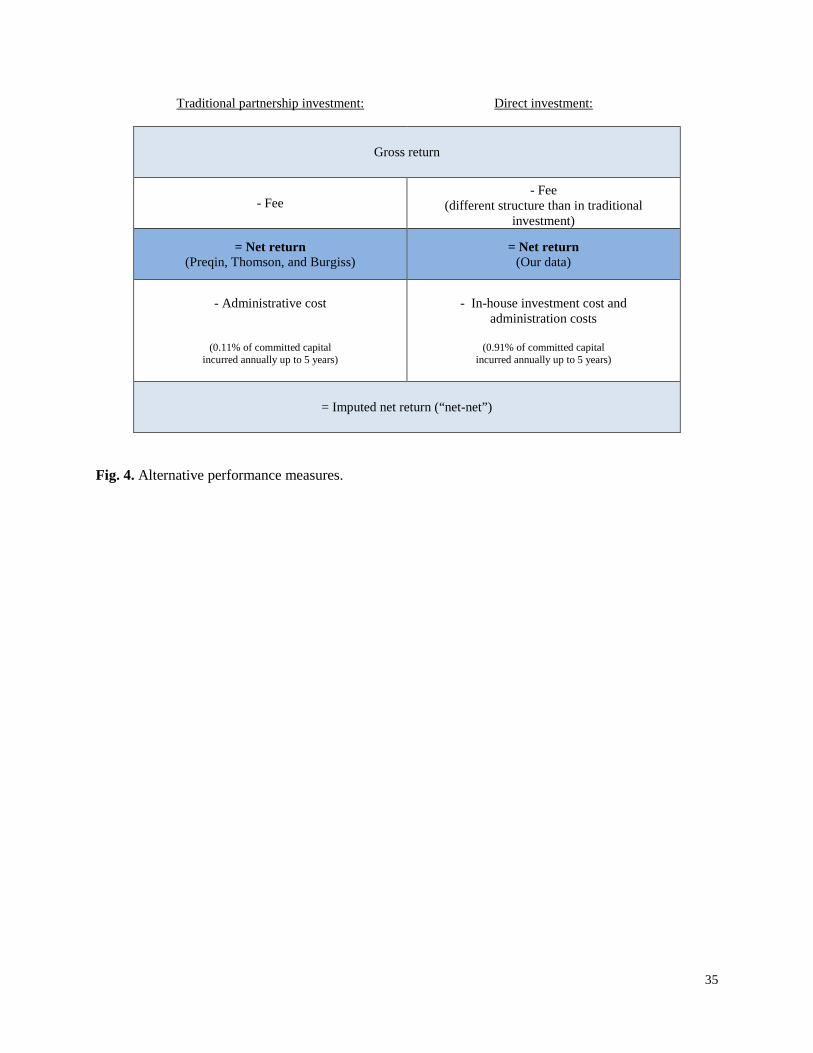
4.4.“Net-net” returns
So far we have compared net returns on direct investments with net returns from funds
(after fees and carry). We have not factored in the internal staff cost of running direct investment
program. This is illustrated in Fig. 4: the benchmarks computed by Preqin, Thomson, and
Burgiss are reported net of fees and carried interest paid to the GPs. The direct investment
returns were also universally provided to us on a net basis, that is, less any transaction fees and
carried interest charged by the GPs. We have assumed so far that it is appropriate to compare net
returns to the LPs (the third line of Fig. 4).
[FIGURE 4]
However, it might be anticipated that the staff salary and bonus costs incurred per unit of
capital in direct investments would be greater than those associated with a similar-sized
partnership investment, since direct investments require greater due diligence, more intensive
12 For the investments in columns two through nine, we use Robinson-Sensoy’s (2013) mean buyout fund tailored PME of 1.10 as the benchmark; in columns 10 and 11, their mean venture fund tailored PME of 1.06.
21
structuring, and ongoing monitoring. The legal costs may also be greater. The results reported in
Tables 3 and 4 may thus be misleading, as they do not net out the LPs’ internal costs of running
an investment program. In Table 5, we adjust our results for these costs.
[TABLE 5]
Several of the institutional investors in our study provided us with detailed data on their
costs of managing direct and partnership investment programs. These data allowed us to
calculate what might be termed a “net-net” performance, i.e., the performance after considering
all costs. (This comparison is depicted on the bottom line of the first panel of Fig. 4). In
particular, we received internal cost data (or at least estimates) from four of our institutional
investors. The estimates from all four were tightly bunched: the mean annual internal cost for
investing in private equity partnerships was 0.11% of committed capital, and the mean annual
cost of direct investing was 0.91% of committed capital. As we expected, investors’ internal cost
of running direct investments was much higher than the cost of investing in funds. In order to
calculate “net-net” returns from direct investments, we assumed that these costs were incurred
over five years. We based this assumption on the estimates provided by institutional investors in
our sample.13 For LPs’ investments in private equity funds, we assume the annual 0.11% internal
cost will be incurred over five years, which is based on the unpublished tabulations of the
estimated duration of investments in funds by Higson and Stucke (2012). We adjust the numbers
accordingly and re-compute the IRR. As Table 5 reports, the subtraction of the larger fees for
direct investments naturally diminishes the relative performance of direct investments over the
fund benchmarks.
13 Strömberg (2008) concluded that the average holding period for exited deals by private equity partnerships was 49 months. For obvious reasons, the use of a five-year horizon produces more conservative estimates of differential performance of the direct investments. The overall conclusions in this paper are qualitatively unaffected by using the Strömberg estimate.
22
4.5. TV/PI and IRR
We continue in Table 6 with the performance measures most typically used in practice,
TV/PI and IRR, again presenting the absolute returns of the direct investments in Panel A, and
then the numbers net of fund benchmarks (i.e., average TV/PI or IRR of private equity funds) in
Panel B. In Panel A, we test whether the aggregate TV/PI differs from one and the aggregate
IRR differs from zero, i.e., whether the investments are profitable. In Panel B, we test whether
the difference between the direct transactions and the various benchmarks differ from zero, i.e,
whether they outperform the benchmarks.
[TABLE 6]
We obtain our benchmarks—the average TV/PI and IRR for private equity funds—from
three major private equity data sources: Preqin, Burgiss, and Thomson VentureXpert. Which of
these benchmarks accurately reflect the private equity industry as a whole is a controversial issue
(see the discussion of concerns about the Thomson database, for instance, in Stucke, 2011).
Rather than designating one benchmark as the best, we sought to use all three.
We obtained the three benchmarks for funds closed in each vintage year, for each distinct
geographic region reported (typically the U.S. and all other, or else the U.S., Europe, and all
other) and deal type (VC or buyout). We compute these benchmarks through September 30, 2011
to most closely match the data we received from our LPs. For each data source and for each
vintage year, we downloaded the unweighted and capital-weighted average rate of return (IRR)
and unweighted and capital-weighted average investment multiple (TV/PI).14 To conserve space,
14 An important difference between direct investing and traditional private equity
investing is the absence of a fund structure. Typical performance measures such as those provided by Preqin, Thomson, and Burgiss (which we use later to benchmark our results) use fund, or portfolio, performance, whereas in our direct investment sample, each investment is treated individually. Given that we look at capital-weighted averages, this does not make a
23
we only report results using capital-weighted averages; results using simple averages are similar.
In Panel B, we examine separately the earlier (1991-1999) and later (2000- 2010) sub-periods for
co-investments and solo investments. The results are very similar if we custom match the deals
to benchmarks by transaction type or region.
A strong pattern is apparent in Table 6. We see a large deterioration of investment
performance over time, with substantially worse relative performance in the 2000s than in the
1990s. This is consistent with our findings in Tables 3 and 4. But what Table 6 further shows is
the consistently poor performance of the co-investments in the second half of the period, which
fall short of the fund benchmarks. (Other comparisons are less consistent in sign or significance.)
Using TV/PI as the metric, co-investments underperform fund investments during the 2000s by
0.04-0.15 (4%-15% of capital). In terms of IRR, the underperformance during this period is
about 5%-8% per year. The poor performance of co-investments during the second half of the
period appears to be highly related to the “hotness” of the private equity market, measured by
total fund commitments. In unreported analysis, we find that the correlation between TV/PI of
co-investments and total fund commitments is -0.54; the correlation between IRRs and total fund
commitments is similar, -0.52. Thus, the under-performance of co-investments is related to the
well-documented cyclicality of private equity performance.15
difference for TV/PI. But this does affect the IRR calculation: the IRR of a portfolio is not the value-weighted average of the IRR of its investments. Thus, in an unreported analysis, we also calculate pseudo “portfolio IRRs” for our direct investments. This is done by treating investments initiated in the same year by the same investor as one portfolio regardless of the year of any follow-on investments. The results are consistent with those reported here.
15 In an unreported result, we re-examined the result in Table 6 by looking at the performance net of the public market return. Our rationale for examining market-adjusted returns is based on the work of Robinson and Sensoy (2013). These authors argue that even though the absolute returns of private equity partnership investments in peak years is lower, the returns in these years relative to public market benchmarks do not differ significantly. This distinction is important because of the way in which institutional investors make investment decisions. In
24
The results regarding co-investments are particularly striking. Since institutions often co-
invest with the same funds in which they are LPs, but with dramatically lower fees, one might
think that outperformance would be nearly automatic. We have already seen one pattern
consistent with their poor performance—the bunching of co-investments in poor investment
periods, typically around market peaks—but this question deserves further investigation. To do
this, we match the co-investments in our sample to the corresponding fund that invested in the
same deal and compare the size and performance of the deal to those of the fund as a whole. We
are able to identify 103 co-investments where we know the performance of one or more
associated funds. These transactions have 179 fund matches because of “club deals,” or
transactions with multiple private equity sponsors. The results are reported in Table 7. Panel A
compares deal size; Panel B compares performance.
The first thing to note is that the co-investment deals are substantially larger than the
typical deals in the GPs’ portfolios. Table 7, Panel A compares the typical co-investment size.
We restrict the comparison to transactions done two, three, and five years after the direct
investment to ensure comparability. Each of the differences reported is statistically significant
and economically large. For instance, using a five-year window, the median co-investment’s
enterprise value is three times larger than the median contemporaneous deal done by the same
particular, institutions frequently have a target amount reserved for investments in equities, whether public or private. The returns of public and private equities are often highly correlated. Thus, the poor performance of private equity during years with large numbers of investments may be not as damaging, because the public market investments would be reduced by a corresponding amount. In other words, for every dollar invested in direct investments, there is one less dollar invested in public equities. (Indeed, Lerner, et al. (2013) presents an example of an institution that explicitly reduces public equity holdings when making direct private investments.) We reduce the returns of both the direct investments and the corresponding private equity benchmarks by the performance of the public markets over the same period, assuming a holding period of five years for both the direct investments and the partnerships and using a blended index as in Table 4. The results are little changed.
25
GP. The large size discrepancy between deals with co-investments and the GPs’ other
investments indicates that there is selection on the GP side: LPs are invited to co-invest when
GPs need extra capital.
To understand whether these deals are as attractive as the other transactions undertaken
by the fund, we look at their ex-post performance as compared to that of the fund. The results are
shown in Table 7, Panel B. On average, IRRs of investments with co-investments are nearly 9%
lower than the overall fund performance, a difference which is significant at the one percent
confidence level.16 The difference for TV/PI, -0.22, is also statistically significant at the one
percent level. Put together, if performance is used as an ex-post (albeit imperfect) measure of
deal quality, the result does indicate that co-investments are of lower quality. Large
underperformance in IRRs is particularly concentrated between 2006-2008, peak years of PE
markets.
[TABLE 7]
Finally, in this section, we explore two alternative explanations for the poor performance
of co-investments. One possibility is the co-investments may take place well after the original
investments, in an attempt to salvage these investments at a time when the GPs had exhausted
their funds and could not insert more capital into the companies. Alternatively, the pattern may
be driven by the credit cycle: co-investments may be bunched in periods when companies and
private equity investors were unable to access the credit market. If either explanation held, the
performance of the direct deals may not reflect the unconstrained choices that these investors
would have otherwise made.
16 The difference is understated, since the fund performance is not net of the deal where
the co-investment was made.
26
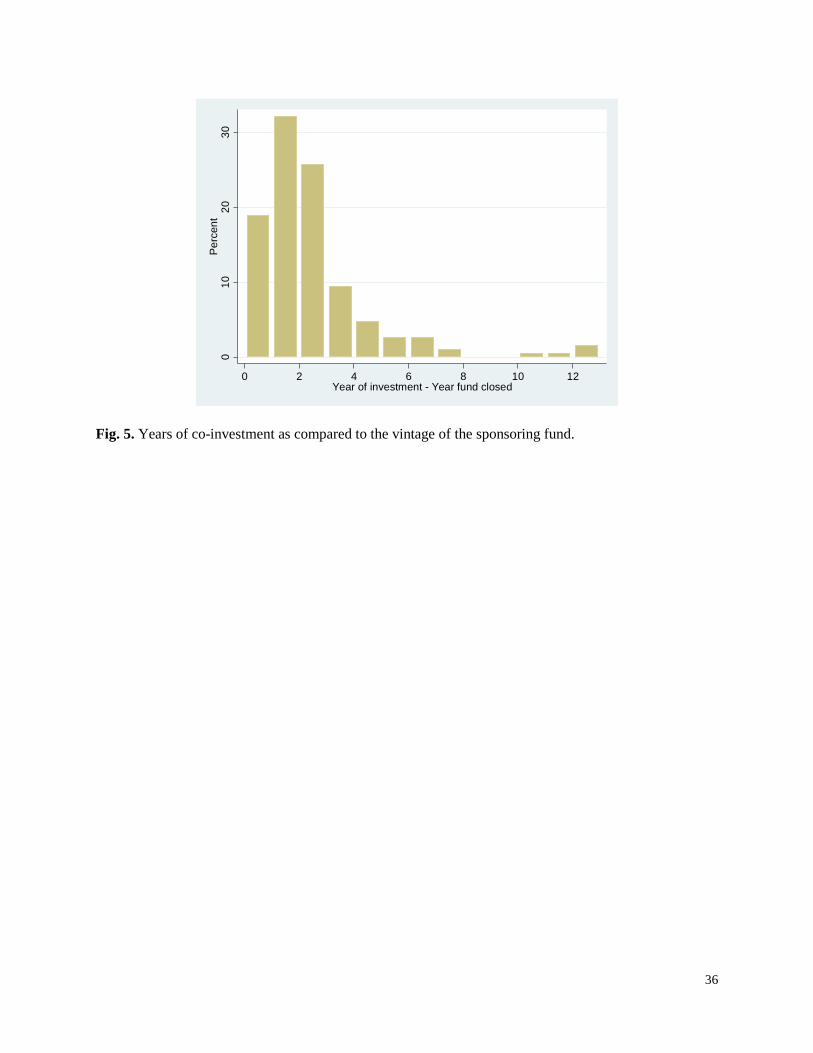
In Fig. 5, we examine in our sample of co-investments the difference between the year of
the co-investment and the vintage year of the fund with which the co-investment was made. The
bulk of the transactions are made in the three years after the fund closes, which suggests these
are not efforts to salvage troubled deals. It should be noted that even this calculation overstates
the delays between fund closing and the investment: we record the year of the direct investment
as the year in which the cash outflow actually occurs, which can be substantially after the
original decision to undertake the transaction. (For instance, the Harrah’s transaction was
announced in 2006, but the actual investment was not made until 2008.)
[FIGURE 5]
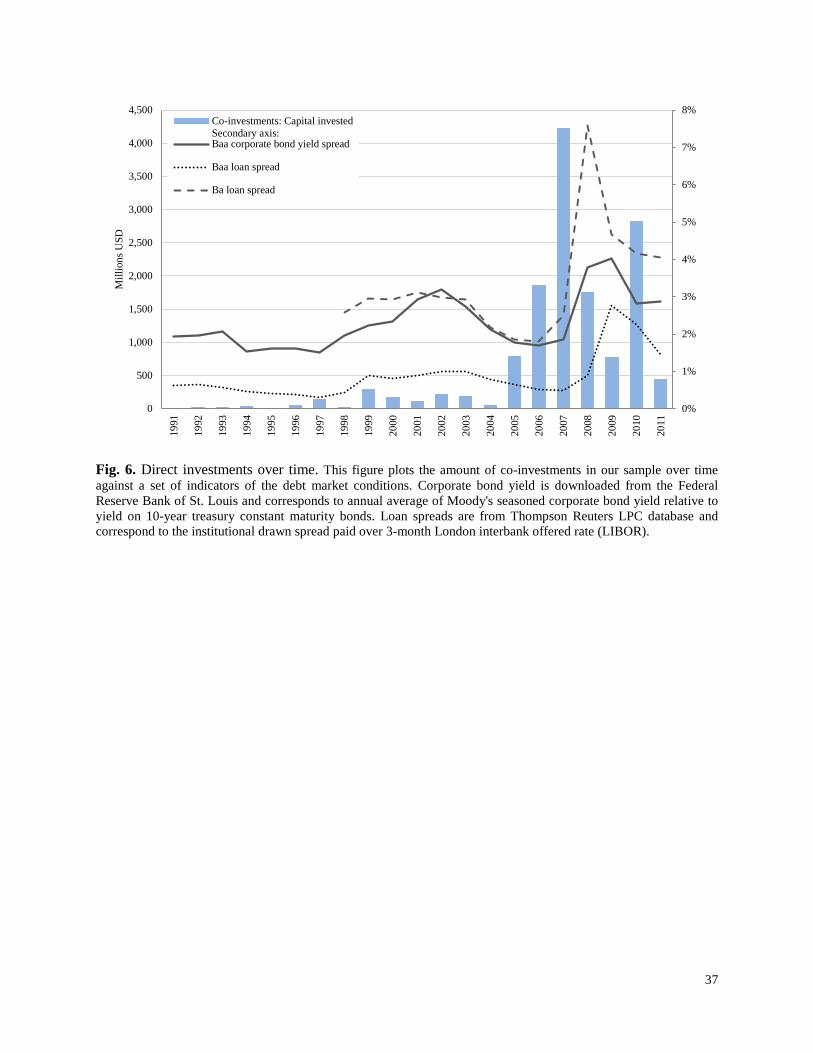
In Fig. 6, we depict the relationship between the timing of the co-investments in our
sample and several indicators of credit market conditions. There is little evidence to suggest that
these investments are made during periods when credit spreads are high: (equity) co-investments
do not seem to be used as a substitute for credit during periods when its access is restricted. On
the contrary, co-investments concentrated in the years when credit was especially cheap (2005-
2007). These patterns are borne out in an unreported regression analysis.
[FIGURE 6]
5. Regression analyses
To better understand the drivers of the performance results, we conduct multivariate
regression analyses of the differences between the returns of direct investments and their deal-
matched benchmarks. In particular, we match each transaction to the private equity fund
benchmark based on the investment stage, year of the investment, and geography. We then
subtract the matched benchmark from the deal performance to generate the dependent variable.
This allows us to exclusively focus on the relative performance of solo and co-investments.
27
The results are reported in Tables 8 and 9. In the first four specifications, which analyze
PME, we use the Harris, et al. (2013) private equity fund benchmark; in the last four
specifications, which focus on IRRs, we use the Preqin fund benchmark matched by the type of
investment.17 We present the analyses net of fees (as in Tables 3, 4, and 6) and with an additional
adjustment for the impact of in-house investment cost (“net-net,” akin to Table 5). The addition
of investor fixed effects (as well as clustering of standard errors by investor) ensures that results
are derived from a comparison of the different transactions by each investor, and not from the
cross-section of investors.
First, we examine the relative performance of venture deals, which constitute 21% of our
sample (80 out of 390 deals). Due to their early-stage nature, venture deals generally entail more
uncertainty and information barriers and potentially require more active management and
monitoring on the part of the investor. This is the type of setting where intermediaries should be
more important and worse performance for solo investments expected.
This is exactly what we find in Table 8. Solo investments substantially outperform co-
investments, but not when the deals are venture. The addition of a control for home country deals
does not affect the results, and the coefficient on this additional control variable is inconsistent in
sign and significance.
[TABLE 8]
As a second proxy for information costs, we use the proximity between the institutional
investor and the investment target, measured in hundreds of kilometers. The evidence in Table 9
is again generally consistent with the prediction that information problems will affect solo
investment returns. More local solo investments have higher PMEs: the interaction between the
17 The results are robust to the use of other benchmarks, such as the Robinson-Sensoy (2013) tailored PME fund benchmarks or fund IRR benchmarks based on geography.
28
solo investment dummy and distance is negative. This suggests that solo investments made in
targets far away from the institutional investors’ location perform worse, all else equal (for
similar evidence from public markets, see Coval and Moskowitz, 2001). The interaction is of a
similar sign, but statistically insignificant, in the IRR regressions. The control for home country
deals is inconsistent in sign and generally insignificant. Collectively, our evidence suggests that,
consistent with theoretical predictions, information problems enhance the value of
intermediation, and reduce the attractiveness of solo investing.
[TABLE 9]
6. Concluding remarks
Financial intermediation has been a subject of considerable study in the finance literature.
On the one hand, these middlemen should be able overcome transaction cost and information
problems; on the other, they may be prone to agency conflicts which affect their performance
and may charge high fees. The value of intermediation is an important question.
This paper focuses on the private equity setting, where disintermediation—LPs making
investments directly— has become an emerging trend. Despite the growing interest among LPs
in “going direct,” no empirical evidence exists on this phenomenon. Do LPs earn higher returns
with direct investments than simply investing in public equity markets? Do they do better with
direct investments than with their fund investments? Within direct investments, do co-
investments (which are generated by the GPs) outperform solo deals (which are generated by the
LPs)? These questions are not only of practical relevance to LPs’ asset allocation decisions, but
they also address key questions about the economics of private equity investing and of financial
intermediation. For example, one might expect direct investments to underperform fund
investments if GPs are more “skilled” in selecting investments and if the higher costs (fees and

29
carry) do not dissipate all the upside. But the opposite may be true if LPs are just as skilled in
deal selection or if there are severe agency costs.
Using proprietary data, we offer the first large sample evidence of the relative
performance of direct investments by large institutional investors. Our sample includes 390 deals
by a set of seven institutions, both co-investments and solo investments, covering over twenty
years. We find that direct deals considerably outperform public market benchmarks, with the
exception of venture deals (especially in the 2000s). When compared to private equity fund
PMEs, outperformance seems confined to buyout funds. We further find that the performance of
co-investments is quite poor when compared to the funds they invest with, while solo direct
investments do well compared to benchmarks. The latter effect is not uniform, however: direct
deals do better when institutions can exploit their information advantages, e.g., by investing
locally and in settings where information problems are not too great.
30
References Admati, A., Pfleider, P. 1994. Robust financial contracting and the role of venture capitalists. Journal of
Finance 49, 371-402. Allen, F., 2001. Do financial institutions matter? Working Paper no. 01-04. Wharton Financial
Institutions Center, University of Pennsylvania. Allen, F., Santomero, A., 1998. What do financial intermediaries do? Journal of Banking and Finance 25,
271-294. Axelson, U., Sorensen, M., Strömberg, P., 2013a. The alpha and the beta of private equity. Unpublished
Working Paper. London School of Economics. Axelson, U., Jenkinson, T., Strömberg, P., Weisbach, M., 2013b. Borrow cheap, buy high? Determinants
of leverage and pricing in buyouts. Journal of Finance, forthcoming. Becker, B., Ivashina, V., 2013. Reaching for yield in the corporate bond market. Journal of Finance,
forthcoming. Chan, Y., 1983. On the positive role of financial intermediation in allocation of venture capital in a
market with imperfect information. Journal of Finance 38, 1543-1568. Chevalier, J., Ellison, G., 1997. Risk taking by mutual funds as a response to incentives. Journal of
Political Economy 105, 1167-1200. Chevalier, J., Ellison, G., 1999. Career concern of mutual fund managers. Quarterly Journal of Economics
114, 389-432. Coval, J., Moskowitz, T., 2001. The geography of investment: Informed trading and asset prices. Journal
of Political Economy, 109, 811-841. Diamond, D., 1984. Financial intermediation and delegated monitoring. Review of Economic Studies 51,
393-414. Fama, E., French, K., 1997. Industry cost of equity. Journal of Financial Economics 43, 153-193. Gompers, P., 1996. Grandstanding in the venture capital industry. Journal of Financial Economics 42,
133-156. Gompers, P., Lerner, J., 1999. An analysis of compensation in the U.S. venture capital partnership.
Journal of Financial Economics 51, 3-44. Gompers, P., Lerner, J., 2000. Money chasing deals? The impact of fund inflows on private equity
valuations. Journal of Financial Economics 55, 281-325. Gorton, G., Winton, A., 2003. Financial intermediation. In: Constantinides, G., Harris, M., Stulz, R.
(Eds.), The Handbook of the Economics of Finance: Corporate Finance. Elsevier Science, New York, pp.431-552.
Gottschalg, O., Phalippou, L., 2009. The performance of private equity funds. Review of Financial Studies 22, 1747-1776.
Harris, R., Jenkinson, T., Kaplan, S., 2013. Private equity performance: What do we know? Journal of Finance, forthcoming.
Harris, R., Jenkinson, T., Kaplan, S., Stucke, E., 2013. Has persistence persisted in private equity? Unpublished Working Paper. University of Chicago.
Higson, C., Stucke, R., 2012. The performance of private equity. Unpublished Working Paper. Oxford University.
Hochberg, Y., Rauh, J., 2011. Local overweighting and underperformance: Evidence from limited partner equity investments. Working Paper no. 17122. National Bureau of Economic Research.
31
Hong, H., Kubik, J., Solomon, A., 2000. Security analysts’ career concerns and herding of earnings forecasts. Rand Journal of Economics 31, 121-144.
Hoye, A., Lerner, J., 1996. The Exxel Group: September 1995. Harvard Business School Case no. 9-297-068.
Kaplan, S., Schoar, A., 2005. Private equity performance: returns, persistence, and capital flows. Journal of Finance 60, 1791-1823.
Kaplan, S., Strömberg, P., 2003. Financial contracting meets the real world: Evidence from venture capital contracts. Review of Economic Studies 70, 281-315.
Kaplan, S., Strömberg, P., 2004. Characteristics, contracts, and actions: Evidence from venture capitalist analyses. Journal of Finance 59, 2177-2210.
Korteweg, A., Sorensen, M., 2014. Skill and luck in private equity performance. Unpublished Working Paper. Columbia University.
Leland, H., Pyle, D., 1977. Informational asymmetries, financial structure, and financial intermediation. Journal of Finance 32, 371-387.
Lerner, J., Rhodes-Kropf, M., Burbank, N., 2013. Canada Pension Plan Investment Board: October 2012. Harvard Business School Case no 9-813-103.
Lerner, J., Schoar, A., Wongsunwai, W., 2007. Smart institutions, foolish choices: The limited partner performance puzzle. Journal of Finance 62, 731-764.
Lopez-de-Silanes, F., Phalippou, L., Gottschalg, O., 2011. Giants at the gate: On the cross-section of private equity investment returns. Discussion Paper no. 20000. Tinbergen Institute.
Metrick, A., Yasuda, A., 2010. The economics of private equity funds. Review of Financial Studies 23, 2303-2341.
Robinson, D., Sensoy, B., 2013. Cyclicality, performance measurement, and cash flow liquidity in private equity. Working Paper no. 2010-03-021. Fisher College of Business, Ohio State University.
Shleifer, A., Vishny, R., 1997. The limits of arbitrage. Journal of Finance 52, 35-55. Sorensen, M. Jagannathan, R., 2013. The public market equivalent and private equity performance.
Research Paper No. 13-34. Columbia Business School. Strömberg , P., 2008. The new demography of private equity. In: Globalization of Alternative
Investments Working Papers Volume 1: The Global Economic Impact of Private Equity Report 2008. World Economic Forum, Geneva.
Stucke, R., 2011. Updating history. Unpublished Working Paper. Oxford University.
32
A. Traditional fund investing
B. Co-investing
C. Solo investing
Fig. 1. Different forms of private equity investing.
33
Fig. 2. Direct investments over time. This figure plots the amount of direct investments (solo investments and co-investments) in our sample over time. We use all private equity funds raised globally (from Preqin) as a proxy for direct investment amounts.
0
50,000
100,000
150,000
200,000
250,000
0
1,000
2,000
3,000
4,000
5,000
6,000
1991
1992
1993
1994
1995
1996
1997
1998
1999
2000
2001
2002
2003
2004
2005
2006
2007
2008
2009
2010
2011
Mill
ions
USD
Co-investments: Capital invested
Solo investments: Capital invested
Benchmark: Funds raised, all PE, global (secondary axis)
34
A. By number of deals
B. By volume
Fig. 3. Industry of direct investments. This figure plots the distribution of direct investments (solo investments and co-investments) in our sample across industries. We use the Fama and French (1997) 48-industry classification.
0%
2%
4%
6%
8%
10%
12%
14%
16%
18%
20%
22%A
ero
Agr
icA
utos
Bank
sBe
erBl
dMt
Book
sBo
xes
BusS
vCh
ems
Chip
sCl
ths
Cnstr
Com
psD
rugs
ElcE
qFa
bPr
Fin
Food Fun
Hlth
Hsh
ldIn
sur
Mac
hM
eals
Med
EqM
ines Oil
Oth
erPa
per
PerS
vRl
Est
Rtai
lRu
bbr
Ship
sSt
eel
Telc
mTo
ysTr
ans
Util
Whl
slN
/A
Co-investments Solo
0%
2%
4%
6%
8%
10%
12%
14%
16%
18%
20%
22%
Aer
oA
gric
Aut
osBa
nks
Beer
BldM
tBo
oks
Boxe
sBu
sSv
Chem
sCh
ips
Clth
sCn
strCo
mps
Dru
gsEl
cEq
FabP
rFi
nFo
od Fun
Hlth
Hsh
ldIn
sur
Mac
hM
eals
Med
EqM
ines Oil
Oth
erPa
per
PerS
vR
lEst
Rtai
lRu
bbr
Ship
sSt
eel
Telc
mTo
ysTr
ans
Util
Whl
slN
/A
Co-investments Solo
35
Traditional partnership investment:
Direct investment:
Gross return
- Fee - Fee
(different structure than in traditional investment)
= Net return (Preqin, Thomson, and Burgiss)
= Net return (Our data)
- Administrative cost
(0.11% of committed capital incurred annually up to 5 years)
- In-house investment cost and
administration costs
(0.91% of committed capital incurred annually up to 5 years)
= Imputed net return (“net-net”)
Fig. 4. Alternative performance measures.
36
Fig. 5. Years of co-investment as compared to the vintage of the sponsoring fund.
010
2030
Per
cent
0 2 4 6 8 10 12Year of investment - Year fund closed
37
Fig. 6. Direct investments over time. This figure plots the amount of co-investments in our sample over time against a set of indicators of the debt market conditions. Corporate bond yield is downloaded from the Federal Reserve Bank of St. Louis and corresponds to annual average of Moody's seasoned corporate bond yield relative to yield on 10-year treasury constant maturity bonds. Loan spreads are from Thompson Reuters LPC database and correspond to the institutional drawn spread paid over 3-month London interbank offered rate (LIBOR).
0%
1%
2%
3%
4%
5%
6%
7%
8%
0
500
1,000
1,500
2,000
2,500
3,000
3,500
4,000
4,500
1991
1992
1993
1994
1995
1996
1997
1998
1999
2000
2001
2002
2003
2004
2005
2006
2007
2008
2009
2010
2011
Mill
ions
USD
Co-investments: Capital investedSecondary axis:Baa corporate bond yield spread
Baa loan spread
Ba loan spread
38
Table 1 Sample characteristics and the evaluation of selection bias.
Panel A compares the basic statistics of the participating institutions in our sample with all others listed in the Thomson Reuters VentureXpert Limited Partners Database. Panel B compares the exits in our sample and other direct investments. We manually identified out-of-sample LPs and the direct investments they made from Capital IQ. Initial public offering (IPO), trade sale, secondary buyout, and bankruptcy are different exit types. “All exits” includes confirmed exits of an unknown type. Panel A: Sample characteristics
Mean (7 Investors in our sample)
Mean Other LPs (873 investors)
Private equity program founded (year) 1991.6 1986.1 Total assets under management ($US billion) 94.4 44.3 Total alternative assets under management ($US billion) 20.6 7.9 Private equity (as a % of assets under management) 15.8 13.2 Total identified PE fund commitments (number) 31.3 7.4
Panel B: Exit information
In sample LPs Out of sample LPs Diff. t-stat
IPO 23.8% 23.9% -0.01 Trade sale 66.7% 57.5% 0.79 Secondary buyout 0% 5.2% -1.07 Bankruptcy 0% 6.0% -1.15 Unknown exits 9.5% 7.5% 0.33
39
Table 2 Direct investments sample, 1991-2011.
This table summarizes the direct investments in our sample by year. All corresponds to the full sample of direct investments. Co-inv. and Solo correspond to the co-investment and solo investment sub-samples, respectively. Average U.S. leveraged buyout (LBO) enterprise value and equity contribution are computed from Standard and Poor’s LCD’s Leveraged Buyout Review. Mean investment size for matched sponsor fund for co-investments in our sample is computed using Capital IQ and Preqin data. The matched funds need to have the equity investment reported for at least two investments to be included in the sample.
Number of direct transactions
Total capital invested, direct deals ($US million)
Mean equity investment, direct deals ($US million)
Mean equity investment, matching deals ($US million)
Deal year All Co-inv. Solo
All Co-inv. Solo
All Co-inv. Solo U.S. LBO
deals Matched
sponsor funds 1991 4
4 54.37 -- 54.37 13.59 -- 13.59 -- --
1992 6 2 4 60.73 17.38 43.35 10.12 8.69 10.84 20.49 2.96 1993 6 2 4 38.77 12.14 26.63 6.46 6.07 6.66 83.76 -- 1994 10 3 7 482.79 32.98 449.81 48.28 10.99 64.26 48.40 -- 1995 9 1 8 376.24 1.10 375.14 41.80 1.10 46.89 56.44 -- 1996 19 10 9 261.25 48.46 212.79 13.75 4.85 23.64 38.53 76.38 1997 20 11 9 402.35 138.41 263.94 20.12 12.58 29.33 89.61 -- 1998 10 2 8 232.89 23.43 209.46 23.29 11.71 26.18 70.82 579.92 1999 13 8 5 458.12 290.41 167.72 35.24 36.30 33.54 106.88 206.17 2000 10 8 2 195.96 169.83 26.12 19.60 21.23 13.06 90.83 456.73 2001 10 9 1 151.93 103.99 47.94 15.19 11.55 47.94 86.20 304.00 2002 12 10 2 450.54 222.45 228.09 37.55 22.25 114.04 65.74 132.15 2003 13 9 4 436.87 192.92 243.95 33.61 21.44 60.99 73.18 263.41 2004 12 5 7 2,138.40 50.98 2,087.42 178.20 10.20 298.20 112.57 461.15 2005 35 28 7 2,398.22 789.29 1,608.92 68.52 28.19 229.85 153.34 810.56 2006 41 39 2 2,168.79 1,852.63 316.16 52.90 47.50 158.08 276.48 1,031.63 2007 59 56 3 4,885.55 4,222.79 662.76 82.81 75.41 220.92 278.19 385.90 2008 27 25 2 2,341.02 1,751.50 589.52 86.70 70.06 294.76 151.93 -- 2009 15 13 2 815.49 770.79 44.70 54.37 59.29 22.35 107.82 752.98 2010 41 31 10 3,895.09 2,819.69 1,075.40 95.00 90.96 107.54 80.74 1,297.95 2011 18 14 4 686.51 447.86 238.65 38.14 31.99 59.66 85.68
-- Total: 390 286 104 22,931.89 13,959.04 8,972.85 58.80 48.81 86.28 103.88 482.99 1991-2010 372 272 100 22,245.38 13,511.18 8,734.20 46.85 28.97 91.13 104.84 482.99 1991-1999 97 39 58 2,367.53 564.31 1,803.22 23.63 11.54 28.33 64.37 216.36 2000-2010 275 233 42 19,877.85 12,946.87 6,930.98 65.86 41.64 142.52 134.27 589.56
40
Table 3 Public Market Equivalent (PME) ratios (by year of investment), 1991-2011.
This table shows the average PME ratios by year of investment, comparing the returns of the direct investments to equivalently-timed investments in the S&P 500 index. We present both simple and weighted average PMEs for each year. Weighted averages use the total capital invested in given year by managers in our sample as weights. Panel A splits the sample into co-investments and solo investments; Panel B splits the sample into buyouts and venture investments. In Panel A, we report two statistical tests. The first set of asterisks indicates whether the mean PMEs are statistically significantly different from one. The second set of asterisks indicates whether they are significantly different from 1.18, the mean buyout fund PMEs reported by Robinson and Sensoy (2013). In Panel B, we follow the same convention for the mean PMEs (columns 2, 3, 6, and 7). Venture investments are compared with 1.03, the mean venture fund PME reported by Robinson and Sensoy (2013). Panel B also reports the difference between our annual PMEs with the corresponding buyout and venture fund mean PMEs reported by Harris, et al. (2013) (columns 4, 5, 8, and 9). Statistical significance indicated in these columns test the null hypothesis that the difference is equal to zero. ***, **, and * indicates statistical significance at the 1%, 5%, and 10% level, respectively.
Panel A: Co-investments vs. solo direct investments
All direct investments Co-investments Solo investments
Average Weighted average
Average Weighted average
Average Weighted average
1991 0.39 0.39 -- -- 0.39 0.39 1992 1.39 1.39 1.32 1.32 1.42 1.42 1993 1.52 1.72 2.32 2.32 1.38 1.45 1994 1.71 1.68 1.27 1.27 1.73 1.71 1995 1.00 0.90 1.20 1.20 0.90 0.90 1996 1.37 1.79 0.75 0.85 1.60 2.01 1997 1.47 1.31 1.13 1.44 1.48 1.24 1998 0.91 0.80 1.04 1.01 0.77 0.78 1999 2.04 3.27 2.15 2.84 2.74 4.01 2000 0.27 0.52 0.27 0.53 0.50 0.50 2001 1.12 1.66 1.03 1.49 2.03 2.03 2002 1.75 1.89 2.05 1.51 2.27 2.27 2003 1.32 2.18 1.44 2.22 2.15 2.15 2004 1.49 1.38 1.19 1.75 1.64 1.37 2005 1.46 1.13 1.40 1.21 1.09 1.09 2006 1.00 1.00 1.09 1.09 0.50 0.50 2007 1.18 1.20 1.11 1.10 1.85 1.85 2008 0.61 0.40 0.75 0.45 0.25 0.25 2009 1.37 1.65 1.36 1.67 1.36 1.36 2010 1.06 0.96 1.05 0.90 1.02 1.13 2011 1.06 1.05 1.06 1.04 1.05 1.07
Average 1991-2010 1.22**/ 1.36***/ ** 1.26*/ 1.38***/** 1.35**/ 1.42**/ Average 1991-2009 1.23***/ 1.38***/ ** 1.27**/ 1.40***/** 1.37**/ 1.44**/ Average 1991-1999 1.31**/ 1.47**/ 1.40*/ 1.53***/* 1.38*/ 1.55*/ Average 2000-2009 1.16 1.30**/ 1.17 1.30**/ 1.36 1.34
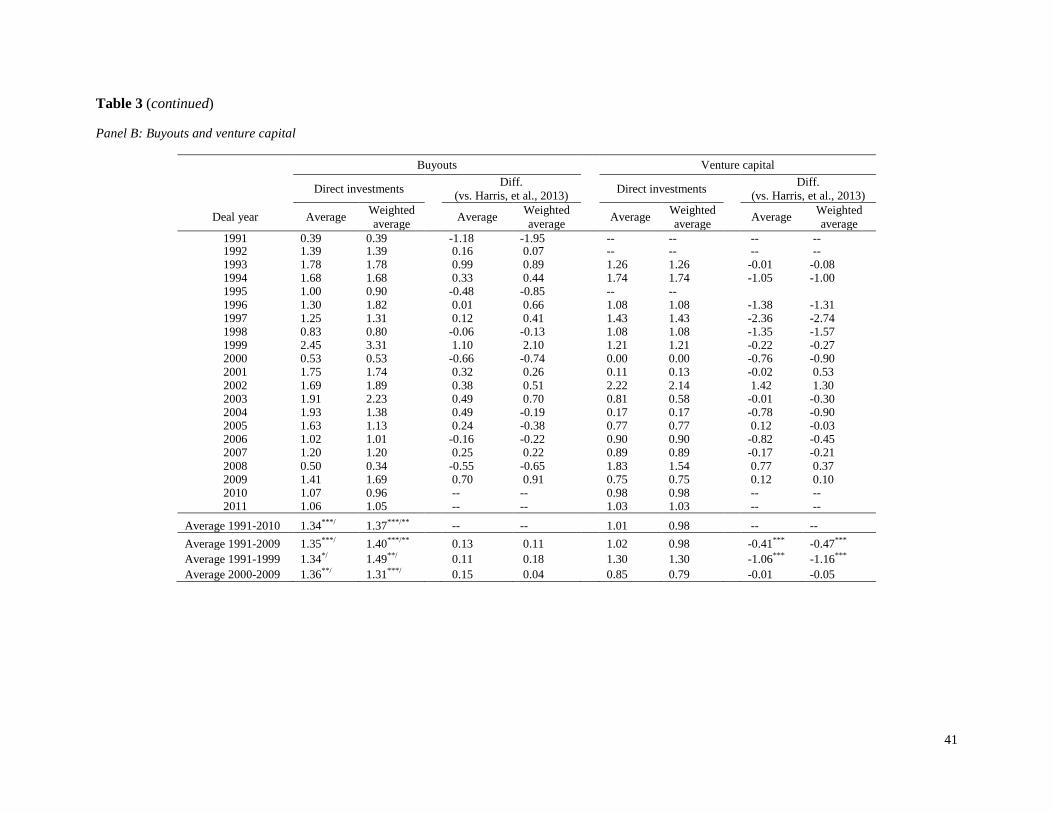
41
Table 3 (continued) Panel B: Buyouts and venture capital
Buyouts Venture capital
Direct investments Diff. (vs. Harris, et al., 2013)
Direct investments Diff. (vs. Harris, et al., 2013)
Deal year Average Weighted average Average Weighted
average Average Weighted
average Average Weighted
average 1991 0.39 0.39 -1.18 -1.95 -- -- -- -- 1992 1.39 1.39 0.16 0.07 -- -- -- -- 1993 1.78 1.78 0.99 0.89 1.26 1.26 -0.01 -0.08 1994 1.68 1.68 0.33 0.44 1.74 1.74 -1.05 -1.00 1995 1.00 0.90 -0.48 -0.85 -- -- 1996 1.30 1.82 0.01 0.66 1.08 1.08 -1.38 -1.31 1997 1.25 1.31 0.12 0.41 1.43 1.43 -2.36 -2.74 1998 0.83 0.80 -0.06 -0.13 1.08 1.08 -1.35 -1.57 1999 2.45 3.31 1.10 2.10 1.21 1.21 -0.22 -0.27 2000 0.53 0.53 -0.66 -0.74 0.00 0.00 -0.76 -0.90 2001 1.75 1.74 0.32 0.26 0.11 0.13 -0.02 0.53 2002 1.69 1.89 0.38 0.51 2.22 2.14 1.42 1.30 2003 1.91 2.23 0.49 0.70 0.81 0.58 -0.01 -0.30 2004 1.93 1.38 0.49 -0.19 0.17 0.17 -0.78 -0.90 2005 1.63 1.13 0.24 -0.38 0.77 0.77 0.12 -0.03 2006 1.02 1.01 -0.16 -0.22 0.90 0.90 -0.82 -0.45 2007 1.20 1.20 0.25 0.22 0.89 0.89 -0.17 -0.21 2008 0.50 0.34 -0.55 -0.65 1.83 1.54 0.77 0.37 2009 1.41 1.69 0.70 0.91 0.75 0.75 0.12 0.10 2010 1.07 0.96 -- -- 0.98 0.98 -- -- 2011 1.06 1.05 -- -- 1.03 1.03 -- --
Average 1991-2010 1.34***/ 1.37***/** -- -- 1.01 0.98 -- -- Average 1991-2009 1.35***/ 1.40***/** 0.13 0.11 1.02 0.98 -0.41*** -0.47*** Average 1991-1999 1.34*/ 1.49**/ 0.11 0.18 1.30 1.30 -1.06*** -1.16*** Average 2000-2009 1.36**/ 1.31***/ 0.15 0.04 0.85 0.79 -0.01 -0.05
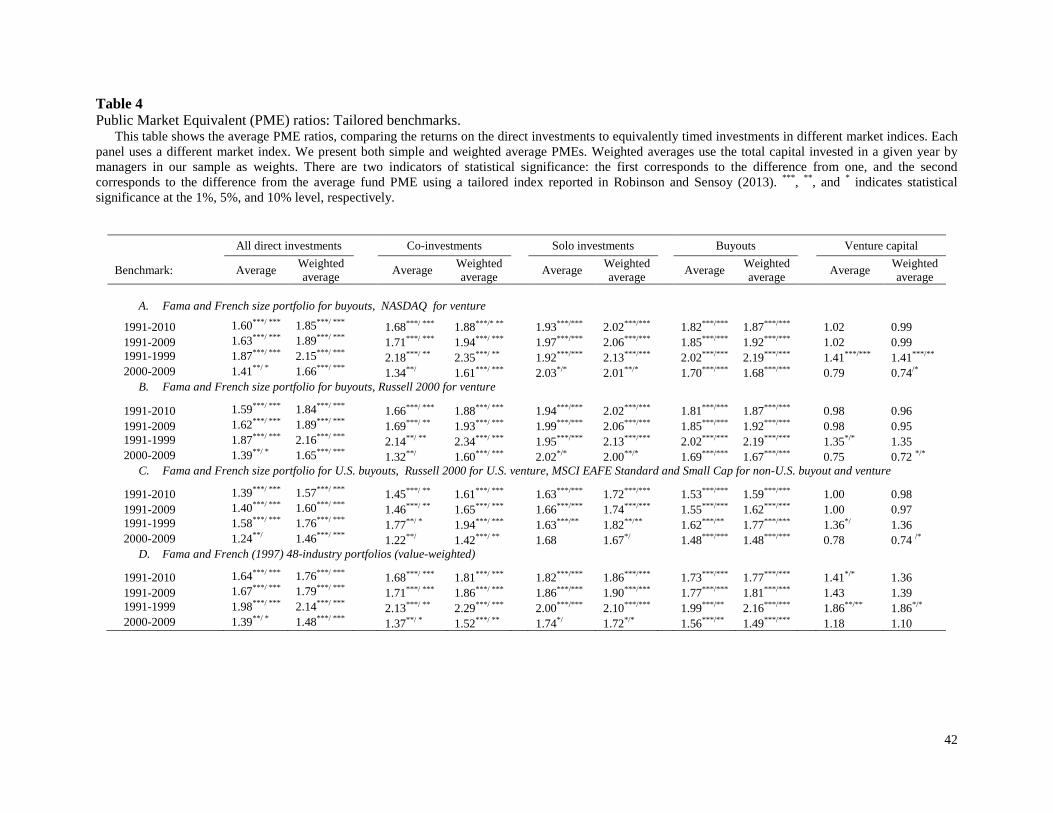
42
Table 4 Public Market Equivalent (PME) ratios: Tailored benchmarks.
This table shows the average PME ratios, comparing the returns on the direct investments to equivalently timed investments in different market indices. Each panel uses a different market index. We present both simple and weighted average PMEs. Weighted averages use the total capital invested in a given year by managers in our sample as weights. There are two indicators of statistical significance: the first corresponds to the difference from one, and the second corresponds to the difference from the average fund PME using a tailored index reported in Robinson and Sensoy (2013). ***, **, and * indicates statistical significance at the 1%, 5%, and 10% level, respectively.
All direct investments Co-investments Solo investments Buyouts Venture capital
Benchmark: Average Weighted average
Average Weighted average
Average Weighted average
Average Weighted average
Average Weighted average
A. Fama and French size portfolio for buyouts, NASDAQ for venture
1991-2010 1.60***/ *** 1.85***/ *** 1.68***/ *** 1.88***/* ** 1.93***/*** 2.02***/*** 1.82***/*** 1.87***/*** 1.02 0.99 1991-2009 1.63***/ *** 1.89***/ *** 1.71***/ *** 1.94***/ *** 1.97***/*** 2.06***/*** 1.85***/*** 1.92***/*** 1.02 0.99 1991-1999 1.87***/ *** 2.15***/ *** 2.18***/ ** 2.35***/ ** 1.92***/*** 2.13***/*** 2.02***/*** 2.19***/*** 1.41***/*** 1.41***/** 2000-2009 1.41**/ * 1.66***/ *** 1.34**/ 1.61***/ *** 2.03*/* 2.01**/* 1.70***/*** 1.68***/*** 0.79 0.74/*
B. Fama and French size portfolio for buyouts, Russell 2000 for venture
1991-2010 1.59***/ *** 1.84***/ *** 1.66***/ *** 1.88***/ *** 1.94***/*** 2.02***/*** 1.81***/*** 1.87***/*** 0.98 0.96 1991-2009 1.62***/ *** 1.89***/ *** 1.69***/ ** 1.93***/ *** 1.99***/*** 2.06***/*** 1.85***/*** 1.92***/*** 0.98 0.95 1991-1999 1.87***/ *** 2.16***/ *** 2.14**/ ** 2.34***/ *** 1.95***/*** 2.13***/*** 2.02***/*** 2.19***/*** 1.35*/* 1.35 2000-2009 1.39**/ * 1.65***/ *** 1.32**/ 1.60***/ *** 2.02*/* 2.00**/* 1.69***/*** 1.67***/*** 0.75 0.72 */*
C. Fama and French size portfolio for U.S. buyouts, Russell 2000 for U.S. venture, MSCI EAFE Standard and Small Cap for non-U.S. buyout and venture
1991-2010 1.39***/ *** 1.57***/ *** 1.45***/ ** 1.61***/ *** 1.63***/*** 1.72***/*** 1.53***/*** 1.59***/*** 1.00 0.98 1991-2009 1.40***/ *** 1.60***/ *** 1.46***/ ** 1.65***/ *** 1.66***/*** 1.74***/*** 1.55***/*** 1.62***/*** 1.00 0.97 1991-1999 1.58***/ *** 1.76***/ *** 1.77**/ * 1.94***/ *** 1.63***/** 1.82**/** 1.62***/** 1.77***/*** 1.36*/ 1.36 2000-2009 1.24**/ 1.46***/ *** 1.22**/ 1.42***/ ** 1.68 1.67*/ 1.48***/*** 1.48***/*** 0.78 0.74 /*
D. Fama and French (1997) 48-industry portfolios (value-weighted)
1991-2010 1.64***/ *** 1.76***/ *** 1.68***/ *** 1.81***/ *** 1.82***/*** 1.86***/*** 1.73***/*** 1.77***/*** 1.41*/* 1.36 1991-2009 1.67***/ *** 1.79***/ *** 1.71***/ *** 1.86***/ *** 1.86***/*** 1.90***/*** 1.77***/*** 1.81***/*** 1.43 1.39 1991-1999 1.98***/ *** 2.14***/ *** 2.13***/ ** 2.29***/ *** 2.00***/*** 2.10***/*** 1.99***/** 2.16***/*** 1.86**/** 1.86*/* 2000-2009 1.39**/ * 1.48***/ *** 1.37**/ * 1.52***/ ** 1.74*/ 1.72*/* 1.56***/** 1.49***/*** 1.18 1.10
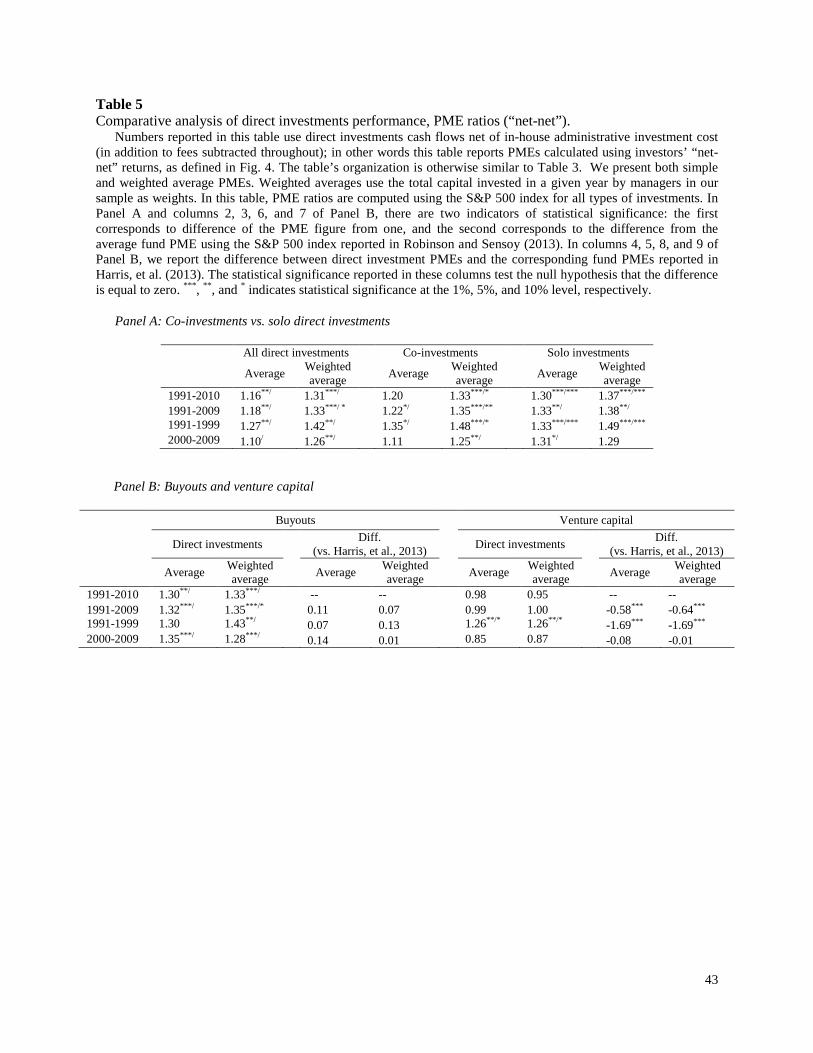
43
Table 5 Comparative analysis of direct investments performance, PME ratios (“net-net”).
Numbers reported in this table use direct investments cash flows net of in-house administrative investment cost (in addition to fees subtracted throughout); in other words this table reports PMEs calculated using investors’ “net-net” returns, as defined in Fig. 4. The table’s organization is otherwise similar to Table 3. We present both simple and weighted average PMEs. Weighted averages use the total capital invested in a given year by managers in our sample as weights. In this table, PME ratios are computed using the S&P 500 index for all types of investments. In Panel A and columns 2, 3, 6, and 7 of Panel B, there are two indicators of statistical significance: the first corresponds to difference of the PME figure from one, and the second corresponds to the difference from the average fund PME using the S&P 500 index reported in Robinson and Sensoy (2013). In columns 4, 5, 8, and 9 of Panel B, we report the difference between direct investment PMEs and the corresponding fund PMEs reported in Harris, et al. (2013). The statistical significance reported in these columns test the null hypothesis that the difference is equal to zero. ***, **, and * indicates statistical significance at the 1%, 5%, and 10% level, respectively.
Panel A: Co-investments vs. solo direct investments
All direct investments Co-investments Solo investments
Average Weighted average
Average Weighted average
Average Weighted average
1991-2010 1.16**/ 1.31***/ 1.20 1.33***/* 1.30***/*** 1.37***/*** 1991-2009 1.18**/ 1.33***/ * 1.22*/ 1.35***/** 1.33**/ 1.38**/ 1991-1999 1.27**/ 1.42**/ 1.35*/ 1.48***/* 1.33***/*** 1.49***/*** 2000-2009 1.10/ 1.26**/ 1.11 1.25**/ 1.31*/ 1.29
Panel B: Buyouts and venture capital
Buyouts Venture capital
Direct investments Diff. (vs. Harris, et al., 2013)
Direct investments Diff. (vs. Harris, et al., 2013)
Average Weighted average Average Weighted
average Average Weighted
average Average Weighted
average 1991-2010 1.30**/ 1.33***/ -- -- 0.98 0.95 -- -- 1991-2009 1.32***/ 1.35***/* 0.11 0.07 0.99 1.00 -0.58*** -0.64*** 1991-1999 1.30 1.43**/ 0.07 0.13 1.26**/* 1.26**/* -1.69*** -1.69*** 2000-2009 1.35***/ 1.28***/ 0.14 0.01 0.85 0.87 -0.08 -0.01
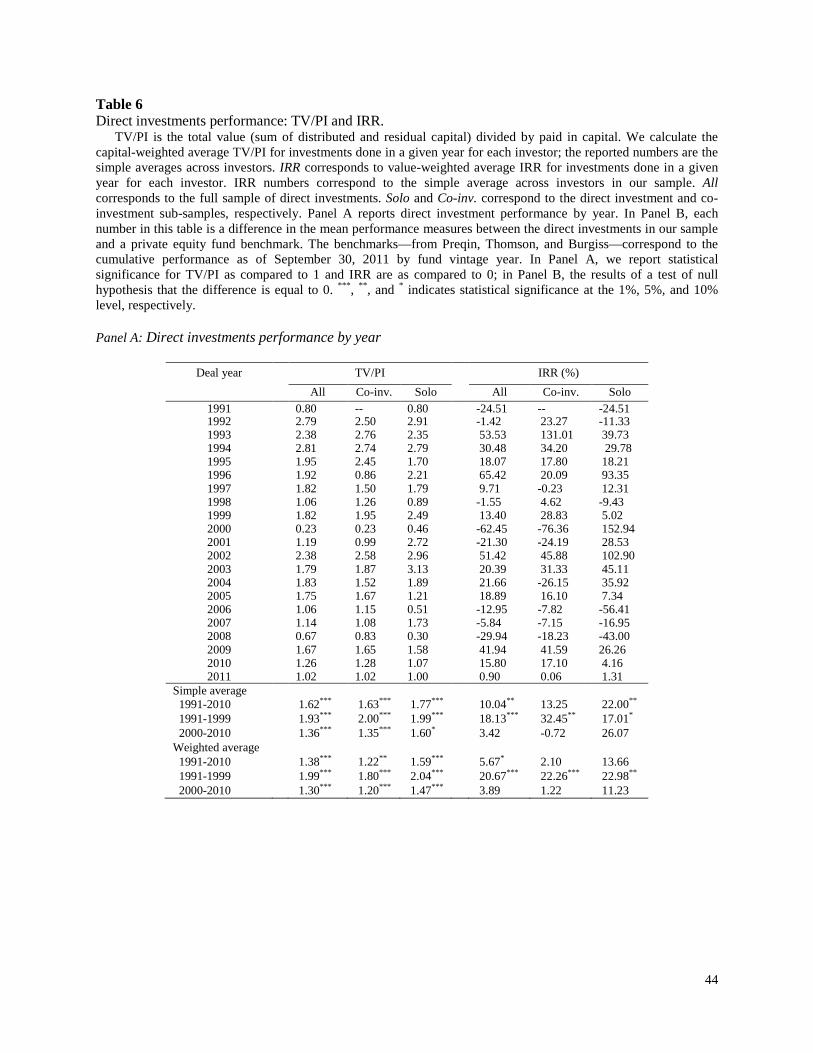
44
Table 6 Direct investments performance: TV/PI and IRR.
TV/PI is the total value (sum of distributed and residual capital) divided by paid in capital. We calculate the capital-weighted average TV/PI for investments done in a given year for each investor; the reported numbers are the simple averages across investors. IRR corresponds to value-weighted average IRR for investments done in a given year for each investor. IRR numbers correspond to the simple average across investors in our sample. All corresponds to the full sample of direct investments. Solo and Co-inv. correspond to the direct investment and co-investment sub-samples, respectively. Panel A reports direct investment performance by year. In Panel B, each number in this table is a difference in the mean performance measures between the direct investments in our sample and a private equity fund benchmark. The benchmarks—from Preqin, Thomson, and Burgiss—correspond to the cumulative performance as of September 30, 2011 by fund vintage year. In Panel A, we report statistical significance for TV/PI as compared to 1 and IRR are as compared to 0; in Panel B, the results of a test of null hypothesis that the difference is equal to 0. ***, **, and * indicates statistical significance at the 1%, 5%, and 10% level, respectively.
Panel A: Direct investments performance by year
Deal year TV/PI IRR (%) All Co-inv. Solo All Co-inv. Solo
1991 0.80 -- 0.80 -24.51 -- -24.51 1992 2.79 2.50 2.91 -1.42 23.27 -11.33 1993 2.38 2.76 2.35 53.53 131.01 39.73 1994 2.81 2.74 2.79 30.48 34.20 29.78 1995 1.95 2.45 1.70 18.07 17.80 18.21 1996 1.92 0.86 2.21 65.42 20.09 93.35 1997 1.82 1.50 1.79 9.71 -0.23 12.31 1998 1.06 1.26 0.89 -1.55 4.62 -9.43 1999 1.82 1.95 2.49 13.40 28.83 5.02 2000 0.23 0.23 0.46 -62.45 -76.36 152.94 2001 1.19 0.99 2.72 -21.30 -24.19 28.53 2002 2.38 2.58 2.96 51.42 45.88 102.90 2003 1.79 1.87 3.13 20.39 31.33 45.11 2004 1.83 1.52 1.89 21.66 -26.15 35.92 2005 1.75 1.67 1.21 18.89 16.10 7.34 2006 1.06 1.15 0.51 -12.95 -7.82 -56.41 2007 1.14 1.08 1.73 -5.84 -7.15 -16.95 2008 0.67 0.83 0.30 -29.94 -18.23 -43.00 2009 1.67 1.65 1.58 41.94 41.59 26.26 2010 1.26 1.28 1.07 15.80 17.10 4.16 2011 1.02 1.02 1.00 0.90 0.06 1.31
Simple average 1991-2010 1.62*** 1.63*** 1.77*** 10.04** 13.25 22.00** 1991-1999 1.93*** 2.00*** 1.99*** 18.13*** 32.45** 17.01* 2000-2010 1.36*** 1.35*** 1.60* 3.42 -0.72 26.07 Weighted average 1991-2010 1.38*** 1.22** 1.59*** 5.67* 2.10 13.66 1991-1999 1.99*** 1.80*** 2.04*** 20.67*** 22.26*** 22.98** 2000-2010 1.30*** 1.20*** 1.47*** 3.89 1.22 11.23
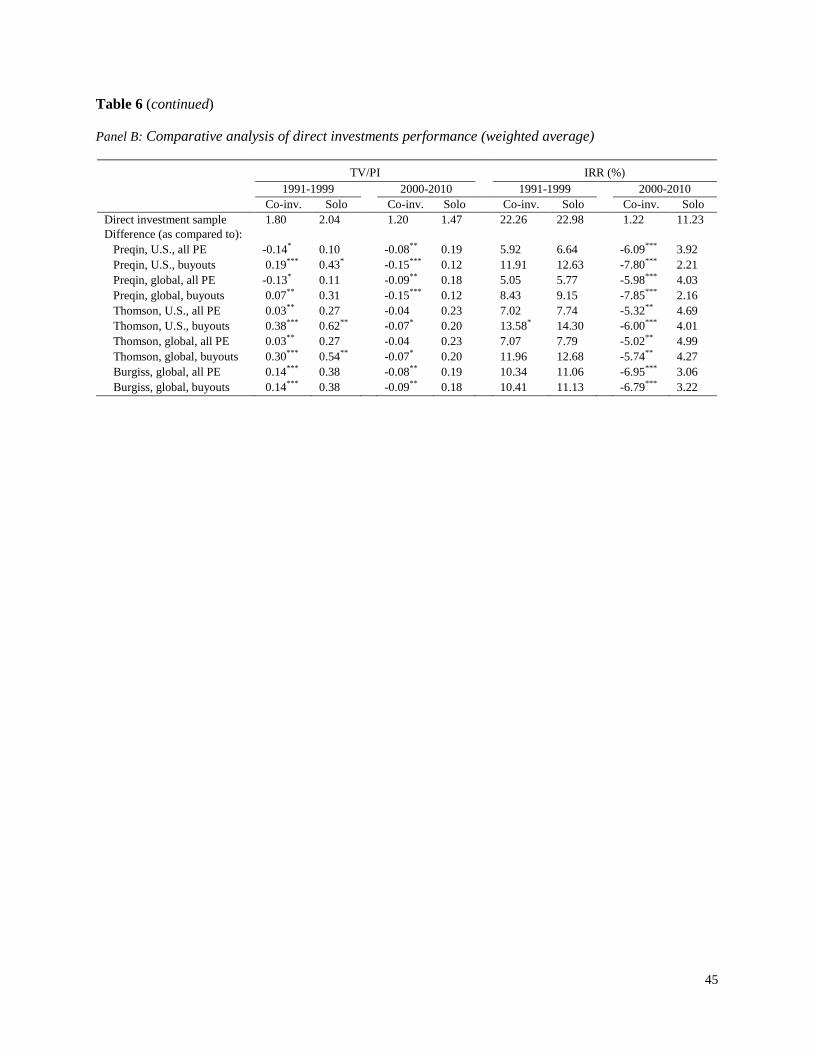
45
Table 6 (continued) Panel B: Comparative analysis of direct investments performance (weighted average)
TV/PI IRR (%) 1991-1999 2000-2010 1991-1999 2000-2010 Co-inv. Solo Co-inv. Solo Co-inv. Solo Co-inv. Solo Direct investment sample 1.80 2.04 1.20 1.47 22.26 22.98 1.22 11.23 Difference (as compared to): Preqin, U.S., all PE -0.14* 0.10 -0.08** 0.19 5.92 6.64 -6.09*** 3.92 Preqin, U.S., buyouts 0.19*** 0.43* -0.15*** 0.12 11.91 12.63 -7.80*** 2.21 Preqin, global, all PE -0.13* 0.11 -0.09** 0.18 5.05 5.77 -5.98*** 4.03 Preqin, global, buyouts 0.07** 0.31 -0.15*** 0.12 8.43 9.15 -7.85*** 2.16 Thomson, U.S., all PE 0.03** 0.27 -0.04 0.23 7.02 7.74 -5.32** 4.69 Thomson, U.S., buyouts 0.38*** 0.62** -0.07* 0.20 13.58* 14.30 -6.00*** 4.01 Thomson, global, all PE 0.03** 0.27 -0.04 0.23 7.07 7.79 -5.02** 4.99 Thomson, global, buyouts 0.30*** 0.54** -0.07* 0.20 11.96 12.68 -5.74** 4.27 Burgiss, global, all PE 0.14*** 0.38 -0.08** 0.19 10.34 11.06 -6.95*** 3.06 Burgiss, global, buyouts 0.14*** 0.38 -0.09** 0.18 10.41 11.13 -6.79*** 3.22
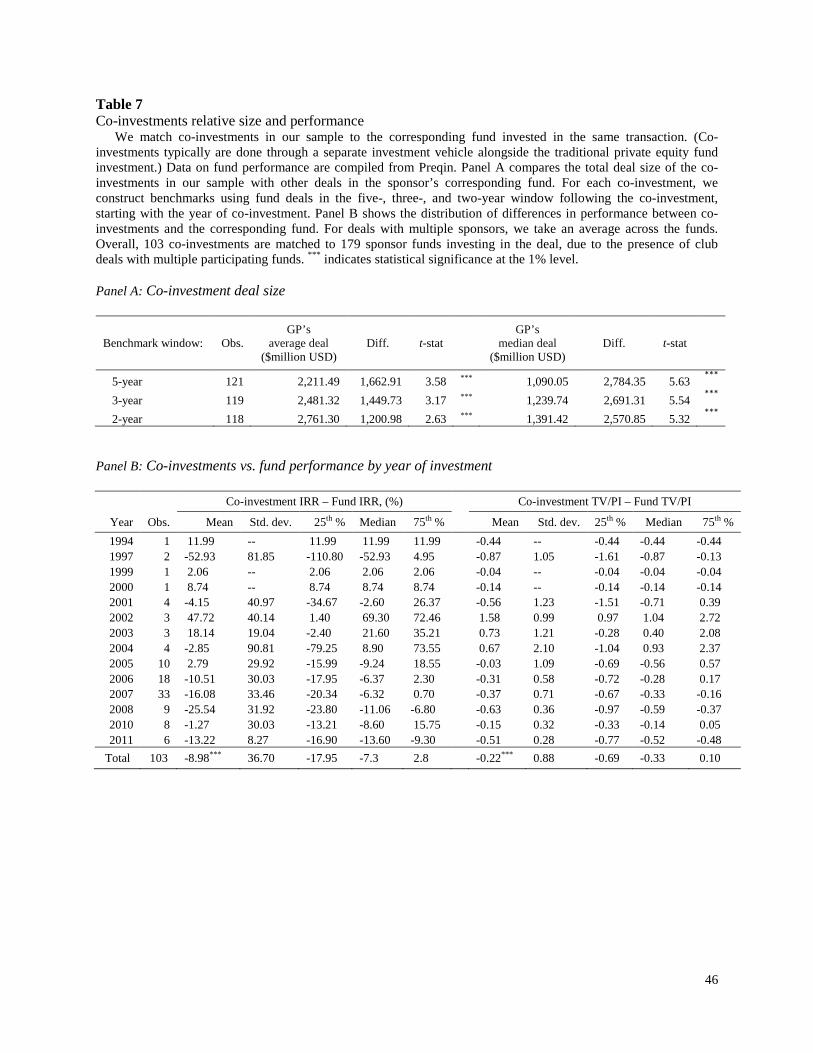
46
Table 7 Co-investments relative size and performance
We match co-investments in our sample to the corresponding fund invested in the same transaction. (Co-investments typically are done through a separate investment vehicle alongside the traditional private equity fund investment.) Data on fund performance are compiled from Preqin. Panel A compares the total deal size of the co-investments in our sample with other deals in the sponsor’s corresponding fund. For each co-investment, we construct benchmarks using fund deals in the five-, three-, and two-year window following the co-investment, starting with the year of co-investment. Panel B shows the distribution of differences in performance between co-investments and the corresponding fund. For deals with multiple sponsors, we take an average across the funds. Overall, 103 co-investments are matched to 179 sponsor funds investing in the deal, due to the presence of club deals with multiple participating funds. *** indicates statistical significance at the 1% level.
Panel A: Co-investment deal size
Benchmark window: Obs. GP’s
average deal ($million USD)
Diff. t-stat GP’s
median deal ($million USD)
Diff. t-stat
5-year 121 2,211.49 1,662.91 3.58 *** 1,090.05 2,784.35 5.63 ***
3-year 119 2,481.32 1,449.73 3.17 *** 1,239.74 2,691.31 5.54 ***
2-year 118 2,761.30 1,200.98 2.63 *** 1,391.42 2,570.85 5.32 ***
Panel B: Co-investments vs. fund performance by year of investment
Co-investment IRR – Fund IRR, (%) Co-investment TV/PI – Fund TV/PI
Year Obs. Mean Std. dev. 25th % Median 75th % Mean Std. dev. 25th % Median 75th % 1994 1 11.99 -- 11.99 11.99 11.99
-0.44 -- -0.44 -0.44 -0.44
1997 2 -52.93 81.85 -110.80 -52.93 4.95
-0.87 1.05 -1.61 -0.87 -0.13 1999 1 2.06 -- 2.06 2.06 2.06
-0.04 -- -0.04 -0.04 -0.04
2000 1 8.74 -- 8.74 8.74 8.74
-0.14 -- -0.14 -0.14 -0.14 2001 4 -4.15 40.97 -34.67 -2.60 26.37
-0.56 1.23 -1.51 -0.71 0.39
2002 3 47.72 40.14 1.40 69.30 72.46
1.58 0.99 0.97 1.04 2.72 2003 3 18.14 19.04 -2.40 21.60 35.21
0.73 1.21 -0.28 0.40 2.08
2004 4 -2.85 90.81 -79.25 8.90 73.55
0.67 2.10 -1.04 0.93 2.37 2005 10 2.79 29.92 -15.99 -9.24 18.55
-0.03 1.09 -0.69 -0.56 0.57
2006 18 -10.51 30.03 -17.95 -6.37 2.30
-0.31 0.58 -0.72 -0.28 0.17 2007 33 -16.08 33.46 -20.34 -6.32 0.70
-0.37 0.71 -0.67 -0.33 -0.16
2008 9 -25.54 31.92 -23.80 -11.06 -6.80
-0.63 0.36 -0.97 -0.59 -0.37 2010 8 -1.27 30.03 -13.21 -8.60 15.75
-0.15 0.32 -0.33 -0.14 0.05
2011 6 -13.22 8.27 -16.90 -13.60 -9.30
-0.51 0.28 -0.77 -0.52 -0.48 Total 103 -8.98*** 36.70 -17.95 -7.3 2.8 -0.22*** 0.88 -0.69 -0.33 0.10
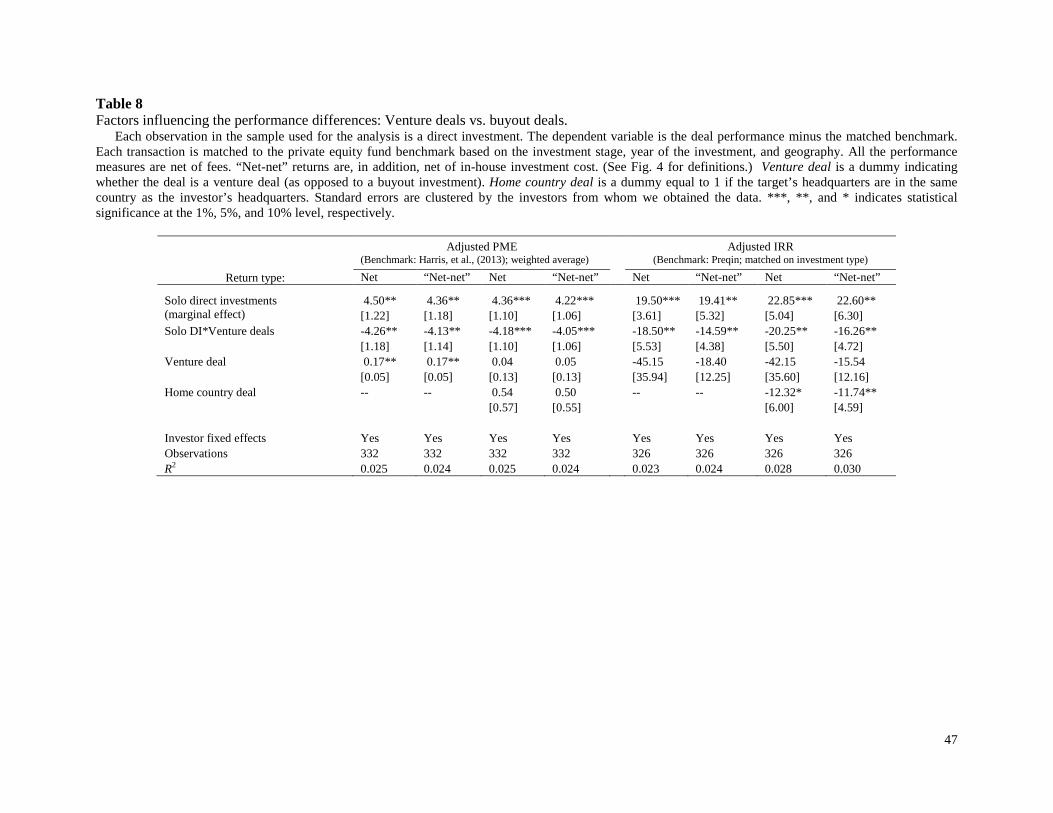
47
Table 8 Factors influencing the performance differences: Venture deals vs. buyout deals.
Each observation in the sample used for the analysis is a direct investment. The dependent variable is the deal performance minus the matched benchmark. Each transaction is matched to the private equity fund benchmark based on the investment stage, year of the investment, and geography. All the performance measures are net of fees. “Net-net” returns are, in addition, net of in-house investment cost. (See Fig. 4 for definitions.) Venture deal is a dummy indicating whether the deal is a venture deal (as opposed to a buyout investment). Home country deal is a dummy equal to 1 if the target’s headquarters are in the same country as the investor’s headquarters. Standard errors are clustered by the investors from whom we obtained the data. ***, **, and * indicates statistical significance at the 1%, 5%, and 10% level, respectively.
Adjusted PME
(Benchmark: Harris, et al., (2013); weighted average) Adjusted IRR
(Benchmark: Preqin; matched on investment type) Return type: Net “Net-net” Net “Net-net” Net “Net-net” Net “Net-net”
Solo direct investments 4.50** 4.36** 4.36*** 4.22*** 19.50*** 19.41** 22.85*** 22.60** (marginal effect) [1.22] [1.18] [1.10] [1.06] [3.61] [5.32] [5.04] [6.30] Solo DI*Venture deals -4.26** -4.13** -4.18*** -4.05*** -18.50** -14.59** -20.25** -16.26** [1.18] [1.14] [1.10] [1.06] [5.53] [4.38] [5.50] [4.72] Venture deal 0.17** 0.17** 0.04 0.05 -45.15 -18.40 -42.15 -15.54 [0.05] [0.05] [0.13] [0.13] [35.94] [12.25] [35.60] [12.16] Home country deal -- -- 0.54 0.50 -- -- -12.32* -11.74** [0.57] [0.55] [6.00] [4.59] Investor fixed effects Yes Yes Yes Yes Yes Yes Yes Yes Observations 332 332 332 332 326 326 326 326 R2 0.025 0.024 0.025 0.024 0.023 0.024 0.028 0.030
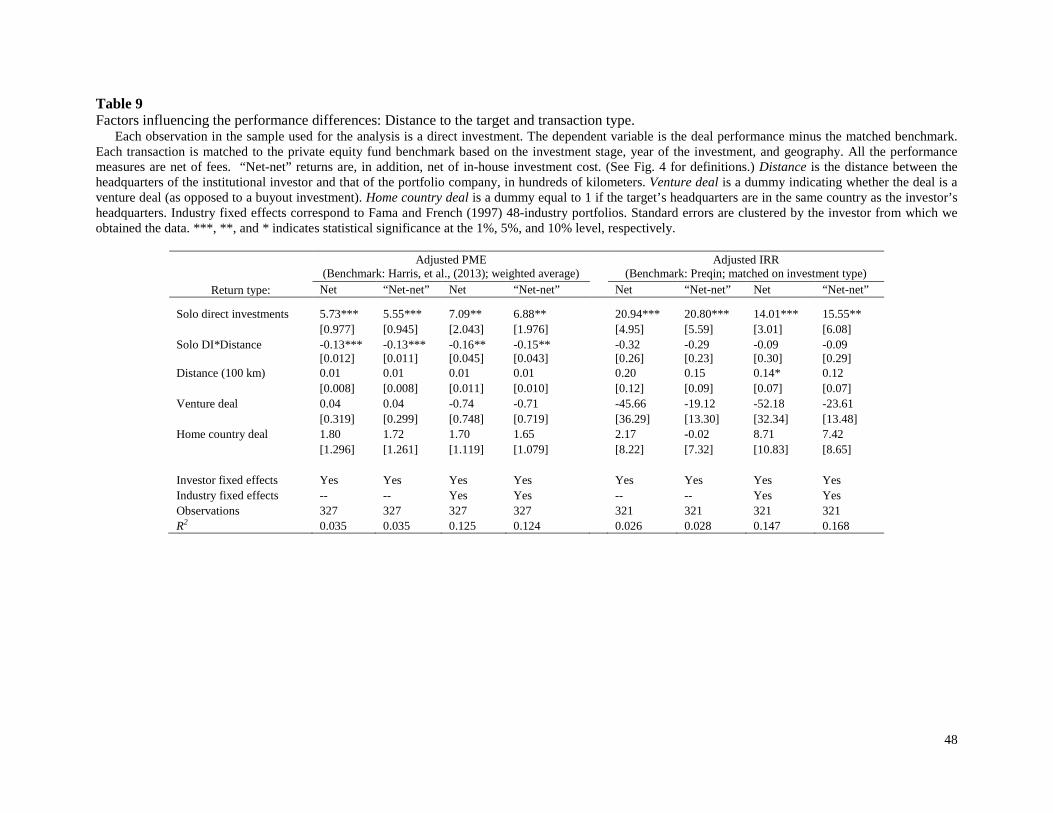
48
Table 9 Factors influencing the performance differences: Distance to the target and transaction type.
Each observation in the sample used for the analysis is a direct investment. The dependent variable is the deal performance minus the matched benchmark. Each transaction is matched to the private equity fund benchmark based on the investment stage, year of the investment, and geography. All the performance measures are net of fees. “Net-net” returns are, in addition, net of in-house investment cost. (See Fig. 4 for definitions.) Distance is the distance between the headquarters of the institutional investor and that of the portfolio company, in hundreds of kilometers. Venture deal is a dummy indicating whether the deal is a venture deal (as opposed to a buyout investment). Home country deal is a dummy equal to 1 if the target’s headquarters are in the same country as the investor’s headquarters. Industry fixed effects correspond to Fama and French (1997) 48-industry portfolios. Standard errors are clustered by the investor from which we obtained the data. ***, **, and * indicates statistical significance at the 1%, 5%, and 10% level, respectively.
Adjusted PME
(Benchmark: Harris, et al., (2013); weighted average) Adjusted IRR
(Benchmark: Preqin; matched on investment type) Return type: Net “Net-net” Net “Net-net” Net “Net-net” Net “Net-net”
Solo direct investments 5.73*** 5.55*** 7.09** 6.88** 20.94*** 20.80*** 14.01*** 15.55**
[0.977] [0.945] [2.043] [1.976] [4.95] [5.59] [3.01] [6.08]
Solo DI*Distance -0.13*** -0.13*** -0.16** -0.15** -0.32 -0.29 -0.09 -0.09
[0.012] [0.011] [0.045] [0.043] [0.26] [0.23] [0.30] [0.29]
Distance (100 km) 0.01 0.01 0.01 0.01 0.20 0.15 0.14* 0.12
[0.008] [0.008] [0.011] [0.010] [0.12] [0.09] [0.07] [0.07]
Venture deal 0.04 0.04 -0.74 -0.71 -45.66 -19.12 -52.18 -23.61
[0.319] [0.299] [0.748] [0.719] [36.29] [13.30] [32.34] [13.48]
Home country deal 1.80 1.72 1.70 1.65 2.17 -0.02 8.71 7.42
[1.296] [1.261] [1.119] [1.079] [8.22] [7.32] [10.83] [8.65]
Investor fixed effects Yes Yes Yes Yes Yes Yes Yes Yes Industry fixed effects -- -- Yes Yes -- -- Yes Yes Observations 327 327 327 327 321 321 321 321 R2 0.035 0.035 0.125 0.124 0.026 0.028 0.147 0.168