Embed Size (px)
Citation preview

The Astrophysical Journal, 743:50 (17pp), 2011 December 10 doi:10.1088/0004-637X/743/1/50C© 2011. The American Astronomical Society. All rights reserved. Printed in the U.S.A.
THE DISCOVERY OF Y DWARFS USING DATA FROM THE WIDE-FIELDINFRARED SURVEY EXPLORER (WISE)
Michael C. Cushing1,10, J. Davy Kirkpatrick2, Christopher R. Gelino2, Roger L. Griffith2, Michael F. Skrutskie3,A. Mainzer1, Kenneth A. Marsh2, Charles A. Beichman2, Adam J. Burgasser4,5,11, Lisa A. Prato6,
Robert A. Simcoe5, Mark S. Marley7, D. Saumon8, Richard S. Freedman7,Peter R. Eisenhardt1, and Edward L. Wright9
1 Jet Propulsion Laboratory, California Institute of Technology, 4800 Oak Grove Drive, MS 321-520, Pasadena, CA 91109, USA; [email protected] Infrared Processing and Analysis Center, California Institute of Technology, Pasadena, CA 91125, USA
3 Department of Astronomy, University of Virginia, Charlottesville, VA 22904, USA4 Center for Astrophysics and Space Science, University of California San Diego, La Jolla, CA 92093, USA
5 Massachusetts Institute of Technology, 77 Massachusetts Avenue, Building 37, Cambridge, MA 02139, USA6 Lowell Observatory, 1400 West Mars Hill Road, Flagstaff, AZ 86001, USA7 NASA Ames Research Center, MS 254-3, Moffett Field, CA 94035, USA
8 Los Alamos National Laboratory, MS F663, Los Alamos, NM 87545, USA9 Department of Physics and Astronomy, UCLA, Los Angeles, CA 90095, USAReceived 2011 June 10; accepted 2011 August 2; published 2011 November 22
ABSTRACT
We present the discovery of seven ultracool brown dwarfs identified with the Wide-field Infrared Survey Explorer(WISE). Near-infrared spectroscopy reveals deep absorption bands of H2O and CH4 that indicate all seven ofthe brown dwarfs have spectral types later than UGPS J072227.51−054031.2, the latest-type T dwarf currentlyknown. The spectrum of WISEP J182831.08+265037.8 is distinct in that the heights of the J- and H-band peaks areapproximately equal in units of fλ, so we identify it as the archetypal member of the Y spectral class. The spectraof at least two of the other brown dwarfs exhibit absorption on the blue wing of the H-band peak that we tentativelyascribe to NH3. These spectral morphological changes provide a clear transition between the T dwarfs and the Ydwarfs. In order to produce a smooth near-infrared spectral sequence across the T/Y dwarf transition, we havereclassified UGPS 0722−05 as the T9 spectral standard and tentatively assign WISEP J173835.52+273258.9 as theY0 spectral standard. In total, six of the seven new brown dwarfs are classified as Y dwarfs: four are classified as Y0,one is classified as Y0 (pec?), and WISEP J1828+2650 is classified as >Y0. We have also compared the spectra tothe model atmospheres of Marley and Saumon and infer that the brown dwarfs have effective temperatures rangingfrom 300 K to 500 K, making them the coldest spectroscopically confirmed brown dwarfs known to date.
Key words: brown dwarfs – infrared: stars – stars: individual (UGPS J072227.51−054031.2, WISEPCJ014807.25−720258.8, WISEP J041022.71+150248.5, WISEPC J140518.40+553421.5, WISEP J154151.65-225025.2, WISEP J173835.52+273258.9, WISEP J182831.08+265037.8, WISEPC J205628.90+145953.3) –stars: low-mass
Online-only material: color figures
1. INTRODUCTION
Brown dwarfs, objects with too little mass to sustain the highcore temperatures necessary for stable thermonuclear fusionof hydrogen, are the least massive, and possibly the mostnumerous products of star formation. Although first predictedto exist in the early 1960s (Kumar 1963; Hayashi & Nakano1963), it was not until decades later that brown dwarfs werediscovered in bulk by wide-area, red (700–1000 nm) and near-infrared (1–2.5 μm) capable surveys such as the Two MicronAll Sky Survey (2MASS; Skrutskie et al. 2006), the SloanDigital Sky Survey (SDSS; York et al. 2000), and the DeepNear-Infrared Southern Sky Survey (DENIS; Epchtein et al.1997). The emergent spectra of brown dwarfs are so distinctfrom that of late-type M dwarfs that the creation of two newspectral classes, L and T (Kirkpatrick et al. 1999; Burgasseret al. 2006), was required in order to properly classify them.12
10 Current address: Department of Physics and Astronomy, The University ofToledo, 2801 West Bancroft Street, Toledo, OH 43606, USA.11 Hellman Fellow.12 A compendium of known L and T dwarfs can be found athttp://DwarfArchives.org.
The latest-type T dwarfs currently known were discovered in theUKIRT Infrared Deep Sky Survey (UKIDSS; Lawrence et al.2007) and the Canada France Brown Dwarf Survey (CFBDS;Delorme et al. 2008b) and have estimated effective temperatures(Teffs) of 500–700 K (e.g., Burningham et al. 2008; Delormeet al. 2008a; Leggett et al. 2009; Lucas et al. 2010; Liu et al.2011).
Despite these spectacular successes, there exists a gap ofnearly 400 K between the coolest spectroscopically confirmedbrown dwarfs at Teff ∼ 500 K (Lucas et al. 2010) and Jupiterat Teff ∼ 124 K (Hanel et al. 1981). Although observations ofstar formation regions and young associations such as the OrionNebula Cluster (Weights et al. 2009), Chameleon I (Luhmanet al. 2005), and TW Hydrae (Chauvin et al. 2004) suggest thatnature can form brown dwarfs that will eventually cool to thesetemperatures once they have dispersed from their natal clusters,they are simply too faint to have been detected by the aforemen-tioned surveys. Recently however, two brown dwarfs with esti-mated effective temperatures of 300–400 K, WD 0806−661B(Luhman et al. 2011) and CFBDSIR J145829 + 101343B(CFBDSIR J1458 + 1013B; Liu et al. 2011), were discoveredin targeted searches for companions to nearby stars. Although
1

The Astrophysical Journal, 743:50 (17pp), 2011 December 10 Cushing et al.
efforts to obtain spectra of these two common proper motionsources have been hampered by extreme faintness in the case ofWD 0806−661 (J > 21.7; Rodriguez et al. 2011), and proxim-ity to its primary star in the case of CFBDSIR J1458 + 1013B(<0.′′11), their mere existence suggests that a population ofnearby cold brown dwarfs awaits discovery.
Foremost is the question of what these objects will looklike spectroscopically and whether a new spectral class beyondT, dubbed “Y” (Kirkpatrick et al. 1999; Kirkpatrick 2000),will be required in order to properly classify them. Chemicalequilibrium calculations and model atmospheres predict thatas brown dwarfs cool below Teff ∼ 600 K, their atmospherespass through a series of chemical transitions which in turnimpact the appearance of their emergent spectra (Lodders 1999;Burrows & Sharp 1999; Lodders & Fegley 2002; Burrows et al.2003). At Teff ∼ 600 K, the combination and overtone bandsof NH3 emerge in the near-infrared.13 At Teff ∼ 500 K, theprominent resonance absorption lines of Na i and K i in thered optical spectra of warmer brown dwarfs weaken as Nacondenses out of the gas phase into Na2S and then K condensesinto KCl. Finally, H2O and NH3 will also condense out atTeff ∼ 350 K and ∼200 K, respectively. Although each transitionhas been suggested as the trigger for the Y spectral class, focushas primarily been on detecting the NH3 bands because theyare predicted to emerge at the hottest effective temperatures.Although NH3 absorption has been tentatively detected inthe near-infrared spectrum of CFBDS J005910.90−011401.3(hereafter CFBDS J0059−0114; Delorme et al. 2008a), thisfeature has not been confirmed in the spectrum of the coolerobject UGPS J072227.51−054031.2 (UGPS 0722−05; Lucaset al. 2010).
Independent of their spectral morphology, the study of theseultracool brown dwarfs will provide important insights into bothultracool atmospheric physics and the low-mass end of the stel-lar mass function. Because brown dwarfs and exoplanets havesimilar atmospheric conditions, ultracool brown dwarfs are ex-cellent exoplanet analogs that can be used as benchmarks formodel atmospheres. The study of these ultracool brown dwarfswill therefore directly inform the interpretation and characteri-zation of exoplanets detected with the next generation of high-contrast imagers like the Gemini Planet Imager (GPI; Macintoshet al. 2006), the Spectro-Polarimetric High-contrast ExoplanetResearch (SPHERE) instrument for the Very Large Telescope(Beuzit et al. 2006), Project 1640 at Palomar Observatory (Hink-ley et al. 2011), and the L- and M-band Infrared Camera (LMIR-cam; Skrutskie et al. 2010) for the Large Binocular TelescopeInterferometer (LBTI). Simulations by Burgasser (2004) andAllen et al. (2005) have also shown that the space density ofcold brown dwarfs is very sensitive to both the underlying massfunction and the low-mass limit of star formation. Identifyingand characterizing a statistically robust sample of cold browndwarfs will therefore provide two critical constraints on theo-ries of low-mass star formation (Whitworth & Stamatellos 2006;Whitworth et al. 2007).
One of the primary science goals of the Wide-field InfraredSurvey Explorer (WISE; Wright et al. 2010), a NASA missionthat recently surveyed the entire sky at 3.4 (W1), 4.6 (W2), 12(W3), and 22 (W4) μm, is to identify such cold brown dwarfs.The W1 and W2 bands were designed specifically to sample the
13 Although the fundamental band of NH3 has been detected in the spectra ofwarmer T dwarfs at 10.5 μm (e.g., Roellig et al. 2004; Cushing et al. 2006),the intrinsically weaker near-infrared bands require a higher NH3 abundance,and thus lower effective temperature, to become a dominant opacity source.
deep CH4 absorption band centered at 3.3 μm and the regionrelatively free of opacity centered at ∼4.7 μm in the spectraof cold brown dwarfs (see Figure 2 of Mainzer et al. 2011).Since the peak of the Planck function at these low effectivetemperatures is in the mid-infrared, a large amount of fluxemerges from the 4.7 μm opacity hole, making the W1–W2colors extremely red (W1−W2 > 2; Mainzer et al. 2011;Kirkpatrick et al. 2011). Indeed such red colors are almostunique amongst astronomical sources making the identificationof cool brown dwarfs with the W1−W2 color alone relativelyeasy (see Figure 12 of Wright et al. 2010).
We have been conducting a search for cold brown dwarfs sincethe start of the WISE survey in mid 2010 January. This search hasalready born fruit with the discovery of six late-type T dwarfs(Mainzer et al. 2011; Burgasser et al. 2011) two of which havespectral types later than T8. Kirkpatrick et al. (2011) presentover 100 new brown dwarfs, the vast majority of which havespectral types later than T6. In this paper, we focus on seven ofthe ∼100 brown dwarfs whose near-infrared spectra indicate thatthe they are the latest-type spectroscopically confirmed browndwarfs currently known. Indeed, we identify six of these browndwarfs as the first members of the Y spectral class. In Section 2,we briefly discuss our selection criteria before presenting theground- and spaced-based imaging and spectroscopic follow-up observations in Section 3. In Section 4, we present theproperties of the first Y dwarfs, define the transition betweenthe T sequence and the Y dwarfs, and derive estimates of theatmospheric parameters of the new brown dwarfs using modelatmospheres.
2. CANDIDATE SELECTION
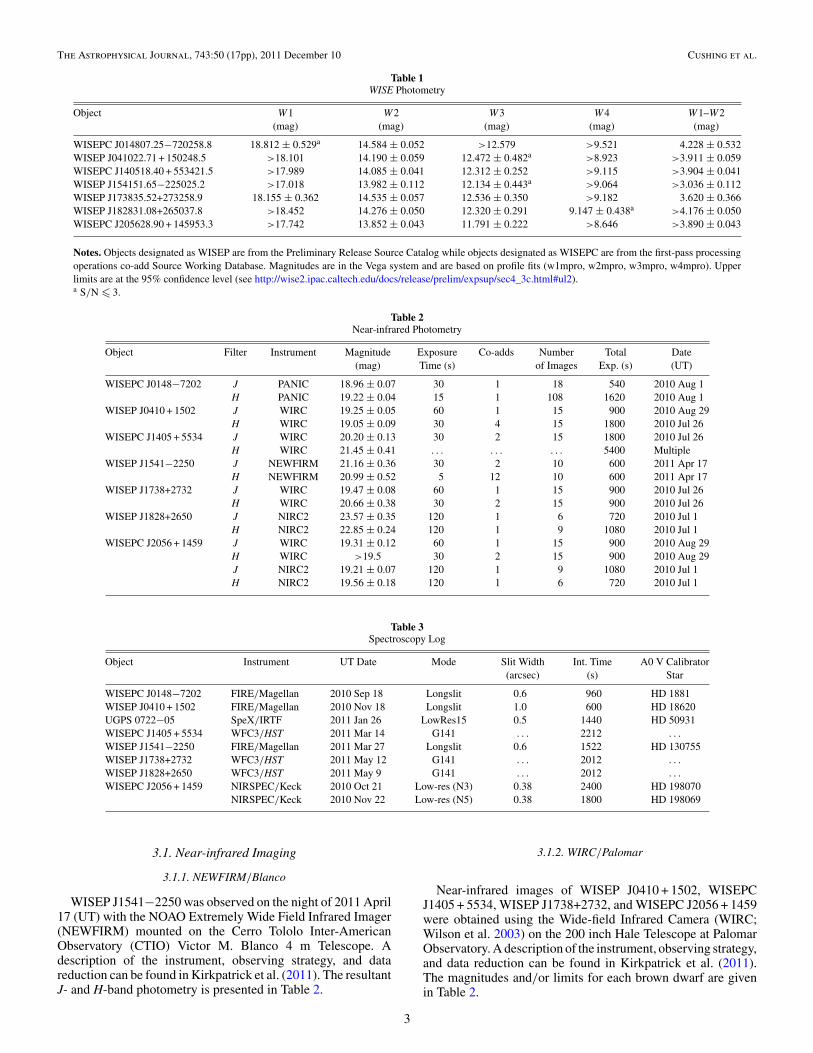
The seven new brown dwarfs were identified as part of alarger ongoing search for cold brown dwarfs using WISE. Adetailed description of this survey and our search criteria ispresented by Kirkpatrick et al. (2011). Briefly, candidates wereselected from the Source Working database derived from thefirst-pass processing operational co-adds using color constraintsderived from known T dwarfs and model atmospheres (in thecase of brown dwarfs with Teff < 500 K). Table 1 lists theWISE designations and photometry of the seven brown dwarfs,and Figure 1 shows 2′ × 2′ DSS I, 2MASS J and H, WISEW1, W2, and W3, and W1W2W3 color composite images foreach dwarf. Hereafter, we abbreviate the numerical portions ofthe WISE designations as hhmm±ddmm, where the suffix is thesexagesimal right ascension (hours and minutes) and declination(degrees and arcminutes) at J2000.0 equinox.
3. OBSERVATIONS
The follow-up ground- and space-based observations of theseven WISE brown dwarfs are discussed in the followingsections. Although we present the near-infrared photometryof the brown dwarfs in this work for completeness, we deferthe discussion of these data to Kirkpatrick et al. (2011) whopresent a more detailed discussion that places them in contextwith the larger population of brown dwarfs. In addition to theobservations of the seven WISE brown dwarfs, we also obtaineda near-infrared spectrum of UGPS 0722−05 for comparisonpurposes. A log of the near-infrared photometric observationsas well as the resulting photometry is given in Table 2, and a logof the spectroscopic observations is given in Table 3.
2
The Astrophysical Journal, 743:50 (17pp), 2011 December 10 Cushing et al.
Table 1WISE Photometry
Object W1 W2 W3 W4 W1–W2(mag) (mag) (mag) (mag) (mag)
WISEPC J014807.25−720258.8 18.812 ± 0.529a 14.584 ± 0.052 >12.579 >9.521 4.228 ± 0.532WISEP J041022.71 + 150248.5 >18.101 14.190 ± 0.059 12.472 ± 0.482a >8.923 >3.911 ± 0.059WISEPC J140518.40 + 553421.5 >17.989 14.085 ± 0.041 12.312 ± 0.252 >9.115 >3.904 ± 0.041WISEP J154151.65−225025.2 >17.018 13.982 ± 0.112 12.134 ± 0.443a >9.064 >3.036 ± 0.112WISEP J173835.52+273258.9 18.155 ± 0.362 14.535 ± 0.057 12.536 ± 0.350 >9.182 3.620 ± 0.366WISEP J182831.08+265037.8 >18.452 14.276 ± 0.050 12.320 ± 0.291 9.147 ± 0.438a >4.176 ± 0.050WISEPC J205628.90 + 145953.3 >17.742 13.852 ± 0.043 11.791 ± 0.222 >8.646 >3.890 ± 0.043
Notes. Objects designated as WISEP are from the Preliminary Release Source Catalog while objects designated as WISEPC are from the first-pass processingoperations co-add Source Working Database. Magnitudes are in the Vega system and are based on profile fits (w1mpro, w2mpro, w3mpro, w4mpro). Upperlimits are at the 95% confidence level (see http://wise2.ipac.caltech.edu/docs/release/prelim/expsup/sec4_3c.html#ul2).a S/N � 3.
Table 2Near-infrared Photometry
Object Filter Instrument Magnitude Exposure Co-adds Number Total Date(mag) Time (s) of Images Exp. (s) (UT)
WISEPC J0148−7202 J PANIC 18.96 ± 0.07 30 1 18 540 2010 Aug 1H PANIC 19.22 ± 0.04 15 1 108 1620 2010 Aug 1
WISEP J0410 + 1502 J WIRC 19.25 ± 0.05 60 1 15 900 2010 Aug 29H WIRC 19.05 ± 0.09 30 4 15 1800 2010 Jul 26
WISEPC J1405 + 5534 J WIRC 20.20 ± 0.13 30 2 15 1800 2010 Jul 26H WIRC 21.45 ± 0.41 . . . . . . . . . 5400 Multiple
WISEP J1541−2250 J NEWFIRM 21.16 ± 0.36 30 2 10 600 2011 Apr 17H NEWFIRM 20.99 ± 0.52 5 12 10 600 2011 Apr 17
WISEP J1738+2732 J WIRC 19.47 ± 0.08 60 1 15 900 2010 Jul 26H WIRC 20.66 ± 0.38 30 2 15 900 2010 Jul 26
WISEP J1828+2650 J NIRC2 23.57 ± 0.35 120 1 6 720 2010 Jul 1H NIRC2 22.85 ± 0.24 120 1 9 1080 2010 Jul 1
WISEPC J2056 + 1459 J WIRC 19.31 ± 0.12 60 1 15 900 2010 Aug 29H WIRC >19.5 30 2 15 900 2010 Aug 29J NIRC2 19.21 ± 0.07 120 1 9 1080 2010 Jul 1H NIRC2 19.56 ± 0.18 120 1 6 720 2010 Jul 1
Table 3Spectroscopy Log
Object Instrument UT Date Mode Slit Width Int. Time A0 V Calibrator(arcsec) (s) Star
WISEPC J0148−7202 FIRE/Magellan 2010 Sep 18 Longslit 0.6 960 HD 1881WISEP J0410 + 1502 FIRE/Magellan 2010 Nov 18 Longslit 1.0 600 HD 18620UGPS 0722−05 SpeX/IRTF 2011 Jan 26 LowRes15 0.5 1440 HD 50931WISEPC J1405 + 5534 WFC3/HST 2011 Mar 14 G141 . . . 2212 . . .
WISEP J1541−2250 FIRE/Magellan 2011 Mar 27 Longslit 0.6 1522 HD 130755WISEP J1738+2732 WFC3/HST 2011 May 12 G141 . . . 2012 . . .
WISEP J1828+2650 WFC3/HST 2011 May 9 G141 . . . 2012 . . .
WISEPC J2056 + 1459 NIRSPEC/Keck 2010 Oct 21 Low-res (N3) 0.38 2400 HD 198070NIRSPEC/Keck 2010 Nov 22 Low-res (N5) 0.38 1800 HD 198069
3.1. Near-infrared Imaging
3.1.1. NEWFIRM/Blanco
WISEP J1541−2250 was observed on the night of 2011 April17 (UT) with the NOAO Extremely Wide Field Infrared Imager(NEWFIRM) mounted on the Cerro Tololo Inter-AmericanObservatory (CTIO) Victor M. Blanco 4 m Telescope. Adescription of the instrument, observing strategy, and datareduction can be found in Kirkpatrick et al. (2011). The resultantJ- and H-band photometry is presented in Table 2.
3.1.2. WIRC/Palomar
Near-infrared images of WISEP J0410 + 1502, WISEPCJ1405 + 5534, WISEP J1738+2732, and WISEPC J2056 + 1459were obtained using the Wide-field Infrared Camera (WIRC;Wilson et al. 2003) on the 200 inch Hale Telescope at PalomarObservatory. A description of the instrument, observing strategy,and data reduction can be found in Kirkpatrick et al. (2011).The magnitudes and/or limits for each brown dwarf are givenin Table 2.
3
Th
eA
strophysical
Journ
al,743:50(17pp),2011
Decem
ber10
Cu
shin
get
al.
WISE 0148−7205
DSS I
2MASS J
2MASS H
WISE W1
WISE W2
WISE W3
W1W2W3
WISE 0410+1502
WISE 1405+5534
WISE 1541−2250
WISE 1738+2732
+1 0 −1RA (arcmin)
−1
0
+1
Dec
(ar
cmin
)
Figure 1. 2 × 2 arcmin DSS I, 2MASS J and H, WISE W1, W2, and W3, and a W1W2W3 false color composite of the five new WISE brown dwarfs. In the color composite images on the far right, the W1, W2, and W3bands are color coded blue, green, and red, respectively.
(A color version of this figure is available in the online journal.)
4

Th
eA
strophysical
Journ
al,743:50(17pp),2011
Decem
ber10
Cu
shin
get
al.
WISE 1828+2650
DSS I
2MASS J
2MASS H
WISE W1
WISE W2
WISE W3
W1W2W3
WISE 2056+1459
+1 0 −1
RA (arcmin)
−1
0
+1
Dec
(ar
cmin
)
Figure 1. (Continued)
(A color version of this figure is available in the online journal.)
5

The Astrophysical Journal, 743:50 (17pp), 2011 December 10 Cushing et al.
3.1.3. PANIC/Magellan
WISEPC J0148−7202 was observed on the night of 2010August 1 (UT) with the now decommissioned Persson’s Auxil-iary Nasmyth Infrared Camera (PANIC; Martini et al. 2004) onthe east Nasmyth platform at the Magellan 6.5 m Baade Tele-scope. A description of the instrument, observing strategy, anddata reduction can be found in Kirkpatrick et al. (2011). The J-and H-band magnitudes of WISEPC J0148−7202 are given inTable 2.
3.1.4. NIRC2/Keck II
High-resolution observations of WISEP J1828+2650 andWISEPC J2056 + 1459 were obtained with NIRC2 behind theKeck II LGS-AO system (Wizinowich et al. 2006; van Dam et al.2006) on the night of 2010 July 1 (UT). A description of theinstrument, observing strategy, and data reduction can be foundin Kirkpatrick et al. (2011). The J- and H-band magnitudes aregiven in Table 2.
3.2. Near-infrared Spectroscopy
3.2.1. SpeX/IRTF
A 0.9–2.5 μm, low-resolution (R ≡ λ/Δλ ≈ 150) spectrumof UGPS 0722−05 was obtained with SpeX (Rayner et al. 2003)on the 3 m NASA Infrared Telescope Facility (IRTF) on 2011January 26 (UT). A description of the instrument, observingstrategy, and data reduction can be found in Kirkpatrick et al.(2011). The spectrum, which is shown in Figure 2, has a highsignal-to-noise ratio (S/N), reaching >50 at the peaks of the Y,J, and H bands.
3.2.2. FIRE/Magellan
Low-resolution (R = 250–350), 1–2.4 μm spectra ofWISEPC J0148−7202, WISEP J0410 + 1502, and WISEPJ1541−2250 were obtained with the Folded-port InfraRedEchellette (FIRE; Simcoe et al. 2008, 2010) mounted at theauxiliary Nasmyth focus of the Magellan 6.5 m Baade Tele-scope. A description of the instrument, observing strategy, anddata reduction can be found in Kirkpatrick et al. (2011). Thespectra are shown in Figure 2.
3.2.3. NIRSPEC/Keck II
WISEPC J2056 + 1459 was observed using the Near-InfraredSpectrometer (NIRSPEC; McLean et al. 1998, 2000) located onone of the Nasmyth platforms of the 10 m Keck II telescope onMauna Kea, Hawaii. The 0.′′38-wide slit in the low-resolutionmode provides a resolving power of R = 2500. WISEPCJ2056 + 1459 was observed with the N3 order sorting filter(1.143–1.375 μm) on the night of 2010 October 21 (UT) andwith the N5 order sorting filter (1.431–1.808 μm) on the nightof 2010 November 22 (UT).
A series of 300 s exposures was obtained at two differentpositions along the 42′′ long slit. An A0 V star was observedafter each series of science exposures for telluric correction andflux calibration purposes. Calibration frames consisting of neonand argon arc lamps, dark frames, and flat-field lamps were alsotaken following the science exposures. The data were reduced ina standard fashion using the IDL-based REDSPEC14 reductionpackage as described in McLean et al. (2003). Since REDSPECdoes not produce uncertainty arrays, we generated them as
14 See http://www2.keck.hawaii.edu/inst/nirspec/redspec.
follows. First, we performed a simple sum extraction using therectified, pair-subtracted images generated by REDSPEC. Wethen scaled the spectra to a common flux level and computedthe average spectrum. The uncertainty at each wavelength isgiven by the standard error on the mean. The average spectrumis then corrected for telluric absorption and flux calibratedusing the calibration spectrum generated by REDSPEC. Sincethe difference between the spectra produced by REDSPECand our spectra was negligible, we used our spectrum for ouranalysis. Finally, the N3- and N5-band spectra were absolutelyflux calibrated using the WIRC photometry (see Table 2) asdescribed in Cushing et al. (2005) and merged to produce a1.15–1.80 μm spectrum. The final spectrum, which is shownin Figure 2, has a peak S/N of 8 and 6 in the J and H bands,respectively.
3.2.4. WFC3/Hubble Space Telescope
WISEPC J1405 + 5534, WISEP J1738+2732, and WISEPJ1828+2650 were observed with the infrared channel of theWide Field Camera 3 (WFC3; Kimble et al. 2008) on-board theHubble Space Telescope (HST) as a part of a Cycle 18 program(GO-12330, PI: J. D. Kirkpatrick). The WFC3 uses a 1024 ×1024 HgCdTe detector with a plate scale of 0.′′13 pixel−1 whichresults in a field of view of 123×126 arcsec. The G141 grismwas used to perform slitless spectroscopy of each brown dwarfcovering the 1.07–1.70 μm wavelength range at a resolvingpower of R ≈ 130. For each brown dwarf, we first obtained fourdirect images through the F140W filter (λp = 1392.3 nm) in theMULTIACCUM mode with the SPARS25 sampling sequence.Between each exposure, the telescope was offset slightly. Wethen obtained four images with the G141 grism at the samepositions as the direct images. The spectroscopic observationswere also obtained in the MUTLIACCUM mode but using theSPARS50 sequence.
The raw images were first processed using the CALWFC3pipeline (ver. 2.3) which not only subtracts the bias level anddark current but also flat fields the direct images (the grismimages are flat fielded during the extraction process describedbelow). The spectra were then extracted using the aXe soft-ware (Kummel et al. 2009), which is a suite of PyRAF/IRAFpackages designed to extract spectra from the slitless modesof both WFC3 and the Advanced Camera for Surveys (ACS).aXe requires knowledge of both the position and brightnessof the objects in the field of view. We therefore combined thefour direct images using MULTIDRIZZLE (Koekemoer et al.2002) and the latest Instrument Distortion Coefficient Table(IDCTAB). A catalog of the objects in the field was then con-structed using SExtractor (Bertin & Arnouts 1996). For eachobject in the source catalog, two-dimensional (2D) subimagescentered on the first-order spectra of each object were thencombined using the task AXEDRIZZLE to produce a highS/N 2D spectral image. One-dimensional, flux-calibrated spec-tra and their associated uncertainties are then extracted from the2D drizzle subimages.
Since the G141 grism mode is slitless, spectral contamina-tion from nearby sources is not uncommon. The aXe software(using the Gaussian emission model) estimates the level ofcontamination for each object using the positions and mag-nitudes of all the objects in the field of view. The spectrum ofone of the brown dwarfs, WISEP J1828+2650, exhibits mod-erate contamination that increases in intensity toward shorterwavelengths (see Figure 3). The aXe software does not ac-tually correct for this contamination so we attempted to do
6
The Astrophysical Journal, 743:50 (17pp), 2011 December 10 Cushing et al.
1.0 1.5 2.0
Wavelength (μm)
0
2
4
6
8
Nor
mal
ized
f λ +
Con
stan
t
UGPS 0722−05
WISEPC J0148−7202
WISEPC J2056+1459
WISEP J0410+1502
WISEP J1541−2250
WISEP J1738+2732
WISEPC J1405+5534
WISEP J1828+2650
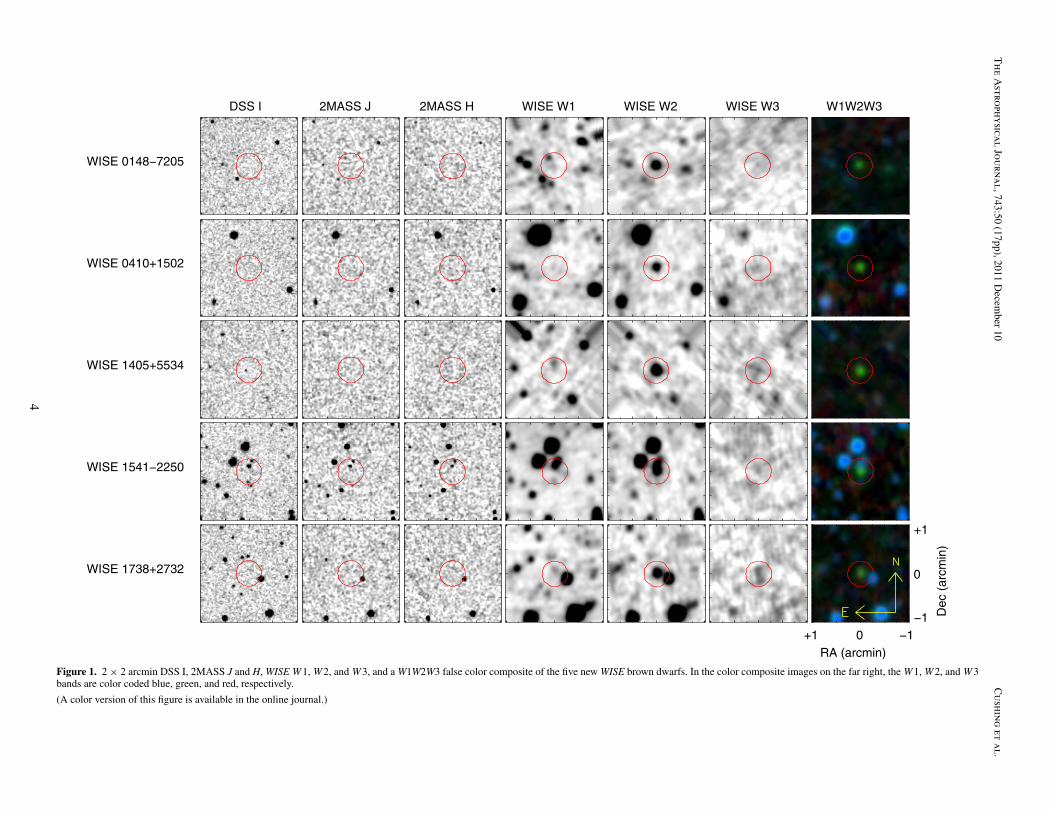
Figure 2. Near-infrared spectra of the new WISE brown dwarfs (black) as compared to the spectrum of UGPS 0722−05 (red). The data have been normalized to unityat the peak of the J band (except for WISEP J1828+2650 which is normalized to unity at the peak of the H band) and offset by constants (dotted lines).
(A color version of this figure is available in the online journal.)
7
The Astrophysical Journal, 743:50 (17pp), 2011 December 10 Cushing et al.
550 600 650 700
X (pixels)
550560570580590
Y (
pixe
ls)
HJ WISE 1828
Contaminating Starlight
1.2 1.3 1.4 1.5 1.6 1.7
Wavelength (μm)
0.0
0.2
0.4
0.6
f λ (
10−
17 W
m−
2 μm
−1 )
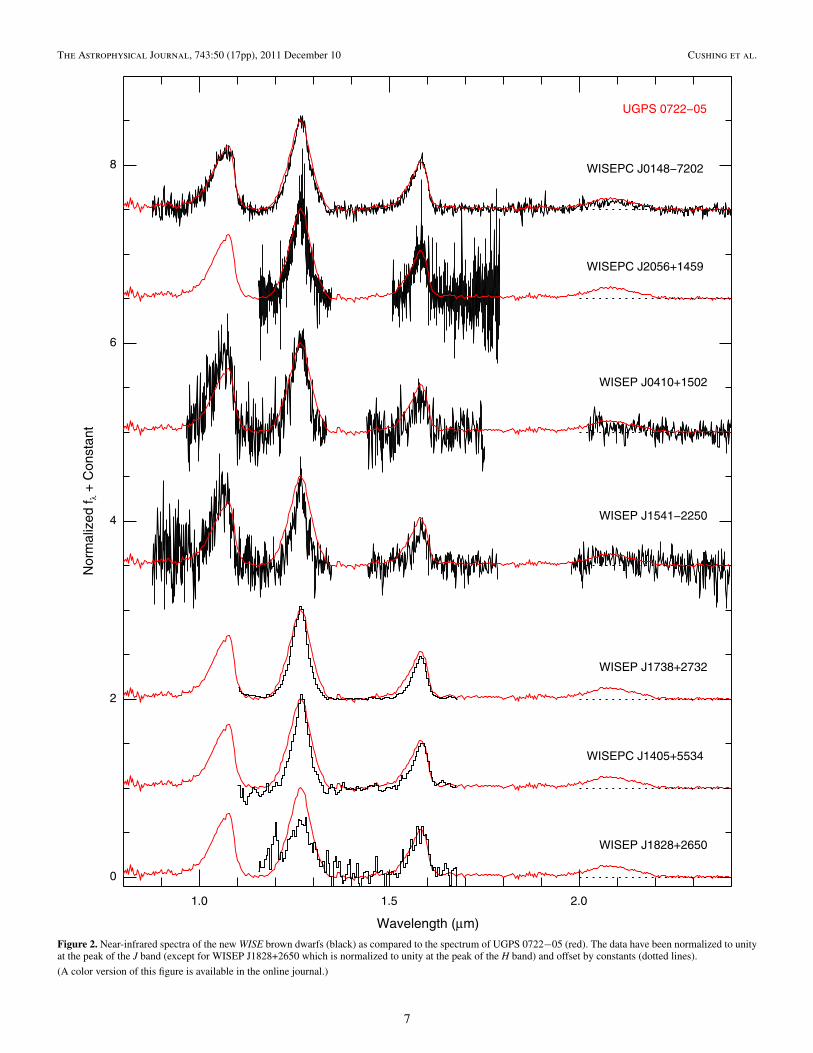
Figure 3. Top: subimage of the drizzled WFC3/HST grism image centered onthe position of WISEP J1828+2650. The location of the spectrum of WISEPJ1828+2650 is indicated in red along with the positions of the J- and H-bandpeaks. The location of the contaminating starlight is shown in purple and consistsof second- and third-order light from two other stars in the WFC3 field ofview. Bottom: the spectrum of WISEP J1828+2650 (red) and the contaminationspectrum (purple). The stellar contamination becomes progressively worse atshorter wavelengths.
(A color version of this figure is available in the online journal.)
so using the contamination image generated by aXe. Unfor-tunately, the contamination-corrected spectrum exhibits neg-ative flux values which suggests that aXe is overestimatingthe contamination level. We will therefore use the contam-inated spectrum and consider it an upper limit to the ac-tual spectrum. This issue will be discussed in more detail inSection 4.1.1.
4. ANALYSIS
4.1. Spectral Characterization
Figure 2 shows the near-infrared spectra of the newbrown dwarfs. Also plotted for comparison purposes is ourIRTF/SpeX spectrum of UGPS 0722−05, the latest-type browndwarf known previous to this work. All of the spectra exhibitdeep H2O and CH4 absorption bands characteristic of late-typeT dwarfs but the J-band peaks of the WISE brown dwarfs arenarrower than the corresponding peak in the spectrum of UGPS0722−05. This peak becomes progressively narrower beyondT8 (Warren et al. 2007; Delorme et al. 2008a; Burningham et al.2008; Lucas et al. 2010), indicating that all of the WISE browndwarfs have spectral types later than UGPS 0722−05. The spec-trum of WISEP J1828+2650 is markedly different than that ofUGPS 0722−05 so we discuss this object in more detail in thefollowing section before discussing the other six dwarfs.
4.1.1. WISEP J1828+2650: The Archetypal Y Dwarf
The lower panel of Figure 4 shows the 1.15–1.70 μm spec-trum of WISEP J1828+2650 along with the spectrum of UGPS0722−05. The spectrum of WISEP J1828+2650, while domi-nated by the same CH4 and H2O absorption bands present inT dwarf spectra, has a feature not seen in any T dwarf: theJ- and H-band peaks, when plotted in units of fλ, are essentially
UGPS 0722−05WISEP J1738+2732CH4 CH4
H2O
NH3?
CH4
0
1
2
3
Nor
mal
ized
f λ
UGPS 0722−05WISEPC J1405+5534CH4 CH4
H2O
NH3?
CH4
0
1
2
3
Nor
mal
ized
f λ
UGPS 0722−05WISEP J1828+2650CH4 CH4
H2O
NH3?
CH4
1.2 1.3 1.4 1.5 1.6 1.7
Wavelength (μm)
0
1
2
3
Nor
mal
ized
f λ
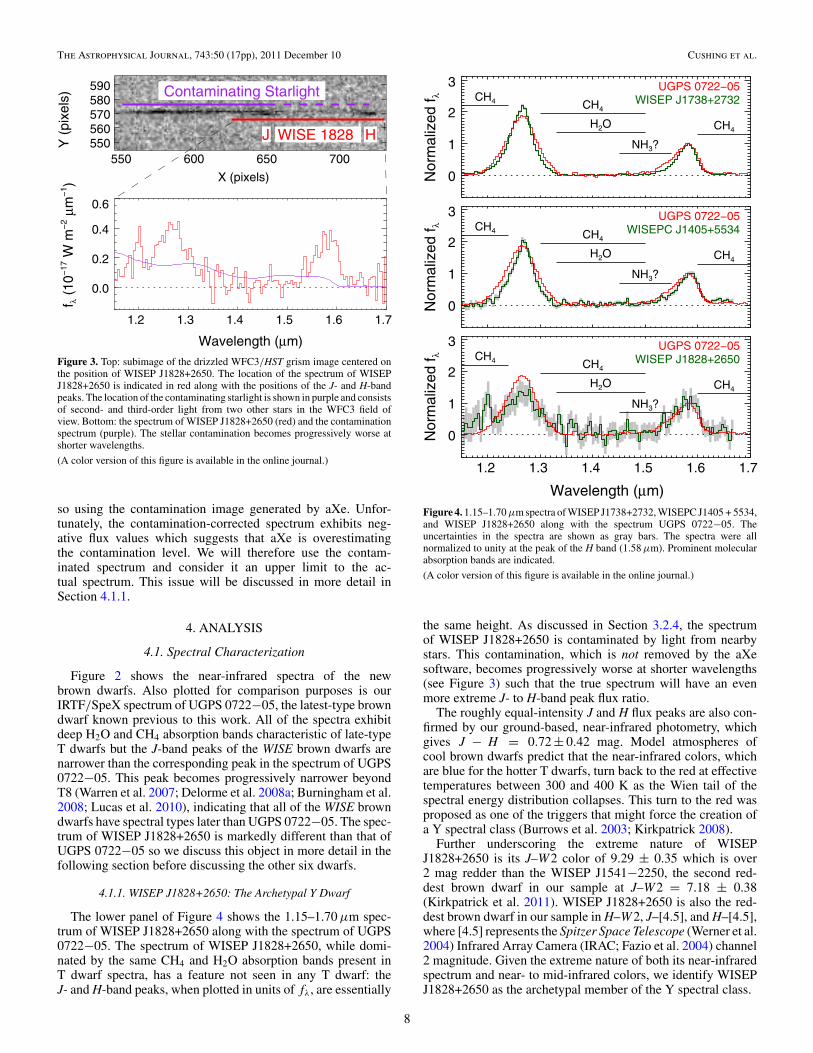
Figure 4. 1.15–1.70 μm spectra of WISEP J1738+2732, WISEPC J1405 + 5534,and WISEP J1828+2650 along with the spectrum UGPS 0722−05. Theuncertainties in the spectra are shown as gray bars. The spectra were allnormalized to unity at the peak of the H band (1.58 μm). Prominent molecularabsorption bands are indicated.
(A color version of this figure is available in the online journal.)
the same height. As discussed in Section 3.2.4, the spectrumof WISEP J1828+2650 is contaminated by light from nearbystars. This contamination, which is not removed by the aXesoftware, becomes progressively worse at shorter wavelengths(see Figure 3) such that the true spectrum will have an evenmore extreme J- to H-band peak flux ratio.
The roughly equal-intensity J and H flux peaks are also con-firmed by our ground-based, near-infrared photometry, whichgives J − H = 0.72 ± 0.42 mag. Model atmospheres ofcool brown dwarfs predict that the near-infrared colors, whichare blue for the hotter T dwarfs, turn back to the red at effectivetemperatures between 300 and 400 K as the Wien tail of thespectral energy distribution collapses. This turn to the red wasproposed as one of the triggers that might force the creation ofa Y spectral class (Burrows et al. 2003; Kirkpatrick 2008).
Further underscoring the extreme nature of WISEPJ1828+2650 is its J–W2 color of 9.29 ± 0.35 which is over2 mag redder than the WISEP J1541−2250, the second red-dest brown dwarf in our sample at J–W2 = 7.18 ± 0.38(Kirkpatrick et al. 2011). WISEP J1828+2650 is also the red-dest brown dwarf in our sample in H–W2, J–[4.5], and H–[4.5],where [4.5] represents the Spitzer Space Telescope (Werner et al.2004) Infrared Array Camera (IRAC; Fazio et al. 2004) channel2 magnitude. Given the extreme nature of both its near-infraredspectrum and near- to mid-infrared colors, we identify WISEPJ1828+2650 as the archetypal member of the Y spectral class.
8

The Astrophysical Journal, 743:50 (17pp), 2011 December 10 Cushing et al.
0.00.20.40.60.81.0
Nor
mal
ized
f λ2MASS 2254 (T4)SDSS 1624 (T6)2MASS 0415 (T8)UGPS 0722 (T9)WISEP J1738
1.4 1.5 1.6 1.7
Wavelength (μm)
10−25
10−24
10−23
10−22
10−2110−20
κ (c
m2 /m
olec
ule)
NH3
H2O
CH4
Figure 5. Top: H-band spectrum of 2MASS J22541892 + 3123498, SDSSJ162414.37 + 002915.6, and 2MASS J04151954−0935066, the T4, T6, andT8 spectral standards (Burgasser et al. 2006), along with the spectrum ofUGPS 0722−05, and WISEP J1738+2732. The spectra have been normalizedto unity at their peak flux values. Bottom: opacity data computed in chemicalequilibrium for NH3 (Yurchenko et al. 2011), H2O (Freedman et al. 2008), andCH4 (Freedman et al. 2008) at T = 600 K and P = 1 bar. Note that the changein the spectral morphology of the blue wing of the H-band peak is similarbetween T6/T8 and T8/T9 suggesting a common absorber or set of absorbers.In contrast, the spectrum of WISEP J1738+2732 exhibits excess absorption thatmatches the position of the NH3 absorption shown in the lower panel.
(A color version of this figure is available in the online journal.)
4.1.2. WISEP J1738+2732 and WISEPC J1405 + 5534and the 1.5 μm NH3 Band
The 1.15–1.70 μm spectra of WISEPC J1405 + 5534 andWISEP J1738+2732 are very similar and yet both are distinctfrom UGPS 0722−05, albeit in less extreme ways than thespectrum of WISEP J1828+2650 (see middle and upper panelsof Figure 4). Although the relative heights of the J- andH-band peaks are similar to those of UGPS 0722−05, theirwidths are narrower. The narrowing of the H-band peaks isasymmetric, however, as most of the change is a result ofenhanced absorption on the blue wings from 1.51 to 1.58 μm.What is the underlying cause of this absorption?
The H-band spectra of T dwarfs are shaped by CH4 (andto a lesser extent H2O) longward of 1.6 μm and by H2O atwavelengths shortward of 1.6 μm. As the effective temperaturefalls, the opacity of the near-infrared overtone and combinationbands of NH3 becomes important since NH3/N2 > 1 for T �700 K at P = 1 bar (Lodders & Fegley 2002). The emergenceof these NH3 bands has long been suggested as the trigger fora new spectral class (Burrows et al. 2003; Kirkpatrick 2008;Leggett et al. 2007a) but identifying them has proven difficultbecause they overlap with the strong H2O bands and because theabundance of NH3 can be reduced by an order of magnitude dueto vertical mixing in the atmospheres of brown dwarfs (Saumonet al. 2003, 2006; Hubeny & Burrows 2007).
Figure 5 shows the H-band spectra of the T4, T6, and T8spectral standards, UGPS 0722−05, and WISEP J1738+2732as well as the opacities for H2O (Freedman et al. 2008), NH3(Yurchenko et al. 2011), and CH4 (Freedman et al. 2008) atT = 600 K and P = 1 bar generated by one of us (R.S.F.).With increasing spectral type, the blue wing of the H-band
peak becomes progressively suppressed. Delorme et al. (2008a)tentatively identified NH3 absorption on the blue wing of theH-band spectrum of CFBDS J0059−0114, a T dwarf witha spectral type earlier than UGPS 0722−05. However, thechange in the shape of the blue wing of the H-band peakfrom T6 to UGPS 0722−05 appears smooth, suggesting acommon absorber or set of absorbers. It seems unlikely that NH3dominates given that it has not been identified in the spectra ofmid-type T dwarf (Teff ∼ 1200 K). A similar conclusion to oursis reached by Burningham et al. (2010) using spectral indices.
In contrast, the H-band spectrum of WISEP J1738+2732stands out in the sequence in that it exhibits additional absorptionfrom 1.53 to 1.58 μm. This absorption broadly matches theposition of the ν1 + ν3 absorption band of NH3 centered at1.49 μm suggesting that NH3 is the cause of this absorption.However, we cannot conclusively identify NH3 as the carriergiven the low spectral resolution of the data and the fact that theabsorption lies on the steep wing of the H2O band. For example,water ice also has an absorption band centered at ∼1.5 μm(Warren & Brandt 2008) that could potentially produce suchabsorption if the abundance of water ice is high enough. Onepotential avenue for confirming that NH3 is indeed the carrierwould be to acquire higher spectral resolution data to search forindividual NH3 features (e.g., Saumon et al. 2000; Warren et al.2007).
4.1.3. The T Dwarf/Y Dwarf Transition
With WISEP J1828+2650 classified as the prototypical Ydwarf, we can now investigate the transition between the Tand Y spectral classes. T dwarfs are classified at near-infraredwavelengths using the Burgasser et al. (2006) scheme, whereinnine T dwarf spectral standards with subtypes ranging from T0to T8 are used for direct spectral comparisons. Burgasser et al.also defined five spectral indices that measure the depths of theCH4 and H2O bands which can be used as a proxy for directcomparisons. With the discovery of brown dwarfs with spectraltypes later than T8, the question of how to extend the Burgasseret al. scheme beyond T8 naturally arises.
The first >T8 dwarf to be identified was ULASJ003402.77−005206.7 (ULAS J0034−0052; Warren et al.2007). Based on a direct comparison to the spectrum of theT8 spectral standard and the values of the Burgasser et al. spec-tral indices, Warren et al. adopted a spectral type of T8.5. Asecond >T8 dwarf soon followed with the discovery of CF-BDS J0059−0114 by Delorme et al. (2008a). They used theWJ index which measures the half-width of the J-band peak(Warren et al. 2007) and the NH3–H index which measuresthe half-width of the H-band peak (i.e., the depth of the puta-tive NH3 absorption), to classify both CFBDS J0059−0114 andULAS J0034−0052 as T9 dwarfs. Burningham et al. (2008)added two T dwarfs to the tally of >T8 dwarfs with the dis-covery of ULAS J133553.45 + 113005.2 (ULAS J1335 + 1130)and ULAS J123828.51 + 095351.3 (ULAS J1238 + 0953). Us-ing both direct spectral comparison and spectral indices, theyclassified them as T8.5 and T9, respectively. Burningham et al.also proposed extending the Burgasser et al. scheme to T9 byassigning ULAS J1335 + 1130 as the T9 spectral standard. Ad-ditional T dwarfs with spectral types later than T8 have sincebeen discovered (see Table 4), but to date, the latest-type T dwarfcurrently known is UGPS 0722−05 (Lucas et al. 2010) whichhas been classified as T10 via a combination of spectral indicesand direct comparisons to the T9 dwarfs.
9

The Astrophysical Journal, 743:50 (17pp), 2011 December 10 Cushing et al.
H2O
CH4
CH4
CH4
NH3?
T6,T7,T8
UGPS 0722−05 (T9)
WISEP J1738 (Y0)
1.2 1.3 1.4 1.5 1.6 1.7
Wavelength (μm)
0.0
0.2
0.4
0.6
0.8
1.0
Nor
mal
ized
f λ
1.15 1.20 1.25 1.30 1.35 1.40
Wavelength (μm)
0.0
0.2
0.4
0.6
0.8
1.0
Nor
mal
ized
f λ
1.50 1.55 1.60 1.65 1.70
Wavelength (μm)
0.0
0.2
0.4
0.6
0.8
1.0
Figure 6. IRTF/SpeX spectra of the Burgasser et al. (2006) spectral standards, SDSS J162414.37 + 002915.6 (T6), 2MASS J07271824 + 1710012 (T7), and 2MASSJ04151954−0935066 (T8), our IRTF/SpeX spectrum of UGPS 0722−05 and the WFC3/HST spectrum of WISEP J1738+2732. The spectra have been normalizedto unity at their peak flux level in each panel. Prominent molecular absorption bands are indicated in the top panel.
(A color version of this figure is available in the online journal.)
Figure 6 shows the 1.15–1.70 μm spectra of the T6, T7, T8spectral standards, UGPS 0722−05, and WISEP J1738+2732.The spectra show smooth changes in their spectral morphologywith increasing spectral type including progressively deeperabsorption bands centered at 1.15, 1.45, and 1.65 μm andprogressively narrower J- and H-band peaks. However, UGPS0722−05 does not appear to be two subtypes later than T8as required by its T10 spectral type. Rather, the changes inspectral morphology from T6 to UGPS 0722−05 suggest thatUGPS 0722−05 is more naturally classified as a T9. Given itsbrightness (J = 16.5, 1.5 mag brighter than ULAS J1335 + 1130)and position near the celestial equator, UGPS 0722−05 alsomakes an ideal spectral standard. We therefore define it to bethe T9 spectral standard.
WISEP J1738+2732 is clearly of later type than UGPS0722−05 but should it be classified as a T dwarf or a Ydwarf? As noted in the previous section, WISEP J1738+2732exhibits excess absorption from 1.53 to 1.58 μm that we havetentatively ascribed to NH3. This absorption becomes even moreapparent when the spectrum is placed in sequence with theT6 to T9 spectral standards (lower right panel of Figure 6).Given the smooth change in width of the J-band peak and therapid fall in the flux of the blue wing of the H band betweenUGPS 0722−05 and WISEP J1738+2732 (which suggests theemergence of a new absorption band), we classify WISEPJ1738+2732 as a Y dwarf and assign it a spectral type of
Y0. Additionally, we tentatively identify it as Y0 spectralstandard.
4.1.4. Classification of the Other WISE Discoveries
With the T9 and Y0 spectral standards defined, we canreturn to the question of classifying the other new WISEdiscoveries. The J- and H-band peaks of WISEPC J0148−7202are slightly narrower than UGPS 0722−05 and slightly widerthan WISEP J1738+2732 so we classify this dwarf as T9.5. Thespectrum of WISEPC J1405 + 5534 is very similar to that ofWISEP J1738+2732 (see Figure 4). However, we note that thewavelength at which the peak H-band flux is reached is shifted∼60 Å to the red relative to UGPS 0722−05 (see Figure 4)and the other late-type T dwarfs which suggests that WISEPCJ1405 + 5534 may be peculiar. We therefore classify it as Y0(pec?). Interestingly, a similar, albeit larger, shift of 200 Å isseen in the spectrum of Jupiter.
The spectra of the remaining brown dwarfs, WISEPCJ2056 + 1459, WISEP J0410 + 1502, and WISEP J1541−2250,do not have sufficient S/N to convincingly show the excess ab-sorption from 1.53 to 1.58 μm. However, the J-band peaks ofthese three brown dwarfs are all narrower than UGPS 0722−05.Indeed, the spectra of all of them are a better match to the spec-tral morphology of WISEP J1738+2732 than UGPS 0722−05so we classify these brown dwarfs as Y0 as well. In addition,the peak Y-band fluxes of WISEP J0410 + 1502 and WISEP
10

The Astrophysical Journal, 743:50 (17pp), 2011 December 10 Cushing et al.
1.1 1.2 1.3 1.4 1.5 1.6 1.7
Wavelength (μm)
0.0
0.5
1.0
1.5
Nor
mal
ized
f λ
UGPS 0722−05H2O−J
WJ
CH4−J
NH3−H
H2O−H
CH4−H
Figure 7. Illustration of the H2O–J, WJ , CH4–J, CH4–J, NH3–H, and CH4–Hindices overplotted on the spectrum UGPS 0722−05.
(A color version of this figure is available in the online journal.)
J1541−2250 are slightly higher than in the spectrum of UGPS0722−05. This is consistent with the blueward trend in the Y−Jcolor of late-type T dwarfs (Leggett et al. 2010; Burninghamet al. 2010) which Burningham et al. (2010) ascribed to theweakening of the strong resonance K i doublet (7665, 7699 Å)as K condenses into KCl. Finally, since the spectrum of WISEPJ1828+2650 is distinct from both UGPS 0722−05 and WISEPJ1738+2732, we classify it as >Y0. A more precise subtypewill require the discovery of additional Y dwarfs to bridge thegap in spectral morphology between WISEP J1738+2732 andWISEP J1828+2650.
4.1.5. Reclassification of Previously Published �T8.5 Dwarfs
There are also 12 T dwarfs with spectral types later thanT8 currently in the literature (see Table 4). Since we havereclassified UGPS 0722−05 as a T9 dwarf, we must alsoreclassify the other 11 dwarfs using this new system. Toaccomplish this, we have smoothed the published spectra toa resolving power of R = 150 and resampled them onto thesame wavelength scale as the IRTF/SpeX spectrum of UGPS0722−05. This ensures that differences in resolving power andwavelength sampling between the late-type T dwarfs and theBurgasser et al. IRTF/SpeX spectra of the T dwarf spectralstandards do not adversely affect our classification. Table 4gives the revised spectral types derived from direct comparisonfor the 12 T dwarfs with published spectral types later than T8.When the J- and H-band regions gave conflicting spectral types,we used the typed inferred from the J band.
4.1.6. Spectral Indices
Although the primary (and preferred) method of assigninga spectral type is to compare the spectrum of a brown dwarfagainst that of the spectral standards, the use of spectral indicesremains popular in the literature. We have therefore computedthe H2O–J, CH4–J, H2O–H, CH4–H (Burgasser et al. 2006),WJ (Warren et al. 2007), and NH3–H (Delorme et al. 2008a)indices of the new WISE brown dwarfs and as well as UGPS0722−05. Figure 7 illustrates the positions of the indices’
flux windows relative to the spectrum of UGPS 0722−05.The index values are computed in a Monte Carlo fashionwhereby 5000 realizations of each spectrum are generatedby randomly drawing from normal distributions with meansgiven by the flux densities at each wavelength and standarddeviations given by the uncertainty in the flux densities. Thevalues of the indices and their uncertainties are given bythe mean and standard deviation of the distribution of indexvalues computed from the 5000 realizations and are listed inTable 5.
Figure 8 shows the values of the six indices as a function ofspectral type. Also shown are the index values of the T6−T8spectral standards, a sample of T5−T8 dwarfs from the SpeXPrism Spectral Library, and the 12 T dwarfs with previouslypublished spectral types later than T8. The classification ofWISEP J1738+2732 as a Y dwarf is bolstered by the distinctivebreak in the trend of the NH3–H values with spectral type whichsuggests that a new absorption band has indeed emerged at theT/Y dwarf transition. The remaining spectral indices do notshow a break at the T/Y transition, but the CH4–J, H2O–H,and WJ indices do show a smooth trend with spectral typedown to Y0 indicating that they can still be used as proxiesfor direct spectral comparisons. Indeed, the value of the WJspectral index for WISEP J1738+2732 is far from saturatedso we support the suggestion by Burningham et al. (2008)that this index can be used as a proxy for direct comparisonfor late-type T dwarfs and early-type Y dwarfs. However, theCH4–H index is clearly beginning to saturate at T9 and theH2O–J index may even reverse at Y0 rendering these indicesless useful for classification purposes. Finally, although thereis scatter due to the very low S/N of some of the spectra,the new WISE brown dwarfs are clearly distinct from theprevious �T8.5 dwarfs and cluster around the Y0 spectralstandard.
4.2. Atmospheric and Structural Properties
4.2.1. Atmospheric Properties
In order to investigate the atmospheric properties (e.g., Teff ,log g) of the brown dwarfs, we have compared their near-infrared spectra to a new preliminary grid of model spectragenerated with the model atmospheres of Marley & Saumon. Adetailed description of the basic models can be found in Marleyet al. (2002), Saumon & Marley (2008), Cushing et al. (2008),and Stephens et al. (2009). This preliminary grid includes a newNH3 line list (Yurchenko et al. 2011) and a new prescriptionfor the collision induced opacity for H2 (D. Saumon et al.2011, in preparation). A more detailed study that compares themodel spectra to the near-infrared spectra, and WISE and Spitzerphotometry is in preparation.
The grid consists of solar metallicity, cloudless models withthe following parameters: Teff = 200–1000 K in steps of 50 K,log g = 3.75 − 5 in steps of 0.25 (cm s−2), and Kzz = 0,104 cm2 s−1. Although the opacities of the condensate clouds arenot included in the atmospheric models, i.e., they are cloudless,the effects on the atmospheric chemistry due to the rainout of thecondensates is accounted for in the models. This assumption isreasonable for the silicate and liquid iron clouds since they formwell below the observable photosphere (see however, Burgasseret al. 2010) but may not be valid if, as expected, H2O clouds formhigh in the atmosphere of the coldest models. The eddy diffusioncoefficient, Kzz, parameterizes the vigor of mixing in theradiative layers of the atmosphere. A value of Kzz > 0 cm2 s−1
11

The Astrophysical Journal, 743:50 (17pp), 2011 December 10 Cushing et al.
T4 T6 T8 Y0 Y2
Spectral Type
0.0
0.1
0.2
0.3H
2O−
J
T4 T6 T8 Y0 Y2
Spectral Type
0.0
0.1
0.2
0.3
0.4
0.5
CH
4−J
T4 T6 T8 Y0 Y2
Spectral Type
0.0
0.1
0.2
0.3
0.4
H2O
−H
WISEPrevious >T8
T4 T6 T8 Y0 Y2
Spectral Type
−0.1
0.0
0.1
0.2
0.3
0.4
0.5
CH
4−H
T4 T6 T8 Y0 Y2
Spectral Type
0.00.1
0.2
0.3
0.4
0.5
0.6W
J
T4 T6 T8 Y0 Y2
Spectral Type
0.2
0.3
0.4
0.5
0.6
0.7
0.8
NH
3−H
Figure 8. Values of the H2O–J, CH4–J, H2O–H, CH4–H (Burgasser et al. 2006), WJ (Warren et al. 2007), and NH3–H (Delorme et al. 2008a) spectral indices as afunction of spectral type. The black points are for the T6−Y0 spectral standards. The gray points were computed using spectra of late-type (T5−T8) T dwarfs fromthe SpeX Prism Spectral Library. The red points are the 12 T dwarfs with previously published spectral types later than T8 and the green points are the remaining sixWISE brown dwarfs. For plotting purposes only, we have assigned WISEP J1828+2650 a spectral type of Y1.
(A color version of this figure is available in the online journal.)
Table 4Previously Published Brown Dwarfs with Spectral Types Later than T8
Object Previous Reference AdoptedSpectral Type Spectral Type
Ross 458C T8 Burgasser et al. (2010) T8T8.5p Burningham et al. (2011a) . . .
ULAS J123828.51 + 095351.3 T8.5 Burningham et al. (2008) T8ULAS J130217.21 + 130851.2 T8.5 Burningham et al. (2010) T8ULAS J003402.77−005206.7 T8.5 Warren et al. (2007) T8.5
T9 Burningham et al. (2008) . . .
CFBDS J005910.90−011401.3 �T9 Delorme et al. (2008a) T8.5T9 Burningham et al. (2008) . . .
WISEPC J045853.90 + 643451.9 T9 Mainzer et al. (2011) T8.5UGPS J052127.27 + 364048.6 T8.5 Burningham et al. (2011b) T8.5ULAS J133553.45 + 113005.2 T9 Burningham et al. (2008) T8.5Wolf 940B T8.5 Burningham et al. (2009) T8.5WISEPC J181210.85 + 272144.3 T8.5: Burgasser et al. (2011) T8.5:UGPS J072227.51−054031.2 T10 Lucas et al. (2010) T9CFBDSIR J145829 + 101343AB T9.5 Liu et al. (2011) T9
results in mixing that can prevent the abundances of CO andCH4 (the dominant carbon-bearing species) from coming intochemical equilibrium because the mixing timescales becomeshorter than the timescales of key chemical reactions involvedin the conversion of CO to CH4 (Lodders & Fegley 2002;Saumon et al. 2003; Hubeny & Burrows 2007). Typical valuesof Kzz in the stratospheres of giant planets are 102–105 cm2 s−1
(Saumon et al. 2006). The abundances of N2 and NH3 (the
dominant nitrogen-bearing species) are also kept from cominginto chemical equilibrium by mixing, but in this case the mixingtimescales are set in the convective layers of the atmosphere bythe mixing length theory. As a result, the final non-equilibriumabundances of N2 and NH3 are not sensitive to variations in theeddy diffusion coefficient Kzz. However by convention, modelswith Kzz = 0 cm2 s−1 are in full chemical equilibrium (i.e.,the effect of convective mixing on the nitrogen chemistry is
12

The Astrophysical Journal, 743:50 (17pp), 2011 December 10 Cushing et al.
Table 5Spectral Indices
Object Spectral H2O–J CH4–J H2O–H CH4–H WJ NH3–HType
UGPS 0722−05a T9 + 0.009 (0.004) + 0.115 (0.003) + 0.115 (0.007) + 0.075 (0.005) + 0.215 (0.003) + 0.527 (0.008)WISEPC J0148−7202 T9.5 −0.017 (0.011) + 0.076 (0.006) + 0.070 (0.013) + 0.016 (0.012) + 0.152 (0.006) + 0.431 (0.015)WISEP J0410 + 1502 Y0 −0.043 (0.090) + 0.036 (0.059) −0.036 (0.458) −0.105 (0.434) + 0.155 (0.052) + 0.380 (0.574)WISEPC J1405 + 5534 Y0 (pec?) + 0.020 (0.026) + 0.031 (0.017) + 0.063 (0.025) + 0.162 (0.028) + 0.099 (0.017) + 0.346 (0.027)WISEP J1541−2250 Y0 −0.046 (0.115) + 0.040 (0.060) + 0.155 (0.216) + 0.057 (0.208) + 0.081 (0.066) + 0.259 (0.200)WISEP J1738+2732 Y0 + 0.036 (0.008) + 0.050 (0.005) + 0.045 (0.008) + 0.050 (0.009) + 0.149 (0.005) + 0.349 (0.010)WISEP J1828+2650 >Y0 + 0.248 (0.152) + 0.257 (0.099) + 0.049 (0.091) + 0.129 (0.101) + 0.515 (0.106) + 0.503 (0.110)WISEPC J2056 + 1459 Y0 . . . + 0.030 (0.009) . . . + 0.050 (0.034) + 0.129 (0.012) + 0.240 (0.031)
Notes. The H2O–J and H2O–H indices cannot be computed for WISEPC J205628.90 + 145953.3 because its spectrum does not span the entirewavelength range of the indices.a The values differ from that measured by Lucas et al. (2010). Our two spectra agree well except deep in the CH4 and H2O absorption bands, whereour spectrum exhibits lower flux levels. The reason for this discrepancy is unclear but it may be a result of the fact that the Lucas et al. spectrum wascreated by merging separate spectra that were absolutely flux calibrated using near-infrared photometry.
ignored) and models with Kzz �= 0 cm2 s−1 exhibit both carbonand nitrogen non-equilibrium chemistry.
The best-fitting models are identified using the goodness-of-fit statistic, Gk = ∑n
i=1 wi(fi−CkFk,i
σi)2, where n is the number
of data pixels, wi is the weight for the ith wavelength (set tounity in this case), fi and Fk,i are the flux densities of the dataand model k, respectively, σi are the errors in the observed fluxdensities, and Ck is an unknown multiplicative constant equal to(R/d)2, where R is the radius of the star and d is the distance tothe star (Cushing et al. 2008). In order to increase the S/N of thedata, we first smoothed the higher resolution spectra to R = 200.The model spectra were also smoothed to the same resolvingpower and linearly interpolated onto the wavelength scale ofthe data. For each model, we compute the scale factor Ck byminimizing Gk with respect to Ck and identify the best-fittingmodel as having the global minimum Gk value. To estimate therange of models that fits the data well, we run a Monte Carlosimulation that uses the uncertainties in the individual spectralpoints and the uncertainties in the absolute flux calibration ofthe spectra to generate 104 simulated noisy spectra. The fittingprocess is repeated on each simulated spectrum and models thatare consistent with the best-fitting model at the 3σ level areconsidered equally good representations of the data. We did notattempt to fit the spectrum of WISEP J1828+2650 because it iscontaminated with light from other stars in the WFC3 field ofview (see Sections 3.2.4 and 4.1.1). After discussing the resultsof the fits to the spectra of the other brown dwarfs, we returnto estimate an approximate effective temperature for WISEPJ1828+2650.
Table 6 lists the best-fitting model parameters for eachbrown dwarf, as well as UGPS 0722−05. The derived effectivetemperatures of the WISE brown dwarfs are all cold, rangingfrom 350 to 500 K. Indeed all but one have estimated effectivetemperatures of less than 450 K making them the coldestspectroscopically confirmed brown dwarfs known. Five out ofthe six best-fitting models also have Kzz �= 0 which indicatesthat vertical mixing is present in the atmospheres of thesecold brown dwarfs. This is not a surprising result given thatstrong evidence for vertical mixing in the atmospheres of browndwarfs has been found at longer wavelengths (Saumon et al.2006, 2007; Leggett et al. 2007b, 2009; Burgasser et al. 2008;Stephens et al. 2009; Geballe et al. 2009; Cushing et al. 2010). Atsuch low temperatures, the effects of non-equilibrium chemistryon the J- and H-band spectra of brown dwarfs is limited to
1.0 1.5 2.0
Wavelength (μm)
0
1
2
3
4
5
6
Nor
mal
ized
f λ +
Con
stan
t
WISE J0148−7202500/4.50/104
WISE J2056+1459350/4.75/104
WISE J0410+1502450/3.75/0
WISE J1541−2250350/4.25/104
WISE J1738+2732350/4.75/104
WISE J1405+5534350/5.00/104
Figure 9. Best-fitting models (red) overplotted on the near-infrared spectra ofsix of the seven new WISE brown dwarfs (black). The spectra were normalizedto unity at the peak flux in the J band and offset by constants (dotted lines).The uncertainties in the spectra are given by gray bars. The best-fitting modelparameters are given in the form Teff (K)/log g (cm s−2)/Kzz (cm2 s−1).
(A color version of this figure is available in the online journal.)
weakening the NH3 absorption bands. The detection of mixingtherefore underscores the fact that NH3 is probably at leastpartially responsible for the absorption seen on the blue wingof the H-band peak of WISEPC J1405 + 5534 and WISEPJ1738+2732.
Figure 9 shows the best-fitting model spectra overplotted onthe data. Since this is the first time such cold model spectra havebeen compared to observed spectra, the agreement between themodels and the data is encouraging. In particular, the height
13
The Astrophysical Journal, 743:50 (17pp), 2011 December 10 Cushing et al.
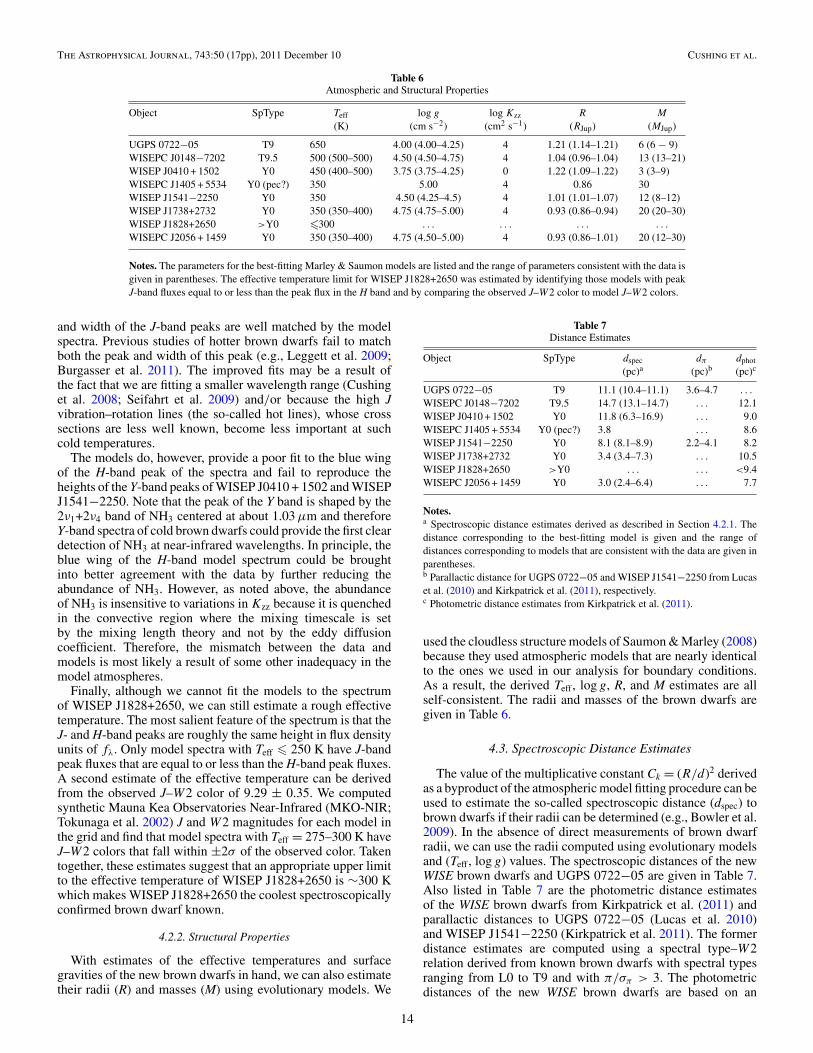
Table 6Atmospheric and Structural Properties
Object SpType Teff log g log Kzz R M(K) (cm s−2) (cm2 s−1) (RJup) (MJup)
UGPS 0722−05 T9 650 4.00 (4.00–4.25) 4 1.21 (1.14–1.21) 6 (6 − 9)WISEPC J0148−7202 T9.5 500 (500–500) 4.50 (4.50–4.75) 4 1.04 (0.96–1.04) 13 (13–21)WISEP J0410 + 1502 Y0 450 (400–500) 3.75 (3.75–4.25) 0 1.22 (1.09–1.22) 3 (3–9)WISEPC J1405 + 5534 Y0 (pec?) 350 5.00 4 0.86 30WISEP J1541−2250 Y0 350 4.50 (4.25–4.5) 4 1.01 (1.01–1.07) 12 (8–12)WISEP J1738+2732 Y0 350 (350–400) 4.75 (4.75–5.00) 4 0.93 (0.86–0.94) 20 (20–30)WISEP J1828+2650 >Y0 �300 . . . . . . . . . . . .
WISEPC J2056 + 1459 Y0 350 (350–400) 4.75 (4.50–5.00) 4 0.93 (0.86–1.01) 20 (12–30)
Notes. The parameters for the best-fitting Marley & Saumon models are listed and the range of parameters consistent with the data isgiven in parentheses. The effective temperature limit for WISEP J1828+2650 was estimated by identifying those models with peakJ-band fluxes equal to or less than the peak flux in the H band and by comparing the observed J–W2 color to model J–W2 colors.
and width of the J-band peaks are well matched by the modelspectra. Previous studies of hotter brown dwarfs fail to matchboth the peak and width of this peak (e.g., Leggett et al. 2009;Burgasser et al. 2011). The improved fits may be a result ofthe fact that we are fitting a smaller wavelength range (Cushinget al. 2008; Seifahrt et al. 2009) and/or because the high Jvibration–rotation lines (the so-called hot lines), whose crosssections are less well known, become less important at suchcold temperatures.
The models do, however, provide a poor fit to the blue wingof the H-band peak of the spectra and fail to reproduce theheights of the Y-band peaks of WISEP J0410 + 1502 and WISEPJ1541−2250. Note that the peak of the Y band is shaped by the2ν1+2ν4 band of NH3 centered at about 1.03 μm and thereforeY-band spectra of cold brown dwarfs could provide the first cleardetection of NH3 at near-infrared wavelengths. In principle, theblue wing of the H-band model spectrum could be broughtinto better agreement with the data by further reducing theabundance of NH3. However, as noted above, the abundanceof NH3 is insensitive to variations in Kzz because it is quenchedin the convective region where the mixing timescale is setby the mixing length theory and not by the eddy diffusioncoefficient. Therefore, the mismatch between the data andmodels is most likely a result of some other inadequacy in themodel atmospheres.
Finally, although we cannot fit the models to the spectrumof WISEP J1828+2650, we can still estimate a rough effectivetemperature. The most salient feature of the spectrum is that theJ- and H-band peaks are roughly the same height in flux densityunits of fλ. Only model spectra with Teff � 250 K have J-bandpeak fluxes that are equal to or less than the H-band peak fluxes.A second estimate of the effective temperature can be derivedfrom the observed J–W2 color of 9.29 ± 0.35. We computedsynthetic Mauna Kea Observatories Near-Infrared (MKO-NIR;Tokunaga et al. 2002) J and W2 magnitudes for each model inthe grid and find that model spectra with Teff = 275–300 K haveJ–W2 colors that fall within ±2σ of the observed color. Takentogether, these estimates suggest that an appropriate upper limitto the effective temperature of WISEP J1828+2650 is ∼300 Kwhich makes WISEP J1828+2650 the coolest spectroscopicallyconfirmed brown dwarf known.
4.2.2. Structural Properties
With estimates of the effective temperatures and surfacegravities of the new brown dwarfs in hand, we can also estimatetheir radii (R) and masses (M) using evolutionary models. We
Table 7Distance Estimates
Object SpType dspec dπ dphot
(pc)a (pc)b (pc)c
UGPS 0722−05 T9 11.1 (10.4–11.1) 3.6–4.7 . . .
WISEPC J0148−7202 T9.5 14.7 (13.1–14.7) . . . 12.1WISEP J0410 + 1502 Y0 11.8 (6.3–16.9) . . . 9.0WISEPC J1405 + 5534 Y0 (pec?) 3.8 . . . 8.6WISEP J1541−2250 Y0 8.1 (8.1–8.9) 2.2–4.1 8.2WISEP J1738+2732 Y0 3.4 (3.4–7.3) . . . 10.5WISEP J1828+2650 >Y0 . . . . . . <9.4WISEPC J2056 + 1459 Y0 3.0 (2.4–6.4) . . . 7.7
Notes.a Spectroscopic distance estimates derived as described in Section 4.2.1. Thedistance corresponding to the best-fitting model is given and the range ofdistances corresponding to models that are consistent with the data are given inparentheses.b Parallactic distance for UGPS 0722−05 and WISEP J1541−2250 from Lucaset al. (2010) and Kirkpatrick et al. (2011), respectively.c Photometric distance estimates from Kirkpatrick et al. (2011).
used the cloudless structure models of Saumon & Marley (2008)because they used atmospheric models that are nearly identicalto the ones we used in our analysis for boundary conditions.As a result, the derived Teff , log g, R, and M estimates are allself-consistent. The radii and masses of the brown dwarfs aregiven in Table 6.
4.3. Spectroscopic Distance Estimates
The value of the multiplicative constant Ck = (R/d)2 derivedas a byproduct of the atmospheric model fitting procedure can beused to estimate the so-called spectroscopic distance (dspec) tobrown dwarfs if their radii can be determined (e.g., Bowler et al.2009). In the absence of direct measurements of brown dwarfradii, we can use the radii computed using evolutionary modelsand (Teff , log g) values. The spectroscopic distances of the newWISE brown dwarfs and UGPS 0722−05 are given in Table 7.Also listed in Table 7 are the photometric distance estimatesof the WISE brown dwarfs from Kirkpatrick et al. (2011) andparallactic distances to UGPS 0722−05 (Lucas et al. 2010)and WISEP J1541−2250 (Kirkpatrick et al. 2011). The formerdistance estimates are computed using a spectral type–W2relation derived from known brown dwarfs with spectral typesranging from L0 to T9 and with π/σπ > 3. The photometricdistances of the new WISE brown dwarfs are based on an
14

The Astrophysical Journal, 743:50 (17pp), 2011 December 10 Cushing et al.
500 550 600 650 700Teff (K)
3.75
4.00
4.25
4.50
4.75
5.00
log
g (c
m s
−2 )
0.5
1.0
1.5
2.0
d spe
c /1
0 pc
Figure 10. Impact of systematic errors in the derived values of (Teff , log g) onthe spectroscopic distance, dspec, for a hypothetical dwarf with Teff = 600 Kand log g= 4.5 cm s−2.
(A color version of this figure is available in the online journal.)
extrapolation of this relation and therefore should be treatedwith caution.
The agreement between the three distance estimates rangefrom good to poor. For example, the spectroscopic and photo-metric distances of WISEP J1541−2250 are in good agreementbut the parallactic distance is discrepant by a factor of two tofour. Perhaps most discouraging is the mismatch between thespectroscopic and parallactic distances of UGPS 0722−05. Liuet al. (2011) recently showed that the agreement between thespectroscopic distances (derived using only near-infrared spec-tra) and the parallactic distances of 10 late-type T dwarfs rangefrom 10% to a factor of two, with no apparent trend with spec-tral type or distance. This suggests that spectroscopic distancesshould only be used to confirm that the physical properties ofbrown dwarfs (Teff , R, M) derived from atmospheric and evo-lutionary models are consistent with the known distance to thebrown dwarf.
A corollary to this statement is that if the spectroscopic andparallactic distances are discrepant then some combinations ofthe Teff , log g, and R values are in error. In order to estimate thesignificance of the bias in the spectroscopic distance estimateintroduced by systematic errors in the inferred atmosphericproperties, we have run a 1–2.5 μm model with Teff = 600 K,log g = 4.5 cm s−2 through the fitting procedure describedin Section 4.2.1. The model spectrum was first multipliedby an appropriate value of (R/d)2 corresponding to 10 pc.Figure 10 shows the ratio of dspec/10 pc derived for modelswith effective temperatures from 500 to 700 K and surfacegravities from 3.75 to 5.0. The maximum change in dspec forthese models is approximately a factor of two for a change of+ 100 K/−0.75 dex and −100 K/ + 0.5 dex in Teff/log g. Thespectroscopic distance is also most sensitive to changes in Teffas noted by Liu et al. (2011).
The apparent mismatch between the spectroscopic and paral-lactic distance estimates is perhaps not so surprising as Cushinget al. (2008) have shown that variations of order 100–200 K arecommon when estimating the effective temperatures of L andearly- to mid-type T dwarfs using spectra that cover only a frac-tion of the spectral energy distribution. These variations are mostlikely exacerbated by the fact that only ∼35% (in flux densityunits of fλ) of the bolometric flux of a Teff = 600 K brown dwarfis emitted at near-infrared wavelengths. In summary, given the
uncertainties in the model atmospheres and the difficulty in esti-mating the effective temperatures and surface gravities of browndwarfs, it is not surprising that spectroscopic distance estimatesdo not always agree with the parallactic distances.
5. DISCUSSION
The new WISE brown dwarfs presented herein are the cold-est (Teff = 300–500 K) spectroscopically confirmed browndwarfs currently known. However as noted in Section 1, WD0806−661B and CFBDSIR J1458 + 1013B have estimated ef-fective temperatures of ∼300–400 K based on photometry alone(Luhman et al. 2011; Liu et al. 2011; Rodriguez et al. 2011).How do the properties of these two brown dwarfs compare withthe new WISE brown dwarfs?
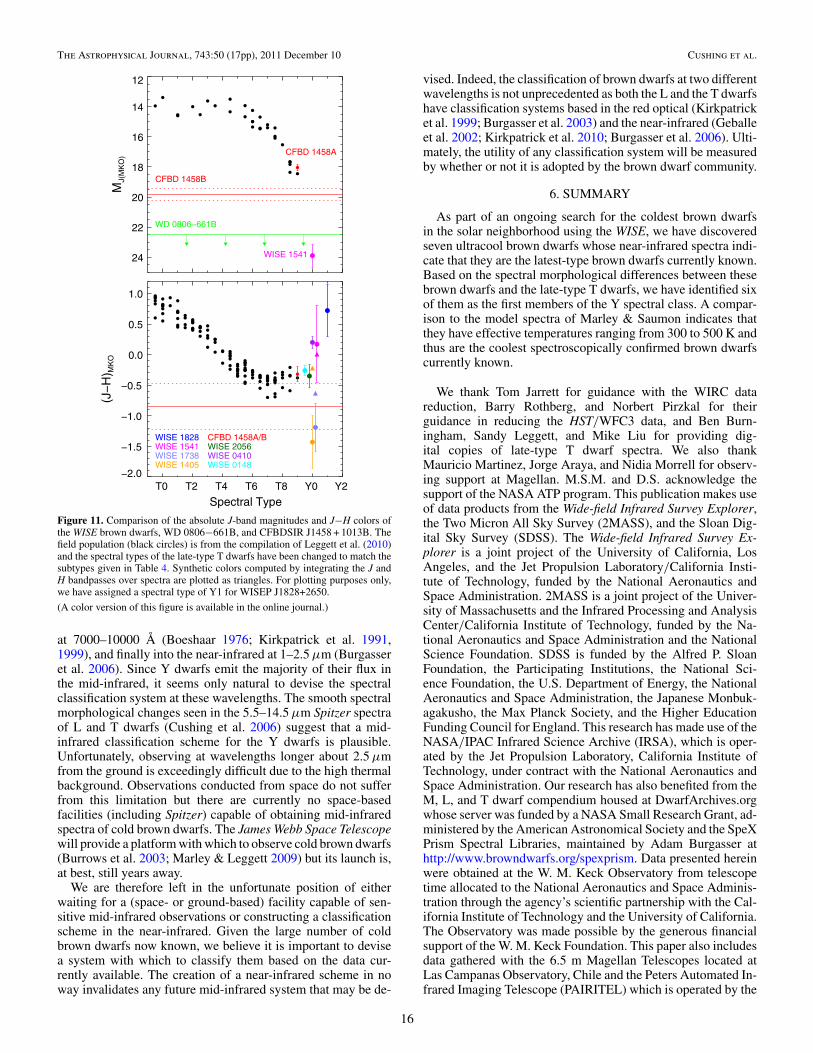
The upper panel of Figure 11 shows the absolute J-band mag-nitude (MJ) as a function of spectral type for a sample of fieldT dwarfs (Leggett et al. 2010), WISEP J1541−2250 (the onlyWISE brown dwarf with a measured parallax), WD 0806−661B(Luhman et al. 2011) and CFBDSIR J1458 + 1013B (Liu et al.2011). The value of MJ increases precipitously beyond a spec-tral type of T8 and reaches ∼23.9 for WISEP J1541−2250 (Y0).The absolute magnitude of CFBDSIR J1458 + 1013B falls be-tween the two T9 dwarfs and WISEP J1541−2250 suggestingthat it has a spectral type of T9−Y0. However, the absolutemagnitudes of more late-type T dwarfs and Y dwarfs must bemeasured before any strong conclusions can be drawn basedon absolute magnitudes alone. The absolute magnitude of WD0806−661B is still only a limit (MJ > 22.5) which leaves openthe possibility that WD 0806−661B is even fainter, and thuspresumably cooler than, WISEP J1541−2250. Either way, it isclear that based on the trend of MJ with spectral type that observ-ing even colder objects at near-infrared wavelengths is going tobecome increasingly difficult unless they are very close the Sun.
The lower panel of Figure 11 shows the J−H colors as afunction of spectral type for a sample of field T dwarfs (Leggettet al. 2010), the new WISE brown dwarfs, and CFBDSIRJ1458 + 1013B (WD 0806−661B has yet to be detected ineither the J or H band). Some of the colors of the WISEbrown dwarfs have large uncertainties so we also computedsynthetic MKO-NIR J−H colors as described in Rayner et al.(2009); they are shown as triangles in Figure 11. Since theWFC3/HST spectra do not span the entire H band, we used thespectrum of UGPS 0722−05 to extend the spectra of WISEPJ1738+2732 and WISEPC J1405 + 5534 to the limit of theH-band filter. The synthetic and observed photometries ofWISEPC J1405 + 5534 are clearly discrepant and it is unclearwhat the underlying cause is. The scatter in the J−H colors of thedwarfs at the T/Y transition makes it difficult to assign a spectraltype to CFBDSIR J1458 + 1013B but it is broadly consistentwith T6−Y0. The overall trend with spectral type suggeststhat the J−H colors may be turning toward to the red at theT/Y transition. This turn is broadly consistent with theoreticalmodels which predict that the J−K color also turns toward thered at Teff = 390–450 K (Burrows et al. 2003). However, giventhe small number of objects and the large uncertainties in colors,a definitive conclusion cannot yet be reached.
Finally, given the rapid increase in the absolute J-bandmagnitude at the T/Y transition, it is reasonable to ask whetherthe near-infrared is the appropriate wavelength range withwhich to define the Y spectral class. Indeed historically ascooler and cooler stars were discovered, the wavelength rangeused for spectral classification moved from the blue violet at3900–4900 Å (Morgan et al. 1943), through the red optical
15
The Astrophysical Journal, 743:50 (17pp), 2011 December 10 Cushing et al.
24
22
20
18
16
14
12
MJ(
MK
O)
WD 0806−661B
CFBD 1458B
CFBD 1458A
WISE 1541
T0 T2 T4 T6 T8 Y0 Y2
Spectral Type
−2.0
−1.5
−1.0
−0.5
0.0
0.5
1.0
(J−
H) M
KO
WISE 1828WISE 1541WISE 1738WISE 1405 WISE 0148
WISE 0410WISE 2056CFBD 1458A/B
Figure 11. Comparison of the absolute J-band magnitudes and J−H colors ofthe WISE brown dwarfs, WD 0806−661B, and CFBDSIR J1458 + 1013B. Thefield population (black circles) is from the compilation of Leggett et al. (2010)and the spectral types of the late-type T dwarfs have been changed to match thesubtypes given in Table 4. Synthetic colors computed by integrating the J andH bandpasses over spectra are plotted as triangles. For plotting purposes only,we have assigned a spectral type of Y1 for WISEP J1828+2650.
(A color version of this figure is available in the online journal.)
at 7000–10000 Å (Boeshaar 1976; Kirkpatrick et al. 1991,1999), and finally into the near-infrared at 1–2.5 μm (Burgasseret al. 2006). Since Y dwarfs emit the majority of their flux inthe mid-infrared, it seems only natural to devise the spectralclassification system at these wavelengths. The smooth spectralmorphological changes seen in the 5.5–14.5 μm Spitzer spectraof L and T dwarfs (Cushing et al. 2006) suggest that a mid-infrared classification scheme for the Y dwarfs is plausible.Unfortunately, observing at wavelengths longer about 2.5 μmfrom the ground is exceedingly difficult due to the high thermalbackground. Observations conducted from space do not sufferfrom this limitation but there are currently no space-basedfacilities (including Spitzer) capable of obtaining mid-infraredspectra of cold brown dwarfs. The James Webb Space Telescopewill provide a platform with which to observe cold brown dwarfs(Burrows et al. 2003; Marley & Leggett 2009) but its launch is,at best, still years away.
We are therefore left in the unfortunate position of eitherwaiting for a (space- or ground-based) facility capable of sen-sitive mid-infrared observations or constructing a classificationscheme in the near-infrared. Given the large number of coldbrown dwarfs now known, we believe it is important to devisea system with which to classify them based on the data cur-rently available. The creation of a near-infrared scheme in noway invalidates any future mid-infrared system that may be de-
vised. Indeed, the classification of brown dwarfs at two differentwavelengths is not unprecedented as both the L and the T dwarfshave classification systems based in the red optical (Kirkpatricket al. 1999; Burgasser et al. 2003) and the near-infrared (Geballeet al. 2002; Kirkpatrick et al. 2010; Burgasser et al. 2006). Ulti-mately, the utility of any classification system will be measuredby whether or not it is adopted by the brown dwarf community.
6. SUMMARY
As part of an ongoing search for the coldest brown dwarfsin the solar neighborhood using the WISE, we have discoveredseven ultracool brown dwarfs whose near-infrared spectra indi-cate that they are the latest-type brown dwarfs currently known.Based on the spectral morphological differences between thesebrown dwarfs and the late-type T dwarfs, we have identified sixof them as the first members of the Y spectral class. A compar-ison to the model spectra of Marley & Saumon indicates thatthey have effective temperatures ranging from 300 to 500 K andthus are the coolest spectroscopically confirmed brown dwarfscurrently known.
We thank Tom Jarrett for guidance with the WIRC datareduction, Barry Rothberg, and Norbert Pirzkal for theirguidance in reducing the HST/WFC3 data, and Ben Burn-ingham, Sandy Leggett, and Mike Liu for providing dig-ital copies of late-type T dwarf spectra. We also thankMauricio Martinez, Jorge Araya, and Nidia Morrell for observ-ing support at Magellan. M.S.M. and D.S. acknowledge thesupport of the NASA ATP program. This publication makes useof data products from the Wide-field Infrared Survey Explorer,the Two Micron All Sky Survey (2MASS), and the Sloan Dig-ital Sky Survey (SDSS). The Wide-field Infrared Survey Ex-plorer is a joint project of the University of California, LosAngeles, and the Jet Propulsion Laboratory/California Insti-tute of Technology, funded by the National Aeronautics andSpace Administration. 2MASS is a joint project of the Univer-sity of Massachusetts and the Infrared Processing and AnalysisCenter/California Institute of Technology, funded by the Na-tional Aeronautics and Space Administration and the NationalScience Foundation. SDSS is funded by the Alfred P. SloanFoundation, the Participating Institutions, the National Sci-ence Foundation, the U.S. Department of Energy, the NationalAeronautics and Space Administration, the Japanese Monbuk-agakusho, the Max Planck Society, and the Higher EducationFunding Council for England. This research has made use of theNASA/IPAC Infrared Science Archive (IRSA), which is oper-ated by the Jet Propulsion Laboratory, California Institute ofTechnology, under contract with the National Aeronautics andSpace Administration. Our research has also benefited from theM, L, and T dwarf compendium housed at DwarfArchives.orgwhose server was funded by a NASA Small Research Grant, ad-ministered by the American Astronomical Society and the SpeXPrism Spectral Libraries, maintained by Adam Burgasser athttp://www.browndwarfs.org/spexprism. Data presented hereinwere obtained at the W. M. Keck Observatory from telescopetime allocated to the National Aeronautics and Space Adminis-tration through the agency’s scientific partnership with the Cal-ifornia Institute of Technology and the University of California.The Observatory was made possible by the generous financialsupport of the W. M. Keck Foundation. This paper also includesdata gathered with the 6.5 m Magellan Telescopes located atLas Campanas Observatory, Chile and the Peters Automated In-frared Imaging Telescope (PAIRITEL) which is operated by the
16
The Astrophysical Journal, 743:50 (17pp), 2011 December 10 Cushing et al.
Smithsonian Astrophysical Observatory (SAO) and was madepossible by a grant from the Harvard University Milton Fund,the camera loan from the University of Virginia, and the con-tinued support of the SAO and the University of California,Berkeley. Magellan telescope time was granted by NOAO (Pro-posal ID 2010B-0184, P.I. Mainzer), through the Telescope Sys-tem Instrumentation Program (TSIP). TSIP is funded by NSF.National Optical Astronomy Observatory, which is operatedby the Association of Universities for Research in Astronomy(AURA) under cooperative agreement with the National ScienceFoundation. Partial support for PAIRITEL operations and thiswork comes from National Aeronautics and Space Administra-tion grant NNG06GH50G. A.J.B. acknowledges support fromthe Chris and Warren Hellman Fellowship Program. Finally,this research was supported (in part) by an appointment to theNASA Postdoctoral Program at the Jet Propulsion Laboratory,administered by Oak Ridge Associated Universities through acontract with NASA.
Facilities: IRTF (SpeX), Hale (WIRC), Magellan:Baade(FIRE, PANIC), Keck:II (NIRC2, NIRSPEC), Spitzer (IRAC),HST (WFC3)
REFERENCES
Allen, P. R., Koerner, D. W., Reid, I. N., & Trilling, D. E. 2005, ApJ, 625, 385Bertin, E., & Arnouts, S. 1996, A&AS, 117, 393Beuzit, J. L., Mouillet, D., Moutou, C., et al. 2006, in Tenth Anniversary of
51 Peg-b: Status of and Prospects for Hot Jupiter studies, ed. L. Arnold, F.Bouchy, & C. Moutou (Paris: Frontier Group), 353
Boeshaar, P. C. 1976, PhD thesis, Ohio State Univ., ColumbusBowler, B. P., Liu, M. C., & Cushing, M. C. 2009, ApJ, 706, 1114Burgasser, A. J. 2004, ApJS, 155, 191Burgasser, A. J., Cushing, M. C., Kirkpatrick, J. D., et al. 2011, ApJ, 735, 116Burgasser, A. J., Geballe, T. R., Leggett, S. K., Kirkpatrick, J. D., & Golimowski,
D. A. 2006, ApJ, 637, 1067Burgasser, A. J., Kirkpatrick, J. D., Liebert, J., & Burrows, A. 2003, ApJ, 594,
510Burgasser, A. J., Simcoe, R. A., Bochanski, J. J., et al. 2010, ApJ, 725, 1405Burgasser, A. J., Tinney, C. G., Cushing, M. C., et al. 2008, ApJ, 689, L53Burningham, B., Leggett, S. K., Homeier, D., et al. 2011a, MNRAS, 414, 3590Burningham, B., Lucas, P. W., Leggett, S. K., et al. 2011b, MNRAS, 414, L90Burningham, B., Pinfield, D. J., Leggett, S. K., et al. 2008, MNRAS, 391, 320Burningham, B., Pinfield, D. J., Leggett, S. K., et al. 2009, MNRAS, 395, 1237Burningham, B., Pinfield, D. J., Lucas, P. W., et al. 2010, MNRAS, 406, 1885Burrows, A., & Sharp, C. M. 1999, ApJ, 512, 843Burrows, A., Sudarsky, D., & Lunine, J. I. 2003, ApJ, 596, 587Chauvin, G., Lagrange, A., Dumas, C., et al. 2004, A&A, 425, L29Cushing, M. C., Marley, M. S., Saumon, D., et al. 2008, ApJ, 678, 1372Cushing, M. C., Rayner, J. T., & Vacca, W. D. 2005, ApJ, 623, 1115Cushing, M. C., Roellig, T. L., Marley, M. S., et al. 2006, ApJ, 648, 614Cushing, M. C., Saumon, D., & Marley, M. S. 2010, AJ, 140, 1428Delorme, P., Delfosse, X., Albert, L., et al. 2008a, A&A, 482, 961Delorme, P., Willott, C. J., Forveille, T., et al. 2008b, A&A, 484, 469Epchtein, N., de Batz, B., Capoani, L., et al. 1997, Messenger, 87, 27Fazio, G. G., Hora, J. L., Allen, L. E., et al. 2004, ApJS, 154, 10Freedman, R. S., Marley, M. S., & Lodders, K. 2008, ApJS, 174, 504Geballe, T. R., Knapp, G. R., Leggett, S. K., et al. 2002, ApJ, 564, 466Geballe, T. R., Saumon, D., Golimowski, D. A., et al. 2009, ApJ, 695, 844Hanel, R., Conrath, B., Herath, L., Kunde, V., & Pirraglia, J. 1981, J. Geo-
phys. Res., 86, 8705Hayashi, C., & Nakano, T. 1963, Prog. Theor. Phys., 30, 460Hinkley, S., Oppenheimer, B. R., Zimmerman, N., et al. 2011, PASP, 123, 74Hubeny, I., & Burrows, A. 2007, ApJ, 669, 1248Kimble, R. A., MacKenty, J. W., O’Connell, R. W., & Townsend, J. A. 2008,
Proc. SPIE, 7010 , 70101E-1Kirkpatrick, J. D. 2000, in ASP Conf. Ser. 212, From Giant Planets to Cool
Stars, ed. C. A. Griffith & M. S. Marley (San Francisco, CA: ASP), 20Kirkpatrick, J. D. 2008, in ASP Conf. Ser. 384, 14th Cambridge Workshop on
Cool Stars, Stellar Systems, and the Sun, ed. G. van Belle (San Francisco,CA: ASP), 85
Kirkpatrick, J. D., Cushing, M. C., Gelino, C. R., et al. 2011, ApJS, 197, 19Kirkpatrick, J. D., Henry, T. J., & McCarthy, D. W., Jr. 1991, ApJS, 77, 417Kirkpatrick, J. D., Looper, D. L., Burgasser, A. J., et al. 2010, ApJS, 190, 100Kirkpatrick, J. D., Reid, I. N., Liebert, J., et al. 1999, ApJ, 519, 802Koekemoer, A. M., Fruchter, A. S., Hook, R. N., & Hack, W. 2002, in The 2002
HST Calibration Workshop: Hubble after the Installation of the ACS and theNICMOS Cooling System, ed. S. Arribas, A. Koekemoer, & B. Whitmore(Baltimore, MD: STScI), 337
Kumar, S. S. 1963, ApJ, 137, 1121Kummel, M., Walsh, J. R., Pirzkal, N., Kuntschner, H., & Pasquali, A.
2009, PASP, 121, 59Lawrence, A., Warren, S. J., Almaini, O., et al. 2007, MNRAS, 379, 1599Leggett, S. K., Burningham, B., Saumon, D., et al. 2010, ApJ, 710, 1627Leggett, S. K., Cushing, M. C., Saumon, D., et al. 2009, ApJ, 695, 1517Leggett, S. K., Marley, M. S., Freedman, R., et al. 2007a, ApJ, 667, 537Leggett, S. K., Saumon, D., Marley, M. S., et al. 2007b, ApJ, 655, 1079Liu, M. C., et al. 2011, arXiv:1103.0014Lodders, K. 1999, ApJ, 519, 793Lodders, K., & Fegley, B. 2002, Icarus, 155, 393Lucas, P. W., Tinney, C. G., Burningham, B., et al. 2010, MNRAS, 408, L56Luhman, K. L., Adame, L., D’Alessio, P., et al. 2005, ApJ, 635, L93Luhman, K. L., Burgasser, A. J., & Bochanski, J. J. 2011, ApJ, 730, L9Luhman, K. L., et al. 2011, submittedMacintosh, B., Graham, J., Palmer, D., et al. 2006, Proc. SPIE, 6272, 62720L-1Mainzer, A., Cushing, M. C., Skrutskie, M., et al. 2011, ApJ, 726, 30Marley, M. S., & Leggett, S. K. 2009, in The Future of Ultracool Dwarf Science
with JWST, ed. H. A. Thronson, M. Stiavelli, & A. Tielens (Dordrecht:Springer), 101
Marley, M. S., Seager, S., Saumon, D., et al. 2002, ApJ, 568, 335Martini, P., Persson, S. E., Murphy, D. C., et al. 2004, Proc. SPIE, 5492, 1653McLean, I. S., Becklin, E. E., Bendiksen, O., et al. 1998, Proc. SPIE, 3354, 566McLean, I. S., Graham, J. R., Becklin, E. E., et al. 2000, Proc. SPIE, 4008, 1048McLean, I. S., McGovern, M. R., Burgasser, A. J., et al. 2003, ApJ, 596, 561Morgan, W. W., Keenan, P. C., & Kellman, E. (ed.) 1943, An Atlas of Stellar
Spectra, with an Outline of Spectral Classification (Chicago, IL: Univ.Chicago Press)
Rayner, J. T., Cushing, M. C., & Vacca, W. D. 2009, ApJS, 185, 289Rayner, J. T., Toomey, D. W., Onaka, P. M., et al. 2003, PASP, 115, 362Rodriguez, D. R., Zuckerman, B., Melis, C., & Song, I. 2011, ApJ, 732, L29Roellig, T. L., Van Cleve, J. E., Sloan, G. C., et al. 2004, ApJS, 154, 418Saumon, D., Geballe, T. R., Leggett, S. K., et al. 2000, ApJ, 541, 374Saumon, D., & Marley, M. S. 2008, ApJ, 689, 1327Saumon, D., Marley, M. S., Cushing, M. C., et al. 2006, ApJ, 647, 552Saumon, D., Marley, M. S., Leggett, S. K., et al. 2007, ApJ, 656, 1136Saumon, D., Marley, M. S., Lodders, K., & Freedman, R. S. 2003, in IAU Symp.
211, Brown Dwarfs, ed. E. Martın (Cambridge: Cambridge Univ. Press), 345Seifahrt, A., Helling, C., Burgasser, A. J., et al. 2009, in AIP Conf. Ser. 1094,
ed. E. Stempels (Melville, NY: AIP), 283Simcoe, R. A., Burgasser, A. J., Bernstein, R. A., et al. 2008, Proc. SPIE, 7014,
70140U-1Simcoe, R. A., Burgasser, A. J., Bochanski, J. J., et al. 2010, Proc. SPIE, 7735,
773514Skrutskie, M. F., Cutri, R. M., Stiening, R., et al. 2006, AJ, 131, 1163Skrutskie, M. F., Jones, T., Hinz, P., et al. 2010, Proc. SPIE, 7735, 77353H-1Stephens, D. C., Leggett, S. K., Cushing, M. C., et al. 2009, ApJ, 702, 154Tokunaga, A. T., Simons, D. A., & Vacca, W. D. 2002, PASP, 114, 180van Dam, M. A., Bouchez, A. H., Le Mignant, D., et al. 2006, PASP, 118,
310Warren, S. G., & Brandt, R. E. 2008, J. Geophys. Res. (Atmos.), 113, D14220Warren, S. J., Mortlock, D. J., Leggett, S. K., et al. 2007, MNRAS, 381, 1400Weights, D. J., Lucas, P. W., Roche, P. F., Pinfield, D. J., & Riddick, F.
2009, MNRAS, 392, 817 (erratum)Werner, M. W., Roellig, T. L., Low, F. J., et al. 2004, ApJS, 154, 1Whitworth, A., Bate, M. R., Nordlund, Å., Reipurth, B., & Zinnecker, H. 2007,
in Protostars and Planets V, ed. B. Reipurth, D. Jewitt, & K. Keil (Tucson,AZ: Univ. Arizona Press), 459
Whitworth, A. P., & Stamatellos, D. 2006, A&A, 458, 817Wilson, J. C., Eikenberry, S. S., Henderson, C. P., et al. 2003, Proc. SPIE, 4841,
451Wizinowich, P. L., Le Mignant, D., Bouchez, A. H., et al. 2006, PASP, 118,
297Wright, E. L., Eisenhardt, P. R. M., Mainzer, A. K., et al. 2010, AJ, 140,
1868York, D. G., Adelman, J., Anderson, J. E., Jr., et al. 2000, AJ, 120, 1579Yurchenko, S. N., Barber, R. J., & Tennyson, J. 2011, MNRAS, 413, 1828
17