Embed Size (px)
Citation preview

The Digital Divide: The Role of Political Institutions in Technology Diffusion.
Helen V. Milner Columbia University [email protected]
v. 4.0 September 24, 2004 Abstract: What factors have promoted and retarded the spread of the internet globally? The internet is one example of the diffusion and adoption of technology generally. Much as other technologies, the internet has diffused unevenly across countries. This uneven spread has raised concerns over an increasing “digital divide”. The main proposition here is that its spread has been driven by neither technological nor purely economic factors alone. Rather political factors, especially the type of domestic institutions, exert a powerful influence. Groups that believe they will lose from the internet try to use political institutions to enact policies that block the spread of the internet. Some political institutions make this easier to do than others. Data from roughly 190 countries over the past decade (1991-2001) show that a country’s regime type matters greatly, even when controlling for other economic, technological, political and sociological factors. Democratic governments facilitate the spread of the internet relative to autocratic ones. Thus the spread of democracy may help reduce the digital divide. Prepared for the 2003 APSA conference, Philadelphia, PA, August 28 -31, 2003. I would like to thank Susan Hanson, John Bargh, Robert Keohane, Tom Kenyon, Ed Mansfield, Katelyn McKenna, Rob Trager, and Qiang Zhou for their help in facilitating my research on this topic. I would also like to thank the Center for Advanced Studies in the Behavioral Sciences at Stanford, Ca, for supporting this research.

“This gap between rich and poor is also mirrored in the new information economy. A digital divide — the name given to the disparity in information resources — is emerging between North and South. Industrialized economies are moving towards greater dependence on and access to increasingly sophisticated information technologies. Yet more than one-half of humanity has never used a telephone, and there are more telephones [in] Montréal than in all of Bangladesh.” http://www.acdi-ida.gc.ca/INET/IMAGES.NSF/vLUImages/Publications2/$file/rpp2002-2003_e.pdf. Canadian International Development Agency, Annual Report 2002-3. p. 10.
I. INTRODUCTION.
What factors that have promoted and retarded the spread of the internet globally?
The internet is one example of the diffusion and adoption of new technology. As a means
for spreading information at very low cost, however, the internet may have a wider
impact than some prior forms of communications technology. It is an important element
of the current globalization process that is linking countries ever more tightly to a single
global economy. Many scholars, as the quote above exemplifies, worry that its uneven
spread is exacerbating the “digital divide” between the rich and poor. As Franda (2002:
11) notes, “The introduction of the internet has not made any part of the world
poorer…But the internet is contributing to a widening of the gap between the better-off
and worse-off parts of the world because it has enabled some nations to create new
sources of wealth and of international diplomatic and political power relative to others.”
The diffusion of technological innovations is a topic of great importance.
Scholars now believe that economic growth is propelled largely by technological change
(e.g., Parente and Prescott 2000). Countries hoping to develop must innovate or adopt
new technologies that increase productivity. Factors that influence the adoption rate of
new technologies are therefore of critical importance for economic development (Mokyr
1990; Hall and Jones 1999: Parente and Prescott 2000; Acemoglu and Robinson 2000 &
1
2002). Basically, some countries exploit the latest and most efficient technologies and
production processes and experience very rapid growth, while others countries fail to do
so and lag far behind. Some scholars attribute the rise of the West to its superior ability to
innovate and adopt new technologies (e.g., Diamond 1997). Today the widening gap
between the rich and poor countries is often attributed to faster rates of growth in the
richest countries, driven in part by their willingness to adopt innovations rapidly (e.g.,
Landes 1998). Thus understanding what variables affect the rate of adoption of new
technologies, like the internet, is of great importance.
Since the world stock of knowledge is capable of use by all countries, and since
differences in human and physical capital do not seem to account for differences in the
adoption of technology, scholars have turned to other factors. Primary among these have
been political factors, such as the role of institutions, ruling elites and public policy.
Some scholars now claim that the rate of adoption of technology depends heavily on the
political environment and the preferences of those in power (e.g., North and Thomas
1973; North 1990; Acemoglu and Robinson 2000 & 2002). Some institutional
environments allow governments and ruling elites who so desire to foster technological
change; others slow it down or derail it completely. Political obstacles, not economic
ones, are now seen as the central cause of differential rates of technological change and
hence of economic growth.1
This paper seeks to explain the distribution of the internet across space and time.
Much as other technologies, the internet has diffused unevenly across countries. My
1 . Acemoglu and Robinson (2000: 126) propose the “political loser” hypothesis. They claim that the effect of technological changes on the political power of groups is key in predicting whether such innovations will be adopted. Those groups whose political power (and not their economic rents) is hurt by technological change will block innovations. Their main point is that one should focus on the nature of political institutions to understand the sources of technological backwardness.
2

main proposition is that the pattern of internet adoption among countries has been driven
neither by technological forces nor by purely economic ones. Rather political factors,
especially the nature of domestic institutions, exert a powerful influence. Groups that
believe they will lose from the internet try to use political institutions to enact policies
that block the spread of the internet. These “losers” hope to slow down or stop its
diffusion, and some institutions make this easier to do than others.
Political institutions matter for the adoption of new technologies because they
affect the manner and degree to which winners and losers from the technology can
translate their preferences into influence. In particular, countries that are democratic are
more likely to adopt at faster rates than are non-democracies. The ruling group in
autocracies will tend to see the disadvantages of the internet as outweighing its
advantages. Because they have non-democratic institutions, it will also be easier for them
to slow down its spread. Autocratic governments then will have both greater interests in
and more ability to impede the adoption of technologies, such as the internet. Regime
type is thus a major factor explaining the digital divide.
This paper has 5 sections. After the introductory section, I present data showing
that the adoption of the internet has varied greatly among countries. I present data that
demonstrate the democratic advantage in internet adoption. The next section discusses
why regime type influences how new technologies are treated by countries and suggests
why it matters a great deal. The fourth section presents a quantitative analysis of 184
countries from 1991-2000 of the spread of the internet. The main finding is that regime
type, in particular democracy, promotes the adoption of new technologies, or at least that
autocracies tend to slow it down. The fifth section concludes.
3

II. ARE DEMOCRACIES DIFFERENT?
The rate of adoption of the internet has varied considerably among countries. For
instance, in 2000, almost a decade after the internet became a publicly-known
technology, Iceland led the world in the percentage of its population using the internet;
close to 60% were users.2 In the next group of heavy users were Norway, Sweden, the
US, and Canada with more than 40% using it. Some rich and technologically adept
countries like Germany and Japan had just less than 30% of their population online, or
half of Finland’s rate. Very rich countries like France and Spain had only 14% of their
populations as internet users. Other well-off countries had even fewer users: Saudi Arabia
had less than 1% of its population online; Russia, less than 2%; and Greece, less than
10%. In fact, by 2000, 73 countries out of 184 for which we have data (about 40% of the
world) had less than 1% of their populations online. What accounts for this variation in
the adoption of an important new technology?
A country’s regime type seems at first glance to have a salient impact. Among
countries coded as democratic, the average percentage of the population that was an
internet user in 2000 was 12%.3 The same figure for autocracies was only 2%. For the
number of internet hosts per 10,000 inhabitants, democracies on average in 2000 had 211,
while autocracies had 10. Figure 1 shows this relationship for the entire decade (the
figures all use per 10,000 inhabitants); it is always the case that democracies have a
2 . For a complete discussion of data sources, see the description in the empirical section. 3 . Countries were coded as democratic if they scored at or above a 6 on the POLITY scale; otherwise they were autocratic. The POLITY scale combines the scores for democratic and nondemocratic scales into a 21 point index ranging from -10 to 10.
4

greater percentage of users and hosts than autocracies. This advantage escalates over
time as well.
[INSERT FIGURE 1a, b HERE]
Because democracy and level of development are closely related (r=.43), one
might interpret this as a function of the fact that democracies are richer. But if one
controls for level of income, the same results arise. Figure 2a shows that in countries that
the World Bank classifies as low income, democracies on average have more users per
capita than do autocracies; in 2000 for instance, poor democracies averaged 0.5% of their
population as users, while for poor autocracies only 0.3% were users. In figure 2b one
sees that with respect to the number of hosts per capita, the differences are much smaller.
For the poorest countries buying the equipment to support internet hosts is going to pose
the biggest constraint, and thus one might expect the least difference here. In figure 3 the
data reveals that for middle income countries the same result holds: democracies have
more people online than autocracies. In 2000, middle income democracies had 6% of
their populations online, and autocracies had only 2%. In terms of hosts, democracies
had 45 per 10,000 inhabitants and autocrats had a mere 3 in 2000.
The data for high income countries during the 1990s is presented in figure 4. The
rich democracies outscore the rich autocracies in internet users and hosts. In 2000 for
example, nearly 30% of rich democracies’ populations were online, while in rich
autocracies this figure was only 17%. Rich democracies also had more hosts per capita
than did rich autocracies (602 per 10,000 versus 143). At all levels of development,
democracies have more users per capita than do autocracies, and at all levels but the
5

poorest they have an advantage in hosts as well. In nearly every case, this democratic
advantage was growing over time as well.
[INSERT FIGURES 2-4a, b HERE]
III. WHY ARE DEMOCRACIES MORE LIKELY TO ADOPT THE INTERNET?
As with any technology, its successful adoption is likely to depend on the
underlying political order. The laws, regulations, subsidies, and taxes that governments
choose to employ or not may substantially affect whether actors invest in the new
technology, as North (1990) among others has argued. Political and economic groups that
lose from the spread of the internet may also try to retard its diffusion through such
political means (e.g., Acemoglu and Robinson 2000). They may seek to use the
country’s political institutions to enact policies that do this. Some institutions may be
more susceptible to such purposes than others.
Some have claimed that autocratic governments are more opposed to and
restrictive of the internet. Goodman et al. (1998:243) conclude from their study of 13
countries that “It appears clear at this point in the studies that government policy plays a
key role in the diffusion of the Internet. A general rule that has emerged is that stronger
centralized control results in slower Internet development and less proliferation. This is
likely due to the fact that the strength of government control is somewhat inversely
proportional to popular participation in and support of the government.”
In contrast, other scholars suggest that the internet will be much more benign and
leaders capable of greater control over it. They imply that authoritarian governments
may not desire to impede the growth of the net. Chase and Mulvenon (2002: 87-89), for
6

example, point out that China has been very successful in preventing the net from
influencing politics and that the government has used the internet to blanket the country
with its official propaganda and bolster its political control. Kalathil and Boas (2002:
137) likewise argue that “states still call the shots.” They conclude their study of eight
authoritarian governments by noting that “the state plays a crucial role in charting the
development of the internet in authoritarian regimes and in conditioning the ways it is
used by societal, economic and political actors. Through proactive policies …
authoritarian regimes can guide the development of the internet so that it serves state-
defined goals and priorities. This may extend the reach of the state in significant ways”
(2002: 136). They see little to indicate that authoritarian governments should fear the
internet and a great deal of evidence that they are going to promote it, for their own
purposes of course. Hence it is not clear cut that non-democratic regimes will oppose the
internet.
Many have argued about whether the internet will have a democratizing effect
(e.g., Norris 2001; Kalathil and Boas 2003), but few have systematically examined
whether a country’ regime type affects its rate of internet adoption. Among the extant
studies, a number of them do not find clear cut evidence for the impact of regime type.
Kedzie (1997), examining data on email usage from 1993, shows that a strong correlation
exists between country’s rankings on their levels of interconnectivity and Freedom House
measures of political and civil liberties. He disavows any causal claim about whether
democracy promotes the internet or vice versa, however. Norris (2001: 62) again shows
that in a simple OLS regression on cross section of countries in 2000 democracy has a
significant effect on the percent of the population online. She, however, attributes most
7

of its impact to economic development levels, rather than political institutions. Later she
shows that the impact of democracy fades into insignificance when other socio-economic
factors are introduced (2001: 63). Oxley and Yeung (2001) again in a cross section on
internet hosts per capita demonstrate that the rule of law as measured by La Porta et al.
(1997) has a positive effect; it seems to have none for internet users, however. Finally,
Guillen and Suarez (2001) show that Polity’s democracy score predicts higher levels of
internet users and hosts in a cross section of countries.
This study attempts to move this research agenda on regime type and technology
diffusion forward. I first explore the theoretical linkages between regime type and
internet development and second provide different statistical models than used in earlier
studies by adding a time series dimension, using better measures of democracy, and
employing more appropriate statistical methods. This study then attempts to provide a
stronger test of the linkages between domestic regime type and technological change.
In what ways might regime type matter for choices about adopting the internet?
What differentiates democracies from autocracies in their adoption of new technologies?
All technological change creates groups who gain and lose from the change: its winners
and losers. The type of political institutions in place may allow the losers to block or
slow down its adoption or they may enable winners from its adoption to promote it.
Governments and groups who support them if they lose from the spread of the internet
may try to use political institutions to slow down its diffusion. Political actors need to
possess both the desire and capacity to block or promote technological change.
Autocratic governments, I claim, are more likely to possess both than are democratic
ones. This argument is different from those that focus on the way in which democracy
8
enhances human capital and public goods provision (e.g., Lake and Baum 2001; Baum
and Lake 2003; Bueno de Mesquita et al. 2003).
The central goal for both autocratic and democratic governments is staying in
office, which --much evidence has shown-- depends on the state of the economy.
Leaders must pay keen attention to the economy for their survival; they certainly must
pay attention to the economic fortunes of the groups that are their major supporters. But
democratic governments tend to be more sensitive to economic failure and its consequent
political failure (e.g., Bueno de Mesquita and Siverson 1995). This heightens their
concern for economic growth and in turn enhances their desire to promote, or at least not
block, technological change that portends faster economic growth. Autocrats, who tend
to survive longer and be less sensitive to economic problems, can fail to promote or even
block technological change that threatens them or their supporters. Below I detail some of
the many ways in which autocratic governments have gone about squelching the internet.
A consequence of these policies is lower internet use and slower internet adoption.
On average, autocratic governments should be more likely to prefer and be better
able than democratic ones to prevent the spread of the internet. Autocratic regimes may
create environments that hinder the growth of the internet since it allows the freer flow of
information. They should be better able than democratic leaders to determine the supply
of the internet and other communications infrastructure. As Goodman et al. (1998: 23-4)
claim, “To the extent that it provides an additional communications medium, the Internet
can be seen as a threat to coercive control, whether internal or external. In its most basic
form, it is merely another means of sharing information. However, the robust nature of
the international network and the fact that it is a store-and-forward medium
9

(asynchronous) presents unique problems to [national] security services.” This suggests
that autocratic governments will desire to regulate the internet closely and perhaps restrict
its diffusion, if not just its content. As one report on internet freedom notes, “45
countries now restrict Internet access on the pretext of protecting the public from
subversive ideas or violation of national security—code words used by censors since the
sixteenth century” (Sussman 2000: 1); they are all autocracies.
Autocratic leaders are caught in a dilemma, however. They face contradictory
pressures regarding technological innovation and the internet in particular. Their
country’s economic growth rate, and thus their legitimacy, may depend upon such
innovations, but they may also undermine a regime’s control capabilities. For example,
“China faces a very modern paradox. The regime seems to believe that the Internet is a
key engine of the new Economy… and that future economic growth in China will depend
in large measure on the extent to which the country is integrates with the global
information infrastructure. Economic growth is directly linked to social stability of the
Beijing leadership, maintenance of prosperity has become the linchpin of regime
legitimacy and survival… Chinese leaders view the development of information
technology, particularly the internet, in China as an indispensable element of their quest
for recognition as a great power. In the words of a recent People’s Daily article, ‘the
degree of development of information networking technology has become an important
yardstick for measuring a country’s modernization level and its comprehensive national
strength. …At the same time, however, China is still an authoritarian, single party state
with a regime whole continued rule relies on the suppression of antiregime activities.
The installation of an advanced telecommunications infrastructure to facilitate economic
10

reform greatly challenges the state’s pursuit of internal security. … Faced with these
contradictory forces of openness and control, China has sought to strike a balance
between the information-related needs of economic modernization and the security
requirements of internal stability” (Chase and Mulvenon 2002: 45-6).
In general, there are a variety of ways in which governments can delay or prevent
the spread of the internet. Most of these require an authoritarian government that desires
and is able to limit political and civil rights. The eight main ways that a regime can
“squelch the net” provide an interesting inventory of such governmental practices (Wired,
August 2003: 31).
1. Firewalls. Governments employ proxy servers—that is, computers that act as
intermediaries between the global internet and domestic users on private networks— to
scan email for “offensive” or prohibited content and to review all web traffic by checking
URLs against a constantly updated blacklist. For instance, in the late 1990s a number of
Middle Eastern countries, such as Saudi Arabia, UAE, and Yemen, used a firewall that
monitored their few access points to the global internet (Franda 2002; Kalahtil and Boas
2003).
2. Routers. Firewalls will not work well once a country has a high volume of web traffic
or where multiple ISPs have established many servers that can access the global net.
China, for example, would need thousands of proxy servers to monitor all incoming and
outgoing web traffic. The approach of countries in this position is to force the ISPs to
monitor the web for them. Routers capable of blocking offending IP addresses and even
filtering content must be installed by ISPs.
11

3. Software filters. Censorship can be imposed by using software to filter all email and
web traffic. Governments can use their proxy servers or can force their ISPs to install
software filters that comb the email and web traffic of their users. Some filters block
entire banned sites; others use keywords or messages with offensive terms to stop email
or prevent access to a URL. Singapore, among other tactics, had made extensive use of
such filters, as do many Moslem countries (Guillen and Suarez. 2001: 357-60).
4. Internet police. They conduct surveillance on users and act as informants. Wired notes
that China has 30,000 email police who enforce a bevy of net-related laws and monitor
messages.
5. Coercion. Governments often employ “self-regulatory measures,” in particular those
aimed at ISPs. In 2002, for instance as the Wired article notes, , China required all ISPs
and media to sign “Public Pledge on Self-Discipline for the Chinese Internet Industry,”
which forced all ISPs to agree to abide by all laws and regulations regarding he internet
or be punished; failure to sign resulted in being blacklisted or losing one’s access. In
many other countries as well, including Singapore and most of the Middle East, these
types of policies have forced ISPs to self censor, thus relieving the government of this
direct role (Kalathil and Boas 2003). Its inhibitory effect on use and content is well
known.
6. Restricted access. Many countries force all users to register with their ISP or
governmental authority. Users then know that the government can track them down, and
are often inhibited in their behavior. Moreover, some countries restrict access to
institutions and prevent individuals from gaining entrée. They hope that by permitting
access only in group situations, users will be deterred from prohibited behavior since
12

others can more easily monitor them. Cuba, for example, limits web access very severely;
a few public institutions are granted permission (Kalathil and Boas 2003: chap. 3). Its
objectives are “not the greatest freedom for market actors” but rather “limited and
managed access subject to resource constraints and the imperative of information
control” (Seror and Arteaga. 2000: 214). This policy means Cuba has less than 1% of its
population with email accounts and only half of that with connections to the global web
as of 2000 (Kalathil and Boas 2003: 44, 53).
7. High access prices. Three sets of costs matter for users: the prices of local telephone
calls for making an ISP connection, the prices users pay ISPs for access to the net, and
the prices for ISPs to lease local lines. High prices make access unaffordable to the vast
majority in a country. While more manipulable in non-democratic countries,
democracies can and do affect these costs. An autocratic country, like Jordan, uses high
taxes and instructs its telecommunications monopoly to keep the cost of the net very
high, so that fewer than 30,000 Jordanians were on line around 2000. Argentina, a much
more democratic country, however, faced the same problem. In the early and mid 1990s,
Argentina had a state-controlled monopoly on telecommunications, very high prices for
leased lines, and very high prices for telephone calls. Among its regional peers, it was last
in internet penetration. In the late 1990s, however, the government changed policies,
reducing all prices related to the internet. By 2001, then Argentina had raced ahead of its
regional peers, leading in internet penetration (Petrazzini and Guerrero 2000).
8. National Intranet. Another method is to develop a national intranet that is controlled
solely by the government and that limits all contact with the global web. China has been
trying to wall itself off from international cyberspace and develop an intranet for Chinese
13

speakers governed by the authorities using the Chinese language only; this system is
called the “169 network” (Franda 2002: 198).
Governments thus have an assortment of policies that they can employ to hinder
the spread of the internet. Some types of governments will be more able to use these
policies than others. Most democratic governments, for instance, could not employ
many of these strategies without violating basic civil and political rights and hence facing
enormous public resistance. Elected leaders trying to adopt these policies would face near
certain eviction from office and probably legislative and judicial pressure to desist.
Democratic governments can thus credibly commit to not adopting many of these
policies, leaving private actors more willing to invest in and spread new technologies.
Autocratic governments, on the other hand, seem perfectly capable of most of
these policies. They thus have tools for impeding the growth of the internet that
democratic countries do not. Moreover, autocracies have fewer ways to credibly commit
to not adopting such policies now or in the future (Wintrobe 1998: 25-27). Hence in
addition to the stultifying effect these policies have on technological change, they also
face the problem of getting private actors to invest in and spread new technologies. Thus
I argue that on average autocratic countries are likely to have less penetration by the
internet as a result of their greater desire to squelch it, their superior ability to do so, and
their lack of ability to commit not to do so. By motivation and capacity, democratic
governments will be less able to impede it.
14

IV. EMPIRICAL ANALYSIS.
Over time and space, what factors have caused the spread of the internet? In
particular, does a country’s regime type affect its adoption of internet technology? The
primary sources of evidence here will be the use of a database on the number of internet
hosts and users per capita among roughly 200 countries from 1991-2001.
The main data here is collected by the World Bank in its 2001 World
Development Report on the number of internet users (INTUSERS), which is taken from
the International Telecommunications Union (ITU, www.itu.org). INTUSERS measures
the number of people with access to the worldwide network; these are not just subscribers
to internet service providers (ISPs) nor are they actual users. I supplement the World
Bank data on users with data from the ITU for 2000 and 2001. This is normalized the
number by a country’s population, per 10,000 inhabitants. Second, I use the number of
internet hosts (HOSTS), or computers with active Internet Protocol (IP) addresses
connected to the internet, as collected by the Internet Software consortium (ISC,
www.isc.org). The ISC runs an electronic survey pinging all internet hosts on the web
globally to determine their domain names and numbers. The domain survey attempts to
discover every host on the Internet by doing a complete search of the Domain Name
System. (See the ISC website for an extensive discussion of the survey methodology and
its problems.) I normalize HOSTS by a country’s population, per 10,000 inhabitants.4
4 . A problem with using number of hosts is that it does not measure the number of users or the intensity of their use. Moreover, there are ambiguities connected with defining what a host is. Assigning each host to a country can be tricky. In this paper I follow others who use the simple rule that the two-letter ISO country code Top Level Domain identifies where the host is actually located, but this is not always the case. The data for the number of users is probably more reliable as a measure of internet adoption than is the number of hosts.
15

Summary statistics for all variables used in the cross sectional analysis are in table 1;
table 4 contains the summary measures for the time-series cross sectional (TSCS) data.
As a first cut, I examine the cross-sectional patterns of the spread of the internet.
The question is why by 2001 had some countries adopted it faster than others. Tables 2
and 3 present cross-sectional regressions showing the impact of regime type controlling
for many other variables. Cross sectional regressions allow us to compare the experiences
of countries over a longer period of time; they highlight the structural features of states
that make them more willing to adopt new technologies. The independent (RHS)
variables are measured as averages for each country from the period 1990-1999. The two
dependent variables are the number of HOSTS and INTUSERS (per capita) for 2001. In
other words, the RHS variables are effectively lagged. The cross-sectional regressions
pick up about 140 countries (out of a total of 238 countries, territories, dependencies,
etc.), but these tend to be the biggest countries that account for most of the world’s
people and its trade. The central question in this cross sectional analysis is what long-run,
structural factors make countries adopt the internet at faster rates than others.
I use a negative binomial regression to estimate these models. The dependent
variables are counts of hosts and of users per capita; they are always positive and in early
periods are often zero. As is well known, such count variables rarely assume a normal
distribution, and hence they tend to be better fitted by various maximum likelihood
estimators, such as the Poisson or negative binomial, which can handle nonlinear
functional forms better. I choose the latter since goodness of fit tests rejected the Poisson
model.5 The negative binomial is preferred to the Poisson when two key assumptions of
5 . The Poisson distribution has a special and restrictive assumption that the variance is equal to the mean. Often this condition is violated and then other models, such as the negative binomial, which assume only
16
the latter are likely to be violated: that events accumulating during the observation period
are independent and that they have a constant rate of occurrence (King 1989: 51). As
shown later, strategic interaction does seem to be occurring, and accelerating adoption at
times is prevalent. Both of these facts call into question the validity of Poisson models,
suggesting a preference for the negative binomial one.
These cross sectional regressions include controls for a country’s size (population
LNPOP), its level of development (GDP per capita), its urban density (percent living in
urban areas, URBAN), its war proneness (WAR), and its political institutions as the
baseline model. The first three of these are from World Bank WDI; the war variable is
complied from the Correlates of War and includes all types of wars, internal and external
(see http://cow2.la.psu.edu). Adoption of an innovation tends to be correlated with the
potential adopter’s wealth, education, and propensity for risk-taking (Morrill et. al. 1988:
52). Wealthier countries tend to have a greater demand for and supply of the new
technology. Urbanization also tends to matter, since urban centers are wealthier
generally. Earlier studies, for example, have shown that the diffusion of the television in
Poland predominated in the richest and the most urban parts of the country (Loboda
1974). Both Hargatti (1999) and Norris (2001) show that a country’s level of economic
development is critical for explaining its level of internet connectivity. The level of
violent conflict a country is experiencing may also matter for explaining the adoption of
new technologies. Countries involved in wars, whether international or civil, should be
less likely to adopt since their capital spending and investment and their attention are
that the variance is somehow proportional to the mean, are preferable. In all of the cross sectional regressions, the goodness of fit chi squared statistic implied that we could reject the null that the data are Poisson distributed at the 0.000 level.
17
diverted to winning the war and not adopting new civilian technology. These variables
are thus important controls.
I employ three measures of regime type for the sake of robustness. POLITY
refers to the Polity IV dataset measuring regime type on a scale from -10 for complete
autocracies to 10 for full democracies (Marshall and Jaggers 2001). This index
combines data on five factors that capture the institutional differences between
democracies and autocracies: 1.) the competitiveness of the process for selecting a
country’s chief executive, 2.) the openness of this process, 3.) the extent to which
institutional constraints limit a chief executive’s decision-making authority, 4.) the
competitiveness of political participation within a country, and 5.) the degree to which
binding rules govern political participation within it. Following Gurr et al. (1989) and
Jaggers and Gurr (1995), these data are used to create an 11-point index of each state’s
democratic characteristics (DEMOC) and an 11-point index of its autocratic
characteristics (AUTOC). The difference between these indices, POLITY = DEMOC -
AUTOC, yields a summary measure of regime type that takes on values ranging from -10
for a highly autocratic state to 10 for a highly democratic one.
I also use two other democracy indicators to show how robust the findings about
democracy are. ACLP is taken from Przeworski, Alvarez, Cheibub and Limongi (2000)
and measures regime type as a dichotomous variable, with democracy=1 and 0,
otherwise. This measure codes a regime as democratic if and only if high political offices
are chosen through fair and free contested elections where alternation of leaders occurs.
POLRITES is a measure of political liberties taken from Freedom House (2000); it
ranges from 1 to 7, with 7 being the least democratic. To code the political rights
18
variable, Freedom House considers to what extent the system offers voters the
opportunity to choose freely from among candidates in competitive elections and to what
extent the candidates are chosen independently of the state. In countries where the
military, the monarchy, or an unelected dictator retains a significant political role over
elected leaders, these are also coded as undemocratic. Note that this variable runs
opposite the other two: higher number of POLRITES indicate less democracy, and thus
we expect a negative sign here. These three measures then comprise a wide variety of
meanings and codings for democracy.
I also examine the impact of other variables. The extent of civil liberties may also
matter; more freedom of the press, association, religion, etc. may all encourage the
development of internet activity. It is important to separate out the impact of political
institutions from civil liberties, even though the two are closely related. These two
factors could have quite different causal mechanisms. To distinguish regime type from a
country’s press freedom, I include a variable that measures such freedoms, but that does
not measure regime type. Van Belle (1997) employs this variable to distinguish among
presses that are free from government intervention and competitive (PF=1) and those that
are highly censored or run by the government (PF=5). (As expected, it is significantly
related to the democracy variables, correlated at -0.6 with POLITY).
Other control variables must be included as well. The fraction of the population
that speaks English (ENGFRAC from Hall and Jones 1999) might be important since the
internet is mostly in English, although this is declining. Government policy toward the
telecommunications sector can affect the internet’s spread greatly. Policies regarding
government control over and intervention in telecommunications sector, as well as
19

licensing, taxation, subsidization, foreign investment, access control, infrastructure
investment, and standards setting in this sector are of particular importance. Different
governments will make different choices about these policies, and in doing so will affect
the rate of internet adoption (e.g., Petrazzini and Guerrero 2000; Franda 2002; Kogut
2003). In particular, the extent of privatization of the telecommunications industry may
matter. I include a variable here for the period of time in the 1990s over which a
country’s telecommunications systems was privatized. More privatization should lead to
greater internet use as prices fall and competition rises. Some have argued that the type of
legal system matters for economic growth and technological change (LaPorta, et. al.
1997). I examine the impact of the country’s legal system as well using the currently
available classification of systems into ones with British-like origins and French-like
ones (LEG_ENG, LEG_FR). Since the British one was never significant, it was dropped.
The spread of technology often relies on the transmission of information about the
new technology and as such tends to follow existing social lines of communication (e.g.,
Rogers 1995; Dekimpe, Parker and Sarvary 1998 & 2000). Scholars have shown that
these lines tend to connect similar groups within countries. Information spreads less
quickly when groups are dissimilar, especially in terms of language and culture. Hence
many have noted that ethnic heterogeneity is a major obstacle to such transmission (e.g.,
Dekimpe, Parker and Sarvary 1998 & 2000). I look at a variety of indicators for social
homogeneity. The extent of ethnic fractionalization (ETHFRAC), of religious diversity
(% of largest religious group in country), and of particular religious groups (Catholics,
Protestants, and Moslems) in the population are explored.
20
Economic competition among countries can serve as a mechanism of diffusion
and thus help explain global internet adoption patterns. The internet may provide
important economic advantages. Scholars (e.g., Freund and Weinhold 2000) have shown
that it increases trade flows, largely by reducing information and transaction costs. For
these reasons, countries may be forced by competitive pressures to imitate their neighbors
or rivals and adopt this technology. To control for this, I add a variable to capture the
impact of diffusion pressures from other countries. This (HOSTALL) measures the sum
of all other countries’ hosts or users per capita in 1999, excluding the country itself.
Tables 2 and 3 show that regime type matters significantly. For users in table 2,
all three measures of regime type are correctly signed and highly significant. More
democratic countries have far more users per capita, even holding many other factors
constant. The same result occurs for the number of internet hosts in a country. More
hosts are a function of more democratic governments. This variable also seems to have a
substantial effect on the spread. An increase in democracy by unit on the POLITY scale
leads to a 5% rise in the number of internet users per capita, using equation 2 in table 2.
A one unit rise in POLITY leads to a 12% increase in the number of hosts per 10,000
inhabitants, using equation 2 in table 3.
Many of the other variables are related as one would expect. More developed
countries (i.e., ones with higher GDP per capita) generally have more users and hosts.
Countries that are more urbanized have more users and hosts. Urbanization is highly
correlated with level of development (r=.60) and with levels of education (r=.74),
indicating at least two distinct paths for its influence. In addition, research on diffusion
sees cities as dense environments filled with risk-taking “change agents”, which may be
21
another reason why they promote technologic change. The percentage of time a country
is engaged in civil or international war also plays a role. Certainly, for the number of
hosts conflict seems to impede their spread. The percent of the population that speaks
English has either no impact or an unexpected one.
The policy variables also seem to play a role. The nature of a country’s legal
system, especially if it had French origins, tends to make it unfavorable to technological
change. Privatization of the telecommunications industry matters as well. The longer
countries had had privatized networks, the more hosts and users of the internet they had.
Press freedom also is important. Greater freedom had a significant impact mostly on the
number of users in a country, even holding regime type constant. More press freedom
probably implies more interesting and varied content on the web itself. But it is important
to note that regime type is still significant even when controlling for press freedom.
Finally, the percentage of users and hosts in the rest of the world is salient. But not as
one might expect. More users and hosts in the rest of the world in 1999 are correlated
with fewer users and hosts at home in 2001.
I also looked at a variety of cultural and political factors. Using the equations in
tables 2 and 3 as a baseline, they were never significant when added to these. In terms of
political variables, I examined Henisz’s political constraints (POLCON) index, indicating
the extent of veto players in a country. It does not play an important role in the adoption
of this technology. In terms of cultural factors, I examined the percent of the population
from the largest religious group, percent Moslem, percent Catholic, percent Protestant,
and whether the country had been a British colony (all from ACLP). When these
variables were added singly or sequentially, they were never near statistical significance.
22

This may be partly because some of them reduced the sample by half to two-thirds
(N=60). Finally, the measure of the existing telecommunications infrastructure, the
number of telephone lines per capita (PHONES), was introduced and was significant.
But it caused serious collinearity problems with GDP per capita (r=.88), and made the
measure of level of development negative. I then ran equation 2 in table 2 and 3 dropping
GDP per capita and using the telephone lines instead. It was significant but had no
impact on the regime variables. Since it was also highly correlated with the regime
variables, I choose to include GDP per capita in the tables. But controlling for the
existing telecommunications infrastructure had no real impact on the regime type results.
As a check for endogenity, I regressed the number of users and hosts averaged
over the decade on the last values of regime type. Using variables from the equations
from tables 2 and 3 plus other well-known ones, I checked to see if more internet hosts or
users led to more democracy. I averaged the number of hosts for each country from 1990-
99 and then used the 1999 value of regime type to test this. Neither the hosts variable nor
the user one was ever a significant predictor of democracy. Given the short span of time
of the internet, I would not expect it to affect a country’s regime type. However, given
more time and greater penetration, the internet may well generate great pressures for
democratization. As they say, time will tell.
Exploring the cross sectional evidence is useful since it allows us to examine the
impact of slowly changing variables (structural ones) that differentiate among countries.
However, a more thorough investigation requires a time series cross sectional analysis
(TSCS); by adding a time series element, one is better able to make claims about
causality. To do this, I use negative binomial regressions, in particular conditional, fixed
23

effects, overdispersion models. All RHS variables are lagged one period. The inclusion
of country fixed effects has a similar effect to first differencing the data, except that the
differences are calculated from the country means. This means that the cross sectional
elements of the data are eliminated; the analysis is done on the longitudinal changes
within countries. Any variable that does not vary within a country over time is
eliminated from the analysis. Hence the TSCS analysis differs significantly from the
cross sectional one. All time invariant variables are excluded from this analysis. The
TSCS models then address the question of what drives a country’s pattern of adoption of
new technology over time.
Tables 5 and 6 present results from the TSCS analysis. The dependent variable in
table 5 is the number of internet users per 10,000 inhabitants. The main control variables
are the same ones as before: a country’s size (LNPOP), its level of development
(GDP_PC), its regime type (POLITY or ACLP or POLRITES), its urban density (%
URBAN), and a time trend. In addition, I examine in some models the state of the pre-
existing telecommunication infrastructure (proxied by the number of telephone lines per
capita), policy toward the telecommunications industry in general (as shown by its extent
of privatization), the role of American hegemony in internet technology (the percent of
global users or hosts that are American), and the extent of global diffusion of the
technology (the average number of users or hosts in the rest of the world).
The two new variables are the telecommunications infrastructure and American
hegemony. Past innovations and how successfully they were adopted may shape the
environment for future innovations. For instance, evidence exists that the distribution of
the internet may follow that of the existing communications infrastructure (e.g., Moss and
24

Townsend 1998 & 2000); hence, controlling for the telecommunications infrastructure is
important. Furthermore, the adoption of new technology is likely to depend on the
diffusion of that technology from the leading innovator. The US is clearly the leading
adopter and innovator of internet technology. Thus we expect that the more hegemonic
the US is, the more others will follow its lead. These variables provide controls for the
most important alternative explanations for the spread of the internet.
The results in table 5 for the number of users strongly support the regime type
argument. More democratic governments promote the faster spread of the internet. As
countries become more democratic, the number of users rises. This regime effect is true
for all three measures of democracy. The result is substantively important as well. A one
unit rise in democracy, holding all other variables at their mean in equation 3 in table 5,
leads to a 1.03 increase in the incidence rate of internet users in a country. The
democratic advantage endures even when controlling for many of the alternative factors
that drive technological change. All regressions in table 5 were also run with a lagged
dependent variable; the results for the regime variables did not change.
As in the cross sectional regressions, countries with higher per capita incomes and
those with more urbanization have more users. The population variable is always
positive and significant for the TSCS, while it is not so for the cross section. Bigger
countries foster more internet users. And as in the cross sections, the existing
telecommunications infrastructure (telephone lines per capita) has a positive effect.
Oddly, while privatization was beneficial for adoption in the cross sections, here it is not.
Changing to a privatized system lowers the number of users. American dominance of the
internet lowers the number of users elsewhere, but this may reflect the fact that US
25

dominance has been declining over the 1990s and the number of users elsewhere has
been rising. Indeed, the time trend variable had to be dropped from this equation since it
was correlated extremely highly with this measure of US hegemony (r=.90). Finally,
unlike in the cross section, the global diffusion variable is positive and significant. More
users elsewhere promote more users at home. War was never significant.
Table 6 reveals that regime type plays an important role in influencing the number
of hosts per capita as well. More democratic countries have more hosts per inhabitant.
This result is true using any of the three democracy measures. Regime type has an
important effect. A one unit increase in democracy, holding all the variables at their
means in equation 3 in table 6, leads to a 1.03 increase in the incidence rate of internet
hosts per capita. This result holds up despite the inclusion of a wide variety of controls.
The regressions in table 6 were also conducted using a lagged dependent variable; the
results for the regime variable did not change.
As with the number of users, larger countries also have more hosts. Urbanization
has a weaker but still positive effect. A country’s development level is now negatively,
but more weakly, related. The existing telecommunications infrastructure has a positive
effect, as before. Other research indicates that a central element necessary for the internet
is a high urban population and an extensive telecommunications network ( e.g., Kiiski
and Pohjola 2002; Goolsbee and Klenow 1999). And indeed both the percentage of
residents living in urban areas and the number of telephone lines per capita are strongly
positive factors. Privatization had no durable impact, nor did conflict. American
dominance of the internet now has a positive effect, rather than the negative one on users.
Finally, global diffusion pressures promote internet development, as they did the number
26

of users. After controlling for all of these influences, a country’s regime type still
matters.
V. CONCLUSIONS.
This paper investigates the factors that explain the geographic and temporal
spread of the internet. As an example of a new technology, the internet seems to be
following well-known patterns. Its s-shaped diffusion process and economic determinants
are not surprising. But it is also clear that political factors matter. The internet is being
adopted at very different rates by different countries. Given that the technology is widely
known and has large benefits, why have some countries not adopted as fast as others?
Much as earlier literature on the New Institutional Economics has stressed the
importance of political institutions for economic growth, my argument is that political
institutions play a large role in determining the spread of the internet. Regime type is
particularly important. Democracies adopt the internet at a much faster pace than do
autocracies. This result stands using various definitions of democracy and controlling for
a large number of well-known alternative explanations.
All technological change creates groups who gain and lose from the change: its
winners and losers. The political institutions in place affect the ability of losers to block
or slow down its adoption, or they can enable winners to promote it. Governments have
to capacity to affect the rate of technological change by making policies that shape the
costs and benefits of its use, thus affecting both demand and supply for the technology.
These policies can range over a wide gamut. Some institutions allow governments to
block technological adoption by instituting such policies more easily than others. But
27
governments must possess both the desire and capacity to block technological change.
The claim is that both autocratic and democratic governments need to worry about
staying in office and hence rely upon the state of the economy at least in part for their
survival. But democratic governments, which are more sensitive to economic failure and
its consequent political fallout, will desire to promote, or at least not block, technological
change that accelerates economic growth. Autocrats, who tend to survive longer and be
less sensitive to economic problems, can fail to promote or even block technological
change that threatens them or their supporters.
Above I detail the many ways in which autocratic governments have squelched
the internet. The consequences of these policies are lower internet use and slower
internet adoption. This finding has two important implications: this behavior by
autocracies lessens the integration of these countries into the world economy, and it slows
down their economic development. It thus facilitates the prolongation, and perhaps
deepening, of the “digital divide.” Political institutions and changes in them can affect the
extent of the digital divide. In turn, the rate of technology adoption affects economic
development. Hence this research underscores that regime type can indirectly affect
economic growth, with autocratic institutions tending to impede technological change
and thus growth.
This paper only examines the broadest type of political institutions. It would be
interesting to investigate the impact of different types of political institutions, especially
those more narrowly drawn than regime type. For example, it would be interesting to see
if characteristics like the degree of federalism, bicameralism, the number of parties, or the
type of autocracy matter. In addition, could partisanship matter? Are left or right
28

governments more supportive of the spread of a new technology? In general, can one
better specify the political factors that foster technological change?
The adoption of technology, in this case of the internet, has a clear political
component. Both international and domestic political factors can affect its spread. One
cannot explain the growth of the internet, and perhaps of any other new technology,
without considering such political variables. Political institutions matter for overcoming
the digital divide. Democracy may indirectly spur economic growth through its salutary
effect on technological change. The spread of democracy around the globe may thus help
reduce the digital divide and indirectly accelerate economic development.
29
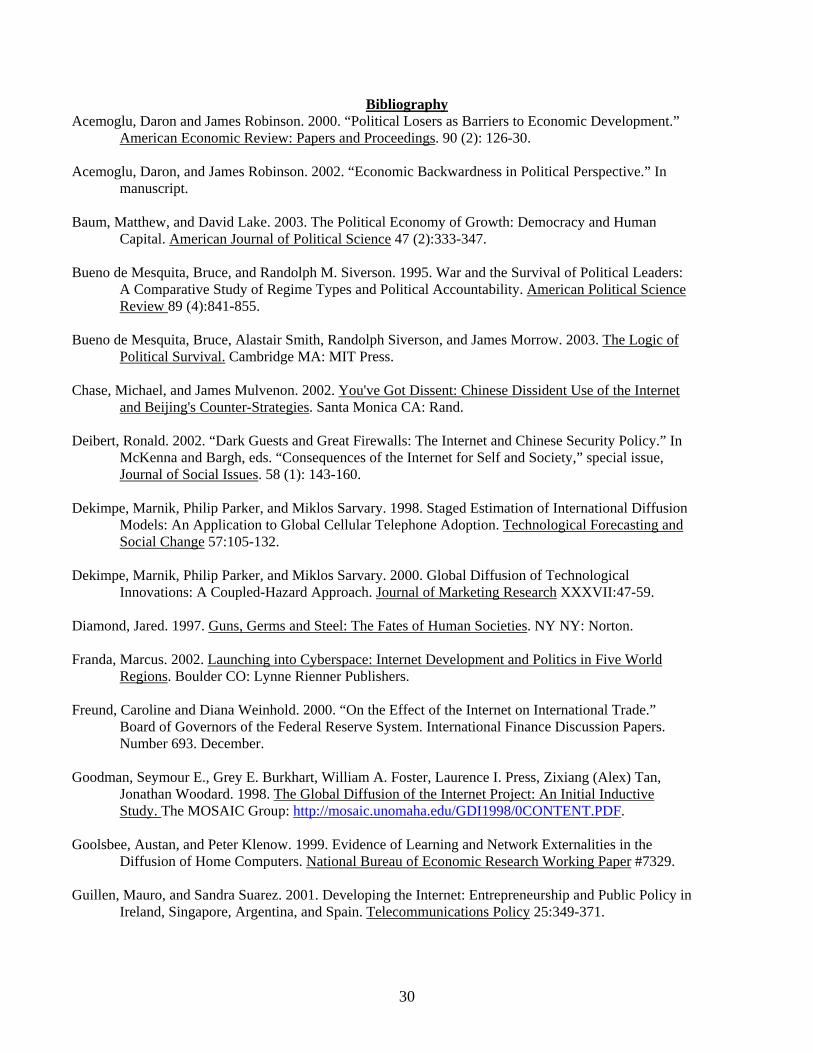
Bibliography Acemoglu, Daron and James Robinson. 2000. “Political Losers as Barriers to Economic Development.”
American Economic Review: Papers and Proceedings. 90 (2): 126-30. Acemoglu, Daron, and James Robinson. 2002. “Economic Backwardness in Political Perspective.” In
manuscript. Baum, Matthew, and David Lake. 2003. The Political Economy of Growth: Democracy and Human
Capital. American Journal of Political Science 47 (2):333-347. Bueno de Mesquita, Bruce, and Randolph M. Siverson. 1995. War and the Survival of Political Leaders:
A Comparative Study of Regime Types and Political Accountability. American Political Science Review 89 (4):841-855.
Bueno de Mesquita, Bruce, Alastair Smith, Randolph Siverson, and James Morrow. 2003. The Logic of
Political Survival. Cambridge MA: MIT Press. Chase, Michael, and James Mulvenon. 2002. You've Got Dissent: Chinese Dissident Use of the Internet
and Beijing's Counter-Strategies. Santa Monica CA: Rand. Deibert, Ronald. 2002. “Dark Guests and Great Firewalls: The Internet and Chinese Security Policy.” In
McKenna and Bargh, eds. “Consequences of the Internet for Self and Society,” special issue, Journal of Social Issues. 58 (1): 143-160.
Dekimpe, Marnik, Philip Parker, and Miklos Sarvary. 1998. Staged Estimation of International Diffusion
Models: An Application to Global Cellular Telephone Adoption. Technological Forecasting and Social Change 57:105-132.
Dekimpe, Marnik, Philip Parker, and Miklos Sarvary. 2000. Global Diffusion of Technological
Innovations: A Coupled-Hazard Approach. Journal of Marketing Research XXXVII:47-59. Diamond, Jared. 1997. Guns, Germs and Steel: The Fates of Human Societies. NY NY: Norton. Franda, Marcus. 2002. Launching into Cyberspace: Internet Development and Politics in Five World
Regions. Boulder CO: Lynne Rienner Publishers. Freund, Caroline and Diana Weinhold. 2000. “On the Effect of the Internet on International Trade.”
Board of Governors of the Federal Reserve System. International Finance Discussion Papers. Number 693. December.
Goodman, Seymour E., Grey E. Burkhart, William A. Foster, Laurence I. Press, Zixiang (Alex) Tan,
Jonathan Woodard. 1998. The Global Diffusion of the Internet Project: An Initial Inductive Study. The MOSAIC Group: http://mosaic.unomaha.edu/GDI1998/0CONTENT.PDF.
Goolsbee, Austan, and Peter Klenow. 1999. Evidence of Learning and Network Externalities in the
Diffusion of Home Computers. National Bureau of Economic Research Working Paper #7329. Guillen, Mauro, and Sandra Suarez. 2001. Developing the Internet: Entrepreneurship and Public Policy in
Ireland, Singapore, Argentina, and Spain. Telecommunications Policy 25:349-371.
30

Hargattai, Eszter. 1999. Weaving the Western Web: Explaining Differences in Internet Connectivity among the OECD Countries. Telecommunications Policy 23 (10-11):701-718.
Henisz, Witold J., (2000) "The Institutional Environment for Economic Growth", Economics & Politics,
12(1):1-31. Kalathil, Shanthi, and Taylor Boas. 2003. Open Networks, Closed Regimes: The Impact of the Internet on
Authoritarian Rule. Washington, D.C.: Carnegie Endowment for International Peace. Kedzie, Christopher. 1997. Communication and Democracy: Coincident Revolutions and the Emergent
Dictator's Dilemma. Santa Monica CA: Rand. Kogut, Bruce, ed. 2003. The Global Internet Economy. Cambridge, MA: MIT Press. Kiiski, Sampsa, and Matti Pohjola. 2002. “Cross-Country Diffusion of the Internet.” Information
Economics and Policy. 14 (2):297-310. Lake, David, and Matthew Baum. 2001. The Invisible Hand of Democracy: Political Control and the
Provision of Public Services. Comparative Political Studies 34 (6):587-621. LaPorta, R., F. Lopez-Silanes, Andre Shleifer, and R. Vishny. 1997. Legal Determinants of External
Finance. Journal of Finance 52 (3):1131-1150. Landes, David. 1998. The Wealth and Poverty of Nations: Why Some are So Rich and Some so Poor. NY
NY: Norton. Loboda, Jan. 1974. The Diffusion of Television in Poland. Economic Geography 50 (1):70-82. Marshall, Monty and Jaggers, Keith. 2001. “Polity IV.” Integrated Network for Societal Conflict
Research (INSCR) Program, Center International Development and Conflict Management (CIDCM), University of Maryland, www.bsos.umd.edu/cidcm/inscr/polity, December 1, 2001, Version 2000.
Mokyr, Joel. 1990. The Lever of Riches. NY NY: Oxford University Press. Morrill, Richard, Gary Gaile, and Grant Thrall. 1988. Spatial Diffusion. Newbury Park, CA: Sage
Publications. Moss, Mitchell and Anthony Townsend. 1998. “Spatial Analysis of the Internet in US Cities and States.”
Paper prepared for the conference on “Technological Futures”, Durham, England, April 1998. Moss, Mitchell and Anthony Townsend. 2000. “The Role of the Real City in Cyberspace.” In D. Janelle
and D. Hodge, eds., Information, Place, and Cyberspace Issues in Accessibility. Berlin: Springer, 171-86.
Norris, Pippa. 2001. Digital Divide: Civic Engagement, Information Poverty and the Internet Worldwide.
Cambridge UK: Cambridge University Press. North, Douglass. 1990. Institutions, Institutional Change and Economic Performance. Cambridge:
Cambridge University Press.
31

North, Douglass C., and Robert Paul Thomas. 1973. The Rise of the Western World: A New Economic History. Cambridge: Cambridge University Press.
Parente, Stephen L., and Edward C. Prescott. 2002. Barrier to Riches. Cambridge MA: MIT Press. Oxley, Joanne, and Bernard Yeung. 2001. E-Commerce Readiness: Institutional environment and
International Competitiveness. University of Michigan Business School Working Papers 00-009. Petrazzini, Ben, and Agustina Guerrero. 2000. Promoting Internet Development: The Case of Argentina.
Telecommunications Policy 24:89-112. Przeworski, Adam, Mike Alvarez, Jose Cheibub and Limongi. 2000. Democracy and Development:
Political Regimes and Material Well Being in the World. New York: Cambridge University. Updated data to 2000 available from Cheibub.
Rogers, Everett. 1995. Diffusion of Innovations. 4th ed. NY NY: Free Press. Seror, Ann, and Jaun Miguel Fach Arteaga. 2000. Telecommunications Technology Transfer and the
Development of Institutional Infrastructure: the Case of Cuba. Telecommunications Policy 24:203-221.
Sussman, Leonard. 2000. “The Internet and Press Freedom 2000.” Freedom House.
http://www.freedomhouse.org/pfs2000/sussman.html. Van Belle, Douglas A. 1997. Press Freedom and the Democratic Peace. Journal of Peace Research 34
(4):405-14. World Bank. (WB WDI). 2001. World Development Indicators. Washington, DC: World Bank. CD-
ROM. Wintrobe, Ronald. 1998. The Political Economy of Dictatorship. New York: Cambridge University Press.
32
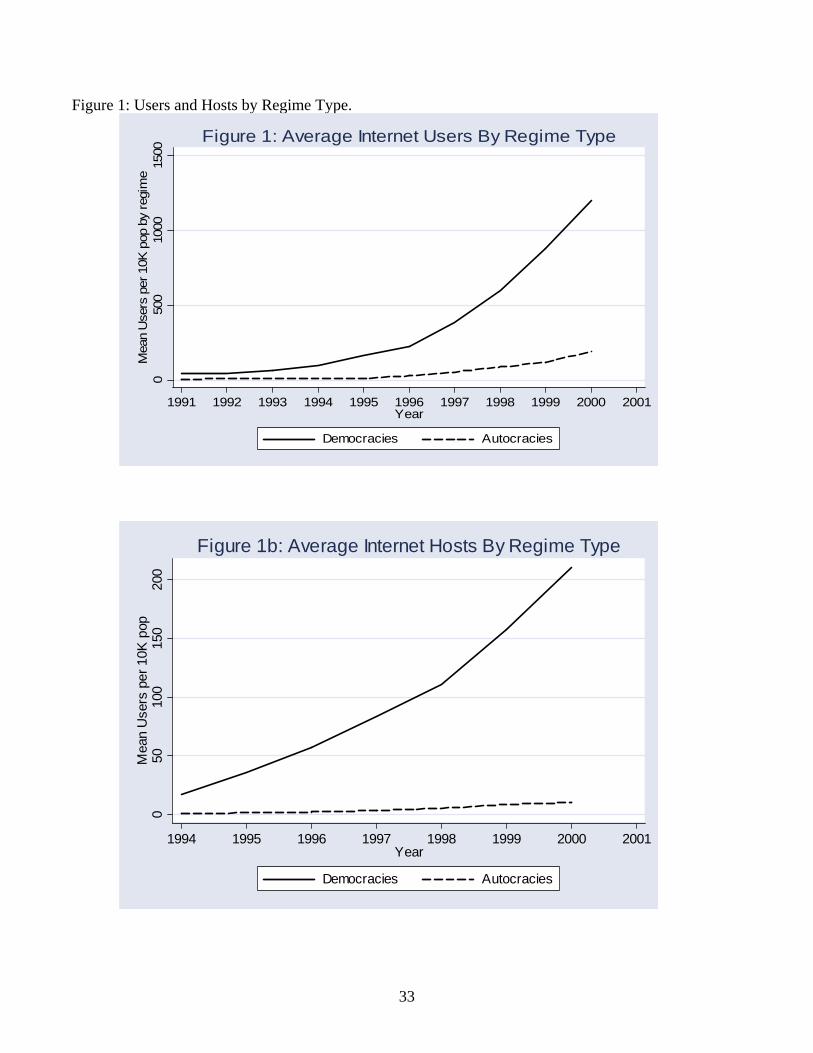
Figure 1: Users and Hosts by Regime Type.
050
010
0015
00M
ean
Use
rs p
er 1
0K p
op b
y re
gim
e
1991 1992 1993 1994 1995 1996 1997 1998 1999 2000 2001Year
Democracies Autocracies
Figure 1: Average Internet Users By Regime Type
050
100
150
200
Mea
n U
sers
per
10K
pop
1994 1995 1996 1997 1998 1999 2000 2001Year
Democracies Autocracies
Figure 1b: Average Internet Hosts By Regime Type
33
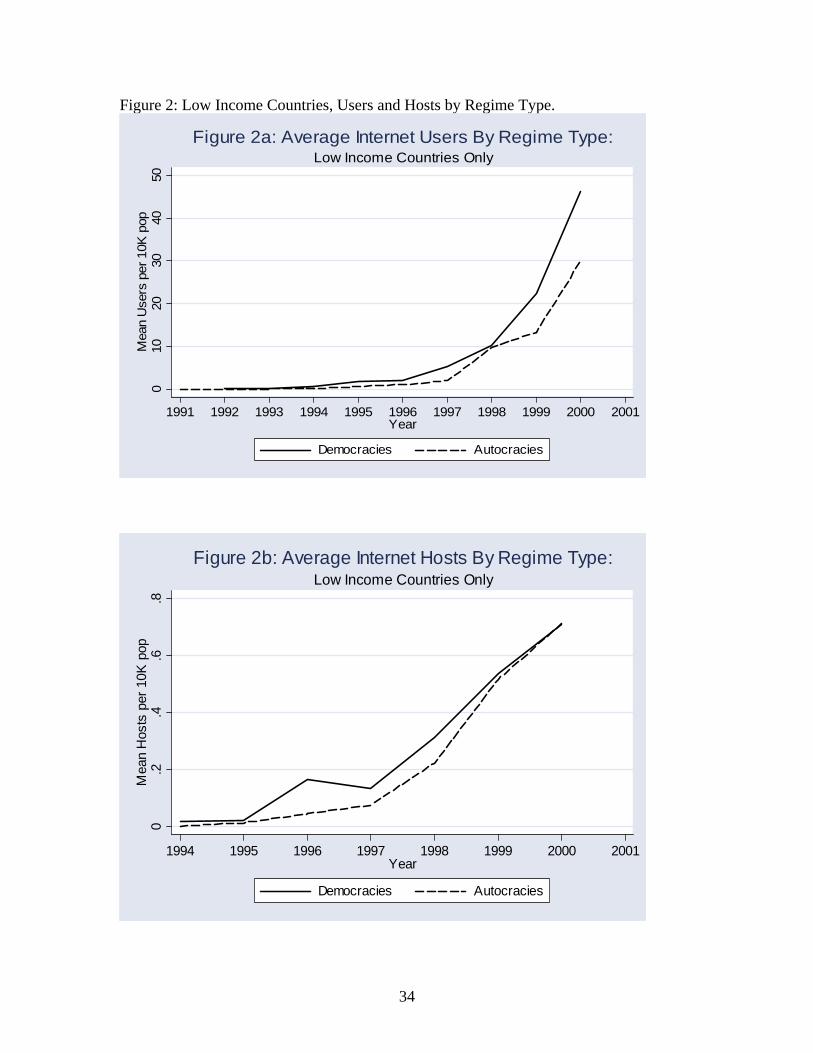
Figure 2: Low Income Countries, Users and Hosts by Regime Type.
010
2030
4050
Mea
n U
sers
per
10K
pop
1991 1992 1993 1994 1995 1996 1997 1998 1999 2000 2001Year
Democracies Autocracies
Low Income Countries OnlyFigure 2a: Average Internet Users By Regime Type:
0.2
.4.6
.8M
ean
Hos
ts p
er 1
0K p
op
1994 1995 1996 1997 1998 1999 2000 2001Year
Democracies Autocracies
Low Income Countries OnlyFigure 2b: Average Internet Hosts By Regime Type:
34

Figure 3: Middle Income Countries, Users and Hosts by Regime Type.
020
040
060
0M
ean
Use
rs p
er 1
0K p
op
1991 1992 1993 1994 1995 1996 1997 1998 1999 2000 2001Year
Democracies Autocracies
Middle Income Countries OnlyFigure 3a: Average Internet Users By Regime Type:
010
2030
4050
Mea
n H
osts
per
10K
pop
1994 1995 1996 1997 1998 1999 2000 2001Year
Democracies Autocracies
Middle Income Countries OnlyFigure 3b: Average Internet Hosts By Regime Type:
35

Figure 4: High Income Countries, Users and Hosts by Regime Type.
010
0020
0030
00M
ean
Use
rs p
er 1
0K p
op
1991 1992 1993 1994 1995 1996 1997 1998 1999 2000 2001Year
Democracies Autocracies
High Income Countries OnlyFigure 4a: Average Internet Users By Regime Type:
020
040
060
0M
ean
Hos
ts p
er 1
0K p
op
1994 1995 1996 1997 1998 1999 2000 2001Year
Democracies Autocracies
High Income Countries OnlyFigure 4b: Average Internet Hosts By Regime Type:
36
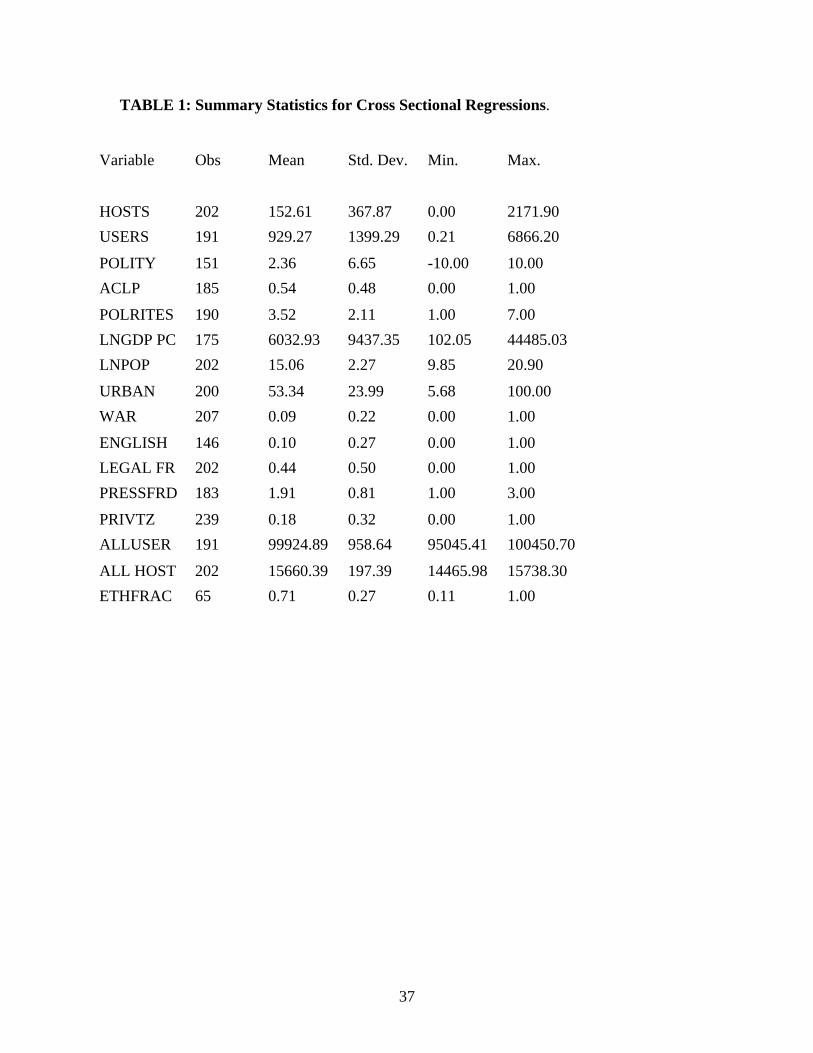
TABLE 1: Summary Statistics for Cross Sectional Regressions.
Variable Obs Mean Std. Dev. Min. Max.
HOSTS 202 152.61 367.87 0.00 2171.90 USERS 191 929.27 1399.29 0.21 6866.20
POLITY 151 2.36 6.65 -10.00 10.00 ACLP 185 0.54 0.48 0.00 1.00
POLRITES 190 3.52 2.11 1.00 7.00 LNGDP PC 175 6032.93 9437.35 102.05 44485.03 LNPOP 202 15.06 2.27 9.85 20.90
URBAN 200 53.34 23.99 5.68 100.00 WAR 207 0.09 0.22 0.00 1.00
ENGLISH 146 0.10 0.27 0.00 1.00 LEGAL FR 202 0.44 0.50 0.00 1.00 PRESSFRD 183 1.91 0.81 1.00 3.00
PRIVTZ 239 0.18 0.32 0.00 1.00 ALLUSER 191 99924.89 958.64 95045.41 100450.70
ALL HOST 202 15660.39 197.39 14465.98 15738.30 ETHFRAC 65 0.71 0.27 0.11 1.00
37
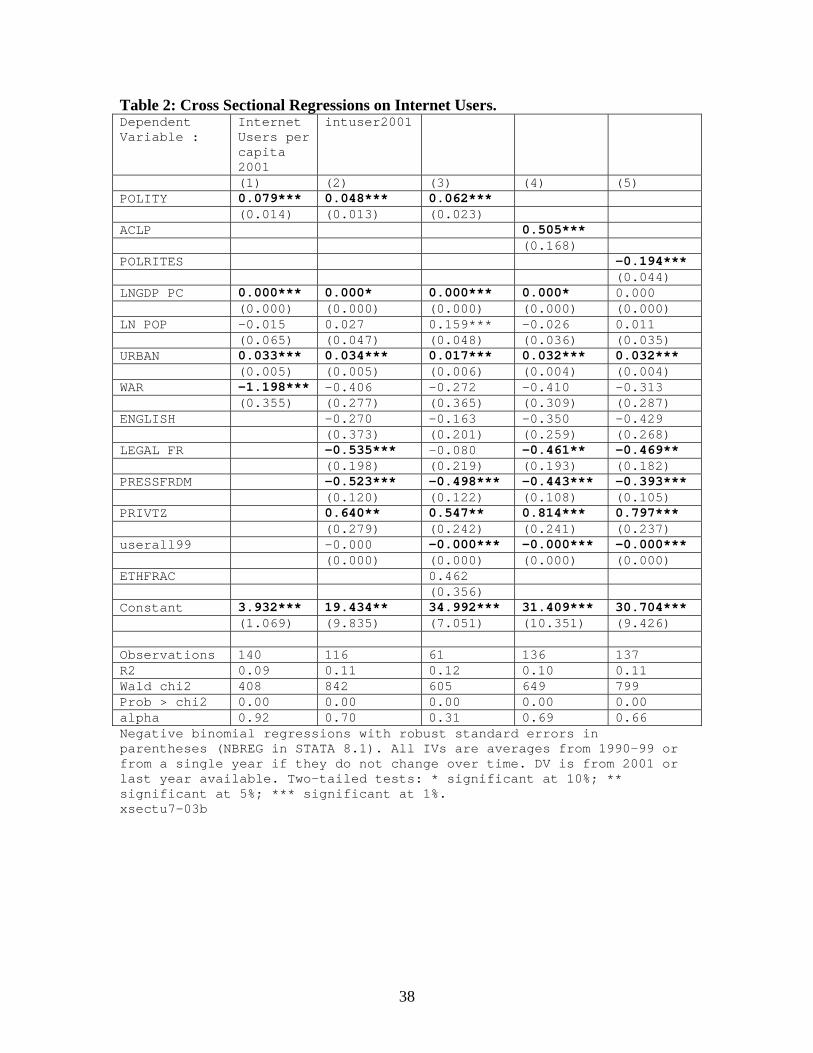
Table 2: Cross Sectional Regressions on Internet Users. Dependent Variable :
Internet Users per capita 2001
intuser2001
(1) (2) (3) (4) (5) POLITY 0.079*** 0.048*** 0.062*** (0.014) (0.013) (0.023) ACLP 0.505*** (0.168) POLRITES -0.194*** (0.044) LNGDP PC 0.000*** 0.000* 0.000*** 0.000* 0.000 (0.000) (0.000) (0.000) (0.000) (0.000) LN POP -0.015 0.027 0.159*** -0.026 0.011 (0.065) (0.047) (0.048) (0.036) (0.035) URBAN 0.033*** 0.034*** 0.017*** 0.032*** 0.032*** (0.005) (0.005) (0.006) (0.004) (0.004) WAR -1.198*** -0.406 -0.272 -0.410 -0.313 (0.355) (0.277) (0.365) (0.309) (0.287) ENGLISH -0.270 -0.163 -0.350 -0.429 (0.373) (0.201) (0.259) (0.268) LEGAL FR -0.535*** -0.080 -0.461** -0.469** (0.198) (0.219) (0.193) (0.182) PRESSFRDM -0.523*** -0.498*** -0.443*** -0.393*** (0.120) (0.122) (0.108) (0.105) PRIVTZ 0.640** 0.547** 0.814*** 0.797*** (0.279) (0.242) (0.241) (0.237) userall99 -0.000 -0.000*** -0.000*** -0.000*** (0.000) (0.000) (0.000) (0.000) ETHFRAC 0.462 (0.356) Constant 3.932*** 19.434** 34.992*** 31.409*** 30.704*** (1.069) (9.835) (7.051) (10.351) (9.426) Observations 140 116 61 136 137 R2 0.09 0.11 0.12 0.10 0.11 Wald chi2 408 842 605 649 799 Prob > chi2 0.00 0.00 0.00 0.00 0.00 alpha 0.92 0.70 0.31 0.69 0.66 Negative binomial regressions with robust standard errors in parentheses (NBREG in STATA 8.1). All IVs are averages from 1990-99 or from a single year if they do not change over time. DV is from 2001 or last year available. Two-tailed tests: * significant at 10%; ** significant at 5%; *** significant at 1%. xsectu7-03b
38

Table 3: Cross Sectional Regressions on Internet Hosts.
Dependent Variable:
Internet Hosts per capita 2001
inthost2001
(1) (2) (3) (4) (5) POLITY 0.122*** 0.113*** 0.203*** (0.026) (0.028) (0.024) ACLP 1.163** (0.500) POLRITES -0.553*** (0.103) LNGDP PC 0.000*** 0.000*** 0.000*** 0.000* 0.000 (0.000) (0.000) (0.000) (0.000) (0.000) LNPOP -0.172** -0.017 0.317*** -0.306*** -0.187*** (0.086) (0.079) (0.078) (0.092) (0.072) URBAN 0.039*** 0.035*** 0.038*** 0.035*** 0.028*** (0.010) (0.009) (0.006) (0.011) (0.009) WAR -1.803*** -0.909* -1.418*** -1.225* -0.430 (0.404) (0.486) (0.313) (0.628) (0.654) ENGLISH -0.899** -0.194 -2.606*** -3.003*** (0.431) (0.355) (0.710) (0.628) LEGAL FR -0.962*** -0.465** -1.180*** -1.179*** (0.249) (0.233) (0.381) (0.297) PRESSFRDM -0.428** -0.434*** 0.154 0.106 (0.173) (0.144) (0.250) (0.214) PRIVTZ 0.791** 0.569* 0.822 0.901** (0.387) (0.339) (0.568) (0.424) ALL HOSTS -0.001** -0.001*** -0.005*** -0.006*** (0.001) (0.000) (0.002) (0.002) ETHFRAC 1.196*** (0.426) Constant 2.754* 19.850** 17.917*** 82.702*** 98.219*** (1.634) (9.348) (5.362) (29.816) (27.854) Observations 140 116 61 136 137 R2 0.14 0.17 0.19 0.11 0.13 Wald chi2 367 565 843 156 170 Prob > chi2 0.00 0.00 0.00 0.00 0.00 alpha 1.68 1.33 0.47 2.38 2.00 Negative binomial regressions with robust standard errors in parentheses (NBREG in STATA 8.1). All IVs are averages from 1990-99 or from a single year if they do not change over time. DV is from 2001 or last year available. Two-tailed tests: * significant at 10%; ** significant at 5%; *** significant at 1%. xsecth7-03b
39

Table 4: Summary Statistics for TSCS regressions. Variable Obs Mean Std. Dev. Min. Max.
USERS 1443 380.49 854.74 0.00 6866.20
HOSTS 1528 60.19 198.75 0.00 2171.90
POLITY 1562 2.60 7.00 -10.00 10.00
ACLP 1812 0.54 0.50 0.00 1.00
POLRITES 2027 3.52 2.22 1.00 7.00
LNGDP PC 2036 7.58 1.55 4.44 10.98
LN POP 2276 15.35 2.06 9.85 20.96
URBAN 2398 53.68 23.97 5.20 100.00
PHONES 2139 172.83 193.86 0.30 869.80
AV HOSTS 1910 59.32 46.67 7.43 150.25
US HOSTS% 1910 0.07 0.01 0.07 0.08
AV USERS 2866 264.23 297.94 7.81 927.13
US USERS% 2627 0.06 0.03 0.03 0.11
PRIVTZ 2866 0.21 0.41 0.00 1.00
YEAR 2866 1995 3.45 1990 2001
40

Table 5: TSCS Regressions on Internet Users. Dependent Variable:
Internet Users Per 10K. Pop
intuser_p
(1) (2) (3) (4) (5) (6) POLITY 0.038*** 0.040*** 0.032*** 0.033*** (0.007) (0.008) (0.007) (0.008) ACLP 0.431*** (0.107) POLRITES -0.113*** (0.022) GDP PC 0.172*** 0.074 0.147*** 0.144*** 0.215*** 0.150*** (0.050) (0.068) (0.052) (0.052) (0.052) (0.047) POP 0.107*** 0.108*** 0.095*** 0.096*** 0.061** 0.081*** (0.032) (0.031) (0.032) (0.031) (0.027) (0.024) URBAN 0.011*** 0.011*** 0.011*** 0.011*** 0.010*** 0.009*** (0.003) (0.003) (0.003) (0.003) (0.003) (0.003) YEAR 0.465*** 0.453*** (0.007) (0.009) PHONES 0.001** (0.000) AV. USERS 0.002*** 0.002*** 0.002*** 0.002*** (0.000) (0.000) (0.000) (0.000) US USERS% -34.65*** -35.08*** -33.80*** -35.37*** (1.732) (1.752) (1.630) (1.568) PRIVTZ -0.101* (0.060) Constant -930.90*** -906.1*** -1.70*** -1.68*** -1.77*** -0.856* (14.719) (18.065) (0.585) (0.582) (0.498) (0.464) N 1085 1071 1085 1085 1142 1309 COUNTRIES 139 139 139 139 168 170 log likelihood
-4115.39 -4057.36 -4130.01 -4128.62 -4059.43 -5001.50
Wald chi2 5856 6008 5410 5424 5013 6306 Prob> chi2 0.00 0.00 0.00 0.00 0.00 0.00
Negative binomial regression (XTNBREG in STATA 8.1) with country FE. All IVs lagged one period except for year, average users, and US users as % of world. Standard errors in parentheses. Two-tailed tests: * significant at 10%; ** significant at 5%; *** significant at 1%. xtnbregu
41

Table 6: TSCS Regressions on Internet Hosts Dependent Variable:
Internet Hosts Per 10K. Pop
hosts_0 _ppop
(1) (2) (3) (4) (5) (6) POLITY 0.039*** 0.032** 0.032** 0.031** (0.013) (0.016) (0.013) (0.013) ACLP 0.640*** (0.202) POL RITES -0.116*** (0.034) GDP_PC 0.058 -0.232** -0.006 0.031 0.022 -0.013 (0.088) (0.113) (0.083) (0.091) (0.076) (0.083) POP 0.109* 0.121** 0.129** 0.268*** 0.334*** 0.132** (0.065) (0.059) (0.055) (0.044) (0.038) (0.056) URBAN 0.005 0.002 0.003 0.014** 0.005 0.003 (0.005) (0.005) (0.005) (0.006) (0.004) (0.005) YEAR 0.405*** 0.380*** (0.008) (0.010) PHONES 0.002*** (0.001) AV HOSTS 0.017*** 0.021*** 0.017*** 0.017*** (0.000) (0.001) (0.000) (0.000) US HOSTS% 38.66*** 12.97*** 37.72*** 37.74*** (4.082) (4.426) (3.800) (4.099) PRIVATZ 0.106 (0.071) Constant -810.07*** -757.02*** -4.60*** -6.23*** -7.85*** -4.60*** (16.727) (19.561) (1.093) (0.816) (0.728) (1.094) N 1061 1048 1061 1154 1325 1061 COUNTRIES 137 137 137 167 169 137 log like-lihood
-1774.32 -1748.58 -1877.88 -1778.53 -2292.45 -1877.85
Wald chi2 3436 3592 2334 2569 2844 2335 Prob>chi2 0.00 0.00 0.00 0.00 0.00 0.00 Negative Binomial regression (XTNBREG in STATA 8.1) with country FE. All IVs lagged one period, except year, US hosts, and average hosts. Standard errors in parentheses. Two-tailed tests: * significant at 10%; ** significant at 5%; *** significant at 1%. xtnbregh9
42