Embed Size (px)
Citation preview

The Diffusion of Crisis-Related Communication on Social Media:An Empirical Analysis of Facebook Reactions
Bjorn Ross∗, Tobias Potthoff∗, Tim A. Majchrzak†, Narayan Ranjan Chakraborty†, Mehdi Ben Lazreg†, Stefan Stieglitz∗∗University of Duisburg-Essen, Germany
Email: {bjoern.ross; tobias.potthoff; stefan.stieglitz}@uni-due.de†University of Agder, Kristiansand, Norway
Email: {timam; narayan.chakraborty; mehdi.ben.lazreg}@uia.no
Abstract
During a crisis, authorities need to effectively dissemi-nate information. We address the problem of deciding howcrisis-related information should be published on Facebookto reach as many people as possible. We examine threerecent terrorist attacks in Berlin, London and Stockholm.Our specific focus lies with official Facebook pages bymunicipalities and emergency service agencies. We collectedposts about the events, along with the number of shares, likesand emotional reactions to them. In a regression analysis,several variables were examined that capture decisions onwhich information to publish and how. Posts containingcondolences were found to result in three times as manyemotional reactions as other posts, all other variables heldconstant. Images and videos positively affected the numberof reactions by factors of 2.2 and 3.9, respectively, whiletext length negatively affected the number of shares. Theseresults will help in the development of effective guidelines.
1. Introduction
When people are affected by crises such as terror attacks,they turn to social media to make sense of the situation[16]. Emergency service agencies (ESAs) have recognisedan opportunity to rapidly disseminate information to manypeople and interact with them [31]. Consequently they haveset up Twitter accounts and Facebook pages [54]. However,it is unclear which factors influence the success of theirposts. To ensure effective emergency management practices,it is necessary to understand how individuals react to crisis-related information. In particular, it is essential to learn whatkind of information diffuses on social media.
In this article, we argue that while previous researchhas looked at the quantity of interactions, the relationshipsbetween qualitatively different interactions have receivedcomparatively little attention. Examples on popular socialmedia services include replies versus retweets on Twitter,or Facebook shares versus likes. Our assessment especiallyapplies to the context of crisis management. In addition,
Facebook recently introduced a feature that allows users toexpress their views on a post by clicking an emoji [28]. Thisdata could be highly relevant for emergency management: itwould help responders understand how individuals react totheir posts.
To evaluate the use of such user response data in emer-gency management, we studied how several variables relatedto a post affect the number of times it is shared and liked onFacebook. For this purpose, we collected posts by emergencymanagement agencies and municipalities during three recentterror attacks, along with the reactions to them. The attacksexamined were (1) the December 2016 Berlin truck attack,(2) the March 2017 attack in Westminster, London, and(3) the 2017 April Stockholm attack. Among the reactionscollected were the number of shares and likes, and a rangeof other emotional reactions including sadness and anger.
Several variables were extracted that capture decisionsmade by page administrators and content creators on howto publish the information. This allowed us to examine theirrelative importance in determining user reactions. We alsoscrutinised the relationships among qualitatively differentemotional reactions expressed on Facebook by using its newReactions feature, and discuss its relevance for emergencymanagement.
Our work makes several contributions. First, we providecomprehensive work on social media analytics in the fieldof crisis management with a particular focus on Facebook.By both exploring the topic theoretically and presenting anempirical study, we seek to advance the understanding ofreactions to postings. Second, we discuss our findings withthe aim of providing generalisable insights. Thereby, weprovide advice for practitioners and contribute to the theoryon social media analytics. Moreover, we hope to stimulatemore work in this relatively unexplored area.
The remainder of this paper is structured as follows. InSection 2 we explain the background of the tackled topics.Due to the multi-step nature of our work, we describe ourresearch design in detail in Section 3. The results of ourstudy are then given in Section 4. We discuss them inSection 5 before drawing a conclusion in Section 6.
Proceedings of the 51st Hawaii International Conference on System Sciences | 2018
URI: http://hdl.handle.net/10125/50207ISBN: 978-0-9981331-1-9(CC BY-NC-ND 4.0)
Page 2525
2. Background
2.1. Crisis Communication in Emergency Response
In every emergency situation, and even more so in everycrisis, communication is vital [21], [24]. To effectivelymitigate the consequences of incidents, crisis managers (e.g.from a municipality or the police) must coordinate firstresponders and subsequent crisis stakeholders. Ineffectivecommunication is at least one of several contributing factorsto failed crisis response [38]. Good communication notonly leads to a quicker and more effective crisis response,but also helps to avoid problems such as responders beingdeployed to a site which others have already been deployedto, possibly leaving another site uncovered.
Communication, however, does not only aid the responseprocess. Equally, it can make the response easier, reducesuffering, and possibly even directly mitigate crisis con-sequences [47]. For this purpose, communication not onlyhappens between crisis responders but also between crisismanagers (or, in general, authorities) and the population[18]. If citizens know which kind of crisis they face andif they are provided with reliable information that helpsthem make decisions, they are much less likely to encountertrouble.
Crisis communication can happen on several levels. Be-fore a crisis, the population can already be instructed.Imagine a region is prone to flooding. It helps noticeablyif the population is taught about good procedures in case ofa flood, such as avoiding cellars, switching off electricity,and looking after elderly neighbours. During crises, thepopulation can be kept informed with updated news andwith advice. Crises are chaotic, particularly in their onset[7]; therefore, a hybrid strategy of giving instructions (suchas encouraging people to evacuate an area) and providinginformation to calm the population while supporting theirown informed decisions is promising.
There are different ways of reaching the population withtechnological means. Traditionally, radio broadcasting wasthe main way of informing the public [36]. Currently, shortmessages (SMS) are popular for crisis communication dueto the widespread usage of mobile phones [8]. It is not onlypossible to broadcast messages to all members of a particularpopulation but also to all mobiles phones in an area, i.e.also including visitors [10]. Moreover, more targeted sendingis possible, to e.g. give instructions to people registeredas volunteer helpers. The Web and, recently, social mediaservices complement the two older possibilities (cf. e.g. [48],[55]). They are arguably more vulnerable to infrastructurefailures. Consider, for example, an earthquake. It is quitelikely that parts of the electrical and the communicationinfrastructure are damaged; in this case, Internet access(or rather communication modes in general [49]) may beseriously disrupted. It takes much more damage before the
cellular network is completely inoperable. Radio remainsan option even in cases of the most serious damages.However, the higher level of media richness, personality, andin particular the social aspect are strong reasons for usingseveral channels in crisis communication, as will becomeapparent throughout the remainder of this paper (cf. also [1],[18]).
2.2. The Role of Social Media
Since the advent of social media, its usage has rapidlyincreased. Social media platforms generally allow a two-waycommunication between individuals, groups, organisationsand (emergency) authorities [58]. Because of social media’scapabilities for mass communication, the rapid spread ofinformation and the large potential audience, it has becomean important channel for marketers and others [12]. Somestudies have looked into the dissemination of information onsocial media and showed that emotionally charged text yieldsstronger reactions and a faster dissemination throughouta network [52]. For example, hate speech has become aproblem on social media [44].
However, social media has also become an intermediaryfor news and other kinds of information due to the factthat people often consult the platforms’ timelines, i.e. anaggregated view on postings based on the user’s preferences,for updates of newspapers or other information providers[19], [29]. Valuable information is generated in social media– not only messages or pictures but also by users sharinglocation data, interests and relationships and giving likes orother reactions to original posts [11]. This initiates a back-channel for organisations which have started to listen tousers’ needs through social media or implemented customerservice [26].
2.2.1. Social Media in Crises. In crisis situations, socialmedia has gained importance as both an information sourceand a communication channel. Several studies have empi-rically examined how social media was used in differentcrisis scenarios: e.g. corporate brand crises [27], naturaldisasters [42], [5], riots and demonstrations [14] or acts ofterrorism [45], [34], [9]. For example, Yin et al. [58] usednatural language processing and data mining techniques intheir study in order to enhance situational awareness. Thisconcept from the military domain has also been adapted fornon-military crisis situations. Based on Twitter data fromeight crisis situations in Australia, including both human-made and natural disasters, they developed an incidentdetection, clustering and visualisation system for emergencyagencies. A more recent study investigated the Twittercommunication during the 2013 Boston Marathon bombings,the 2014 hostage crisis in Sydney and the Charlie Hebdoattack in 2015 [4]. The results remain rather descriptive butindicate a general increase in the number of tweets and a
Page 2526
higher proportion of retweets and hashtags during a crisis.Furthermore, they found accounts by the police and newsmedia to have a strong influence on the communication.
Studies evaluating and consequently recommending com-munication strategies of crisis authorities in social media arescarce. Carter et al. [5] found that agencies were not reallylistening to crisis-related communication in social media nordid they respond to comments.
Because any user can publish posts on social media, thereare also rumours and misinformation in the communication[37], [2]. Though Jong [25] found a self-correction mecha-nism in the context of a Dutch crisis, the identification ofrumours and wrong information remains a topic of highinterest which needs to be considered when using socialmedia data.
2.2.2. Twitter Bias in Research. Most works aiming atthe usage of social media data in the context of crisiscommunication and emergency response have only looked atTwitter. In general, there seems to be a bias towards Twitterin research on social media analytics and related fields. Forexample, in a study of humanitarian information processing,Munro and Manning [35] found that Twitter accounted foronly 0.16 % of messages sent globally, but for 74.29 % ofresearch papers published in the three databases examinedover the course of one year. In this regard, the value ofstatistically valid predictions based on Twitter data has beenchallenged [17]. Although there are many reasons to useTwitter as an information source in crisis situations and insocial media analytics in general (e.g. short messages, tweetsare public by default, detailed API), we need to criticallyreflect on how well tweets mirror reality [46], [32]. Asof January 2017, Facebook has 1,871 million active userswhereas Twitter states 317 million only [6].
A comparative study by Eriksson and Olsson [15] inves-tigated the perception of both Twitter and Facebook withprofessionals from ESAs and citizens in Sweden. Theyfound that ESAs feel more experienced with Facebook thanTwitter though its usage is rather low. Additionally, Twitterwas considered an elite channel used to reach journalists ordecision-makers, whereas Facebook can reach the generalpublic. Citizens that act as recipients and co-creators on-site also valued Facebook higher than Twitter [15]. Forexample, Facebook was used during the European Floodsof 2013 to organise volunteer communities [43]. Focusingon the communication sent by fire and police departmentsduring the 2012 Hurricane Sandy, Hughes et al. [22] foundrelatively few departments using social media to informand encourage a certain behaviour. They performed a broadusage analysis of different social media and coded theretrieved communication (e.g. closure, safety, weather). Thenumber of reactions (e.g. likes) or shares to assess the po-tential reach were not included. Though the paper concludeswith general recommendations on how to integrate social
media in emergency response management, these remainrather high-level.
2.2.3. Facebook Reactions. In February 2016, after a pilottest in several markets, Facebook made the new Reactionsfeature available globally [28]. This feature allows users toreact to posts by clicking an emoji displayed in the user in-terface alongside the previously available ‘like’ button. Thereactions introduced are ‘love’, ‘haha’, ‘wow’, ‘sad’, and‘angry’. The new distinction has not yet been used in manystudies. Larsson analysed the frequency of reactions, andthe association between reactions and shares or comments,respectively [30]. The author concludes that news whichprovoke negative reactions get shared and commented onmore, while news with many positive reactions (e.g. love) getshared and commented on less. In another study about thenew reactions, the predictability of emotions based on textsof Facebook posts was studied [39]. They used the reactionsto a Facebook post as labels in a supervised machinelearning task, obviating the need for human annotations.
2.3. Emergency Service Agencies
Emergency Service Agencies (ESAs) are the prime re-sponders to any crisis happening throughout the world. Theyrange from police, NGOs, and fire brigades to other muni-cipal authorities or joint agencies for larger areas or wholecountries. Due to the critical aspect of the messages sharedby ESAs which can help save lives and infrastructures, it isimportant that messages reach as many people as possible.Social media have changed the scope of ESAs’ activitiesas these media allow to reach many people timely andefficiently. They can further enable a multi-way information-sharing platform for all the parties involved in the crisis. Incontrast to the old channels which audiences need to switchon deliberately, social media are ubiquitous through mobiledevices and push notifications [3]. As an example, duringHurricane Sandy, ESAs used social media to update thepublic about the situation, to issue evacuation orders andto answers people’s concerns as many affected persons usedsocial media as a lifeline [22]. Moreover, infrastructure pro-viders such as water, power and transportation organisationsused social media to share updates on the availability of theirservices during crises.
However, after several interviews with public sector emer-gency managers, Hiltz et al. [20] identified a lack of acomprehensive guideline as the main reason prohibitingESAs from using social media more effectively. Neverthe-less, research has developed useful though abstract recom-mendations for the usage of social media in ESAs (e.g. in[22], [5]). Hence, ESAs have started to use social mediaas source for enhancing situational awareness with on-siteinformation. But the information flow in social media isupdated constantly. Thus it is very difficult to get the overall
Page 2527

picture while substantial portions of the data are redundant[40]. Another challenge for ESAs is to make decisions basedon information with unknown credibility (e.g. rumours, fakenews) from both official and unofficial sources [50], [37].
For the dissemination of important information, ESAsnow actively use social media to reach a large proportionof the population faster [13]. Again, some effort has beenmade in the direction of producing a guideline. For example,The Contribution of Social Media In Crisis Management(COSMIC) is a EU-funded project to identify how socialmedia can be most effectively used in crisis situations.They propose key steps ESAs should follow to publishinformation on social media before, during and after acrisis [23]. They put an emphasis on identifying the targetgroup, writing specifically for that group, and being con-cise. Wendling et al. [57] pointed out that building trustand communicating with the public during normal timesis important because people will always look for familiarsources of information during a crisis.
Besides the mentioned two-way communication, socialmedia allows its users to get feedback about the perceptionsof posts and tweets. Reactions such as comments, retweets,likes or the aforementioned ‘haha’, ‘sad’ etc. on Facebookcan serve as a proxy for the success of the ESAs’ posts.Since reactions increase the reach of posts, there might bean interest in formulating posts in a way that more reactionsand, consequently, a higher reach are achieved. Quantitativestudies investigating the effects of writing style or embeddedmedia on reactions could not be identified. We aim at fillingthat gap and analyse Facebook posts from during threedifferent crises.
3. Research Design
3.1. Data Collection
We revisited previous studies in the realm of crisis com-munication and emergency response that use social mediadata. Above we argued that there is a bias towards the useof Twitter in studies on social media analytics in general, andon crisis communication and response in particular. Hence,we focus on the social networking site Facebook.
Additionally, prior work analysed communication duringcrises to identify roles and networks, cluster topics ordescribe sense-making processes through categories of in-formation. In this study, we focus on ESAs’ communicationstrategies with regard to their achieved reactions. Further-more, we innovatively take the different reactions availableon Facebook into account.
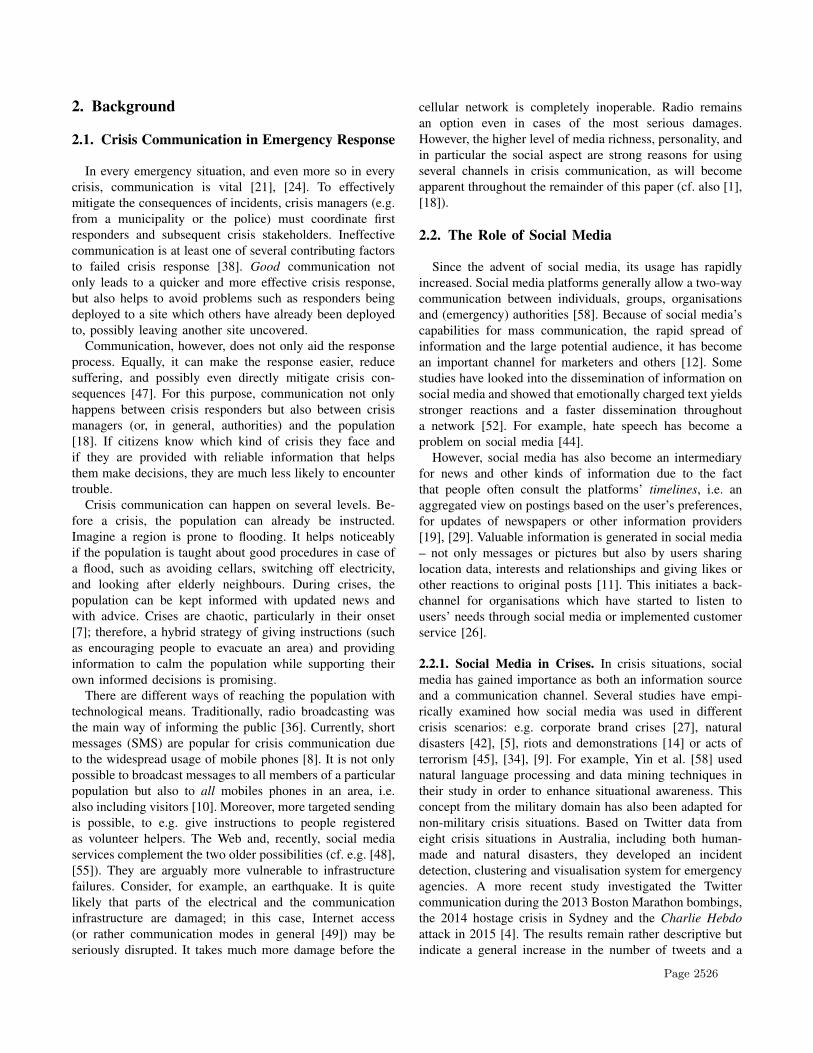
Three recent crises were selected for the study: (1) the2016 Berlin attack when a truck was deliberately driveninto a Christmas market at the Breitscheidplatz on 19November 2016, (2) the 2017 Westminster attack when
Figure 1: Example Facebook post made by the LondonMetropolitan Police Service shortly after the Westminsterincident
a car was deliberately driven into pedestrians on the Wes-tminster bridge and a police officer stabbed, on 22 March2017, and (3) the 2017 Stockholm attack when a truckwas deliberately driven into crowds at the shopping streetDrottninggatan, on 7 April 2017. The crises were selecteddue their similarity, since they were all classified as acts ofterrorism. They took place in three different countries, all inEurope.
We adopted the Social Media Analytics Framework ofStieglitz et al. [53] which has also guided other research.The model foresees the phases (1) Tracking (using APIsor other parsing techniques), (2) Preparation (e.g. removingspam, coding) and (3) Analysis.
A total of 85 Facebook posts were collected from sixrelevant Facebook pages (see Table 1 for an overview, andFigure 1 for an example). We started the data collection bymanually searching for public Facebook pages of authoritiesinvolved in the official communication. The search wascarried out using the Facebook search box, e.g. by searchingfor ‘Police London’, and by checking whether the officialwebsites of municipalities and ESAs provided hyperlinksto corresponding Facebook pages. For each incident, weselected one Facebook page run by an ESA and one runby a municipality. In the case of London and Berlin, theESA involved is the official police service; in the case
Page 2528

Table 1: Facebook pages examinedBerlin London Stockholm
Munici- Berlin.de London Gov Stockholms stadpality (@Hauptstadt- (@LDNGov) (@sthlmsstad)
portal)Likes* 41063 55230 876Posts 2 3 15
ESA Polizei Berlin MPS Kris-information.se
(@Polizei- (@metpoliceuk) (@Kris-Berlin) information)
Likes* 168643 165429 45281Posts 10 20 37
Time span 19–26 Dec 2016 22–29 Mar 2017 7–14 Apr 2017
*Page likes as of 12 Jun 2017
of Stockholm, the Swedish Civil Contingencies Agency,an official government agency, runs the website Krisin-formation.se along with a corresponding Twitter accountand Facebook page. This page publishes information aboutongoing and imminent crises as well as information aboutcrisis management.
We collected all posts published on these pages within se-ven days of the incident in May 2017. Related numbers (e.g.likes and other reactions as well as shares and video views ifapplicable) were gathered accordingly. Large numbers wererounded due to a limitation in the Facebook user interface.Due to the time (1 to 4 months) between the crises andthe data collection, we expect the posts’ reactions to havestabilised. Whether a post contained pictures or videos wasalso noted.
3.2. Data Preparation
To allow a detailed analysis of the kind of informationand the style used in the ESAs’ posts, we annotated allcollected posts. Prior work has proposed categories in thecontext of a natural crisis [22] or riots [14]. The formeris, however, too specific for a weather-related crisis (e.g.cleanup, closures, damage, donations etc.). The second paper[14] was used as a basis. It also provides detailed genres suchas demonstration start or number of participants below atop-level genre information.
We checked whether the proposed top-level genres infor-mation, encourage behaviour and warning can sufficientlycategorise the posts. The initial screening of the posts sug-gested to add the genres number of victims and condolencesbesides the general genre information.
Lastly, the annotation process included the question whet-her a post was related to the crisis. Three researchersindependently evaluated and annotated the texts.
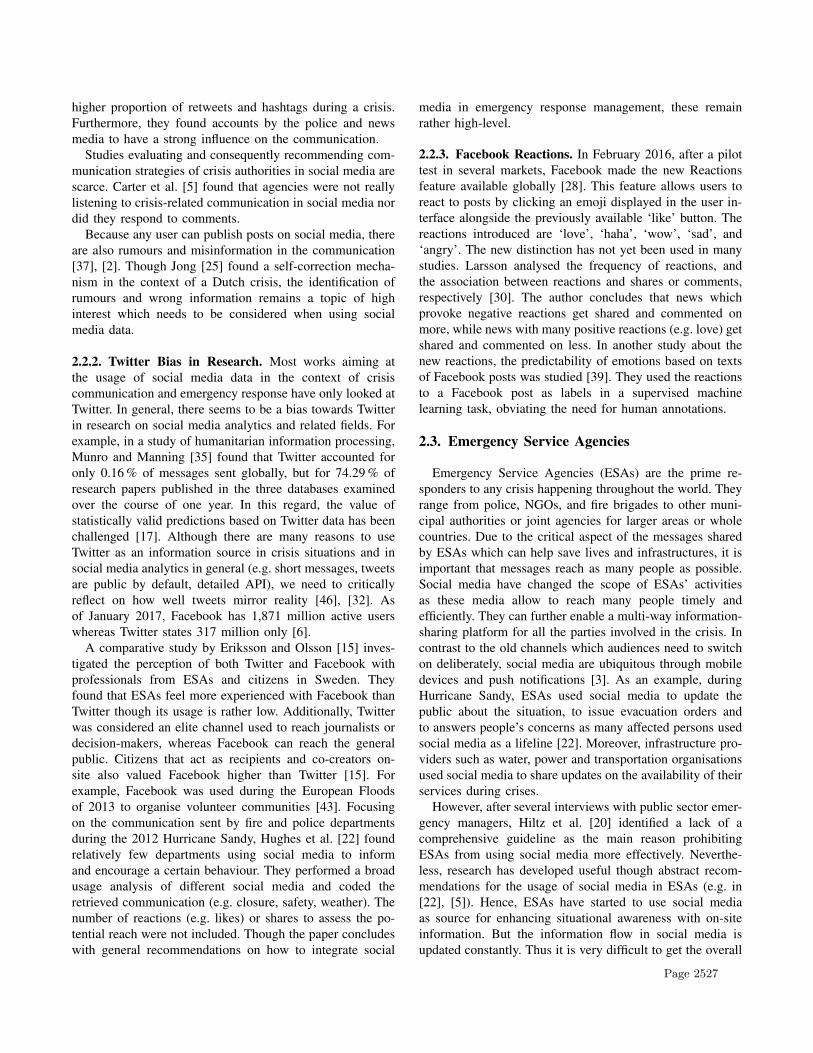
After the annotation, we calculated the reliability ofthe annotations using Krippendorff’s alpha (see Figure 2).The variable information was excluded because of its lowreliability (α = 0.237). The other variables (α > 0.6) were
Related to crisisInformation
Number of victimsWarning
EncouragementCondolences
0.00 0.25 0.50 0.75 1.00
Krippendorff's alpha
Figure 2: Reliability of the annotation (84 elements, 3annotators each)
retained and converted to binary using a majority vote: apost is taken to contain condolences, for example, if at leasttwo out of three annotators considered it to.
The data set was cleaned for the data analysis. One postwas excluded from the analysis because it did not containany text that could be annotated. Twelve posts were excludedbecause they were not considered relevant by at least twoout of three raters. The pruned data set contained onlythree posts from the Greater London government page, andtwo from the Berlin Facebook page. These were removeddue to the low case numbers. Finally, three posts wereexcluded for being shares of posts published by a differentFacebook page. These posts had to be excluded from theanalysis because, when a Facebook page shares a post from adifferent page, future shares are counted towards the originalpost. As a result, it is not possible to distinguish betweenthe number of times a post was shared due to the ESA’sfollowers actually seeing the post and the number of timesit was shared by other Facebook users, including the originalpage’s followers. The final data set contained 66 posts whichwere used in the analysis. Almost all of the posts were inthe primary language of the respective country, the onlyexception being seven posts from Sweden in English, whichis very widely understood there. Table 2a shows descriptivestatistics for the final data set.
3.3. Data Analysis
Negative binomial regressions were calculated to explainthe number of shares and the number of reactions to theFacebook posts based on the Facebook page the post appea-red on, text length, the presence of an image, the presenceof a video, and the reliable categories described above. Allcalculations were carried out using the statistical softwarepackage R [41] and the R package MASS [56].
Compared with ordinary least squares regression, ge-neralised linear models allow for error distributions otherthan the normal distribution. In this case, the residuals areassumed to be from a negative binomial distribution, whichis appropriate for a non-negative integer response in thepresence of overdispersion.
The log link function was used, i.e,
log(yi) = xTi β ⇐⇒ y = exp(xTi β),
Page 2529

Table 2: Descriptive statistics of the variables for the cleaned sample (n = 66)
(a) Numerical variables
Variable Min 1Q Median 3Q Max Mean % Zero
Likes 3 57.5 174.5 693.2 13000 737.70 0.0Sadness 0 2 19 112 7400 287.50 21.2Angry 0 0 1 6 525 21.98 45.5Haha 0 0 0 0 59 1.15 83.3Love 0 0 5 22.3 733 51.12 31.8Wow 0 0 0 1 28 2.08 62.1
All reactions 3 57.5 174.5 1145 21231 1101.60 0.0
Shares 0 24.5 89.5 299 7501 495.35 4.5Text length (in characters) 42 134 234 822.8 5816 649.80 0.0
(b) Binary variables
Variable % Zero
Image 69.7Video 92.4Number of victims 92.4Warning 93.9Encouragement 57.6Condolences 75.8
where β is the parameter vector, xi is the vector of predictorsfor observation i, and yi is the conditional mean of theresponse given xi. The predictors are thus expected to berelated linearly to the logarithm of the response, instead ofdirectly to the response. In other words, the addition of animage to a post is not expected to increase its number oflikes by an absolute number, whether the post has 10 or10,000 likes. Instead, the image is expected to increase thenumber of likes by a percentage. Likewise, the variable textlength was log-transformed with base 2 because a percentchange in the text length is assumed to be associated witha percent change in the number of shares and reactions.
Dummy variables were introduced to control for the effectof the page on which the post was published. The numberof reactions to a post is likely to depend to a large degreeon circumstances outside the immediate control of the pageowner at the time the information is posted. These mayinclude differences in media consumption habits betweendifferent countries and between police and municipalitypages, as well as in the number of followers. Conceptually,the dummy variables are statistical control variables. Theirinclusion allows us to neutralise the effects of all suchvariables that differ between pages, but do not differ betweenposts on the same page.
In addition to the regression analyses carried out toexplain the differences in the sum of all reactions as wellas shares, we also examined the correlation coefficientsbetween the individual reaction types (e.g. sadness, anger).Finally, we exemplarily studied the posts with the highestproportion of each reaction to understand which types ofcontent result in which emotional reactions.
4. Results
4.1. Regression Analysis
To study how post content and other variables affectthe diffusion of Facebook posts, we calculated a negativebinomial regression as described above. The results areshown in Table 3. The exponentiated coefficients give a ratio
for the change in the expected number of reactions or shareswhen the independent variable is increased by 1, all othervariables held constant. In the case of the binary variables,this corresponds to a change from absence to presence (ofan image, encouragement, etc.). In the case of text length,it corresponds to a doubling of text length.
The Facebook page that a post was published on has astrong influence on the results. For example, a post on thepage of Polizei Berlin is expected to accrue 251 times asmany shares, and 158 times as many reactions, as a post onthe City of Stockholm page (the reference category).
However, the results also show that other variables influ-ence the results. The text length is a major contributor tothe number of shares, since doubling the text length leadsto a decrease in the number of shares by a factor of 0.68,or 32 % (p = .011).
In contrast, the number of reactions is greatly influencedby whether or not the post contains media. If it containsan image, the number of reactions increases by a factor of2.16 (p = 0.038). The effect of a video is even stronger,as it increases the number of reactions by a factor of 3.89(p = 0.020).
Finally, the number of emotional reactions is also gover-ned to a large degree by whether or not the post expressescondolences or reports the expression of condolences by athird party. If it does, the number of reactions is increasedby a factor of 2.99 (p = 0.001).
As for the other variables, these results are inconclusive.It is not clear whether the other categories such as war-ning messages and encouragement have any effect at allon either the number of shares or reactions, whether textlength influences emotional reactions, or whether images andvideo influence shares. All of these variables could have alarge influence, as evidenced by the size of the estimatedcoefficients, but the standard errors and corresponding pvalues are large, so any judgment is best suspended basedon the available data.
Page 2530
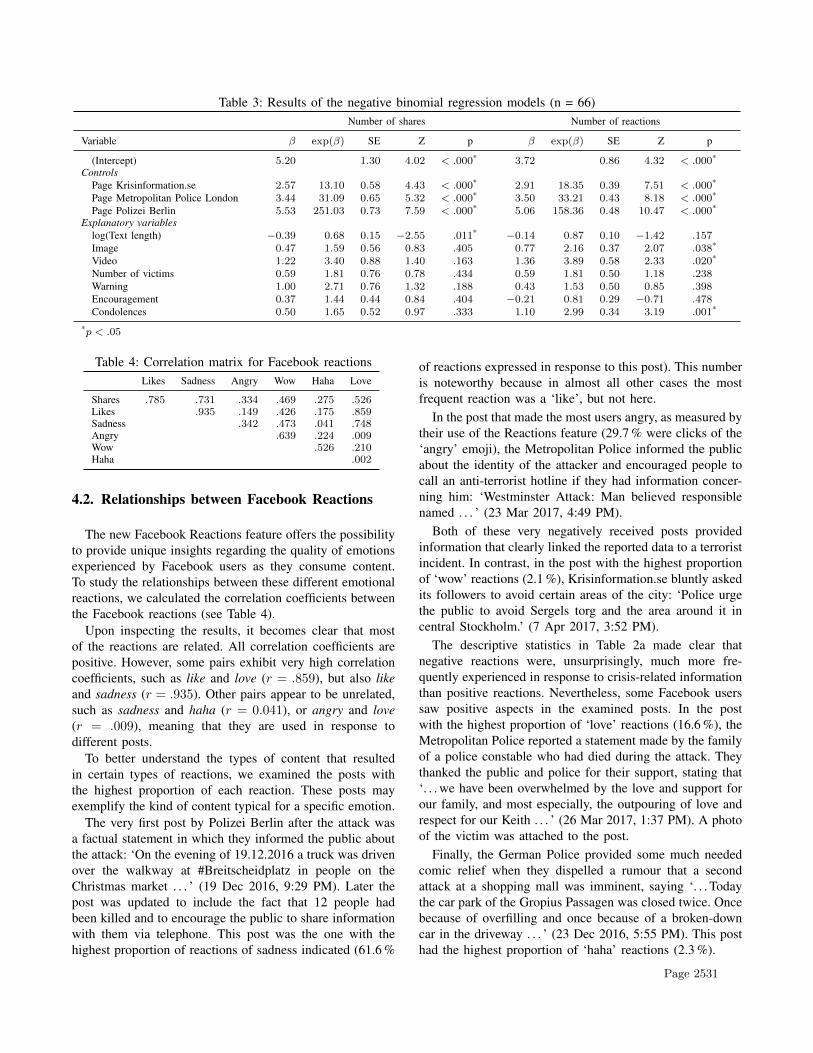
Table 3: Results of the negative binomial regression models (n = 66)Number of shares Number of reactions
Variable β exp(β) SE Z p β exp(β) SE Z p
(Intercept) 5.20 1.30 4.02 < .000* 3.72 0.86 4.32 < .000*
ControlsPage Krisinformation.se 2.57 13.10 0.58 4.43 < .000* 2.91 18.35 0.39 7.51 < .000*
Page Metropolitan Police London 3.44 31.09 0.65 5.32 < .000* 3.50 33.21 0.43 8.18 < .000*
Page Polizei Berlin 5.53 251.03 0.73 7.59 < .000* 5.06 158.36 0.48 10.47 < .000*
Explanatory variableslog(Text length) −0.39 0.68 0.15 −2.55 .011* −0.14 0.87 0.10 −1.42 .157Image 0.47 1.59 0.56 0.83 .405 0.77 2.16 0.37 2.07 .038*
Video 1.22 3.40 0.88 1.40 .163 1.36 3.89 0.58 2.33 .020*
Number of victims 0.59 1.81 0.76 0.78 .434 0.59 1.81 0.50 1.18 .238Warning 1.00 2.71 0.76 1.32 .188 0.43 1.53 0.50 0.85 .398Encouragement 0.37 1.44 0.44 0.84 .404 −0.21 0.81 0.29 −0.71 .478Condolences 0.50 1.65 0.52 0.97 .333 1.10 2.99 0.34 3.19 .001*
*p < .05
Table 4: Correlation matrix for Facebook reactionsLikes Sadness Angry Wow Haha Love
Shares .785 .731 .334 .469 .275 .526Likes .935 .149 .426 .175 .859Sadness .342 .473 .041 .748Angry .639 .224 .009Wow .526 .210Haha .002
4.2. Relationships between Facebook Reactions
The new Facebook Reactions feature offers the possibilityto provide unique insights regarding the quality of emotionsexperienced by Facebook users as they consume content.To study the relationships between these different emotionalreactions, we calculated the correlation coefficients betweenthe Facebook reactions (see Table 4).
Upon inspecting the results, it becomes clear that mostof the reactions are related. All correlation coefficients arepositive. However, some pairs exhibit very high correlationcoefficients, such as like and love (r = .859), but also likeand sadness (r = .935). Other pairs appear to be unrelated,such as sadness and haha (r = 0.041), or angry and love(r = .009), meaning that they are used in response todifferent posts.
To better understand the types of content that resultedin certain types of reactions, we examined the posts withthe highest proportion of each reaction. These posts mayexemplify the kind of content typical for a specific emotion.
The very first post by Polizei Berlin after the attack wasa factual statement in which they informed the public aboutthe attack: ‘On the evening of 19.12.2016 a truck was drivenover the walkway at #Breitscheidplatz in people on theChristmas market . . . ’ (19 Dec 2016, 9:29 PM). Later thepost was updated to include the fact that 12 people hadbeen killed and to encourage the public to share informationwith them via telephone. This post was the one with thehighest proportion of reactions of sadness indicated (61.6 %
of reactions expressed in response to this post). This numberis noteworthy because in almost all other cases the mostfrequent reaction was a ‘like’, but not here.
In the post that made the most users angry, as measured bytheir use of the Reactions feature (29.7 % were clicks of the‘angry’ emoji), the Metropolitan Police informed the publicabout the identity of the attacker and encouraged people tocall an anti-terrorist hotline if they had information concer-ning him: ‘Westminster Attack: Man believed responsiblenamed . . . ’ (23 Mar 2017, 4:49 PM).
Both of these very negatively received posts providedinformation that clearly linked the reported data to a terroristincident. In contrast, in the post with the highest proportionof ‘wow’ reactions (2.1 %), Krisinformation.se bluntly askedits followers to avoid certain areas of the city: ‘Police urgethe public to avoid Sergels torg and the area around it incentral Stockholm.’ (7 Apr 2017, 3:52 PM).
The descriptive statistics in Table 2a made clear thatnegative reactions were, unsurprisingly, much more fre-quently experienced in response to crisis-related informationthan positive reactions. Nevertheless, some Facebook userssaw positive aspects in the examined posts. In the postwith the highest proportion of ‘love’ reactions (16.6 %), theMetropolitan Police reported a statement made by the familyof a police constable who had died during the attack. Theythanked the public and police for their support, stating that‘. . . we have been overwhelmed by the love and support forour family, and most especially, the outpouring of love andrespect for our Keith . . . ’ (26 Mar 2017, 1:37 PM). A photoof the victim was attached to the post.
Finally, the German Police provided some much neededcomic relief when they dispelled a rumour that a secondattack at a shopping mall was imminent, saying ‘. . . Todaythe car park of the Gropius Passagen was closed twice. Oncebecause of overfilling and once because of a broken-downcar in the driveway . . . ’ (23 Dec 2016, 5:55 PM). This posthad the highest proportion of ‘haha’ reactions (2.3 %).
Page 2531

5. Discussion
Our results show that post content influences both quantityand quality of user reactions on Facebook. Reactions werethe most negative when the ESAs shared initial informationat the onset of the crisis. The most positive reactions,however, were observed after the crisis was over, when thefamily of a deceased victim thanked the public for theirsupport. These observations are indicative of sense-makingpatterns observed elsewhere in crisis communication [34].
Posts offering condolences could be shown statisticallyto result in more emotional reactions from Facebook usersthan non-emotional posts. This aligns with previous findingsmade in the context of other social media [52], [30].
These results have important practical implications forthose operating the Facebook pages of municipalities andESAs during crises. In this context, the number of likes andshares for a post are key indicators of a post’s performance.The goal of the agencies concerned is to support communityresilience by disseminating information, warnings and theencouragement of certain behaviour rapidly to as manypeople as possible. In contrast, the posts that really gainthe most visibility in terms of likes and other reactionsare those with emotional content, which are perhaps lessimmediately useful for accomplishing the operator’s crisisresponse strategy. This is an apparent paradox: the goal ofpage owners may be to spread information, but Facebookusers seem to be the most interested in emotional content.Carter et al. [5] also raised the question whether peopleprefer emotional support from peers or official informationfrom agencies. Our results indicate that ESAs should takeadvantage of an emotional style while informing the public.
Our findings have other important implications for theFacebook pages of municipalities and ESAs. At a glance,the statistical results can be restated in the following way:
• Keep your posts concise. Doubling their length willdecrease their number of shares by a third, all elseequal.
• Use image and/or video along with text in your post. Animage will approximately double user reactions, whilea video will quadruple them.
• The most important factor, however, that determinesboth the number of shares and other reactions is thenumber of followers and other variables outside yourimmediate control. Prepare accordingly and encourageas many people as possible to subscribe to your updatesby liking or following your page.
This kind of advice is of course not entirely new [23].Suggestions to keep posts short and illustrate them arealso being circulated on popular media such as blog postsby social media marketing agencies1. However, most of
1. For example, see https://blog.hubspot.com/marketing/how-to-write-blog-post-simple-formula-ht
that evidence is anecdotal. Often it results from qualitativeobservations that have not sought to quantify the effect in aninternational, cross-cultural setting spanning several crises.Only rarely are these blog posts backed up by a publishedreproducible methodology.
The individual ESAs showed different communicationbehaviour. The Polizei Berlin and Krisinformation.se usedshorter texts and appeared to follow some guidelines, whe-reas the Metropolitan Police London mostly posted longtexts partially with direct quotes that seemed to be takenfrom their website. They may consider shortening theirfuture posts if they want their posts to be shared moreoften. On the other hand, many posts of the MetropolitanPolice London were coded as condolence which were shownstatistically to affect the number of reactions. Though topicssuch as condolences, thanks of victims etc. are not theprimary task of ESAs, their inclusion could motivate usersto like the ESA page, which in turn will increase the organicreach in the next crisis situation. Thus, ESAs might want toconsider developing ways to ’nudge’ users to actively spreadtheir information [33].
Our results also have intriguing implications for our un-derstanding of information diffusion. There were substantialdifferences between the factors leading to more likes andmore shares. Future research could examine the differencesin decision processes between these forms of user interacti-ons, and the sociological and psychological theories behindthem. These results also mean that it is valuable to studyseveral different forms of reactions in the same setting, sincethe findings may differ considerably.
Of course this research is not without limitations. Unlikethe page owners, we do not have access to the actual reachof the posts or the number of impressions, but only to thenumber of shares and likes, which must serve as proxies –and should be, for obvious theoretical reasons, very highlycorrelated with the variables of interest.
In our analysis of the reactions, we assumed that Fa-cebook’s Reactions feature makes the emotional responseto a post measurable to some degree. However, the meansreported in Table 2a show that only a fraction of Facebookusers make use of this feature. Even if its use was morewidespread, the five emojis offered could still only providea rough indicator of actual emotional reactions. Ideally, theemotions experienced by users should be measured usinga validated questionnaire or physiological response data –although such an approach would, of course, be infeasiblefor such a large number of posts and users.
In this research, we also ignored the differences betweenFacebook pages by including them as dummy variables,which future research could examine these more closely.They replaced several omitted variables, such as the ownerof the page, the number of followers, and differences inusage habits between countries, each of which could affectthe outcome. Previous research has established that com-
Page 2532

munication patterns differ considerably between crises [51].Unsurprisingly, the dummy variables had large coefficients,which shows that they indeed had a strong influence on theresults. Since these variables are outside the control of thepage owner, they are unlikely to be of immediate interestto ESAs. However, they could still be of interest to theresearch community, and in the future could be examinedindividually. The language of a post may likewise affect itsdiffusion, especially when the post is in a minority language,and it will affect text length, especially when the languagesare not closely related. Finally, the time of day and time ofyear an event occurs may affect reactions. To study theseeffects, posts will have to be collected from many morepages in a larger study that spans a longer period of time.
6. Conclusion
In this paper we argued that social media provide anopportunity for ESAs and other stakeholders to dissemi-nate information more effectively by listening out to theirreactions and optimising posts accordingly. It has becomeclear that page owners should not only care about how manyusers interact with a post, but also how they interact with it.The emotions they experience when perceiving the contentplay a role in determining how many people will see itand can benefit from it during the crisis. The possibilitiesoffered by social media in this regard are becoming moreand more detailed. If more users adopt Facebook’s Reactionsmechanism, page administrators will have a detailed pictureof how audiences react to their content and an opportunityto fine-tune their information dissemination strategies accor-dingly. We showed several ways in which measurable userreactions are influenced by the content of a post, openingthe door for further research in this area. The academiccommunity can help by carrying out evidence-based researchusing published, reproducible methods that yield quantifiableresults. The challenge is for stakeholders to closely monitorhow their audiences react. If they succeed, this will increasetheir reach and contribute to the development of moreeffective emergency management practices.
References
[1] A. Acar and Y. Muraki, “Twitter for crisis communication:lessons learned from Japan’s tsunami disaster,” Int. J. WebBased Communities, vol. 7, no. 3, pp. 392–402, 2011.
[2] D. E. Alexander, “Social Media in Disaster Risk Reductionand Crisis Management,” Science and Engineering Ethics,vol. 20, no. 3, pp. 717–733, sep 2014.
[3] S. Asur and B. Huberman, “Predicting the future with socialmedia,” in Proc. - 2010 IEEE/WIC/ACM Int. Conf. on WebIntelligence, WI 2010, vol. 1, 2010, pp. 492–499.
[4] C. Buntain, J. Golbeck, B. Liu, and G. LaFree, “EvaluatingPublic Response to the Boston Marathon Bombing and OtherActs of Terrorism through Twitter,” in Proc. 10th ICWSM,2016, pp. 555–558.
[5] L. Carter, J. B. Thatcher, and R. Wright, “Social Media andEmergency Management: Exploring State and Local Tweets,”in Proc. 47th HICSS. IEEE, jan 2014, pp. 1968–1977.
[6] D. Chaffey, “Global social media rese-arch summary 2017,” 2017. [Online]. Availa-ble: http://www.smartinsights.com/social-media-marketing/social-media-strategy/new-global-social-media-research/
[7] J. Chan and T. Comes, “Innovative research design–a journeyinto the information typhoon,” Procedia Engineering, vol. 78,pp. 52–58, 2014.
[8] T. W. Coombs, “Crisis management and communications,”2007. [Online]. Available: http://www.instituteforpr.org/crisis-management-and-communications/
[9] J. Crump, “What are the police doing on twitter? social media,the police and the public,” Policy & Internet, vol. 3, no. 4,pp. 1–27, 2011.
[10] D. Barnes et al., “Public Warning,” 2012. [On-line]. Available: http://www.eena.org/uploads/gallery/files/operations documents/2012 06 25 publicwarning.pdf
[11] B. De Longueville, R. S. Smith, and G. Luraschi, “”omg,from here, i can see the flames!”: A use case of mininglocation based social networks to acquire spatio-temporal dataon forest fires,” in Proc. Int.l Workshop Location Based SocialNetworks, ser. LBSN ’09. ACM, 2009, pp. 73–80.
[12] L. De Vries, S. Gensler, and P. Leeflang, “Popularity of brandposts on brand fan pages: An investigation of the effects ofsocial media marketing,” J. Interactive Marketing, vol. 26,no. 2, pp. 83–91, 2012.
[13] L. A. S. Denis, A. L. Hughes, and L. Palen, “Trial by fire: Thedeployment of trusted digital volunteers in the 2011 shadowlake fire,” in Proc. 9th ISCRAM, 2012.
[14] C. Ehnis, M. Mirbabaie, D. Bunker, and S. Stieglitz, “Therole of social media network participants in extreme events,”in Proc. 25th Austr. Conf. Inform. Syst., 2014.
[15] M. Eriksson and E.-K. Olsson, “Facebook and Twitter inCrisis Communication: A Comparative Study of Crisis Com-munication Professionals and Citizens,” J. Contingencies andCrisis Management, vol. 24, no. 4, pp. 198–208, dec 2016.
[16] J. D. Fraustino, B. Liu, and J. Yan, “SocialMedia Use during Disasters: A Review of theKnowledge Base and Gaps,” SMART, College Park,MD, Tech. Rep., 2012. [Online]. Available: https://www.start.umd.edu/sites/default/files/files/publications/START SocialMediaUseduringDisasters LitReview.pdf
[17] D. Gayo-Avello, “Don’t turn social media into another ’Li-terary Digest’ poll,” Commun. ACM, vol. 54, no. 10, p. 121,oct 2011.
[18] C. Grimes, M. Sakurai, V. Latinos, and T. A. Majchrzak, “Co-creating Communication Approaches for Resilient Cities inEurope: the Case of the EU Project SMR,” in Proc. 14thISCRAM. ISCRAM Assoc., 2017.
[19] A. Hermida, F. Fletcher, D. Korell, and D. Logan, “Share,like, recommend: Decoding the social media news consumer,”Journalism Studies, vol. 13, no. 5-6, pp. 815–824, 2012.
[20] S. R. Hiltz and J. Kushma, “Use of Social Media by U.S.Public Sector Emergency Managers: Barriers and Wish Lists,”in Proc. 11th ISCRAM, no. May, 2014, pp. 602–611.
[21] J. F. Home and J. E. Orr, “Assessing behaviors that createresilient organizations,” Employment Relations Today, vol. 24,no. 4, pp. 29–39, 1997.
[22] A. L. Hughes, L. A. A. St. Denis, L. Palen, and K. M.Anderson, “Online public communications by police & fireservices during the 2012 Hurricane Sandy,” in Proc. 33rdAnn. ACM CHI. ACM Press, 2014, pp. 1505–1514.
Page 2533

[23] I. Helsloot et al., “Tips and tricks for citizens & publicauthorities – How to use new media during crisis situations?”2015. [Online]. Available: http://crisislab.nl/wordpress/wp-content/uploads/Final-Guidelines -Crisislab-website-1.pdf
[24] C. Johnson and S. Blackburn, “Advocacy for urban resilience:Unisdr’s making cities resilient campaign,” Environment andUrbanization, vol. 26, no. 1, pp. 29–52, 2014.
[25] W. Jong and M. L. Duckers, “Self-correcting mechanisms andecho-effects in social media: An analysis of the “gunman inthe newsroom” crisis,” Comp. in Human Behavior, vol. 59,pp. 334–341, jun 2016.
[26] A. M. Kaplan and M. Haenlein, “Users of the world, unite!The challenges and opportunities of Social Media,” Bus.Horizons, vol. 53, no. 1, pp. 59–68, jan 2010.
[27] J. H. Kietzmann, K. Hermkens, I. P. McCarthy, and B. S.Silvestre, “Social media? Get serious! Understanding thefunctional building blocks of social media,” Bus. Horizons,vol. 54, no. 3, pp. 241–251, may 2011.
[28] S. Krug, “Reactions Now Available Globally,” 2016. [Online].Available: https://newsroom.fb.com/news/2016/02/reactions-now-available-globally/
[29] H. Kwak, C. Lee, H. Park, and S. Moon, “What is twitter,a social network or a news media?” in Proc. 19th Int. Conf.World Wide Web, ser. WWW ’10. ACM, 2010, pp. 591–600.
[30] A. O. Larsson, “Diversifying Likes,” J.ism Practice, no.January, feb 2017.
[31] M. Latonero and I. Shklovski, “Emergency Management,Twitter, and Social Media Evangelism,” IJISCRAM, vol. 3,no. 4, pp. 1–16, 2011.
[32] K. Leetaru, “Does Social Media Actually Re-flect Reality?” Forbes, 2016. [Online]. Availa-ble: https://www.forbes.com/sites/kalevleetaru/2016/02/16/does-social-media-actually-reflect-reality
[33] C. Meske and T. Potthoff, “The DINU model – A processmodel for the design of nudges,” in Proc. 25th ECIS, 2017.
[34] M. Mirbabaie and E. Zapatka, “Sensemaking in Social Me-dia Crisis Communication - A Case Study on the BrusselsBombings in 2016,” in Proc. 25th ECIS, 2017.
[35] R. Munro and C. D. Manning, “Short message communicati-ons: users, topics, and in-language processing,” in Proc. 2ndACM Symp. Computing for Development, 2012.
[36] National Research Council, Public response to alerts andwarnings on mobile devices: Summary of a workshop on cur-rent knowledge and research gaps. The National AcademiesPress, 2011.
[37] O. Oh, M. Agrawal, and H. R. Rao, “Community Intelligenceand Social Media Services: A Rumor Theoretic Analysis ofTweets During Social Crises,” MIS Quart., vol. 37, no. 2, pp.407–426, 2013.
[38] J. O’Sullivan, R. Bradford, M. Bonaiuto, S. De Dominicis,P. Rotko, J. Aaltonen, K. Waylen, and S. Langan, “Enhancingflood resilience through improved risk communications,” Nat.Hazard Earth Sys., vol. 12, no. 7, p. 2271, 2012.
[39] C. Pool and M. Nissim, “Distant supervision for emotiondetection using Facebook reactions,” in Proc. Workshop Com-putational Modeling of People’s Opinions, Personality, andEmotions in Social Media, 2016, pp. 30–39.
[40] Y. Qu, C. Huang, P. Zhang, and J. Zhang, “Harnessingsocial media in response to major disasters,” in CSCW 2011Workshop, 2011.
[41] R Core Team, R: A Language and Environment for StatisticalComputing, R Foundation for Statistical Computing, Vienna,Austria, 2016.
[42] J. Radianti, S. R. Hiltz, and L. Labaka, “An overview of publicconcerns during the recovery period after a major earthquake:Nepal twitter analysis,” in Proc. 49th HICSS, Jan 2016, pp.136–145.
[43] C. Reuter, T. Ludwig, M.-A. Kaufhold, and V. Pipek,“XHELP: Design of a Cross-Platform Social-Media Applica-tion to Support Volunteer Moderators in Disasters,” in Proc.33rd Ann. ACM CHI. ACM Press, 2015, pp. 4093–4102.
[44] B. Ross, M. Rist, G. Carbonell, B. Cabrera, N. Kurowsky,and M. Wojatzki, “Measuring the Reliability of Hate SpeechAnnotations: The Case of the European Refugee Crisis,” inProc. of NLP4CMC III, ser. Bochumer Linguistische Arbeits-berichte, vol. 17, Bochum, sep 2016, pp. 6–9.
[45] A. Ruggiero and M. Vos, “Terrorism Communication: Cha-racteristics and Emerging Perspectives in the Scientific Li-terature 2002-2011,” J. Contingencies and Crisis Manage.,vol. 21, no. 3, pp. 153–166, sep 2013.
[46] D. Ruths and J. Pfeffer, “Social media for large studies ofbehavior,” Science, vol. 346, no. 6213, pp. 1063–1064, 2014.
[47] M. Sakurai and R. T. Watson, “Securing communication chan-nels in severe disaster situations - Lessons from a Japaneseearthquake,” in Proc. 12th ISCRAM, L. Palen, M. Buscher,T. Comes, and A. Hughes, Eds. University of Agder (UiA),2015, pp. 288–299.
[48] N. Serrano, J. Hernantes, T. A. Majchrzak, and M. Sakurai,“Resilience information portal,” in Proc. 14th ISCRAM. IS-CRAM Assoc., 2017.
[49] S. C. Simmons, T. A. Murphy, A. Blanarovich, F. T. Work-man, D. A. Rosenthal, and M. Carbone, “Telehealth techno-logies and applications for terrorism response: a report of the2002 coastal north carolina domestic preparedness trainingexercise,” J. Amer. Medical Informatics Assoc., vol. 10, no. 2,pp. 166–176, 2003.
[50] T. Simon, A. Goldberg, D. Leykin, and B. Adini, “Kidnappingwhatsapp–rumors during the search and rescue operation ofthree kidnapped youth,” Comput. in Human Behavior, vol. 64,pp. 183–190, 2016.
[51] S. Stieglitz, D. Bunker, M. Mirbabaie, and C. Ehnis, “Sense-making in social media during extreme events,” J. Contingen-cies and Crisis Manage., 2017.
[52] S. Stieglitz and L. Dang-Xuan, “Emotions and InformationDiffusion in Social Media—Sentiment of Microblogs andSharing Behavior,” J. Manage. Inform. Syst., vol. 29, no. 4,pp. 217–248, 2013.
[53] S. Stieglitz, L. Dang-Xuan, A. Bruns, and C. Neuberger,“Social Media Analytics - An Interdisciplinary Approach andIts Implications for Information Systems,” Bus. & Inform.Syst. Eng., vol. 6, no. 2, pp. 89–96, apr 2014.
[54] R. Subba and T. Bui, “Online Convergence Behavior, SocialMedia Communications and Crisis Response: An EmpiricalStudy of the 2015 Nepal Earthquake Police Twitter Project,”in Proc. 50th HICSS, 2017, pp. 284–293.
[55] J. N. Sutton, L. Palen, and I. Shklovski, Backchannels onthe front lines: Emergency uses of social media in the 2007Southern California Wildfires. University of Colorado, 2008.
[56] W. N. Venables and B. D. Ripley, Modern Applied Statisticswith S, 4th ed. New York: Springer, 2002.
[57] C. Wendling, J. Radisch, and S. Jacobzone, “The Use ofSocial Media in Risk and Crisis Communication,” OECDWorking Papers on Public Governance, no. 24, 2013.
[58] J. Yin, A. Lampert, M. Cameron, B. Robinson, and R. Po-wer, “Using Social Media to Enhance Emergency SituationAwareness,” IEEE Intelligent Sys., vol. 27, no. 6, pp. 52–59,nov 2012.
Page 2534