Embed Size (px)
Citation preview
Examensarbete för kandidatexamen, 15 hp
Agronomprogrammet – Husdjur
Institutionen för husdjurens utfodring och vård, 572
Uppsala 2016
Faculty of Veterinary Medicine and Animal Science
Department of Animal Nutrition and Management
The Dietary Cation-Anion Difference and its Impact on the Milk Production in Dairy Cows
Maria Eklund

The Dietary Cation-Anion Difference and its Impact on the Milk Production in Dairy Cows Fodrets katjon-anjonbalans och dess påverkan på mjölkproduktion hos kor Maria Eklund Supervisor: Cecilia Kronqvist, SLU, Department of Animal Nutrition and Management
Examiner: Kjell Holtenius, SLU, Department of Animal Nutrition and Management
Extent: 15 hp
Course title: Bachelor project in Animal Science
Course code: EX0553
Programme: Animal agronomy
Level: Basic G2E
Place of publication: Uppsala
Year of publication: 2016
Series name, part no: Examensarbete / Sveriges lantbruksuniversitet, Institutionen för husdjurens utfodring och
vård, 572
On-line published: http://epsilon.slu.se
Omslagsbild: Maria Eklund
Nyckelord: Acidos, buffert, CAB, foderutnyttjande, foderstat, makromineraler, mineraler,
mjölkavkastning, mjölkko, mjölksammansättning.
Key words: Acidosis, buffer, CAD, DCAD, feed efficiency, feed ration, macro minerals, milk
composition, milk yield.

1
Sammanfattning
Katjon-anjonbalasen i fodret (DCAD) uttrycker skillnaden mellan viktiga makromineraler
med hänsyn till deras laddningar i jonform. Uträkningen kan skrivas DCAD:S = Na++K+-Cl--
S2- eller DCAD:Cl = Na++K+-Cl-. Syftet med denna litteraturstudie var att undersöka om det
finns en optimal DCAD-nivå för lakterande kor och hur detta DCAD-värde skulle påverka
foderstaten hos kor under laktation.
Torrsubstansintaget (DMI) och mjölkavkastningen påverkas positivt av ett höjt DCAD. En
stagnation/topp för DMI respektive mjölkavkastning ses inom intervallet 300-600 mEq/kg
torrsubstans (ts), där DMI når stagnation/topp vid ett något högre DCAD än
mjölkavkastningen. DMI antas öka som en effekt av en förbättrad metabolisk balans och
våmmiljö, samt en potentiellt ökad smaklighet på fodret. Det råder tvetydighet om
proteinmängden i mjölken ökar eller förblir opåverkad av ett höjt DCAD. Däremot antas
proteinprocenten påverkas av spädningseffekter från mjölkavkastningen. Mjölkfettmängden
per dag ökar med ett höjt DCAD. Ökningen i både mjölkavkastning och fettmängd anses
bland annat bero på ett ökat DMI. Ett höjt DCAD antas också ha en indirekt och positiv
påverkan på foderomvandlingsförmågan hos kor. En grundfoderstat kan antas ha ett DCAD
mellan cirka 250 till 350 mEq/kg ts. Om man jämför detta intervall med olika DCAD-nivåers
påverkan på mjölkavkastning och DMI, kan man dra slutsatsen att mjölkkor som utfodras
enligt aktuella utfodringsrekommendationer inte behöver korrigera DCAD-nivån i foderstaten
för att optimera mjölkproduktionen.
Abstract
The dietary cation-anion difference (DCAD) expresses the difference between important
macro minerals considering their charges. The calculation can be written DCAD:S = Na++K+-
Cl--S2- or DCAD:Cl = Na++K+-Cl-. The aim of this literature review was to investigate
whether there is an optimal DCAD among lactating dairy cows and how this would affect the
feed ration of dairy cattle during lactation.
The dry matter intake (DMI), as well as milk yield, is shown to increase with increasing
DCAD. A stagnation/top, for DMI as well as milk yield, is shown in the range of about 300-
600 mEq/kg dry matter (DM), where the top of DMI is slightly above the milk yield. The
DMI is thought to increase due to an improved metabolic- and ruminal balance as well as a
potentially increased palatability of the feed. There is ambiguity whether the protein yield
increases or remains unaffected with increasing DCAD. However, the protein percentage is
thought to be affected by dilution regarding the milk yield. The total amount of fat per day is
shown to increase with increasing DCAD. The increased fat yield, as well as milk yield, may
originate from an increased DMI. An increased DCAD is also suggested to indirectly improve
the feed efficiency. The basal feed ration has a DCAD between about 250 to 350 mEq/kg
DM. When comparing this interval to the different DCAD-levels impact on DMI and milk
yield, it is suggested that dairy cattle that are fed according to the current feeding
recommendations, do not need to alter the DCAD-level to improve the production.
2
Introduction
It is generally known that plant based feedstuffs usually are contributing to an alkalizing diet.
The chemical property of the diet affects parameters such as blood buffers, urinary pH and
secretion of different minerals in the urine (West et al., 1991; Roche et al., 2005; Martins et
al., 2015). In contrast to the alkalizing diet, it is well known that acidifying, anionic diets
prepartum reduces the incidence of milk fever (parturient paresis) (Block, 1984; Ender et al.,
1971, Goff et al., 1991). The reduction of parturient paresis is due to the dietary introduced
weak metabolical acidosis (Vagg & Payne, 1970), which is achieved by altering the ratio of
strong anions and cations in the feed (McDonald et al., 2011; Iwaniuk & Erdman, 2015).
The overall metabolic impact of changes in the ratio of anions and cations in the feed (Oetzel
et al., 1991; Martins et al., 2016) suggests that the dietary cation anion difference (DCAD)
has an impact also in other stages than prepartum in the cow’s production cycle. It is therefore
suggested that the level of DCAD in the feed has an effect on the dairy cattle’s milk
production. The aim of this literature review is therefore to clarify the concept and effects of
DCAD, in relation to common cattle feed and how different levels of DCAD affect the
lactating cow considering milk production and feed efficiency, when the risk of milk fever,
adjacent to partum, have subsided. Is there an optimal DCAD-level to optimize the milk
production and feed efficiency? And if there is an optimal DCAD-level, what would it imprint
in the feed ration?
Calculation of the cation-anion difference
The cation anion difference (CAD) is a measurement of the difference between important
macro minerals; sodium (Na), potassium (K), chloride (Cl) and sulfur (S) (McDonald et al.,
2011). CAD can be calculated as milliequivalents (mEq) (Sanchez & Beede, 1996), which is a
common way of measuring ions in low concentrations (Denniston et al., 2008), but millimolar
of charge (mmolc) can also be used (Tremblay et al., 2006). The CAD are applied in the feed
ration by calculating the dietary cation-anion difference (DCAD). The calculations of CAD
and DCAD are identical, but DCAD is expressed as mEq/kg dry matter (DM) (Hu & Murphy,
2004; Wildman et al., 2007a; Iwaniuk & Erdman, 2015).
DCAD can be achieved by calculating (Hu & Murphy, 2004; Wildman et al., 2007a):
DCAD:S = Na+ + K+ - Cl- - S2-/kg DM.
or
DCAD:Cl = Na++K+-Cl- /kg DM.
Different calculations of DCAD are used in different studies (Iwaniuk et al., 2015; Apper-
Bossard et al., 2006), but according to Hu et al. (2007) are cows rarely supplemented with
sulfur. This contributes to a small variation in the supplements independently of the present or
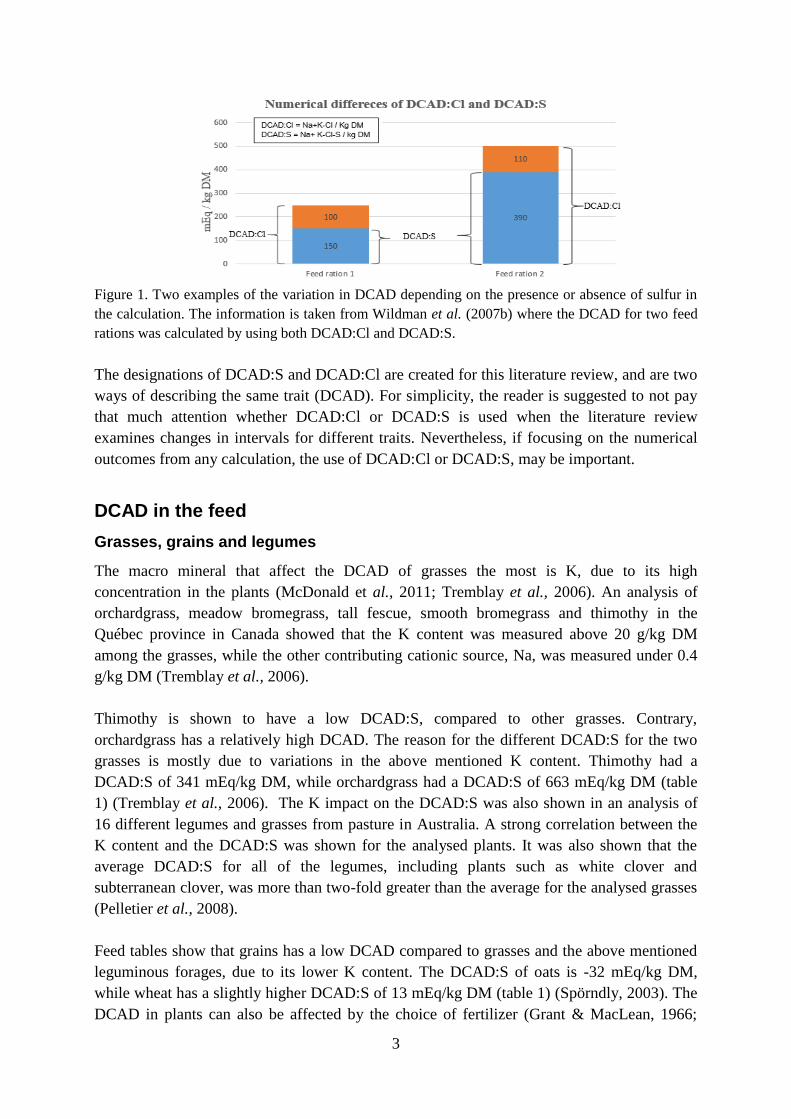
absence of sulphur in the calculation. However, numerical differences are notable (figure 1)
(Wildman et al., 2007b).
3
Figure 1. Two examples of the variation in DCAD depending on the presence or absence of sulfur in
the calculation. The information is taken from Wildman et al. (2007b) where the DCAD for two feed
rations was calculated by using both DCAD:Cl and DCAD:S.
The designations of DCAD:S and DCAD:Cl are created for this literature review, and are two
ways of describing the same trait (DCAD). For simplicity, the reader is suggested to not pay
that much attention whether DCAD:Cl or DCAD:S is used when the literature review
examines changes in intervals for different traits. Nevertheless, if focusing on the numerical
outcomes from any calculation, the use of DCAD:Cl or DCAD:S, may be important.
DCAD in the feed
Grasses, grains and legumes
The macro mineral that affect the DCAD of grasses the most is K, due to its high
concentration in the plants (McDonald et al., 2011; Tremblay et al., 2006). An analysis of
orchardgrass, meadow bromegrass, tall fescue, smooth bromegrass and thimothy in the
Québec province in Canada showed that the K content was measured above 20 g/kg DM
among the grasses, while the other contributing cationic source, Na, was measured under 0.4
g/kg DM (Tremblay et al., 2006).
Thimothy is shown to have a low DCAD:S, compared to other grasses. Contrary,
orchardgrass has a relatively high DCAD. The reason for the different DCAD:S for the two
grasses is mostly due to variations in the above mentioned K content. Thimothy had a
DCAD:S of 341 mEq/kg DM, while orchardgrass had a DCAD:S of 663 mEq/kg DM (table
1) (Tremblay et al., 2006). The K impact on the DCAD:S was also shown in an analysis of
16 different legumes and grasses from pasture in Australia. A strong correlation between the
K content and the DCAD:S was shown for the analysed plants. It was also shown that the
average DCAD:S for all of the legumes, including plants such as white clover and
subterranean clover, was more than two-fold greater than the average for the analysed grasses
(Pelletier et al., 2008).
Feed tables show that grains has a low DCAD compared to grasses and the above mentioned
leguminous forages, due to its lower K content. The DCAD:S of oats is -32 mEq/kg DM,
while wheat has a slightly higher DCAD:S of 13 mEq/kg DM (table 1) (Spörndly, 2003). The
DCAD in plants can also be affected by the choice of fertilizer (Grant & MacLean, 1966;
4
Pelletier et al., 2006; Charbonneau et al., 2009), as well as season (Pelletier et al., 2008) and
stage of development (Pelletier et al., 2006).
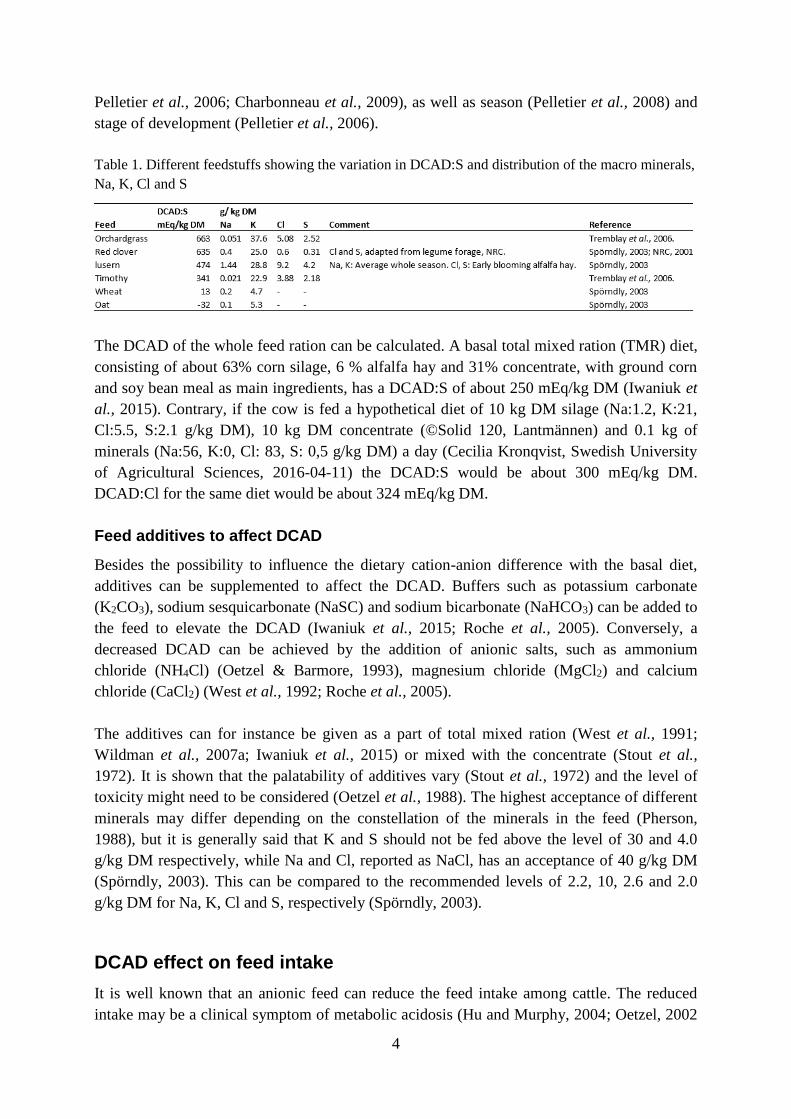
Table 1. Different feedstuffs showing the variation in DCAD:S and distribution of the macro minerals,
Na, K, Cl and S
The DCAD of the whole feed ration can be calculated. A basal total mixed ration (TMR) diet,
consisting of about 63% corn silage, 6 % alfalfa hay and 31% concentrate, with ground corn
and soy bean meal as main ingredients, has a DCAD:S of about 250 mEq/kg DM (Iwaniuk et
al., 2015). Contrary, if the cow is fed a hypothetical diet of 10 kg DM silage (Na:1.2, K:21,
Cl:5.5, S:2.1 g/kg DM), 10 kg DM concentrate (©Solid 120, Lantmännen) and 0.1 kg of
minerals (Na:56, K:0, Cl: 83, S: 0,5 g/kg DM) a day (Cecilia Kronqvist, Swedish University
of Agricultural Sciences, 2016-04-11) the DCAD:S would be about 300 mEq/kg DM.
DCAD:Cl for the same diet would be about 324 mEq/kg DM.
Feed additives to affect DCAD
Besides the possibility to influence the dietary cation-anion difference with the basal diet,
additives can be supplemented to affect the DCAD. Buffers such as potassium carbonate
(K2CO3), sodium sesquicarbonate (NaSC) and sodium bicarbonate (NaHCO3) can be added to
the feed to elevate the DCAD (Iwaniuk et al., 2015; Roche et al., 2005). Conversely, a
decreased DCAD can be achieved by the addition of anionic salts, such as ammonium
chloride (NH4Cl) (Oetzel & Barmore, 1993), magnesium chloride (MgCl2) and calcium
chloride (CaCl2) (West et al., 1992; Roche et al., 2005).
The additives can for instance be given as a part of total mixed ration (West et al., 1991;
Wildman et al., 2007a; Iwaniuk et al., 2015) or mixed with the concentrate (Stout et al.,
1972). It is shown that the palatability of additives vary (Stout et al., 1972) and the level of
toxicity might need to be considered (Oetzel et al., 1988). The highest acceptance of different
minerals may differ depending on the constellation of the minerals in the feed (Pherson,
1988), but it is generally said that K and S should not be fed above the level of 30 and 4.0
g/kg DM respectively, while Na and Cl, reported as NaCl, has an acceptance of 40 g/kg DM
(Spörndly, 2003). This can be compared to the recommended levels of 2.2, 10, 2.6 and 2.0
g/kg DM for Na, K, Cl and S, respectively (Spörndly, 2003).
DCAD effect on feed intake
It is well known that an anionic feed can reduce the feed intake among cattle. The reduced
intake may be a clinical symptom of metabolic acidosis (Hu and Murphy, 2004; Oetzel, 2002
5
in Gelfert et al., 2006) or caused by reduced palatability of the feed (Stout et al., 1972; Oetzel
& Barmore, 1993; Hu & Murphy, 2004). An experiment of 29 cows, mainly crosses of
Norwegian red breed and Norwegian red poll, prepartum and early postpartum, showed that
the cows fed the acidifying diet had a lower feed intake than the ones fed the alkalizing diet
(Ender et al., 1971). Another experiment, where different anionic salts was supplemented in
the concentrate, among non-lactating, pregnant cattle, showed that the intake of the
concentrate-salt-mixture reduced gradually when increasing the supplementation of the
anionic salts. The reduction was however not as big for magnesium sulfate (MgSO4)
compared to the other anionic salts in the experiment (calcium chloride (CaC12), ammonium
chloride (NH4Cl) and ammonium sulfate ((NH4)2SO4)) (Oetzel & Barmore, 1993).
Contrary, when feeding cattle a neutral and positive DCAD:Cl in the range of 0 to 375
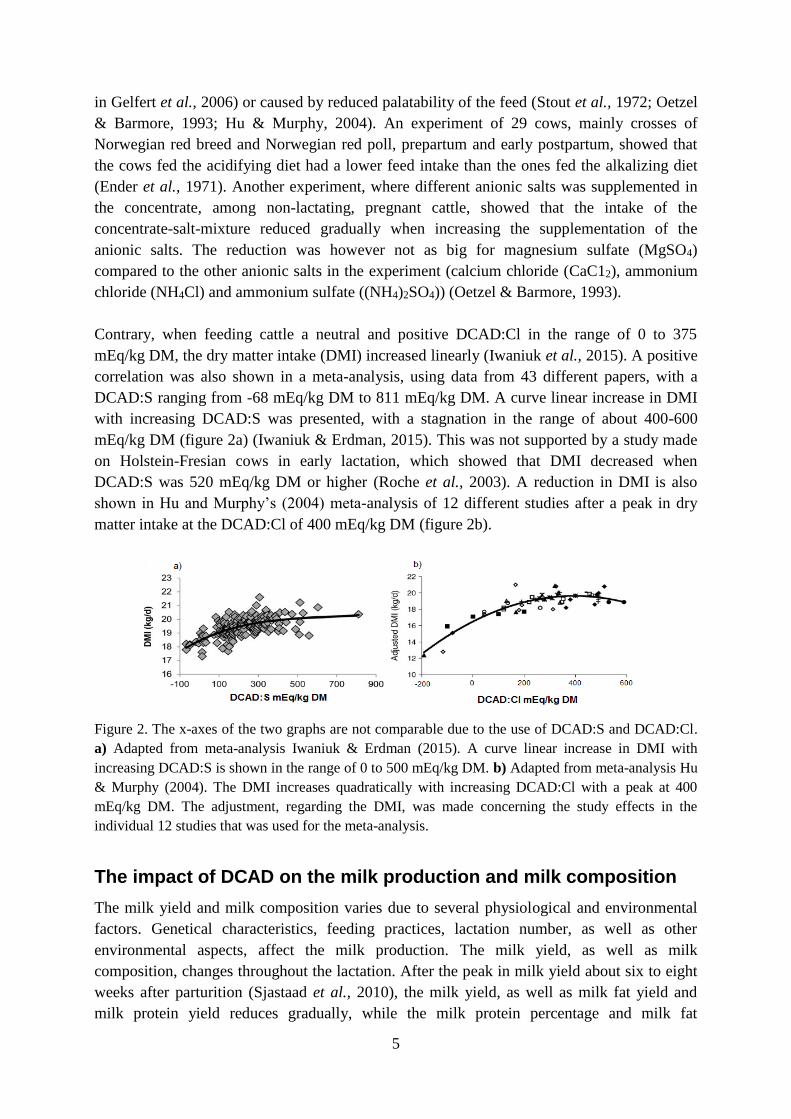
mEq/kg DM, the dry matter intake (DMI) increased linearly (Iwaniuk et al., 2015). A positive
correlation was also shown in a meta-analysis, using data from 43 different papers, with a
DCAD:S ranging from -68 mEq/kg DM to 811 mEq/kg DM. A curve linear increase in DMI
with increasing DCAD:S was presented, with a stagnation in the range of about 400-600
mEq/kg DM (figure 2a) (Iwaniuk & Erdman, 2015). This was not supported by a study made
on Holstein-Fresian cows in early lactation, which showed that DMI decreased when
DCAD:S was 520 mEq/kg DM or higher (Roche et al., 2003). A reduction in DMI is also
shown in Hu and Murphy’s (2004) meta-analysis of 12 different studies after a peak in dry
matter intake at the DCAD:Cl of 400 mEq/kg DM (figure 2b).
Figure 2. The x-axes of the two graphs are not comparable due to the use of DCAD:S and DCAD:Cl.
a) Adapted from meta-analysis Iwaniuk & Erdman (2015). A curve linear increase in DMI with
increasing DCAD:S is shown in the range of 0 to 500 mEq/kg DM. b) Adapted from meta-analysis Hu
& Murphy (2004). The DMI increases quadratically with increasing DCAD:Cl with a peak at 400
mEq/kg DM. The adjustment, regarding the DMI, was made concerning the study effects in the
individual 12 studies that was used for the meta-analysis.
The impact of DCAD on the milk production and milk composition
The milk yield and milk composition varies due to several physiological and environmental
factors. Genetical characteristics, feeding practices, lactation number, as well as other
environmental aspects, affect the milk production. The milk yield, as well as milk
composition, changes throughout the lactation. After the peak in milk yield about six to eight
weeks after parturition (Sjastaad et al., 2010), the milk yield, as well as milk fat yield and
milk protein yield reduces gradually, while the milk protein percentage and milk fat
6
percentage increases throughout the lactation (Silvestre et al., 2009). It is also shown that the
DCAD has an impact on milk yield (Hu & Murphy, 2004; Iwaniuk & Erdman, 2015; Roche et
al., 2003) as well as milk composition (Wildman et al., 2007b; Iwaniuk et al., 2015; Iwaniuk
& Erdman, 2015), which will be examined below.
Milk yield
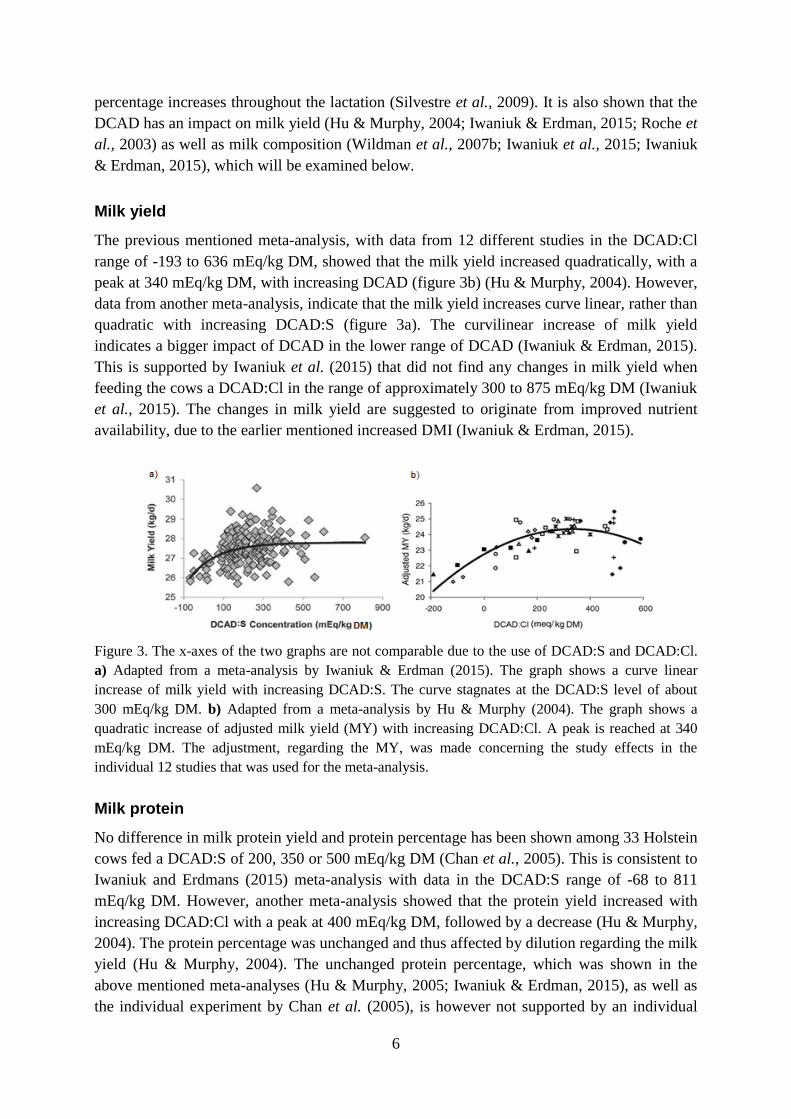
The previous mentioned meta-analysis, with data from 12 different studies in the DCAD:Cl
range of -193 to 636 mEq/kg DM, showed that the milk yield increased quadratically, with a
peak at 340 mEq/kg DM, with increasing DCAD (figure 3b) (Hu & Murphy, 2004). However,
data from another meta-analysis, indicate that the milk yield increases curve linear, rather than
quadratic with increasing DCAD:S (figure 3a). The curvilinear increase of milk yield
indicates a bigger impact of DCAD in the lower range of DCAD (Iwaniuk & Erdman, 2015).
This is supported by Iwaniuk et al. (2015) that did not find any changes in milk yield when
feeding the cows a DCAD:Cl in the range of approximately 300 to 875 mEq/kg DM (Iwaniuk
et al., 2015). The changes in milk yield are suggested to originate from improved nutrient
availability, due to the earlier mentioned increased DMI (Iwaniuk & Erdman, 2015).
Figure 3. The x-axes of the two graphs are not comparable due to the use of DCAD:S and DCAD:Cl.
a) Adapted from a meta-analysis by Iwaniuk & Erdman (2015). The graph shows a curve linear
increase of milk yield with increasing DCAD:S. The curve stagnates at the DCAD:S level of about
300 mEq/kg DM. b) Adapted from a meta-analysis by Hu & Murphy (2004). The graph shows a
quadratic increase of adjusted milk yield (MY) with increasing DCAD:Cl. A peak is reached at 340
mEq/kg DM. The adjustment, regarding the MY, was made concerning the study effects in the
individual 12 studies that was used for the meta-analysis.
Milk protein
No difference in milk protein yield and protein percentage has been shown among 33 Holstein
cows fed a DCAD:S of 200, 350 or 500 mEq/kg DM (Chan et al., 2005). This is consistent to
Iwaniuk and Erdmans (2015) meta-analysis with data in the DCAD:S range of -68 to 811
mEq/kg DM. However, another meta-analysis showed that the protein yield increased with
increasing DCAD:Cl with a peak at 400 mEq/kg DM, followed by a decrease (Hu & Murphy,
2004). The protein percentage was unchanged and thus affected by dilution regarding the milk
yield (Hu & Murphy, 2004). The unchanged protein percentage, which was shown in the
above mentioned meta-analyses (Hu & Murphy, 2005; Iwaniuk & Erdman, 2015), as well as
the individual experiment by Chan et al. (2005), is however not supported by an individual
7
study by Wildman et al. (2007b) which showed an increased milk protein percentage when
elevating DCAD:S from 250 to 500 mEq/kg DM.
If decreasing the DCAD by adding (NH4)2SO4 to the feed, the concentration of κ-casein
increases in the milk. The concentration of α- and β-casein is however unaffected (Martins et
al., 2016). It has been found that the concentration of ionised calcium (iCa), together with the
altered distribution of proteins, affect the milks ability to sustain through heat treatments. The
formation of coagulates in the milk was more likely to occur at 140˚C with decreasing
DCAD:S (in the range of 290 to -71 mEq/kg DM). This is suggested to be due to changes in
chemical properties of the micelles in the milk (Martins et al., 2016; Barros et al. in Martins
et al., 2016) because of a reduced iCa and the mentioned altered concentrations of different
milk proteins. Ethanol tests can also be made to analyse the stability of the milk. Milk that
tolerates an ethanol mixture of 68% ethanol is said to be of good quality (FAO et al., 2016).
In the mentioned study, less ethanol was needed to precipitate the milk from cows fed a lower
DCAD (Martins et al., 2016).
Milk fat
The total amount of fat per day increases with increasing DCAD (Hu & Murphy, 2004;
Iwaniuk & Erdman, 2015). Iwaniuk and Erdman (2015) describes a linear increase, while Hu
and Murphy (2004) outlines a quadratic increase with a peak at 550 mEq/kg DM. Further,
there is ambiguity if the milk fat percentage is affected by the DCAD-level or not. Two
studies, by Chan et al. (2005) and the earlier mentioned meta-analysis of 12 studies, show that
DCAD has no effect on milk fat percentage (Chan et al., 2005; Hu & Murphy, 2004). Chan et
al. (2005) used a DCAD:S of 200-500 mEq/kg DM, while the meta-analysis used data in the
DCAD:Cl range of -191 to 636 mEg/kg DM. Contrary, an experiment of DCAD:Cl in the
range of 300 to 875 mEq/kg DM, showed a positive correlation between DCAD and milk fat
percentage (Iwaniuk et al., 2015), and so did a recently published meta-analysis on DCAD:S
with data from 43 experiments (Iwaniuk & Erdman, 2015).
Buffers has the ability to stabilize pH at (or close to) the equilibrium for different acids and
bases together with their conjugates (Denniston et al., 2011). Buffers has the ability to prevent
the ruminal pH from being reduced by the acids that are produced by the microorganisms
(McDonald et al., 2011) and since a positive DCAD may be supplemented as a buffer, it will
contribute to an elevated pH in the rumen (Hu & Murphy, 2004; Jenkins et al., 2014). Hu and
Murphy (2004) mentioned the correlation between milk fat percentage and ruminal pH as a
reason for the elevated milk fat yield with increasing DCAD. The buffering effect also
contributes to rearrangements of conjugated linoleic acids (CLA) in the rumen (Jenkins et al.,
2014) which also is suggested to contribute to the elevated fat content in the milk with
increasing DCAD (Iwaniuk & Erdman, 2015). The rearrangement of CLA is supposed to
affect the fat content, since the formation of some CLA, affect the lipid metabolism of the
cow if reaching the duodenum. For example, CLA such as trans-10,cis-12-CLA, that
increases with a reduced ruminal pH, will affect the milk fat content negatively (Maxin et al.,
2011; McDonald et al., 2011).
8
The proportion of different fatty acids (FA) in the milk changes according to DCAD:S. The
concentration of 16:0 fatty acid increases linearly with increasing DCAD:S in the range of
230-880 mEq/kg DM, while the concentration of fatty acids of 17:0 to 20:0 decreases (Roche
et al., 2005). The reason for the changed distribution of FA was supposed to be due to the
enhanced DMI, which nevertheless did not increase significantly in the current experiment
(Roche et al., 2005).
Effect of the Na:K ratio
The Na:K ration can be modified at a constant or variable level of DCAD (Wildman et al.,
2007a; Iwaniuk et al., 2015). No effect on milk proteins has been shown when altering the
Na:K ratio (Wildman et al., 2007a), but according to an experiment by Sanchez et al. (1994),
it has an effect on DMI.
An elevated Na:K ratio is shown to increase the fat percentage and also the fat corrected milk
(FCM) at a constant supplemental DCAD:Cl of 150 mEq/kg DM (Iwaniuk et al., 2015). The
supplemented Na:K ratio of 100:0 resulted in highest milk fat percentage and fat yield, with a
total of 1.250 g of fat in the milk per day and 3.36 % fat compared to the reversed ratio of
0:100 that had 3.06 % fat and 1.132 g of fat per day in the milk (Iwaniuk et al., 2015).
Another experiment on 42 Holstein cows, showed no differences in milk fat percentage and
milk fat yield depending on the Na:K ratio at the DCAD:Cl of 410 and 580 mEq/kg of DM,
respectively. Besides, when observing the average of the whole set of experimental data, a
curvilinear change was seen regarding milk yield and energy corrected milk. Both ECM and
milk yield decreased significantly when decreasing the Na:K from 1:2 to 1:3, followed by an
increase at a ratio of 1:4 (Wildman et al., 2007a). A similar relationship was also observed on
DMI when comparing the performance of 48 Holstein cows in mid lactation. A high Na:K
ratio, as well as a low Na:K ratio, had the most positive effect on the DMI (Sanchez et al.
1994). Further, an increased Na:K ratio, is shown to elevate the amount of fat corrected milk
per kg dry matter intake (FCM/DMI) in a linear manner (Iwaniuk et al., 2015). Contrary, Hu
and Kung (2009) could not find any changes in milk composition at different Na:K ratios at a
DCAD:S of 330 mEq/kg DM.
DCAD and feed efficiency
It is suggested that an increased DCAD has positive effects on the microbe population in the
rumen when increasing the DCAD by adding a cationic buffer (Wildman et al., 2007b;
Apper-Bossard et al., 2010). At certain circumstances, the buffering effect enhances the
protein utilization in the feed (Wildman et al., 2007b), but Martins et al. (2015), further
suggests that the macro minerals themselves may affect the ruminal environment.
When elevating the DCAD:S from 220 mEq/kg DM to 470 mEq/kg DM, by supplementing a
cationic buffer, the amount of proteins reaching the duodenum increases (Hu et al., 2007).
Another experiment made on eight Holstein cows, fed two different levels of crude protein
(CP), above and under the nutritional requirements, indicated an enhanced protein utilization
9
when elevating the DCAD:Cl for the low CP diet. The protein percentage increased
significantly when increasing the DCAD:Cl from 250 mEq/kg DM to 500 mEq/kg DM
among cows fed the low CP diet. This was not the case in the high CP diet, where no
difference in CP utilization and milk protein percentage was shown. These findings are
suggested to be due to the improved ruminal environment. This may enable a reduction in
protein requirements of dairy cattle, and thereby reduce the losses of nitrogen in the manure
(Wildman et al., 2007b).
It is further shown that the digestibility of neutral detergent fibre (NDF) increased with 6.38%
when feeding dairy cattle an elevated DCAD:S in the range of -71 to 290 mEq/kg DM. The
elevated DCAD was achieved by adding the buffer NaHCO3. The enhanced NDF digestibility
may be due the elevated pH in the rumen, which enhances the activity of cellulolytic bacteria
(Martins et al., 2015).
DCAD in the feed ration
The requirements of Na, K, Cl and S can all be found in the Swedish feed table for ruminants
(Spörndly, 2003). The recommendations, for cows that are producing more than 30 kg of milk
per day, are 2.2, 10, 2.6 and 2.0 g/kg DM of Na, K, Cl and S, respectively (Spörndly, 2003).
These recommendations can be used to calculate DCAD:S, which in this case is 247 mEq/kg
DM, while DCAD:Cl is 278 mEq/kg DM. However, Chan et al. (2005) emphasizes that the
ideal level of DCAD among lactating dairy cattle is not outlined, and that the optimal level
might vary depending on weather conditions.
A compilation of ten different studies at the University of Florida, suggests that that the
optimal level of DCAD:Cl in the feed for dairy cows is between 250 to 500 mEq/kg of DM
(Sanchez & Beede, 1996). Their suggestion is based on the fact that the milk yield, DMI, as
well as FCM had a peak at 380 mEq/kg DM. Negative changes was however only seen below
250 and above 500 mEq/kg DM, which therefore was suggested to be the optimal DCAD:Cl
range (Sanchez and Beede, 1996). This is supported by the fact that Roche et al. (2005)
suggested a DCAD:S above 200 mEq/kg of DM to dairy cows on pasture. The suggestion was
based on a positive, but not significant, trend in DMI as well as milk yield with increasing
DCAD:S in the range of 230 to 880 mEq/kg DM (Roche et al., 2005). Whether these
suggestions are relevant or not, considering an optimal DCAD, will be examined in the
upcoming discussion.
Discussion
The dietary cation anion difference is a wide subject with a lot of physiological effects on the
dairy cow, independently of the stage of lactation or pregnancy (Oetzel et al., 1991; Martins
et al., 2016). It is however questioned if these bodily effects are important to think about
when considering milk production, milk composition as well as feed efficiency. The literature
review clearly states that an increased DCAD, to a certain level, has positive effects on DMI,
10
as well as milk yield and milk fat yield. These are some of the aspects that will be discussed
below.
Considering the milk yield, the meta-analysis of Hu and Murphy (2004) shows a peak at a
DCAD:Cl of 340 mEq/kg DM, followed by a decrease. This decrease was not shown in a later
published meta-analysis, by Iwaniuk et al. (2015) that rather showed a curvelinear increase,
with a stagnation at the DCAD:S of about 300 mEg/kg DM. Whether there is an distinct
optimum, followed by a decrease, or if the progress of the curve should be labelled as a
stagnation, is difficult to answer due to the fact that there was less data in the higher range of
DCAD in the Iwaniuk and Erdman (2015) meta-analysis. There are some wonderings if the
stagnated curves for milk yield, as well as DMI (figure 2a; figure 3a) would look different if
the data from the highest DCAD-level would be removed. More research on dairy cattle fed
different levels of DCAD above 500 mEq/kg DM is probably needed to give a clearer picture
of the effects of DCAD in the higher range.
It is shown that the milk fat yield increases with increasing DCAD. Iwaniuk and Erdman
(2015) showed a linear increase, with no observed stagnation. This would underline the
benefit of examining the impact of DCAD in the higher range, since a higher milk fat yield
might be desired by the producers for economical reasons. However, there is ambiguity
considering the milk fat percentage (Chan et al., 2005; Hu & Murphy, 2004; Iwaniuk et al.,
2015, Iwaniuk & Erdman, 2015). The reason for the different statistical outcomes is quite
unclear, but one can discuss if the difference in using DCAD:Cl or DCAD:S has an impact.
Additionally, it was stated that S rarely is supplemented as a mineral source (Hu et al., 2006),
but it has to be kept in mind that S is present in the original feed ration (Cecilia Kronqvist,
Swedish University of Agricultural Sciences, 2016-04-11), which might have an impact on
the credibility, as well as ability, to compare the studies using the different calculations.
The fact that not just individual experiments, but also the two earlier discussed meta-analyses
showed the different alterations of DCAD and fat percentage (as well as milk yield and DMI)
(Chan et al., 2005; Hu & Murphy, 2007; Iwaniuk & Erdman 2015; Iwaniuk et al., 2015),
makes is difficult to discuss whether the reason for the increased, respectively unaffected, fat
percentage is due to the approach of elevating the DCAD or if there is something else that
contributes to the different statistical outcomes. The choice of cationic (or anionic) additives,
as well as the basal feed ration, may affect the results of the different analyses and
experiments. One can further suggest that the amount of data, as well as the choice of DCAD-
interval, will affect the outcome of different studies, when it comes to all measured para-
meters. Further, it has to be kept in mind that the milk yield has a direct impact on the milk fat
percentage through dilution. It is thus several aspects that need to be considered when
discussing the percentage of fat.
There is also ambiguities regarding milk protein yield, as well as milk protein percentage. The
different experimental outcomes can be deliberated in the same way as the above discussed
milk fat percentage. However, the milk protein percentage was shown to mainly be affected
by the milk yield by Hu & Murphy (2004), which may be the general case, since the protein
11
yield, as well as percentage has to be compared to the milk yield, which may vary depending
on DCAD-interval. This contributes to the suggestion that the eventual increased protein yield
is a limited capacity, independently if the increase is obtainable or not.
Different experiments show that the Na:K ration has an impact on DMI, milk yield, ECM,
milk fat percentage and milk fat yield among dairy cattle (Sanchez et al., 1994; Wildman et
al., 2007a; Iwaniuk et al., 2015). An unevenly distributed Na:K ratio seem to give the best
performance. Further, it seems like an elevated Na:K ratio is preferred before a heavily
reduced Na:K ratio, due to the fact that an increased amount of Na in the feed, gives a higher
milk fat yield, as well as milk fat percentage, than a low Na:K ratio (Iwaniuk et al., 2015).
Contrary these findings, the experiment made by Hu and Kung (2009) showed no effect of the
Na:K ratio at a DCAD of 350 mEq/kg DM. This may indicate that the Na:K ratio affect the
performance of the dairy cow in a certain interval of DCAD, or might just affect the animal at
a specific DCAD-interval regarding the amount of cationic macro minerals, since a ratio does
not identify the quantity of the included parameters.
The overall positive impact of the DCAD on the productivity among dairy cattle is probably
due to the increased DMI, as well as the buffering effect in the rumen when using buffering
cationic additives (Ender et al., 1971; Wildman et al., 2007b; Iwaniuk & Erdman, 2015). The
improved DMI is, for sure, partly due to the absence of metabolical acidosis (Hu & Murphy,
2004; Gelfert et al., 2006) but there are probably more reasons contributing this, such as the
improved ruminal environment and raised palatability of the feed (especially when reducing
the anionic additives in the lower range of DCAD) (Ender et al., 1971). However, the
buffering effect of the rumen is thought to be independent of the macro minerals in the DCAD
calculation since the buffering effect is suggested to originate from bicarbonate/carbonate part
in cationic buffer and not the K+ or Na+. This indirect buffering effect, may contribute to
misunderstandings, since the buffering effect are described in the variation of DCAD in
several papers. It is considered being more correct to focus on the direct, rather than the
indirect causer, which in this case is thought to be the bicarbonate/carbonate and not the
macro minerals that are included in the DCAD-calculation. On the other hand, it is suggested
to be relevant to highlight the buffering effect considering DCAD, since it, together with the
ion source, has an impact on the cow and its productivity. It is however suggested that the
cation source, supplemented as a buffer, complicates the analysis of DCAD. It is difficult to
clarify whether the positive effects, by a DCAD elevated by buffers, is due to the DCAD
itself, and/or the bicarbonate/carbonate. This need to be further investigated.
When it comes to feed efficiency, most of the described benefits considering an increased
DCAD seem to originate from the above discussed indirect rumen buffering effects of the
supplemented cation source (regarding increased CP utilization in low CP diets and NDF
degradability). This is suggested since buffers were supplemented in both of the above
mentioned experiments, and the fact that ruminal pH was discussed regarding the NDF
degradability (Wildman et al., 2007b; Martins et al., 2015). The feed efficiency will, due to
these aspects, not be included in the soon discussed optimal DCAD-level.
12
Suggestions of optimal DCAD levels has been given according to the cows enhanced DMI,
milk yield, as well as impact of the milk components (Sanchez & Beede, 1996; Roche et al.,
2005). It seems like the final optimal DCAD agrees quite well with the earlier stated
suggestion by Sanchez and Beede (1996) with an optimal DCAD:Cl of 250-500 mEq/kg DM.
This is agreed since the milk yield, according to Hu and Murphy (2004) has a peak at the
DCAD:Cl of 340 mEq/kg DM. Additionally, figure 3a, adapted from Iwaniuk and Erdman
(2015), indicates a stagnation in milk yield at a DCAD:S about 300 mEq/kg DM, which fit in
the above mentioned DCAD:Cl-interval (even though DCAD:S and DCAD:Cl are two
different calculations). According to figure 2a, the DMI is shown to level out in the DCAD:S
range of 400-600 mEq/kg DM, but the positive change does not seem to be remarkably
greater above 275 mEq/kg DM (Iwaniuk & Erdman, 2015). Figure 2b, shows a peak in DMI
at a DCAD:Cl of about 400 mEq/kg DM (Hu & Murphy, 2007), which also contributes to the
suggested optimal DCAD:Cl interval. The suggested optimal DCAD interval for this literature
review is therefore agreed with Sanchez and Beede (1996), but is a combination of the
different optimums for both DCAD:Cl and DCAD:S. The combination of both DCAD:Cl and
DCAD:S is possible since all of the optimums or stagnations for different traits fit in the
DCAD interval of 250-500 mEq/kg DM. Maybe a smaller interval of 250-400 mEq/kg DM
can be used to avoid the eventual reduction in production in the higher range of DCAD.
However, if the DMI, as well as milk yield and milk composition is not negatively affected by
a further increased DCAD, the fat content may be further increased by elevating the DCAD-
level even more (Hu & Murphy, 2004; Iwaniuk & Erdman, 2015). The elevated fat content
may partly originate from the above discussed buffering effect (Iwaniuk & Erdman, 2015),
but it is however discussable whether the eventual positive change in milk fat percentage is
economically advantageously, since the eventual positive changes might not be big enough to
give a valuable positive economic impact since the cationic source itself has to be paid for.
A lot of aspects can be discussed regarding the DCAD’s positive effect on DMI, milk yield
and milk composition. However, it is of greater importance to put the optimal DCAD into
practice. DCAD is affected by the basic feed ration and was reported to be 250 (Iwaniuk et
al., 2015) or 300 mEq/kg DM for DCAD:S and 324 mEq/kg DM for DCAD:Cl for two basal
feed rations. By observing these different DCADs, and including the DCAD:S and DCAD:Cl
of the recommendations of mineral amounts (247 mEq/kg DM and 278 mEq/kg DM,
respectively) (Spörndly, 2003), it appears like the recommendations and basal feed rations
matches quite well with the above discussed optimal DCAD interval of 250-500 mEq/kg DM,
or the narrower suggested range of 250-400 mEq/kg DM. This consensus would implicate
that importance of adding cationic sources to increase the DCAD is unnecessary among dairy
cattle that are housed under good environmental conditions and fed according to the current
feeding recommendations. More research at DCAD-levels above 500 mEq/kg DM, as well as
research that can distinguish between the ruminal effects of bicarbonate/carbonate and K+ or
Na+ in DCAD-elevating buffers, is however requested.
13
References
Apper-Bossard, E., Faverdin, P., Meschy, F. & Peyraud, J.L. (2010). Effects of dietary cation-anion
difference on ruminal metabolism and blood acid-base regulation in dairy cows receiving 2
contrasting levels of concentrate in diets. Journal of Dairy science, vol. 93, pp. 4196-4210.
Apper-Bossard, E., Peyraud, J.L., Faverdin, P. & Meschy, F. (2006). Changing Dietary Cation-Anion
Difference for Dairy Cows Fed with Two Contrasting Levels of Concentrate in Diets. Journal of
Dairy Science, vol. 89, pp. 749–760.
Block, E. (1984). Manipulating Dietary Anions and Cations for Prepartum Dairy Cows to Reduce
Incidence of Milk Fever. Journal of Dairy Science, vol. 67, pp. 2939–2948.
Chan, P.S., West, J.W., Bernard, J.K. & Fernandez, J.M. (2005). Effects of Dietary Cation-Anion
Difference on Intake, Milk Yield, and Blood Components of the Early Lactation Cow. Journal of
Dairy Science, vol. 88, pp. 4384-4392.
Charbonneau, E., Chouinard, P.Y., Tremblay, G.F., Allard, G. & Pellerin, D. (2009). Thimothy silage
with low dieatary cation-anion difference fed to nonlactating cows. Journal of Dairy Sceince, vol.
92, pp. 2008-1569.
Denniston, K.J., Topping J.J. & Caret, R.L. (2008). General, Organic, and Biochemistry. 6th edition.
New York. McGraw-Hill. p. 199.
Denniston, K.J., Topping, J.J. & Caret, R.L. (2011) General, Organic, and Biochemistry. 7th edition.
New York. McGraw-Hill. p. 268.
Ender, F., Dishington, I.W. & Helgebostad, A. (1971). Calcium Balance Studies in Dairy Cows under
Experimental Induction and Prevention of Hypocalcaemic Paresis Puerperalis. Zeitschrift für
Tierphysiologie Tierernährung und Futtermittelkunde, vol. 28, pp. 233–256.
FAO / TCP / KEN/ 6611 Project. (2016). Milk Testing and Quality Control. Milk Processing Guide
Series. Volume 2. Available:
http://www.fao.org/ag/againfo/resources/documents/mpguide/mpguide2.htm [2016-04-21].
Gelfert, C.C., Passfeld, M., Löptien, A., Montag, N., Baumgartner W. & Staufelbiel, R. (2006).
Experimental studies on the impact of an increased dose of anionic salts on the metabolism of
dairy cows. Veterinary Quarterly, vol. 28, pp. 130-139.
Goff, J.P., Horst, R.L., Mueller, F.J., Miller, J.K., Kiess, G.A. & Dowlen, H.H. (1991). Addition of
chloride to a prepartal diet high in cations increases 1,25-dihydroxyvitamin D response to
hypocalcemia preventing milk fever. Journal of dairy science, vol. 74, pp. 3863–3871.
Grant, E.A. & Maclean, A.A. (1966). EFFECT OF NITROGEN, PHOSPHORUS, AND
POTASSIUM ON YIELD, PERSISTENCE, AND NUTRIENT CONTENT OF TIMOTHY.
Canadian Journal of Plant Science, vol. 46, pp. 577–582.
Hu, W. & Kung, L. Jr. (2009). Effect of dietary ratio of Na:K on feed intake, milk production, and
mineral metabolism in mid-lactation dairy cows. Journal of Dairy science, vol. 92, pp. 2711-2718.
Hu, W. & Murphy, M.R. (2004). Dietary Cation-Anion Difference Effects on Performance and Acid-
Base Status of Lactating Dairy Cows: A Meta-Analysis. Journal of Dairy science, vol. 87, pp.
2222-2229.
Hu, W., Murphy, M.R., Constable P.D. & Block E. (2007). Dietary Cation-Anion Difference Effects
on Performance and Acid-Base Status of Dairy Cows Postpartum1. Journal of Dairy science, vol.
90, pp. 3367-3375.
14
Iwaniuk, M.E., Weidman, A.E. & Erdman, R.A. (2015). The effect of dietary cation-anion difference
concentration and cation source on milk production and feed efficiency in lactating dairy cows.
Journal of Dairy science, vol. 98, pp. 1950-1960
Iwaniuk, M.E. & Erdman, R.A. (2015). Intake, milk production, ruminal, and feed efficiency
responses to dietary cation-anion difference by lactating dairy cows. Journal of dairy science, vol.
98(12), pp. 8973-8985.
Jenkins, T.C., Bridges, W.C., Harrison, J.H. & Young, K.M. (2014). Addition of potassium carbonate
to continuous cultures of mixed ruminal bacteria shifts volatile fatty acids and daily production of
biohydrogenation intermediates. Journal of Dairy Science, vol 97, pp. 975-984.
Martins, C.M.M., Arcari, M.A., Welter, K.C., Netto, A.S., Oliveira, A.F. & Santos, M.V. (2015).
Effect of dietary cation-anion difference on performance of lactating dairy cows and stability of
milk proteins. Journal of Dairy Science, vol. 98, pp. 2650-2661.
Martins, C.M.M., Arcari M.A., Welter, K.C., Goncalves, J.L. & Santos, M.V. (2016). Effect of cation-
anion difference on ruminal metabolism, total apparent digestibility, blood and renal acid-base
regulation in lactating dairy cows. Animal, vol. 10, pp. 64-74.
Maxin, G., Glasser F., Hurtaud C., Peyraud J.L. & Rulquin H. (2011). Combined effects of trans-10,
cis-12 conjugated linoleic acid, propionate, and acetate on milk fat yield and composition in dairy
cows. Journal of Dairy science, vol. 94, pp. 2051-2059.
McDonald, P. Edwards, R.A., Greenhalgh, J.F.D., Morgan, C.A., Sinclair, L.A. & Wilkinson, R.G.
(2011). Animal Nutrition. 7th edition. Harlow, Essex, England. Benjamin Cummings. pp. 110-111,
116, 173, 437-438, 484.
National Research Council (NRC). (2001). Nutrient Requirements of Dairy Cattle. 7th revised edition.
Washington D.C., United States of America. P. 308.
Oetzel, G.R., Olson, J.D. & Curtis, C.R. (1988). Ammonium Chloride and Ammonium Sulfate for
Prevention of Parturient Paresis in Dairy Cows1. Journal of Dairy science, vol. 71, pp. 3302-3309.
Oetzel, G.R., Fettman, M.J., Hamar, D.W. & Olson, J.D. (1991). Screening of Anionic Salts for
Palatability, Effects on Acid-Base Status, and Urinary Calcium Excretion in Dairy Cows1. Journal
of Dairy science, vol. 74, pp. 965-971.
Oetzel, G.R. & Barmore, J.A. (1993). Intake of a Concentrate Mixture Containing Various Anionic
Salts Fed to Pregnant, Nonlactating Dairy Cows 1. Journal of Dairy science, vol. 76, pp. 1617-
1623.
Pelletier, S., Simpson, R.J., Culvenor, R.A., Bélanger, G., Tremblay, G. F., Allard, G., Braschkat, J. &
Randall, P.J. (2008). Dietary cation-anion differences in some pasture species, changes during the
season and effects of soil acidity and lime amendment. Austrailian Journal of Experimental
Agriculture, vol. 48, pp. 1143-1153.
Pelletier, S., B’elanger, G., Tremblay, G.F., Brégard, A. & Allard, G. (2006). Dietary Cation-Anion
Difference of Timothy as Affected by Development Stage and Nitrogen and Phosphorus
Fertilization. Agronomy Journal, vol. 98, pp. 774-780.
Pehrson, B. 1988. Mineralämnen som fodermedelstillsatser 1). Allmänt veterinärmöte.
Sammanställning av föredrag. Statens Veterinärmedicinska Sällskap. 9th-11th of November 1988.
Roche, J.R., Dalley, D., Moate, P., Grainger, C., Rath, M. & O’mara, F. (2003). Dietary Cation-Anion
Difference and the Health and Production of Pasture-Fed Dairy Cows. 1. Dairy Cows in Early
Lactation. Journal of Dairy science, vol. 86, pp. 970-978.
15
Roche, J.R., Petch, S. & Kay, J.K. (2005). Manipulating the Dietary Cation-Anion Difference via
Drenching to Early-Lactation Dairy Cows Grazing Pasture. Journal of Dairy Science, vol. 88, pp.
264–276.
Spörndly, R. (2003), Foderstabeller för idisslare 2003. Uppsala: Sveriges Lantbruks-universitet.
Report, 257. ISSN: 0347-9838
Sanchez, W.K. & Beede, D.K. (1996). Is there an optimal cation-anion difference for lactation diets?
Animal Feed Science and Technology, vol. 59, pp. 3–12.
Sanchez, W.K., Beede, D.K. & Delorenzo, M.A. (1994). Macromineral Element Interrelationship and
Lactational Performance: Empirical Models from a Large Date Set1. Journal of Dairy science, vol.
77, pp. 3096-3110.
Silvestre, A.M., Martins, A.M., Santos, V.A., Ginja, M.M. & Colaço, J.A. (2009). Lactation curves for
milk, fat and protein in dairy cows: A full approach. Livestock science, vol. 122, pp. 308–313.
Sjastaad, Ø.V., Sand, O. & Hove, K. (2010). Physiology of Domestic Animals. 2nd edition. Oslo:
Scandinavian Veterinary Press. 804 p. 747.
Stout, J.D., Bush, L.J. & Morrison, R.D. (1972). Palatability of Buffered Concentrate Mixtures for
Dairy Cows. Journal of Dairy science, vol. 55, pp. 130-133.
Tremblay, G.F., Brassard, H., Bélanger, G., Seguin, P., Drapeau, R., Brégard, A., Michaud, R. &
Allard, G. (2006). Dietary Cation Anion Difference of Five Cool-Season Grasses. Agronomy
journal, vol. 98, pp. 339-348.
Vagg, M.J. & Payne, J.M. (1970). The effect of ammonium chloride induced acidosis on calcium
metabolism in ruminants. The British Veterinary Journal, vol. 126, pp. 531-537.
West, J.W., Haydon, K.D., Mullinix, B.G. & Sandifer, T.G. (1992). Dietary cation-anion balance and
cation source effects on production and acid-base status of heat-stressed cows. Journal of Dairy
science, vol. 75, pp. 2776-2786.
West, J.W., Mullnix, B.G. & Sandifer, T.G. (1991). Changing Dietary Electrolyte Balance for Dairy
Cows in Cold and Hot Environments. Journal of Dairy Science, vol. 74, pp. 1662-1674.
Wildman, C.D., West, J.W. & Bernard, J.K. (2007a). Effect of Dietary Cation-Anion Difference and
Potassium to Sodium Ratio on Lactating Dairy Cows in Hot Weather. Journal of Dairy science,
vol. 90, pp. 970-977.
Wildman, C.D., West, J.W. & Bernard, J.K. (2007b). Effect of Dietary Cation-Anion Difference and
Dietary Crude Protein on Milk Yield, Acid-Base Chemistry, and Rumen Fermentation. Journal of
Dairy Science, vol. 90, pp. 4693–4700.
Acknowledgements
Figure 2 a, and figure 3 a, are Reprinted from Journal of Dairy Science, vol. 98 (12), Iwaniuk,
M.E. and Erdman, R.A. Intake, milk production, ruminal, and feed efficiency responses to
dietary cation-anion difference by lactating dairy cows. pp. 1950-1960, 2015, with permission
from Elsevier. Thank you for the permission.
Figure 2 b, and Figure 3 b, are Reprinted from Journal of Dairy Science, vol. 87. Hu, W. and
Murphy, M.R. Dietary Cation-Anion Difference Effects on Performance and Acid-Base
Status of Lactating Dairy Cows: A Meta-Analysis. pp. 2222-2229, 2004, with permission
from Elsevier. Thank you for the permission.

16
Thank you to my supervisor Cecilia Kronqvist, for your helpful feedback and easy
reachability. Thank you to my “writers group” for the helpful feedback. Thank you to all of
the referred (and a lot of non-included) research in this subject that has contributed to my
newfound knowledge.