Embed Size (px)
Citation preview
Munich Personal RePEc Archive
The different impact of conventional
interest rates on Islamic stock market,
Islamic banking and Islamic insurance:
evidence from Malaysia
Othman, Arshad Nuval and Masih, Mansur
INCEIF, Malaysia, INCEIF, Malaysia
10 July 2014
Online at https://mpra.ub.uni-muenchen.de/63285/
MPRA Paper No. 63285, posted 29 Mar 2015 06:14 UTC
The different impact of conventional interest rates on Islamic stock market, Islamic
banking and Islamic insurance: evidence from Malaysia
Arshad Nuval Othman 1 and Mansur Masih2
Abstract
This paper seeks to close the gap of the lack of empirical evidence surrounding the different
impact of conventional interest rates on Islamic finance components – Islamic stock markets,
Islamic banking and Islamic insurance (called takaful). Such evidence remains imperative in
order for the Islamic finance system to formulate effective countermeasures against changes in
conventional interest rates. Using Malaysia as a case in point, this paper employs time-series
techniques to establish long-run and causal relationships among an Islamic stock market, an
Islamic bank stock, an Islamic insurance company stock, the overnight conventional interbank
money market rate and several control variables. Results suggest the distinct interaction of each
Islamic finance component with conventional interest rates – the positive long-run relationship
and bidirectional causality between Islamic stock markets and conventional interest rates, the
negative long-run relationship and bidirectional causality between Islamic banking and
conventional interest rates, and the negative long-run relationship and unidirectional causality
from Islamic insurance to conventional interest rates. Policymakers should remain concerned
primarily with the impact of conventional interest rates on Islamic stock markets and Islamic
banking due to the negative income gap of Islamic banks which expose the Islamic finance
system to higher financial risk. Thus, policymakers should incentivize Islamic banks to convert
the negative income gap into a positive income gap through imposing higher capital
requirements on fixed-rate nominal assets.
1 Arshad Nuval Othman, Graduate student in Islamic finance at INCEIF, Lorong Universiti A, 59100 Kuala Lumpur, Malaysia.
2 Corresponding author, Professor of Finance and Econometrics, INCEIF, Lorong Universiti A, 59100 Kuala Lumpur,
Malaysia. Phone: +60173841464 Email: [email protected]
The different impact of conventional interest rates on Islamic stock market, Islamic
banking and Islamic insurance: Evidence from Malaysia
1. Introduction
The practice of Islamic finance revolves around, among other elements, the abstinence
from interest based on a verse from the holy Quran – ‘… But Allah has permitted trade and has forbidden interest …’ (Quran 2:275). Nevertheless, the recent emergence of Islamic finance
within the predominantly conventional finance system operating on interest implies that interest
may affect Islamic finance even if indirectly. Theories of the impact of interest rates on stock
returns such as the Fama and French three factor model and the nominal contracting hypothesis
reflect the pervasion of interest rates within the conventional finance system (Fama and French,
2004; Kessel, 1956; Bach and Ando, 1957). Furthermore, recent empirical studies such as Kim
and Nguyen (2009), Fernandez-Perez et al. (2014), Kasman et al. (2011) and Papadamou and
Siriopoulos (2014) demonstrate the impact of interest rates on stock returns of stock markets,
banks and insurance companies. Despite the high probability, the extent to which the
conventional interest rates affect Islamic finance receives minimal empirical evidence especially
in the different impact of conventional interest rates on Islamic finance components – Islamic
stock markets, Islamic banking and Islamic insurance (called takaful). Such lack of evidence
disables Islamic finance from deliberating effective countermeasures against changes in
conventional interest rates. Using time series techniques to obtain evidence from Malaysia, this
paper finds the distinct interaction of each Islamic finance component with conventional interest
rates – the positive long-run relationship and bidirectional causality between Islamic stock
markets and conventional interest rates, the negative long-run relationship and bidirectional
causality between Islamic banking and conventional interest rates, and the negative long-run
relationship and unidirectional causality from Islamic insurance to conventional interest rates.
The paper is structured as follows. Section 2 discusses related literature. Section 3
describes the data and techniques used in the empirical analysis. Section 4 examines the
empirical results. Section 5 concludes with a summary of key findings and a policy proposal.
2. Literature review
Interest rates serve as the cost of funds at which borrowing and lending occur throughout
economies functioning on conventional finance. Since majority of individuals and organizations
engage in debt transactions, changes in interest rates thus introduce favorable or unfavorable
outcomes throughout the economy. Nevertheless, Islam prohibits the utilization of interest and
thus the birth of Islamic finance stemmed from the need for permissible financing for Muslims.
Despite the direct avoidance of interest rates within Islamic finance transactions, interest rates
may still affect Islamic finance indirectly since Islamic finance functions alongside conventional
finance. Before investigating the indirect impact conventional interest rates impose on Islamic
finance, an understanding of existing theoretical and empirical work which details the impact of
conventional interest rates on returns of stock markets, banks and insurance companies should
build familiarity with conventional interest rates.
The Fama-French three-factor model serves as theory which incorporates the impact of
interest rates on stock returns. The three factors include the market return over the risk-free
interest rate, the returns on diversified portfolios of small over big capitalization stocks and the
returns on diversified portfolios of high over low book-to-market stocks (Fama and French,
2004). Since the model uses the risk-free interest rate to benchmark the risk premium of market
returns and individual stock returns, changes to the risk-free interest rate hence result in changes
to the expected risk premiums. Aside from the overarching three-factor model that explains stock
returns, the nominal contracting hypothesis further details the impact of inflation and interest
rates on stock returns. The hypothesis suggest that unexpected inflation, which impacts nominal
assets and nominal liabilities of firms, can affect stock returns due to wealth redistribution from
creditors to debtors (Kessel, 1956; Bach and Ando, 1957). Furthermore, the maturity
composition of nominal assets and nominal liabilities affects the interest rate sensitivity of firms
(Flannery et al., 1997).
Besides the two aforementioned theories, empirical research further documents the
impact of interest rates on stock returns. Results from Kim and Nguyen (2009) indicate that
majority of Asia-Pacific stock markets show significant negative returns and increased volatility
in response to unexpected interest rate rises by the Federal Reserve (Fed) and the European
Central Bank (ECB). The study employs EGARCH models on data spanning from January 1999
to December 2006 of Fed and ECB target interest rates and daily open and close prices of the
stock indices in 12 Asia-Pacific countries – Australia, China, Hong Kong, Indonesia, Japan,
Korea, Malaysia, New Zealand, the Philippines, Singapore, Taiwan and Thailand. In addition,
Fernandez-Perez et al. (2014) find that the United States of America (U.S.A.) and Europe yield
curves contain information which enhances the ability to forecast the probability of bear markets
in the Spanish IBEX 35 stock index using a Probit model. Aside from data on the Spanish IBEX
35 stock index and sovereign debt yields from U.S.A and Europe, the Probit model uses monthly
data from February 1991 to December 2009 of Spain sovereign debt yields and several financial
and economic indicators. The varying analysis techniques and geographical coverage of both
studies suggests the robustness on the influence of interest rates, specifically U.S.A and Europe
interest rates, on stock returns.
Empirical studies also highlight the effect of interest rates specifically on banks and
insurance companies. Using primarily GARCH models, Kasman et al. (2011) detect the
significant and negative impact of interest rate and exchange rate changes on the conditional
bank stock return in Turkey. Additionally, the study pinpoints interest rate and exchange rate
volatility as major determinants of the conditional bank stock return volatility. Kasman et al.
(2011) utilized daily data from 27 July 1999 to 9 April 2009 of interest rates measured as the 2-
year Turkish government bond yields, exchange rates based on a simple basket equally
weighting the US dollar and the Euro, closing stock prices of 13 Turkish commercial banks and
the closing price of the bank index. On a related note, Papadamou and Siriopoulos (2014) find
that uncertainty in policy interest rates significantly affect short-term interest rate risk
experienced by banks and life insurance companies in the United Kingdom. The authors obtain
results by applying the GARCH-M methodology on monthly data of one month Treasury bill
rates, four major British banks (Lloyds, HSBC, Barclays, Standard Chartered), four major life
insurance companies (Prudential, St James’s Place, Legal & General, Aviva), banking sector index, life insurance sector index and FT All Share Index. Despite the limited geographical
coverage, the consistent results of both studies which use almost similar econometric techniques
strongly emphasize the effect of interest rates on banks and insurance companies.
Aside from the impact of interest rates on stock returns, existing literature points out the
interaction among stock markets, specifically between Islamic and conventional stock markets.
Ajmi et al. (2014) find the significant linear and non-linear causality from the Islamic stock
market to conventional stock markets, particularly for Europe and Asia. The study attributes the
causality from the Islamic stock market to the aforementioned conventional stock markets due to
the additional restrictions imposed when classifying stocks as Shariah-compliant and the level of
advancement of Islamic finance in Europe and Asia. Ajmi et al. (2014) used heteroscedasticity-
robust linear Granger causality and nonlinear Granger causality tests on daily data from January
4, 1999 to October 8, 2010, of the Dow Jones Islamic Market (DJIM) index, S&P stock market
indices for the United States (SPUS), Europe (SPEU) and Asia (SPAS50), and several additional
financial and risk factors. Although primarily focusing on the interaction among stock markets,
the study generally implies the existing relationship between Islamic and conventional finance.
Theoretical and empirical work feature the impact of interest rates on returns of stock
markets, bank stocks and insurance company stocks, and identify the relationship between
Islamic and conventional stock markets. However, lack of evidence on the different impact of
conventional interest rates on Islamic finance components – Islamic stock markets, Islamic
banking and takaful – poses a gap in literature which this paper shall fill. Using Malaysia as a
case in point, the empirical evidence gathered provides insight to the behavior of different
Islamic finance components to changes in conventional interest rates and thus allows for
formulations of effective countermeasures.
3. Data and methodology
In order to address the research objective through gathering evidence from Malaysia, this
paper analyzes the impact of the overnight Kuala Lumpur Interbank Offer Rate (KLIBOR) on
Islamic finance stock returns in Islamic stock markets, Islamic banking and takaful represented
by the FTSE Bursa Malaysia EMAS Shari’ah Index, BIMB Holdings Bhd. stock and Syarikat Takaful Malaysia Bhd. stock respectively. The selection of the overnight KLIBOR as the interest
rate arises from Bank Negara Malaysia’s (BNM) stand on KLIBOR as the ‘official indicator of the conditions in the interbank money market’ (BNM, 2013). As for the chosen Islamic stock
market, Islamic banking and takaful variables, the FTSE Bursa Malaysia EMAS Shari’ah Index,
BIMB Holdings Bhd. stock and Syarikat Takaful Malaysia Bhd. stock contain or are Shariah-
compliant stocks approved by the Shariah Advisory Committee (SAC) of the Securities
Commission Malaysia. When screening for Shariah-compliant stocks, the SAC applies business
activity and financial ratio benchmarks which minimize the Shariah non-compliant activities and
financing firms engage in (Securities Commission Malaysia, 2013).
Aside from the four focal variables, this paper incorporates Malaysia’s consumer price index (CPI), the US 3-month Treasury bill, the ringgit to US dollar exchange rate and BNM’s overnight policy rate (OPR) as variables to control for the impact of inflation, US interest rates,
exchange rates and policy rates as described in Kessel (1956), Bach and Ando (1957), Kim and
Nguyen (2009), Fernandez-Perez et al. (2014), Kasman et al. (2011) and Papadamou and
Siriopoulos (2014). In addition, the paper includes the overnight Kuala Lumpur Islamic Rate of
Return (KLIRR) to control for the impact of the Islamic Interbank Money Market (IIMM) on
Islamic finance stock returns in Malaysia. Since KLIRR and Islamic finance stocks share the
same Islamic principles, KLIRR from IIMM should impact Islamic finance stock returns more
than KLIBOR from the conventional interbank money market. Thus, controlling for KLIRR
remains important in order to isolate the impact of KLIBOR on Islamic finance stock returns.
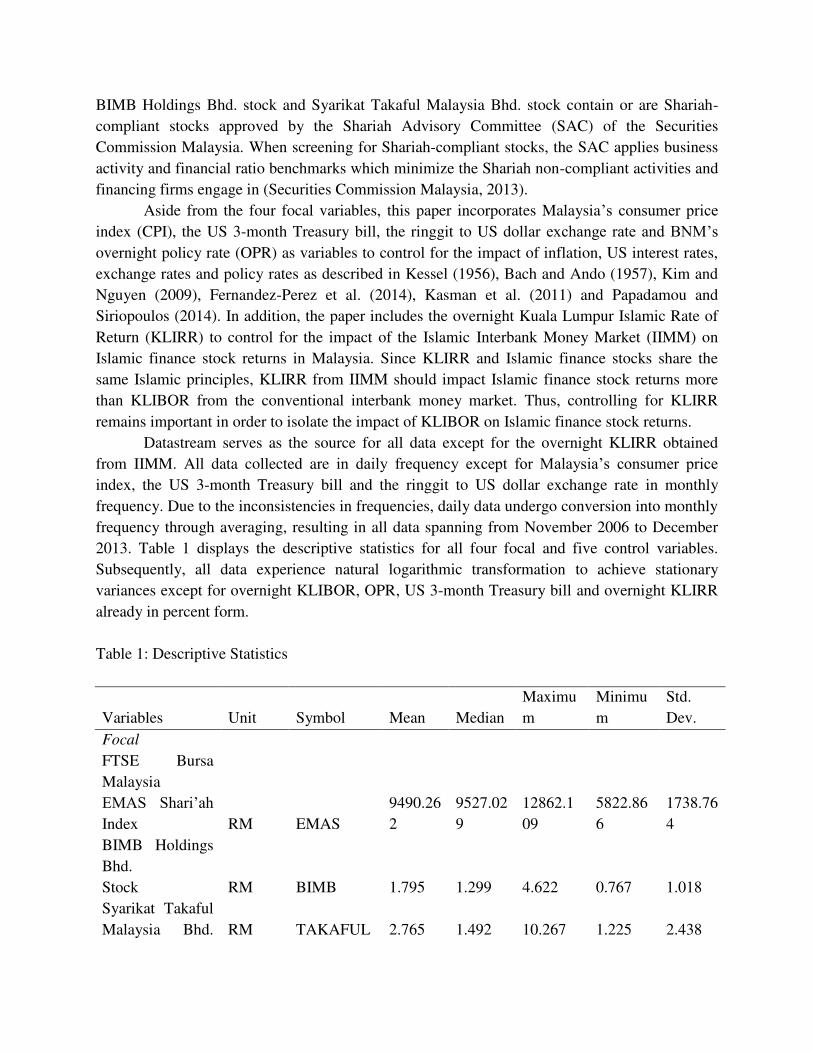
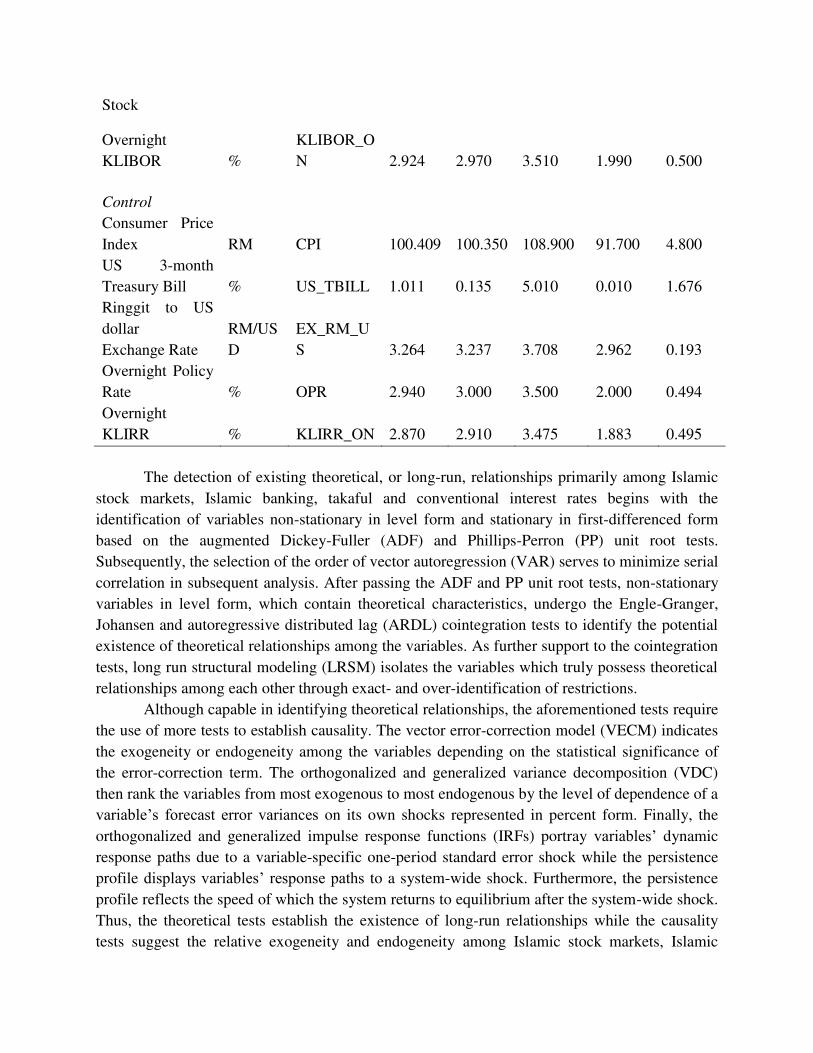
Datastream serves as the source for all data except for the overnight KLIRR obtained
from IIMM. All data collected are in daily frequency except for Malaysia’s consumer price index, the US 3-month Treasury bill and the ringgit to US dollar exchange rate in monthly
frequency. Due to the inconsistencies in frequencies, daily data undergo conversion into monthly
frequency through averaging, resulting in all data spanning from November 2006 to December
2013. Table 1 displays the descriptive statistics for all four focal and five control variables.
Subsequently, all data experience natural logarithmic transformation to achieve stationary
variances except for overnight KLIBOR, OPR, US 3-month Treasury bill and overnight KLIRR
already in percent form.
Table 1: Descriptive Statistics
Variables Unit Symbol Mean Median
Maximu
m
Minimu
m
Std.
Dev.
Focal
FTSE Bursa
Malaysia
EMAS Shari’ah Index RM EMAS
9490.26
2
9527.02
9
12862.1
09
5822.86
6
1738.76
4
BIMB Holdings
Bhd.
Stock RM BIMB 1.795 1.299 4.622 0.767 1.018
Syarikat Takaful
Malaysia Bhd. RM TAKAFUL 2.765 1.492 10.267 1.225 2.438
Stock
Overnight
KLIBOR %
KLIBOR_O
N 2.924 2.970 3.510 1.990 0.500
Control
Consumer Price
Index RM CPI 100.409 100.350 108.900 91.700 4.800
US 3-month
Treasury Bill % US_TBILL 1.011 0.135 5.010 0.010 1.676
Ringgit to US
dollar
Exchange Rate
RM/US
D
EX_RM_U
S 3.264 3.237 3.708 2.962 0.193
Overnight Policy
Rate % OPR 2.940 3.000 3.500 2.000 0.494
Overnight
KLIRR % KLIRR_ON 2.870 2.910 3.475 1.883 0.495
The detection of existing theoretical, or long-run, relationships primarily among Islamic
stock markets, Islamic banking, takaful and conventional interest rates begins with the
identification of variables non-stationary in level form and stationary in first-differenced form
based on the augmented Dickey-Fuller (ADF) and Phillips-Perron (PP) unit root tests.
Subsequently, the selection of the order of vector autoregression (VAR) serves to minimize serial
correlation in subsequent analysis. After passing the ADF and PP unit root tests, non-stationary
variables in level form, which contain theoretical characteristics, undergo the Engle-Granger,
Johansen and autoregressive distributed lag (ARDL) cointegration tests to identify the potential
existence of theoretical relationships among the variables. As further support to the cointegration
tests, long run structural modeling (LRSM) isolates the variables which truly possess theoretical
relationships among each other through exact- and over-identification of restrictions.
Although capable in identifying theoretical relationships, the aforementioned tests require
the use of more tests to establish causality. The vector error-correction model (VECM) indicates
the exogeneity or endogeneity among the variables depending on the statistical significance of
the error-correction term. The orthogonalized and generalized variance decomposition (VDC)
then rank the variables from most exogenous to most endogenous by the level of dependence of a
variable’s forecast error variances on its own shocks represented in percent form. Finally, the
orthogonalized and generalized impulse response functions (IRFs) portray variables’ dynamic
response paths due to a variable-specific one-period standard error shock while the persistence
profile displays variables’ response paths to a system-wide shock. Furthermore, the persistence
profile reflects the speed of which the system returns to equilibrium after the system-wide shock.
Thus, the theoretical tests establish the existence of long-run relationships while the causality
tests suggest the relative exogeneity and endogeneity among Islamic stock markets, Islamic
banking, takaful and conventional interest rates while controlling for the impact of inflation, US
interest rates, exchange rates, policy rates and Islamic money market rates.
4. Estimation results
Based on the ADF and PP unit root test results on Table 2 and Table 3 respectively, all
variables appear non-stationary in level form and stationary in first-differenced form, hence
allowing the possibility for cointegration. As for the order of VAR, the Akaike Information
Criterion (AIC) recommends six while the Schwarz Bayesian Criterion (SBC) recommends zero
as seen in Table 4. This paper decides to use neither zero nor one for the order of VAR because
of the presence of autocorrelation indicated by AIC and to avoid econometric software
shortcomings in running VECM using order of VAR as one. Furthermore, this paper abstains
from selecting the order of VAR beyond three due to potential over-parameterization on limited
data observations, specifically 86 observations, on nine variables. Since both AIC and SBC
values appear higher for the order of VAR of two compared to that of three, this paper chooses
two as the order of VAR.
The significant tau-statistics on Table 5 for two out of nine Engle-Granger cointegration
tests on nine variables indicate the presence of cointegration while the insignificant tau-statistics
of the remaining seven tests indicate the absence of cointegration. Fortunately, the Johansen
cointegration tests, both maximal eigenvalue and trace statistics, suggest that all variables remain
cointegrated up to at most three vectors as seen on Table 6. In addition, the ARDL test, inferred
from VECM results on Table 10, indicate the presence of cointegration for all three cointegrating
vectors since at least one out of nine variables appears endogenous in each cointegrating vector.
Thus, the Engle-Granger, Johansen and ARDL cointegration tests collectively show the
cointegration up to at most three vectors for all variables under analysis.
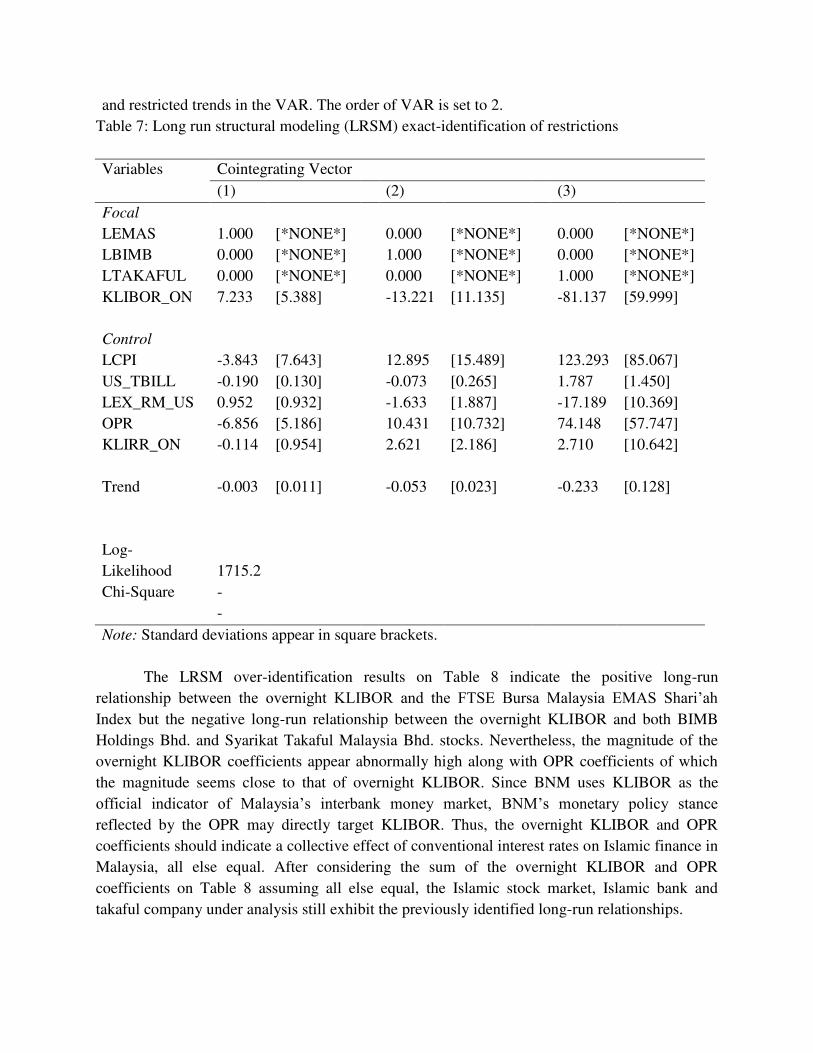
The LRSM exact-identification phase on Table 7 identifies the three cointegrating vectors
and consequently pinpoints the distinct long-run relationships of FTSE Bursa Malaysia EMAS
Shari’ah Index, BIMB Holdings Bhd. stock and Syarikat Takaful Malaysia Bhd. stock with
overnight KLIBOR and the control variables. Such finding implies the varying behaviors of
Islamic stock markets, Islamic banking and takaful. Nevertheless, the valid LRSM over-
identifying restriction, as shown by the insignificant chi-square value in Table 8, indicates that
the overnight KLIRR remains unrelated in the long-run to the Islamic stock market, Islamic bank
stock and takaful company stock. Despite sharing Islamic principles, the absence of a long-run
relationship between Islamic finance components and overnight KLIRR but the opposite for that
between Islamic finance components and overnight KLIBOR potentially arises from the
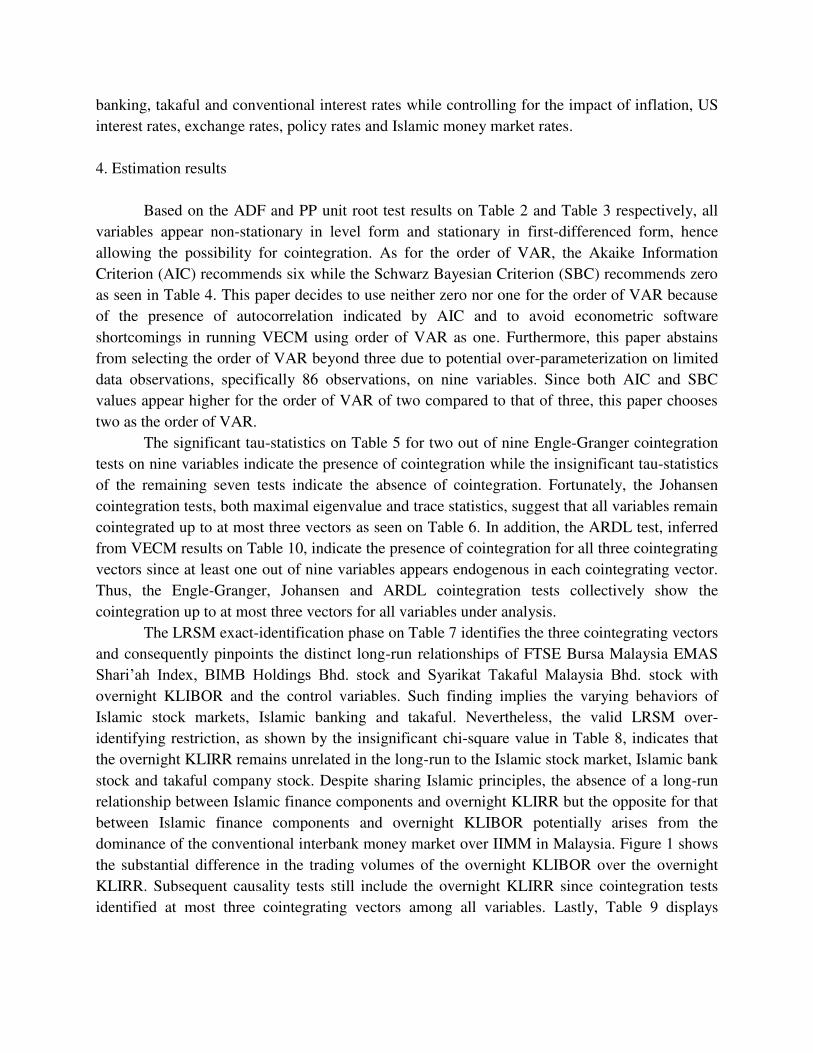
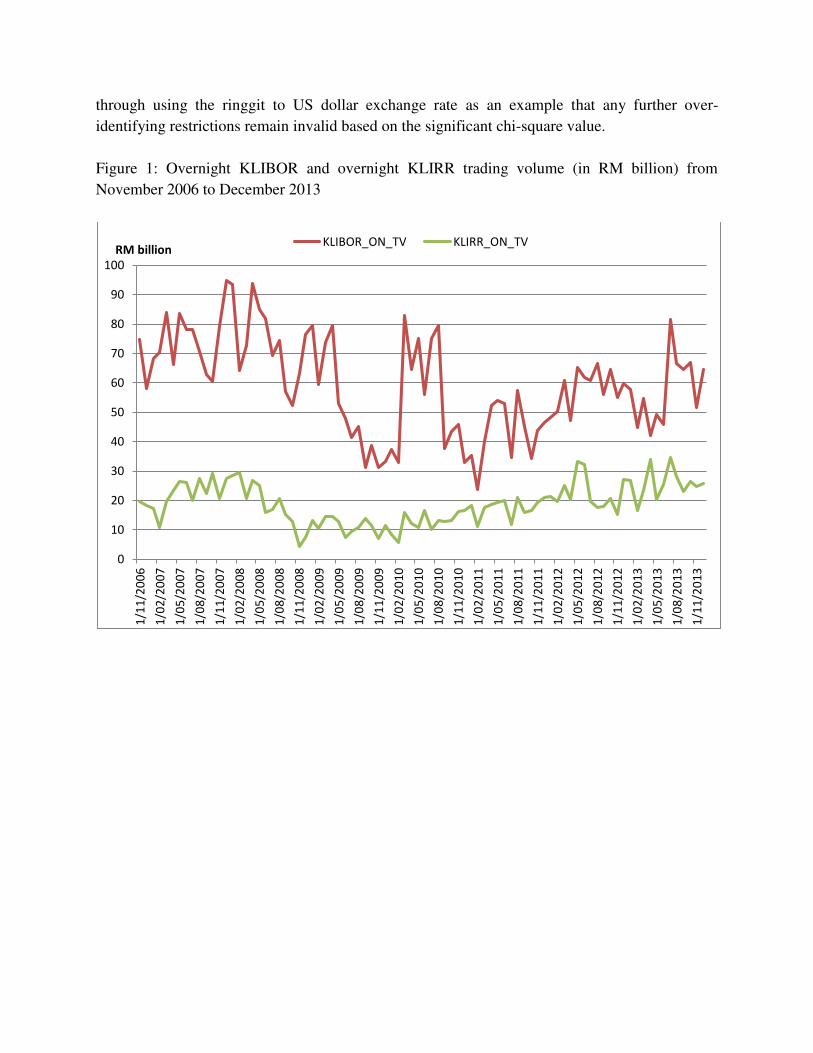
dominance of the conventional interbank money market over IIMM in Malaysia. Figure 1 shows
the substantial difference in the trading volumes of the overnight KLIBOR over the overnight
KLIRR. Subsequent causality tests still include the overnight KLIRR since cointegration tests
identified at most three cointegrating vectors among all variables. Lastly, Table 9 displays
through using the ringgit to US dollar exchange rate as an example that any further over-
identifying restrictions remain invalid based on the significant chi-square value.
Figure 1: Overnight KLIBOR and overnight KLIRR trading volume (in RM billion) from
November 2006 to December 2013
0
10
20
30
40
50
60
70
80
90
100
1/1
1/2
00
6
1/0
2/2
00
7
1/0
5/2
00
7
1/0
8/2
00
7
1/1
1/2
00
7
1/0
2/2
00
8
1/0
5/2
00
8
1/0
8/2
00
8
1/1
1/2
00
8
1/0
2/2
00
9
1/0
5/2
00
9
1/0
8/2
00
9
1/1
1/2
00
9
1/0
2/2
01
0
1/0
5/2
01
0
1/0
8/2
01
0
1/1
1/2
01
0
1/0
2/2
01
1
1/0
5/2
01
1
1/0
8/2
01
1
1/1
1/2
01
1
1/0
2/2
01
2
1/0
5/2
01
2
1/0
8/2
01
2
1/1
1/2
01
2
1/0
2/2
01
3
1/0
5/2
01
3
1/0
8/2
01
3
1/1
1/2
01
3
RM billionKLIBOR_ON_TV KLIRR_ON_TV
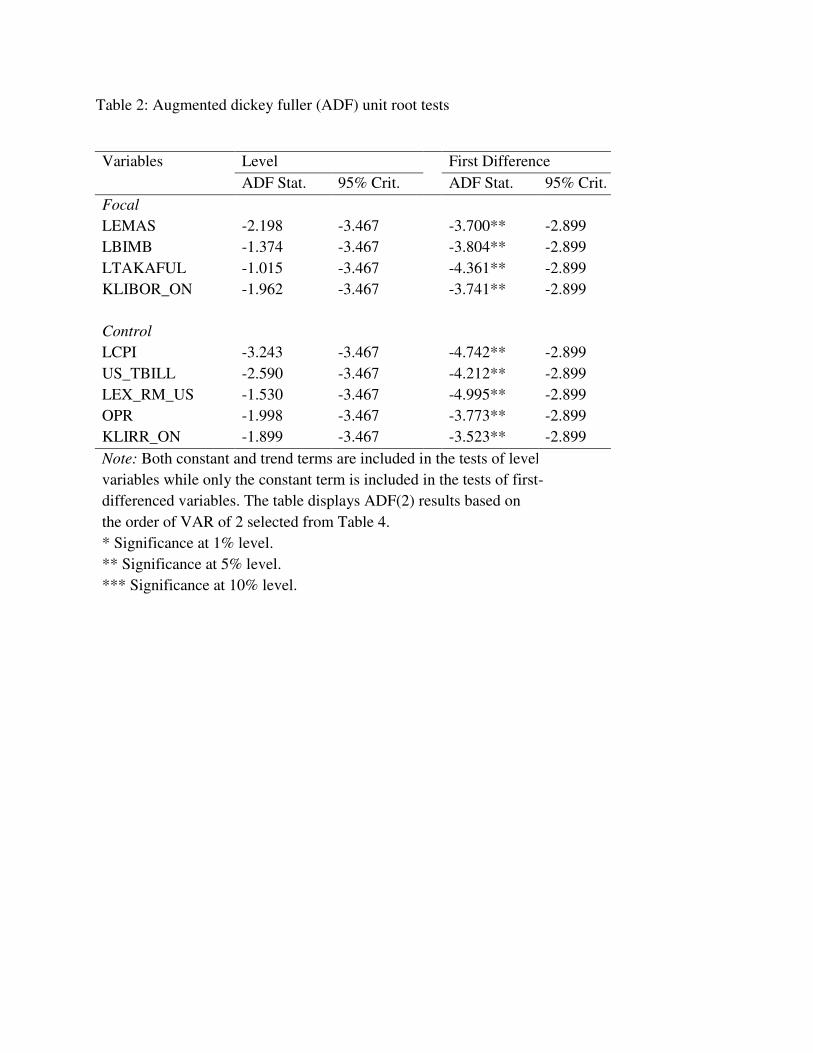
Table 2: Augmented dickey fuller (ADF) unit root tests
Variables Level First Difference
ADF Stat. 95% Crit. ADF Stat. 95% Crit.
Focal
LEMAS -2.198 -3.467
-3.700** -2.899
LBIMB -1.374 -3.467
-3.804** -2.899
LTAKAFUL -1.015 -3.467
-4.361** -2.899
KLIBOR_ON -1.962 -3.467
-3.741** -2.899
Control
LCPI -3.243 -3.467
-4.742** -2.899
US_TBILL -2.590 -3.467
-4.212** -2.899
LEX_RM_US -1.530 -3.467
-4.995** -2.899
OPR -1.998 -3.467
-3.773** -2.899
KLIRR_ON -1.899 -3.467
-3.523** -2.899
Note: Both constant and trend terms are included in the tests of level
variables while only the constant term is included in the tests of first-
differenced variables. The table displays ADF(2) results based on
the order of VAR of 2 selected from Table 4.
* Significance at 1% level.
** Significance at 5% level.
*** Significance at 10% level.
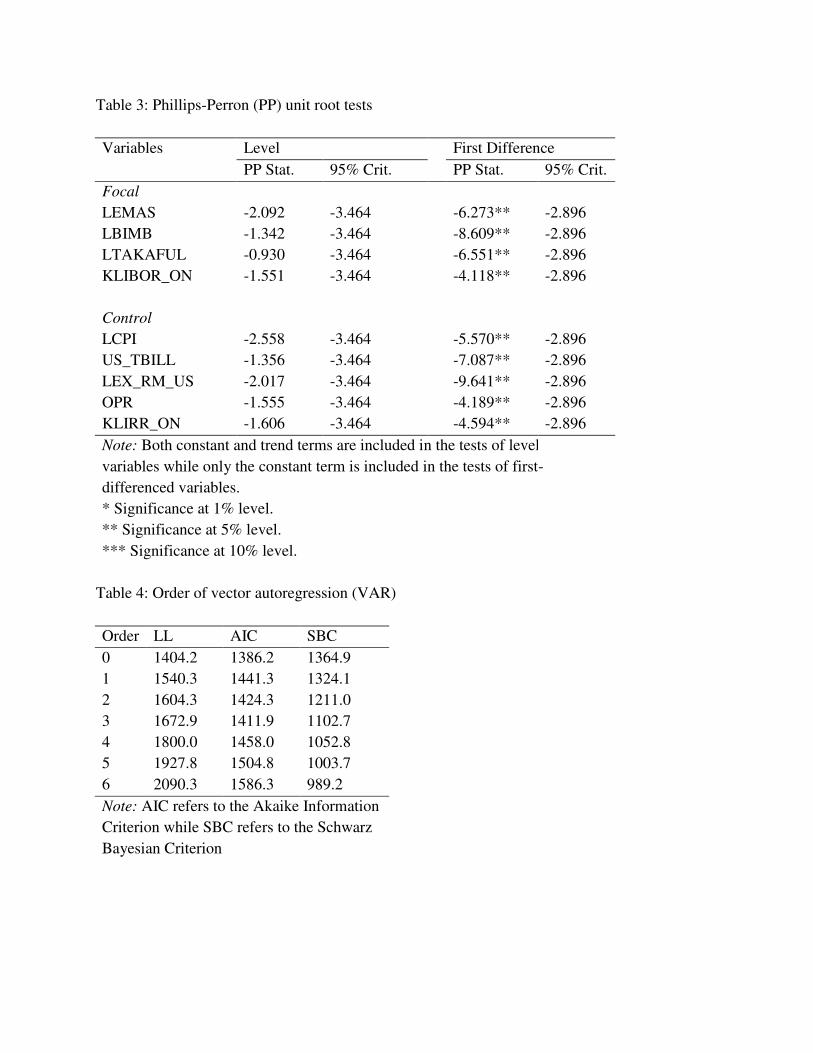
Table 3: Phillips-Perron (PP) unit root tests
Variables Level First Difference
PP Stat. 95% Crit. PP Stat. 95% Crit.
Focal
LEMAS -2.092 -3.464
-6.273** -2.896
LBIMB -1.342 -3.464
-8.609** -2.896
LTAKAFUL -0.930 -3.464
-6.551** -2.896
KLIBOR_ON -1.551 -3.464
-4.118** -2.896
Control
LCPI -2.558 -3.464
-5.570** -2.896
US_TBILL -1.356 -3.464
-7.087** -2.896
LEX_RM_US -2.017 -3.464
-9.641** -2.896
OPR -1.555 -3.464
-4.189** -2.896
KLIRR_ON -1.606 -3.464
-4.594** -2.896
Note: Both constant and trend terms are included in the tests of level
variables while only the constant term is included in the tests of first-
differenced variables.
* Significance at 1% level.
** Significance at 5% level.
*** Significance at 10% level.
Table 4: Order of vector autoregression (VAR)
Order LL AIC SBC
0 1404.2 1386.2 1364.9
1 1540.3 1441.3 1324.1
2 1604.3 1424.3 1211.0
3 1672.9 1411.9 1102.7
4 1800.0 1458.0 1052.8
5 1927.8 1504.8 1003.7
6 2090.3 1586.3 989.2
Note: AIC refers to the Akaike Information
Criterion while SBC refers to the Schwarz
Bayesian Criterion.
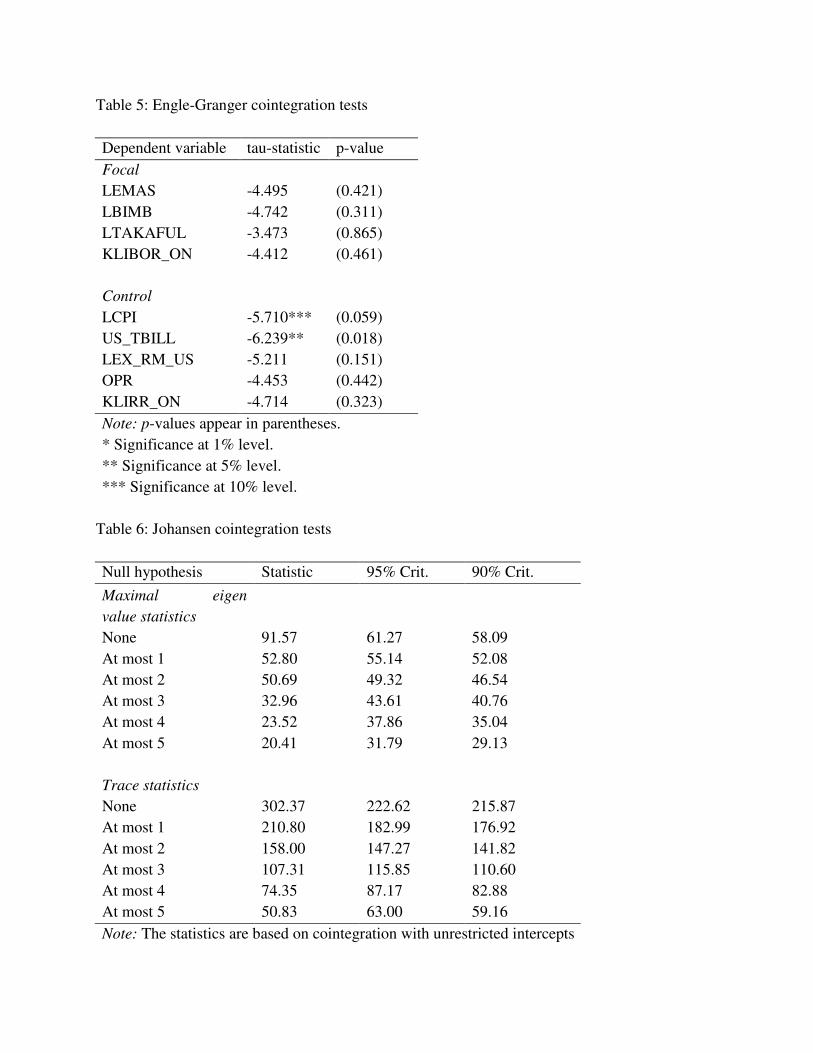
Table 5: Engle-Granger cointegration tests
Dependent variable tau-statistic p-value
Focal
LEMAS -4.495 (0.421)
LBIMB -4.742 (0.311)
LTAKAFUL -3.473 (0.865)
KLIBOR_ON -4.412 (0.461)
Control
LCPI -5.710*** (0.059)
US_TBILL -6.239** (0.018)
LEX_RM_US -5.211 (0.151)
OPR -4.453 (0.442)
KLIRR_ON -4.714 (0.323)
Note: p-values appear in parentheses.
* Significance at 1% level.
** Significance at 5% level.
*** Significance at 10% level.
Table 6: Johansen cointegration tests
Null hypothesis Statistic 95% Crit. 90% Crit.
Maximal eigen
value statistics
None 91.57 61.27 58.09
At most 1 52.80 55.14 52.08
At most 2 50.69 49.32 46.54
At most 3 32.96 43.61 40.76
At most 4 23.52 37.86 35.04
At most 5 20.41 31.79 29.13
Trace statistics
None 302.37 222.62 215.87
At most 1 210.80 182.99 176.92
At most 2 158.00 147.27 141.82
At most 3 107.31 115.85 110.60
At most 4 74.35 87.17 82.88
At most 5 50.83 63.00 59.16
Note: The statistics are based on cointegration with unrestricted intercepts
and restricted trends in the VAR. The order of VAR is set to 2.
Table 7: Long run structural modeling (LRSM) exact-identification of restrictions
Variables Cointegrating Vector
(1) (2) (3)
Focal
LEMAS 1.000 [*NONE*]
0.000 [*NONE*]
0.000 [*NONE*]
LBIMB 0.000 [*NONE*]
1.000 [*NONE*]
0.000 [*NONE*]
LTAKAFUL 0.000 [*NONE*]
0.000 [*NONE*]
1.000 [*NONE*]
KLIBOR_ON 7.233 [5.388]
-13.221 [11.135]
-81.137 [59.999]
Control
LCPI -3.843 [7.643]
12.895 [15.489]
123.293 [85.067]
US_TBILL -0.190 [0.130]
-0.073 [0.265]
1.787 [1.450]
LEX_RM_US 0.952 [0.932]
-1.633 [1.887]
-17.189 [10.369]
OPR -6.856 [5.186]
10.431 [10.732]
74.148 [57.747]
KLIRR_ON -0.114 [0.954]
2.621 [2.186]
2.710 [10.642]
Trend -0.003 [0.011]
-0.053 [0.023]
-0.233 [0.128]
Log-
Likelihood 1715.2
Chi-Square -
-
Note: Standard deviations appear in square brackets.
The LRSM over-identification results on Table 8 indicate the positive long-run
relationship between the overnight KLIBOR and the FTSE Bursa Malaysia EMAS Shari’ah Index but the negative long-run relationship between the overnight KLIBOR and both BIMB
Holdings Bhd. and Syarikat Takaful Malaysia Bhd. stocks. Nevertheless, the magnitude of the
overnight KLIBOR coefficients appear abnormally high along with OPR coefficients of which
the magnitude seems close to that of overnight KLIBOR. Since BNM uses KLIBOR as the
official indicator of Malaysia’s interbank money market, BNM’s monetary policy stance reflected by the OPR may directly target KLIBOR. Thus, the overnight KLIBOR and OPR
coefficients should indicate a collective effect of conventional interest rates on Islamic finance in
Malaysia, all else equal. After considering the sum of the overnight KLIBOR and OPR
coefficients on Table 8 assuming all else equal, the Islamic stock market, Islamic bank and
takaful company under analysis still exhibit the previously identified long-run relationships.
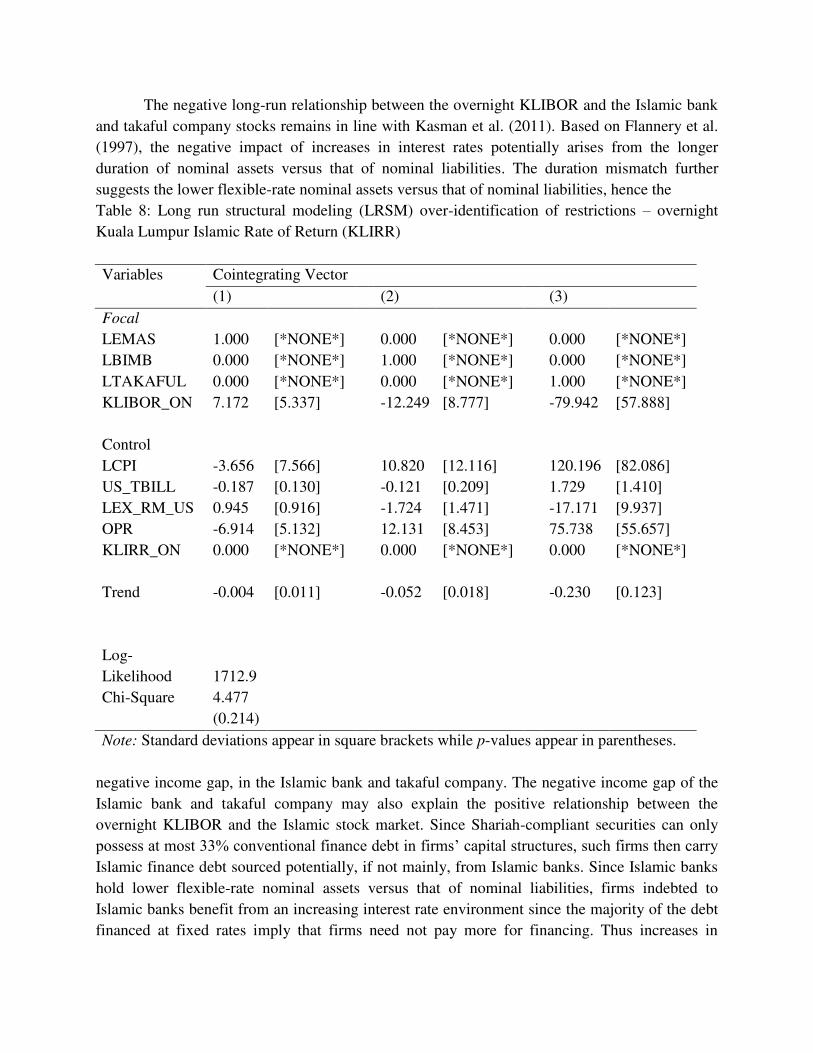
The negative long-run relationship between the overnight KLIBOR and the Islamic bank
and takaful company stocks remains in line with Kasman et al. (2011). Based on Flannery et al.
(1997), the negative impact of increases in interest rates potentially arises from the longer
duration of nominal assets versus that of nominal liabilities. The duration mismatch further
suggests the lower flexible-rate nominal assets versus that of nominal liabilities, hence the
Table 8: Long run structural modeling (LRSM) over-identification of restrictions – overnight
Kuala Lumpur Islamic Rate of Return (KLIRR)
Variables Cointegrating Vector
(1) (2) (3)
Focal
LEMAS 1.000 [*NONE*]
0.000 [*NONE*]
0.000 [*NONE*]
LBIMB 0.000 [*NONE*]
1.000 [*NONE*]
0.000 [*NONE*]
LTAKAFUL 0.000 [*NONE*]
0.000 [*NONE*]
1.000 [*NONE*]
KLIBOR_ON 7.172 [5.337]
-12.249 [8.777]
-79.942 [57.888]
Control
LCPI -3.656 [7.566]
10.820 [12.116]
120.196 [82.086]
US_TBILL -0.187 [0.130]
-0.121 [0.209]
1.729 [1.410]
LEX_RM_US 0.945 [0.916]
-1.724 [1.471]
-17.171 [9.937]
OPR -6.914 [5.132]
12.131 [8.453]
75.738 [55.657]
KLIRR_ON 0.000 [*NONE*]
0.000 [*NONE*]
0.000 [*NONE*]
Trend -0.004 [0.011]
-0.052 [0.018]
-0.230 [0.123]
Log-
Likelihood 1712.9
Chi-Square 4.477
(0.214)
Note: Standard deviations appear in square brackets while p-values appear in parentheses.
negative income gap, in the Islamic bank and takaful company. The negative income gap of the
Islamic bank and takaful company may also explain the positive relationship between the
overnight KLIBOR and the Islamic stock market. Since Shariah-compliant securities can only
possess at most 33% conventional finance debt in firms’ capital structures, such firms then carry Islamic finance debt sourced potentially, if not mainly, from Islamic banks. Since Islamic banks
hold lower flexible-rate nominal assets versus that of nominal liabilities, firms indebted to
Islamic banks benefit from an increasing interest rate environment since the majority of the debt
financed at fixed rates imply that firms need not pay more for financing. Thus increases in
Islamic stock market returns may reflect the savings obtained from no additional financing costs
in an increasing interest rate environment.
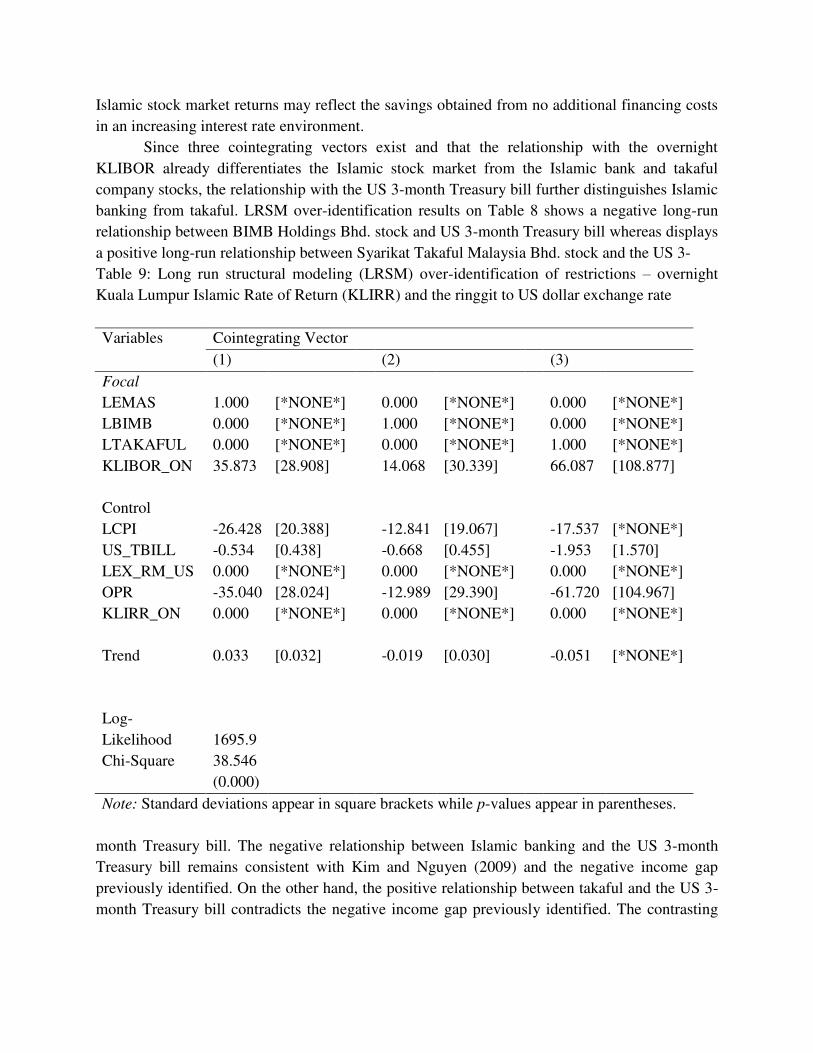
Since three cointegrating vectors exist and that the relationship with the overnight
KLIBOR already differentiates the Islamic stock market from the Islamic bank and takaful
company stocks, the relationship with the US 3-month Treasury bill further distinguishes Islamic
banking from takaful. LRSM over-identification results on Table 8 shows a negative long-run
relationship between BIMB Holdings Bhd. stock and US 3-month Treasury bill whereas displays
a positive long-run relationship between Syarikat Takaful Malaysia Bhd. stock and the US 3-
Table 9: Long run structural modeling (LRSM) over-identification of restrictions – overnight
Kuala Lumpur Islamic Rate of Return (KLIRR) and the ringgit to US dollar exchange rate
Variables Cointegrating Vector
(1) (2) (3)
Focal
LEMAS 1.000 [*NONE*]
0.000 [*NONE*]
0.000 [*NONE*]
LBIMB 0.000 [*NONE*]
1.000 [*NONE*]
0.000 [*NONE*]
LTAKAFUL 0.000 [*NONE*]
0.000 [*NONE*]
1.000 [*NONE*]
KLIBOR_ON 35.873 [28.908]
14.068 [30.339]
66.087 [108.877]
Control
LCPI -26.428 [20.388]
-12.841 [19.067]
-17.537 [*NONE*]
US_TBILL -0.534 [0.438]
-0.668 [0.455]
-1.953 [1.570]
LEX_RM_US 0.000 [*NONE*]
0.000 [*NONE*]
0.000 [*NONE*]
OPR -35.040 [28.024]
-12.989 [29.390]
-61.720 [104.967]
KLIRR_ON 0.000 [*NONE*]
0.000 [*NONE*]
0.000 [*NONE*]
Trend 0.033 [0.032]
-0.019 [0.030]
-0.051 [*NONE*]
Log-
Likelihood 1695.9
Chi-Square 38.546
(0.000)
Note: Standard deviations appear in square brackets while p-values appear in parentheses.
month Treasury bill. The negative relationship between Islamic banking and the US 3-month
Treasury bill remains consistent with Kim and Nguyen (2009) and the negative income gap
previously identified. On the other hand, the positive relationship between takaful and the US 3-
month Treasury bill contradicts the negative income gap previously identified. The contrasting
relationship may emerge from the forecasted increase in collection of takaful contributions due
to the market hedging against potential Islamic banking losses from increases in interest rates.
Aside from OPR and the US 3-month Treasury bill, the Malaysian consumer price index
and ringgit to US dollar exchange rate exhibit long-run relationships with the Islamic finance
components as seen in Table 8. Similar to the long-run relationship with overnight KLIBOR, the
Islamic stock market behaves in an opposite manner compared to Islamic banking and takaful
when interacting with the Malaysian consumer price index and ringgit to US dollar exchange rate
in the long-run. The finding reinforces the varying characteristics of the Islamic stock market
compared to Islamic banking and takaful, potentially due to the difference in sector involvement
– real sector versus financial sector. Despite the extensive discussion of the LRSM results from
Table 8 on the long-run relationships, causality tests such as VECM, VDC, IRFs and persistence
profile serve to verify the relationships and corresponding rationale discussed.
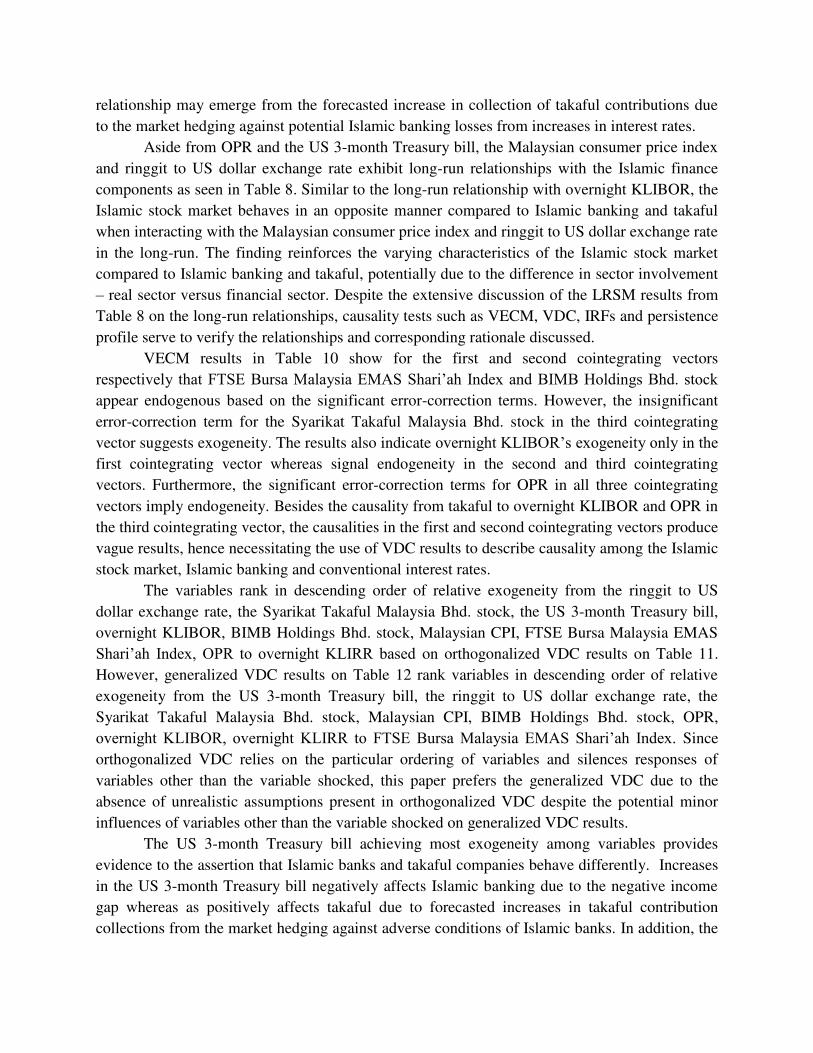
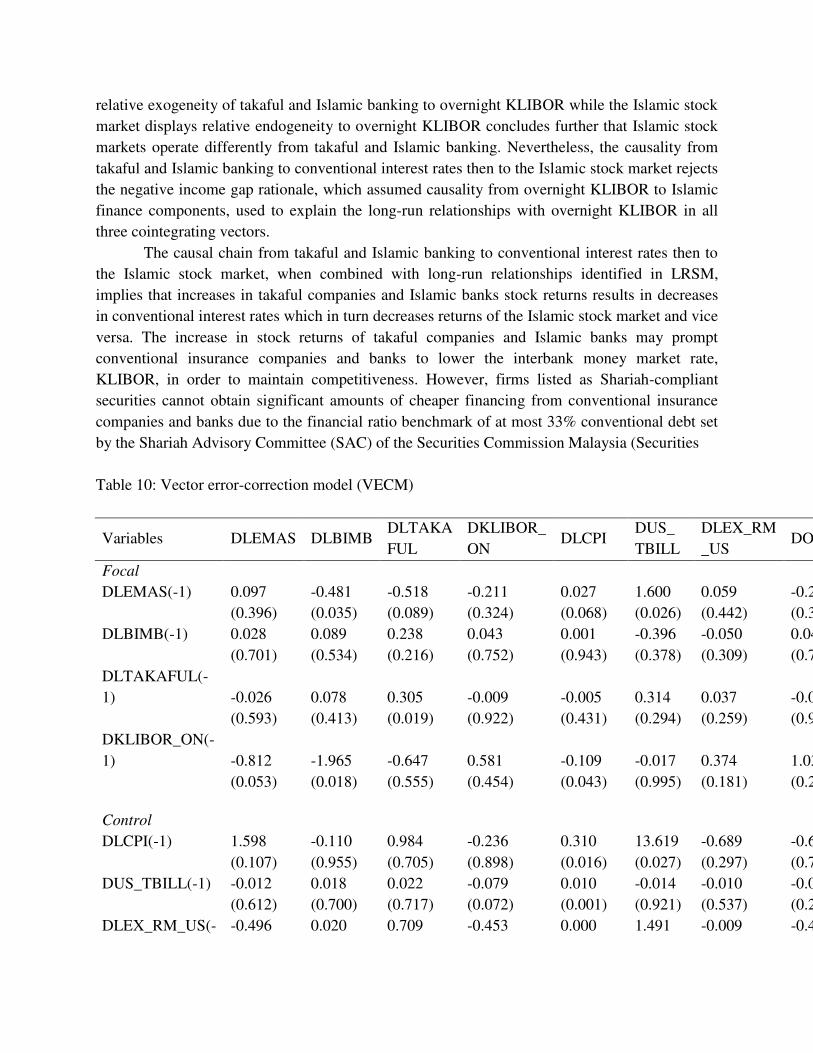
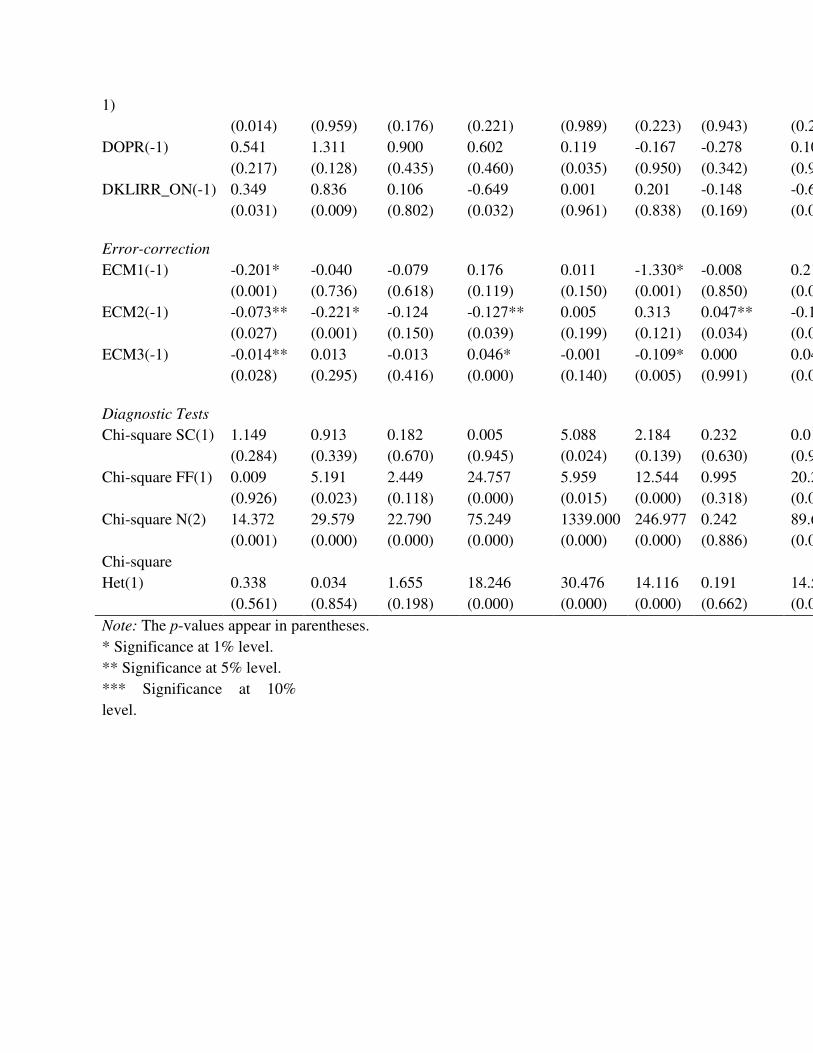
VECM results in Table 10 show for the first and second cointegrating vectors
respectively that FTSE Bursa Malaysia EMAS Shari’ah Index and BIMB Holdings Bhd. stock appear endogenous based on the significant error-correction terms. However, the insignificant
error-correction term for the Syarikat Takaful Malaysia Bhd. stock in the third cointegrating
vector suggests exogeneity. The results also indicate overnight KLIBOR’s exogeneity only in the first cointegrating vector whereas signal endogeneity in the second and third cointegrating
vectors. Furthermore, the significant error-correction terms for OPR in all three cointegrating
vectors imply endogeneity. Besides the causality from takaful to overnight KLIBOR and OPR in
the third cointegrating vector, the causalities in the first and second cointegrating vectors produce
vague results, hence necessitating the use of VDC results to describe causality among the Islamic
stock market, Islamic banking and conventional interest rates.
The variables rank in descending order of relative exogeneity from the ringgit to US
dollar exchange rate, the Syarikat Takaful Malaysia Bhd. stock, the US 3-month Treasury bill,
overnight KLIBOR, BIMB Holdings Bhd. stock, Malaysian CPI, FTSE Bursa Malaysia EMAS
Shari’ah Index, OPR to overnight KLIRR based on orthogonalized VDC results on Table 11.
However, generalized VDC results on Table 12 rank variables in descending order of relative
exogeneity from the US 3-month Treasury bill, the ringgit to US dollar exchange rate, the
Syarikat Takaful Malaysia Bhd. stock, Malaysian CPI, BIMB Holdings Bhd. stock, OPR,
overnight KLIBOR, overnight KLIRR to FTSE Bursa Malaysia EMAS Shari’ah Index. Since
orthogonalized VDC relies on the particular ordering of variables and silences responses of
variables other than the variable shocked, this paper prefers the generalized VDC due to the
absence of unrealistic assumptions present in orthogonalized VDC despite the potential minor
influences of variables other than the variable shocked on generalized VDC results.
The US 3-month Treasury bill achieving most exogeneity among variables provides
evidence to the assertion that Islamic banks and takaful companies behave differently. Increases
in the US 3-month Treasury bill negatively affects Islamic banking due to the negative income
gap whereas as positively affects takaful due to forecasted increases in takaful contribution
collections from the market hedging against adverse conditions of Islamic banks. In addition, the
relative exogeneity of takaful and Islamic banking to overnight KLIBOR while the Islamic stock
market displays relative endogeneity to overnight KLIBOR concludes further that Islamic stock
markets operate differently from takaful and Islamic banking. Nevertheless, the causality from
takaful and Islamic banking to conventional interest rates then to the Islamic stock market rejects
the negative income gap rationale, which assumed causality from overnight KLIBOR to Islamic
finance components, used to explain the long-run relationships with overnight KLIBOR in all
three cointegrating vectors.
The causal chain from takaful and Islamic banking to conventional interest rates then to
the Islamic stock market, when combined with long-run relationships identified in LRSM,
implies that increases in takaful companies and Islamic banks stock returns results in decreases
in conventional interest rates which in turn decreases returns of the Islamic stock market and vice
versa. The increase in stock returns of takaful companies and Islamic banks may prompt
conventional insurance companies and banks to lower the interbank money market rate,
KLIBOR, in order to maintain competitiveness. However, firms listed as Shariah-compliant
securities cannot obtain significant amounts of cheaper financing from conventional insurance
companies and banks due to the financial ratio benchmark of at most 33% conventional debt set
by the Shariah Advisory Committee (SAC) of the Securities Commission Malaysia (Securities
Table 10: Vector error-correction model (VECM)
Variables DLEMAS DLBIMB DLTAKA
FUL
DKLIBOR_
ON DLCPI
DUS_
TBILL
DLEX_RM
_US DOP
Focal
DLEMAS(-1) 0.097 -0.481 -0.518 -0.211 0.027 1.600 0.059 -0.234
(0.396) (0.035) (0.089) (0.324) (0.068) (0.026) (0.442) (0.30
DLBIMB(-1) 0.028 0.089 0.238 0.043 0.001 -0.396 -0.050 0.041
(0.701) (0.534) (0.216) (0.752) (0.943) (0.378) (0.309) (0.77
DLTAKAFUL(-
1) -0.026 0.078 0.305 -0.009 -0.005 0.314 0.037 -0.005
(0.593) (0.413) (0.019) (0.922) (0.431) (0.294) (0.259) (0.95
DKLIBOR_ON(-
1) -0.812 -1.965 -0.647 0.581 -0.109 -0.017 0.374 1.035
(0.053) (0.018) (0.555) (0.454) (0.043) (0.995) (0.181) (0.21
Control
DLCPI(-1) 1.598 -0.110 0.984 -0.236 0.310 13.619 -0.689 -0.678
(0.107) (0.955) (0.705) (0.898) (0.016) (0.027) (0.297) (0.72
DUS_TBILL(-1) -0.012 0.018 0.022 -0.079 0.010 -0.014 -0.010 -0.058
(0.612) (0.700) (0.717) (0.072) (0.001) (0.921) (0.537) (0.21
DLEX_RM_US(- -0.496 0.020 0.709 -0.453 0.000 1.491 -0.009 -0.487
1)
(0.014) (0.959) (0.176) (0.221) (0.989) (0.223) (0.943) (0.21
DOPR(-1) 0.541 1.311 0.900 0.602 0.119 -0.167 -0.278 0.106
(0.217) (0.128) (0.435) (0.460) (0.035) (0.950) (0.342) (0.90
DKLIRR_ON(-1) 0.349 0.836 0.106 -0.649 0.001 0.201 -0.148 -0.634
(0.031) (0.009) (0.802) (0.032) (0.961) (0.838) (0.169) (0.04
Error-correction
ECM1(-1) -0.201* -0.040 -0.079 0.176 0.011 -1.330* -0.008 0.213***
(0.001) (0.736) (0.618) (0.119) (0.150) (0.001) (0.850) (0.07
ECM2(-1) -0.073** -0.221* -0.124 -0.127** 0.005 0.313 0.047** -0.142**
(0.027) (0.001) (0.150) (0.039) (0.199) (0.121) (0.034) (0.03
ECM3(-1) -0.014** 0.013 -0.013 0.046* -0.001 -0.109* 0.000 0.049*
(0.028) (0.295) (0.416) (0.000) (0.140) (0.005) (0.991) (0.00
Diagnostic Tests
Chi-square SC(1) 1.149 0.913 0.182 0.005 5.088 2.184 0.232 0.011
(0.284) (0.339) (0.670) (0.945) (0.024) (0.139) (0.630) (0.91
Chi-square FF(1) 0.009 5.191 2.449 24.757 5.959 12.544 0.995 20.204
(0.926) (0.023) (0.118) (0.000) (0.015) (0.000) (0.318) (0.00
Chi-square N(2) 14.372 29.579 22.790 75.249 1339.000 246.977 0.242 89.654
(0.001) (0.000) (0.000) (0.000) (0.000) (0.000) (0.886) (0.00
Chi-square
Het(1) 0.338 0.034 1.655 18.246 30.476 14.116 0.191 14.534
(0.561) (0.854) (0.198) (0.000) (0.000) (0.000) (0.662) (0.00
Note: The p-values appear in parentheses.
* Significance at 1% level.
** Significance at 5% level.
*** Significance at 10%
level.
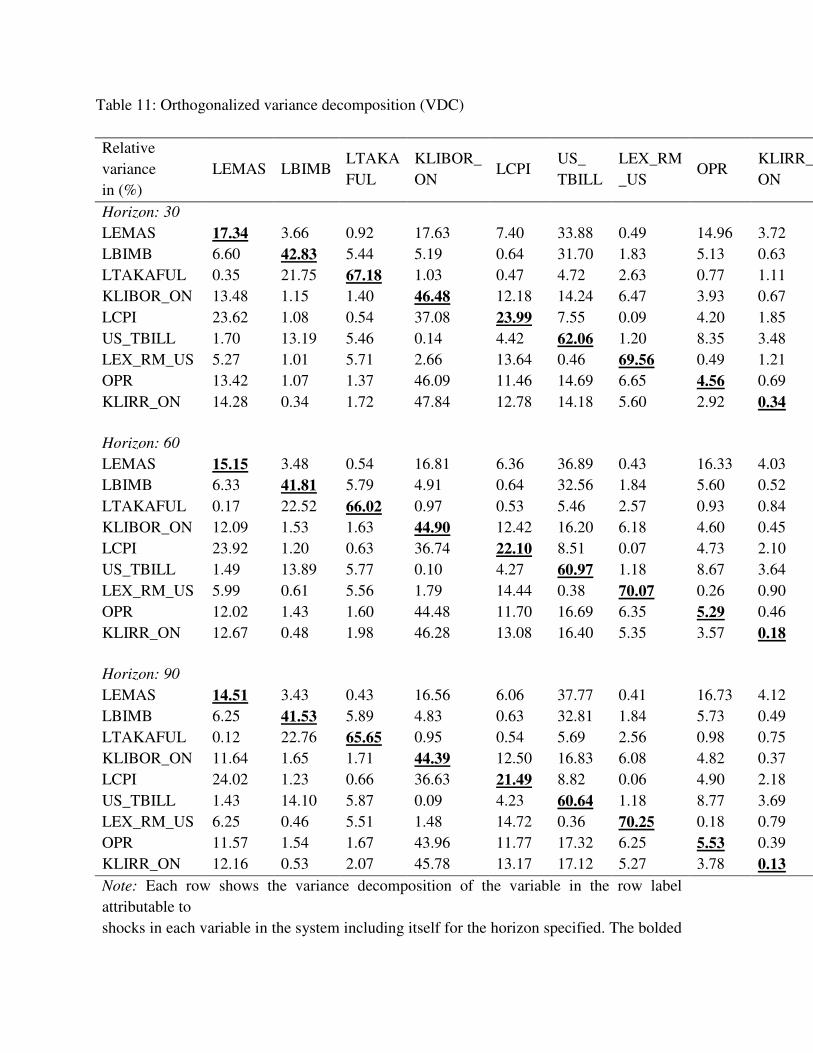
Table 11: Orthogonalized variance decomposition (VDC)
Relative
variance
in (%)
LEMAS LBIMB LTAKA
FUL
KLIBOR_
ON LCPI
US_
TBILL
LEX_RM
_US OPR
KLIRR_
ON
Horizon: 30
LEMAS 17.34 3.66 0.92 17.63 7.40 33.88 0.49 14.96 3.72
LBIMB 6.60 42.83 5.44 5.19 0.64 31.70 1.83 5.13 0.63
LTAKAFUL 0.35 21.75 67.18 1.03 0.47 4.72 2.63 0.77 1.11
KLIBOR_ON 13.48 1.15 1.40 46.48 12.18 14.24 6.47 3.93 0.67
LCPI 23.62 1.08 0.54 37.08 23.99 7.55 0.09 4.20 1.85
US_TBILL 1.70 13.19 5.46 0.14 4.42 62.06 1.20 8.35 3.48
LEX_RM_US 5.27 1.01 5.71 2.66 13.64 0.46 69.56 0.49 1.21
OPR 13.42 1.07 1.37 46.09 11.46 14.69 6.65 4.56 0.69
KLIRR_ON 14.28 0.34 1.72 47.84 12.78 14.18 5.60 2.92 0.34
Horizon: 60
LEMAS 15.15 3.48 0.54 16.81 6.36 36.89 0.43 16.33 4.03
LBIMB 6.33 41.81 5.79 4.91 0.64 32.56 1.84 5.60 0.52
LTAKAFUL 0.17 22.52 66.02 0.97 0.53 5.46 2.57 0.93 0.84
KLIBOR_ON 12.09 1.53 1.63 44.90 12.42 16.20 6.18 4.60 0.45
LCPI 23.92 1.20 0.63 36.74 22.10 8.51 0.07 4.73 2.10
US_TBILL 1.49 13.89 5.77 0.10 4.27 60.97 1.18 8.67 3.64
LEX_RM_US 5.99 0.61 5.56 1.79 14.44 0.38 70.07 0.26 0.90
OPR 12.02 1.43 1.60 44.48 11.70 16.69 6.35 5.29 0.46
KLIRR_ON 12.67 0.48 1.98 46.28 13.08 16.40 5.35 3.57 0.18
Horizon: 90
LEMAS 14.51 3.43 0.43 16.56 6.06 37.77 0.41 16.73 4.12
LBIMB 6.25 41.53 5.89 4.83 0.63 32.81 1.84 5.73 0.49
LTAKAFUL 0.12 22.76 65.65 0.95 0.54 5.69 2.56 0.98 0.75
KLIBOR_ON 11.64 1.65 1.71 44.39 12.50 16.83 6.08 4.82 0.37
LCPI 24.02 1.23 0.66 36.63 21.49 8.82 0.06 4.90 2.18
US_TBILL 1.43 14.10 5.87 0.09 4.23 60.64 1.18 8.77 3.69
LEX_RM_US 6.25 0.46 5.51 1.48 14.72 0.36 70.25 0.18 0.79
OPR 11.57 1.54 1.67 43.96 11.77 17.32 6.25 5.53 0.39
KLIRR_ON 12.16 0.53 2.07 45.78 13.17 17.12 5.27 3.78 0.13
Note: Each row shows the variance decomposition of the variable in the row label
attributable to
shocks in each variable in the system including itself for the horizon specified. The bolded

and
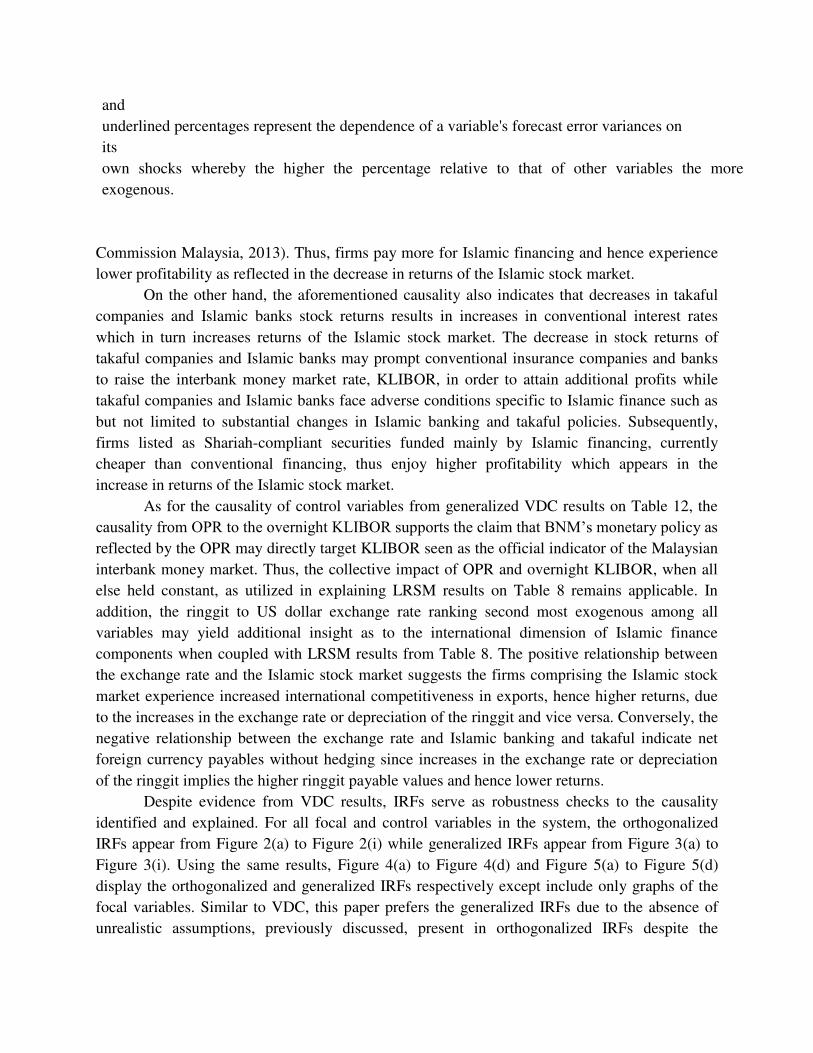
underlined percentages represent the dependence of a variable's forecast error variances on
its
own shocks whereby the higher the percentage relative to that of other variables the more
exogenous.
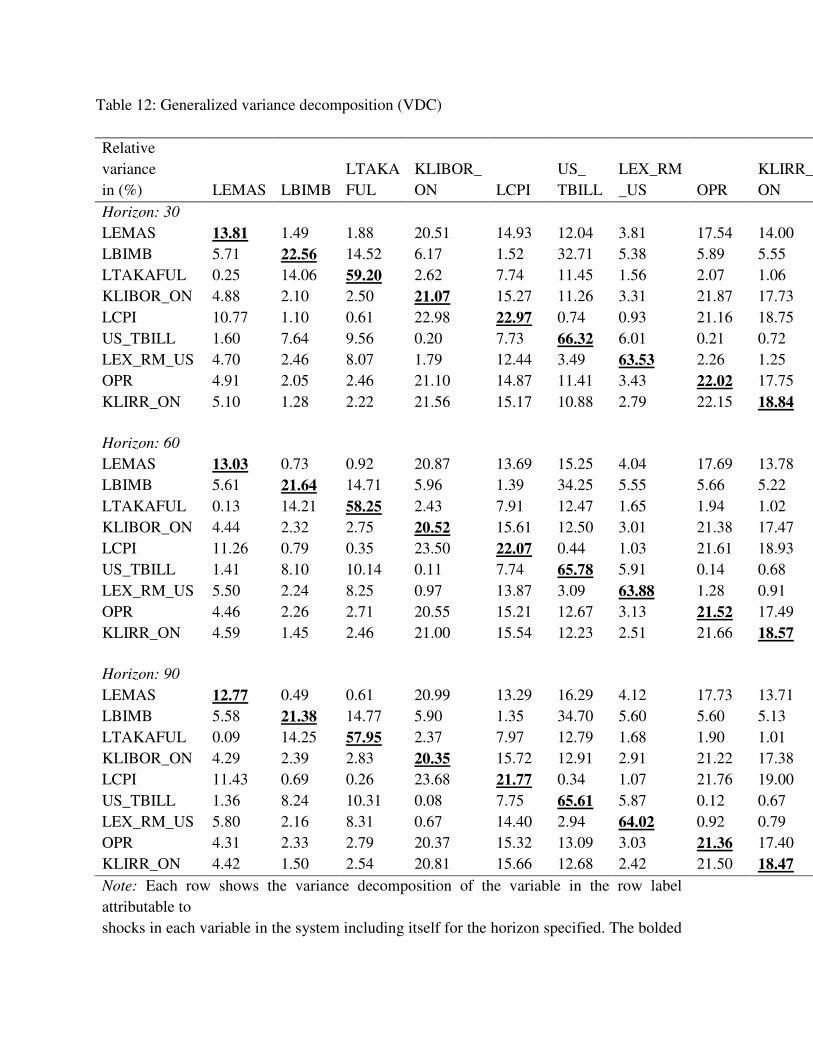
Table 12: Generalized variance decomposition (VDC)
Relative
variance
in (%) LEMAS LBIMB
LTAKA
FUL
KLIBOR_
ON LCPI
US_
TBILL
LEX_RM
_US OPR
KLIRR_
ON
Horizon: 30
LEMAS 13.81 1.49 1.88 20.51 14.93 12.04 3.81 17.54 14.00
LBIMB 5.71 22.56 14.52 6.17 1.52 32.71 5.38 5.89 5.55
LTAKAFUL 0.25 14.06 59.20 2.62 7.74 11.45 1.56 2.07 1.06
KLIBOR_ON 4.88 2.10 2.50 21.07 15.27 11.26 3.31 21.87 17.73
LCPI 10.77 1.10 0.61 22.98 22.97 0.74 0.93 21.16 18.75
US_TBILL 1.60 7.64 9.56 0.20 7.73 66.32 6.01 0.21 0.72
LEX_RM_US 4.70 2.46 8.07 1.79 12.44 3.49 63.53 2.26 1.25
OPR 4.91 2.05 2.46 21.10 14.87 11.41 3.43 22.02 17.75
KLIRR_ON 5.10 1.28 2.22 21.56 15.17 10.88 2.79 22.15 18.84
Horizon: 60
LEMAS 13.03 0.73 0.92 20.87 13.69 15.25 4.04 17.69 13.78
LBIMB 5.61 21.64 14.71 5.96 1.39 34.25 5.55 5.66 5.22
LTAKAFUL 0.13 14.21 58.25 2.43 7.91 12.47 1.65 1.94 1.02
KLIBOR_ON 4.44 2.32 2.75 20.52 15.61 12.50 3.01 21.38 17.47
LCPI 11.26 0.79 0.35 23.50 22.07 0.44 1.03 21.61 18.93
US_TBILL 1.41 8.10 10.14 0.11 7.74 65.78 5.91 0.14 0.68
LEX_RM_US 5.50 2.24 8.25 0.97 13.87 3.09 63.88 1.28 0.91
OPR 4.46 2.26 2.71 20.55 15.21 12.67 3.13 21.52 17.49
KLIRR_ON 4.59 1.45 2.46 21.00 15.54 12.23 2.51 21.66 18.57
Horizon: 90
LEMAS 12.77 0.49 0.61 20.99 13.29 16.29 4.12 17.73 13.71
LBIMB 5.58 21.38 14.77 5.90 1.35 34.70 5.60 5.60 5.13
LTAKAFUL 0.09 14.25 57.95 2.37 7.97 12.79 1.68 1.90 1.01
KLIBOR_ON 4.29 2.39 2.83 20.35 15.72 12.91 2.91 21.22 17.38
LCPI 11.43 0.69 0.26 23.68 21.77 0.34 1.07 21.76 19.00
US_TBILL 1.36 8.24 10.31 0.08 7.75 65.61 5.87 0.12 0.67
LEX_RM_US 5.80 2.16 8.31 0.67 14.40 2.94 64.02 0.92 0.79
OPR 4.31 2.33 2.79 20.37 15.32 13.09 3.03 21.36 17.40
KLIRR_ON 4.42 1.50 2.54 20.81 15.66 12.68 2.42 21.50 18.47
Note: Each row shows the variance decomposition of the variable in the row label
attributable to
shocks in each variable in the system including itself for the horizon specified. The bolded
and
underlined percentages represent the dependence of a variable's forecast error variances on
its
own shocks whereby the higher the percentage relative to that of other variables the more
exogenous.
Commission Malaysia, 2013). Thus, firms pay more for Islamic financing and hence experience
lower profitability as reflected in the decrease in returns of the Islamic stock market.
On the other hand, the aforementioned causality also indicates that decreases in takaful
companies and Islamic banks stock returns results in increases in conventional interest rates
which in turn increases returns of the Islamic stock market. The decrease in stock returns of
takaful companies and Islamic banks may prompt conventional insurance companies and banks
to raise the interbank money market rate, KLIBOR, in order to attain additional profits while
takaful companies and Islamic banks face adverse conditions specific to Islamic finance such as
but not limited to substantial changes in Islamic banking and takaful policies. Subsequently,
firms listed as Shariah-compliant securities funded mainly by Islamic financing, currently
cheaper than conventional financing, thus enjoy higher profitability which appears in the
increase in returns of the Islamic stock market.
As for the causality of control variables from generalized VDC results on Table 12, the
causality from OPR to the overnight KLIBOR supports the claim that BNM’s monetary policy as reflected by the OPR may directly target KLIBOR seen as the official indicator of the Malaysian
interbank money market. Thus, the collective impact of OPR and overnight KLIBOR, when all
else held constant, as utilized in explaining LRSM results on Table 8 remains applicable. In
addition, the ringgit to US dollar exchange rate ranking second most exogenous among all
variables may yield additional insight as to the international dimension of Islamic finance
components when coupled with LRSM results from Table 8. The positive relationship between
the exchange rate and the Islamic stock market suggests the firms comprising the Islamic stock
market experience increased international competitiveness in exports, hence higher returns, due
to the increases in the exchange rate or depreciation of the ringgit and vice versa. Conversely, the
negative relationship between the exchange rate and Islamic banking and takaful indicate net
foreign currency payables without hedging since increases in the exchange rate or depreciation
of the ringgit implies the higher ringgit payable values and hence lower returns.
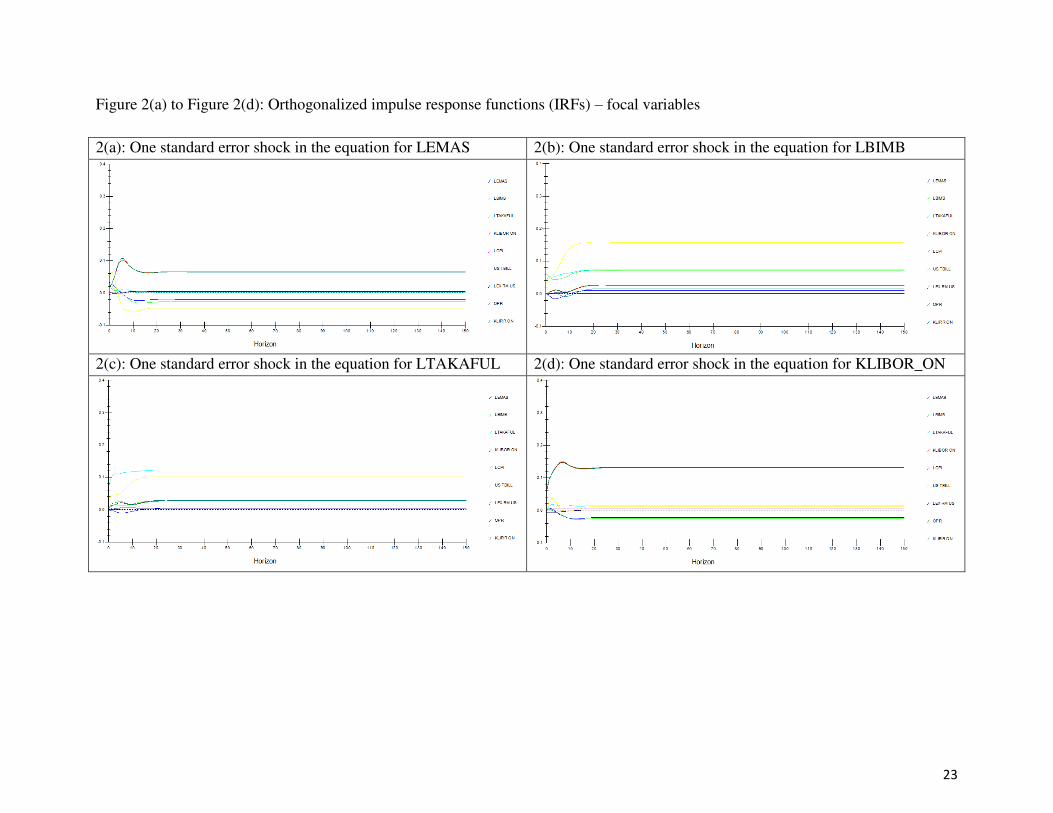
Despite evidence from VDC results, IRFs serve as robustness checks to the causality
identified and explained. For all focal and control variables in the system, the orthogonalized
IRFs appear from Figure 2(a) to Figure 2(i) while generalized IRFs appear from Figure 3(a) to
Figure 3(i). Using the same results, Figure 4(a) to Figure 4(d) and Figure 5(a) to Figure 5(d)
display the orthogonalized and generalized IRFs respectively except include only graphs of the
focal variables. Similar to VDC, this paper prefers the generalized IRFs due to the absence of
unrealistic assumptions, previously discussed, present in orthogonalized IRFs despite the
potential minor influences of variables other than the variable shocked on generalized IRF
results. Based on Figure 5(a) to Figure 5(d), the generalized IRFs indicate, similar to that of
generalized VDC results, the causality from Syarikat Takaful Malaysia Bhd. and BIMB Holdings
Bhd. stocks to overnight KLIBOR then to FTSE Bursa Malaysia EMAS Shari’ah Index. However, the generalized IRFs from Figure 5(a) to Figure 5(d) also suggest the causality
from conventional interest rates to Islamic banking and from the Islamic stock market to
conventional interest rates. The causality from conventional interest rates to Islamic banking
supports the negative income gap previously considered whereby increases in interest rates
negatively affect Islamic banks due to the higher fixed-rate nominal assets versus fixed-rate
nominal liabilities and vice versa. On the other hand, the causality from the Islamic stock market
to conventional interest rates, of which a positive long-run relationship exists based on LRSM
results, whereby increases in returns of the Islamic stock market results in increases in
conventional interest rates and vice versa opens a new discussion avenue for this paper.
23
Figure 2(a) to Figure 2(d): Orthogonalized impulse response functions (IRFs) – focal variables
2(a): One standard error shock in the equation for LEMAS 2(b): One standard error shock in the equation for LBIMB
2(c): One standard error shock in the equation for LTAKAFUL 2(d): One standard error shock in the equation for KLIBOR_ON
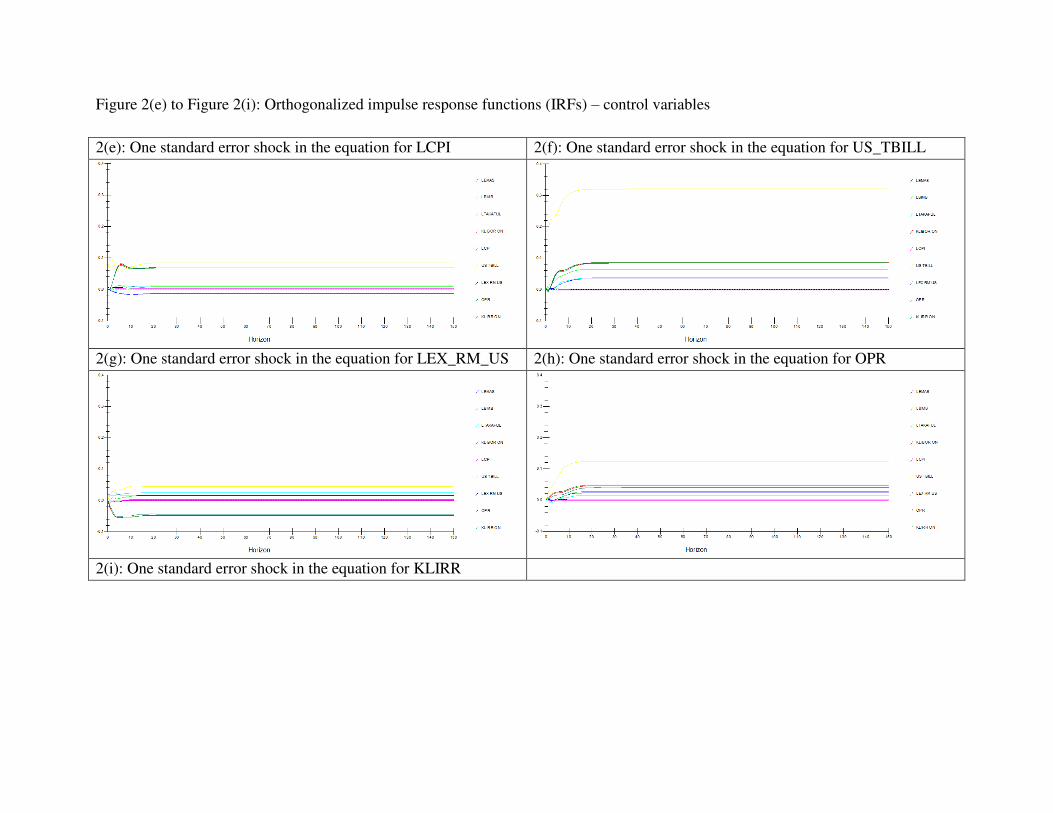
Figure 2(e) to Figure 2(i): Orthogonalized impulse response functions (IRFs) – control variables
2(e): One standard error shock in the equation for LCPI 2(f): One standard error shock in the equation for US_TBILL
2(g): One standard error shock in the equation for LEX_RM_US 2(h): One standard error shock in the equation for OPR
2(i): One standard error shock in the equation for KLIRR
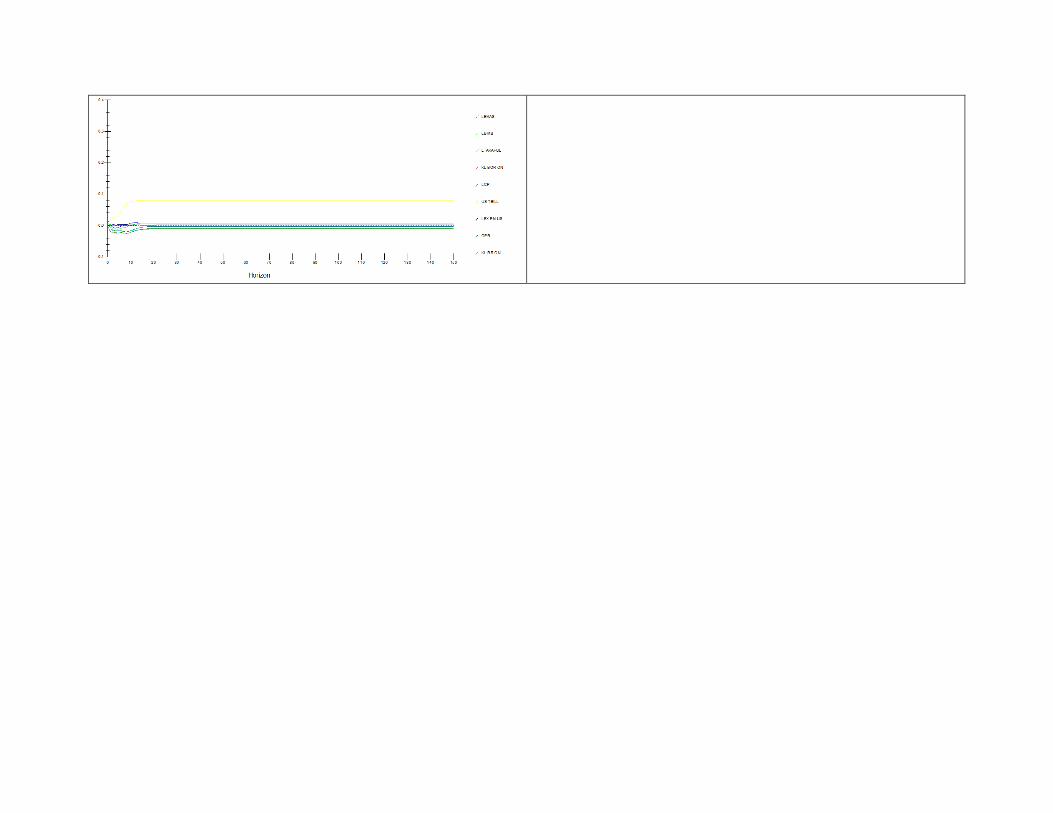
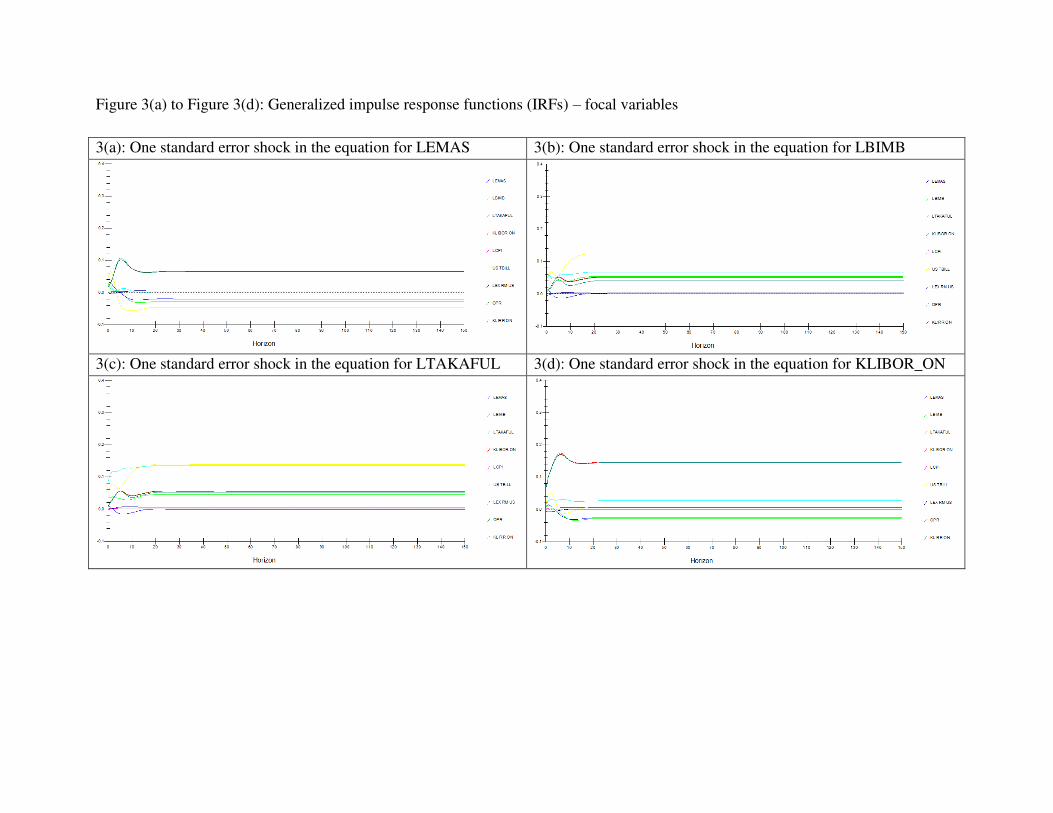
Figure 3(a) to Figure 3(d): Generalized impulse response functions (IRFs) – focal variables
3(a): One standard error shock in the equation for LEMAS 3(b): One standard error shock in the equation for LBIMB
3(c): One standard error shock in the equation for LTAKAFUL 3(d): One standard error shock in the equation for KLIBOR_ON
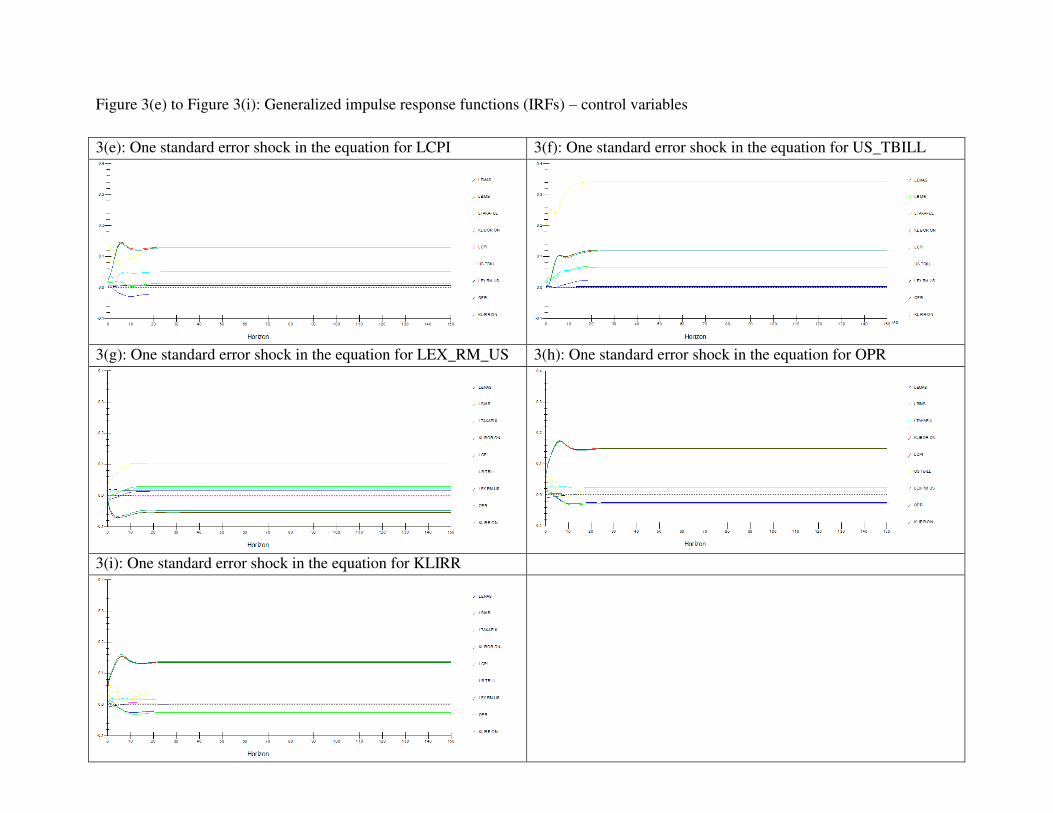
Figure 3(e) to Figure 3(i): Generalized impulse response functions (IRFs) – control variables
3(e): One standard error shock in the equation for LCPI 3(f): One standard error shock in the equation for US_TBILL
3(g): One standard error shock in the equation for LEX_RM_US 3(h): One standard error shock in the equation for OPR
3(i): One standard error shock in the equation for KLIRR

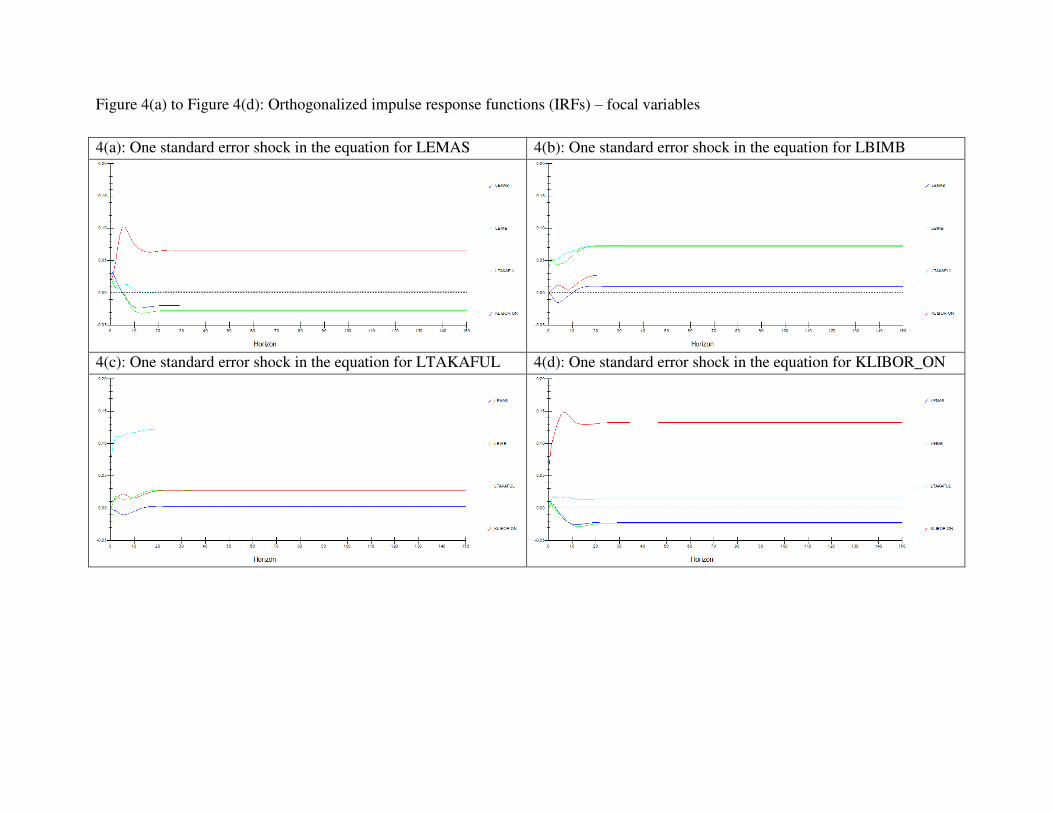
Figure 4(a) to Figure 4(d): Orthogonalized impulse response functions (IRFs) – focal variables
4(a): One standard error shock in the equation for LEMAS 4(b): One standard error shock in the equation for LBIMB
4(c): One standard error shock in the equation for LTAKAFUL 4(d): One standard error shock in the equation for KLIBOR_ON
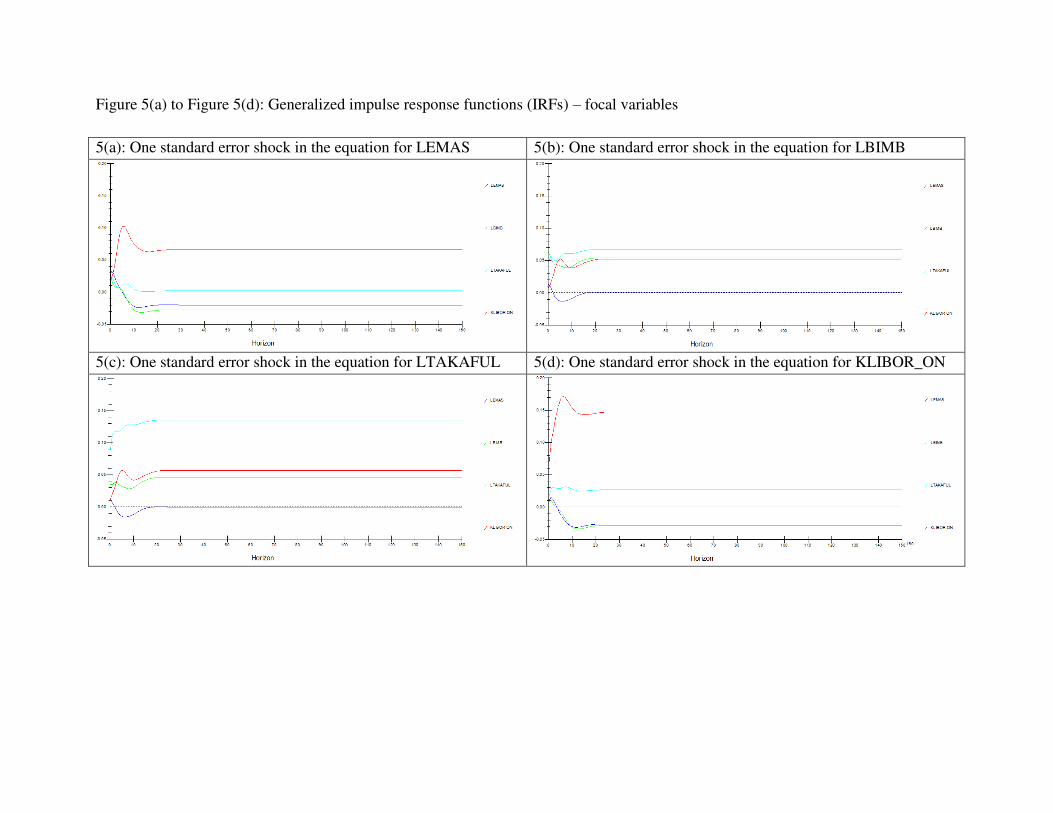
Figure 5(a) to Figure 5(d): Generalized impulse response functions (IRFs) – focal variables
5(a): One standard error shock in the equation for LEMAS 5(b): One standard error shock in the equation for LBIMB
5(c): One standard error shock in the equation for LTAKAFUL 5(d): One standard error shock in the equation for KLIBOR_ON
31
Nevertheless, such causality remains plausible when accounting for OPR of which also exhibits
causality from the Islamic stock market to OPR of approximately similar magnitude to that of
overnight KLIBOR as shown by Figure 3(a).
Since BNM accounts for the condition of the domestic economy when deciding on the
OPR which in turn may directly target KLIBOR, the Islamic stock market, although a subset of
firms in the Malaysian economy, should generally exhibit the overall condition of the domestic
economy (BNM, 2014). In addition, Figure 6 shows the lowering of the OPR, of which the
overnight KLIBOR followed, in quarter 4 of 2008 after the decline of the FTSE Bursa Malaysia
EMAS Shari’ah Index which started in quarter 1 of 2008 and continued up to quarter 4 of 2008.
Consequently, Figure 6 also displays the raising of the OPR, of which the overnight KLIBOR
followed, in quarter 1 of 2010 to quarter 2 of 2011 after the rise of the FTSE Bursa Malaysia
EMAS Shari’ah Index which started in quarter 1 of 2009 and continued up to quarter 4 of 2013.
Thus, BNM’s observation of the domestic economic conditions, which include the Islamic stock
market, when determining the OPR rationalizes the causality from the Islamic stock market to
OPR which in turn explains the causality from the Islamic stock market to overnight KLIBOR.
The FTSE Bursa Malaysia EMAS Shari’ah Index, BIMB Holdings Bhd. stock and
Syarikat Takaful Malaysia Bhd. stock cointegrating vectors return completely to equilibrium
from a system-wide shock in 55, 52 and 48 months respectively. Nevertheless, the
aforementioned Islamic stock market, Islamic bank and takaful company return approximately to
equilibrium in 19, 17 and 18 months respectively based on the persistence profile in Figure 7.
Figure 6: FTSE Bursa Malaysia EMAS Shari’ah Index (in RM), overnight policy rate (OPR) and overnight KLIBOR (in %) from November 2006 to December 2013
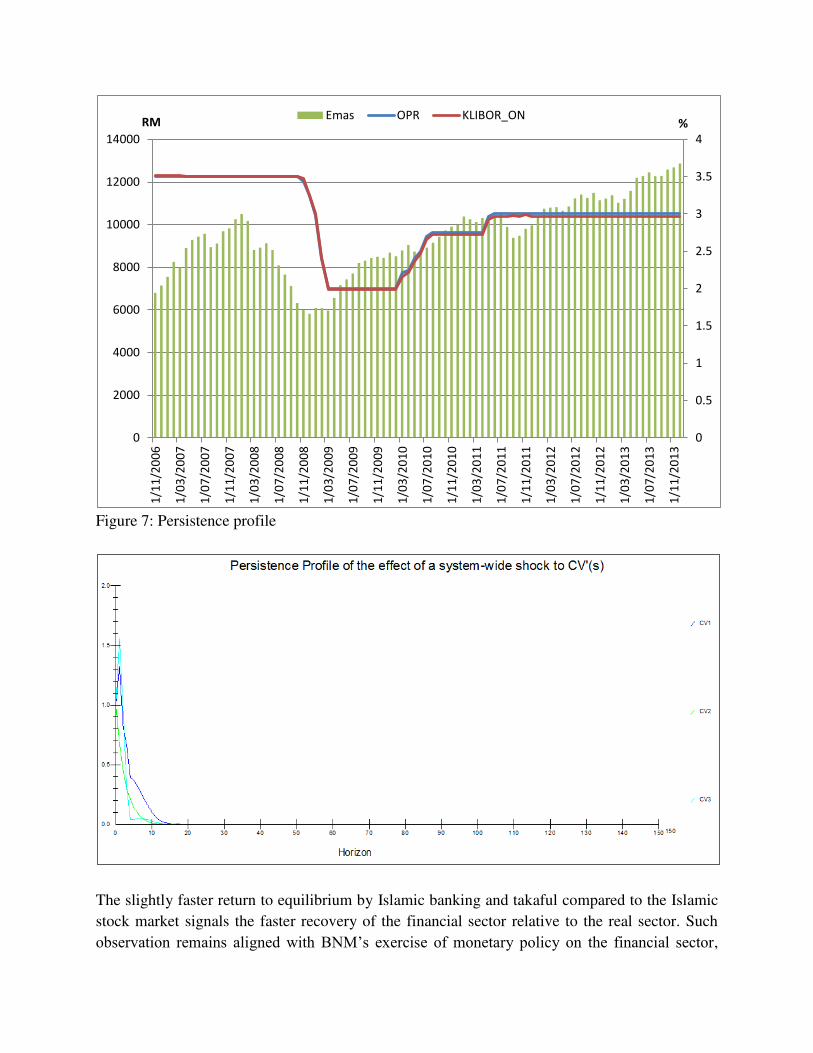
Figure 7: Persistence profile
The slightly faster return to equilibrium by Islamic banking and takaful compared to the Islamic
stock market signals the faster recovery of the financial sector relative to the real sector. Such
observation remains aligned with BNM’s exercise of monetary policy on the financial sector,
0
0.5
1
1.5
2
2.5
3
3.5
4
0
2000
4000
6000
8000
10000
12000
14000
1/1
1/2
00
6
1/0
3/2
00
7
1/0
7/2
00
7
1/1
1/2
00
7
1/0
3/2
00
8
1/0
7/2
00
8
1/1
1/2
00
8
1/0
3/2
00
9
1/0
7/2
00
9
1/1
1/2
00
9
1/0
3/2
01
0
1/0
7/2
01
0
1/1
1/2
01
0
1/0
3/2
01
1
1/0
7/2
01
1
1/1
1/2
01
1
1/0
3/2
01
2
1/0
7/2
01
2
1/1
1/2
01
2
1/0
3/2
01
3
1/0
7/2
01
3
1/1
1/2
01
3
%RMEmas OPR KLIBOR_ON
especially banking, to influence the real sector. The assertion receives support from evidence
such as the adjustment of the OPR based on the FTSE Bursa Malaysia EMAS Shari’ah Index as
seen in Figure 6 and the response of Islamic banking to OPR shocks based on the IRF in Figure
3(h) indicating the transmission of monetary policy. Thus, the intervention of the central bank on
the financial sector, particularly in banking, to influence the real sector signals the necessity to
stabilize the financial sector prior to stabilizing the real sector as per persistence profile results.
5. Conclusion
This paper employs time series techniques to understand the different impact of
conventional interest rates on Islamic stock markets, Islamic banking and Islamic insurance
(called takaful) through obtaining evidence from Malaysia. Results suggest the distinct
interaction of each Islamic finance component with conventional interest rates – the positive
long-run relationship and bidirectional causality between Islamic stock markets and conventional
interest rates, the negative long-run relationship and bidirectional causality between Islamic
banking and conventional interest rates, and the negative long-run relationship and unidirectional
causality from Islamic insurance to conventional interest rates.
Conventional interest rates exhibit causality towards Islamic stock markets and Islamic
banking although demonstrating a positive long-run relationship with Islamic stock markets
versus a negative long-run relationship with Islamic banking. The negative long-run relationship
and causality from conventional interest rates to Islamic banking may arise from the negative
income gap due to the lower flexible-rate nominal assets versus flexible-rate nominal liabilities
held by Islamic banks. An increasing interest rate environment implies the increase of payments
on nominal liabilities exceeding the increase of receipts from nominal assets, hence lowering
Islamic banking profitability. Furthermore, the lower flexible-rate nominal assets of which may
primarily finance firms listed as Shariah-compliant stocks translates into cheaper fixed-rate
financing for the firms in the increasing interest rate environment, thus explaining the positive
long-run relationship and causality from conventional interest rates to Islamic stock markets.
However, a decreasing interest rate environment increases Islamic banking profitability from
lower payments, or cost, on nominal liabilities exceeding lower receipts, or revenue, from
nominal assets, whereas decreases Islamic stock market returns due to higher Islamic financing
costs from mostly fixed-rate financing. Hence the impact of conventional interest rates on
Islamic stock markets and Islamic banking stems from the negative income gap of Islamic banks.
Remarkably, causality from Islamic stock markets, Islamic banking and takaful to
conventional interest rates exists although the impact of Islamic banking and takaful versus that
of Islamic stock markets on conventional interest rates differs. On one hand, the negative long-
run relationship and causality from Islamic banking and takaful to conventional interest rates
indicates the reaction of conventional banking and insurance to maintain competitiveness against
Islamic banking and takaful. Increases in Islamic banking and takaful returns motivate
conventional banking and insurance to lower interest rates in order to attract more customers

through cheaper financing. Conversely, decreases in Islamic banking and takaful returns
stimulate conventional banking and insurance to raise interest rates in order to attain additional
profits in light of adverse conditions specific to Islamic finance such as but not limited to
substantial changes in Islamic banking and takaful policies. On the other hand, the positive long-
run relationship and causality from Islamic stock markets to conventional interest rates imply the
incorporation of real sector conditions when the financial sector, especially central banks,
decides on conventional interest rates. Such relationship illustrates the increase in interest rates
during boom periods and the decrease in interest rates during bust periods of Islamic stock
markets potentially to pace economic growth and minimize financing defaults respectively. The
movements of interest rates based on the real sector, which includes Islamic stock markets,
remain consistent with monetary policies pursued by central banks. Overall, results generally
signal that Islamic finance – Islamic stock markets, Islamic banking and takaful – influences
variations in conventional interest rates due to profitability pressures on conventional finance.
Policymakers should remain concerned primarily with the impact of conventional interest
rates on Islamic stock markets and Islamic banking due to the negative income gap. The
existence of the negative income gap in Islamic banks counteracts monetary policies by central
banks both in boom and bust periods. An increasing interest rate environment exercised by
central banks during boom periods to pace economic growth through controlling leverage
promotes firms listed as Shariah-compliant stocks to lever up instead since such firms benefit
from cheaper fixed-rate financing with Islamic banks. On the other hand, a decreasing interest
rate environment implemented by central banks during bust periods to minimize financing
defaults cannot affect the fixed-rate financing of firms listed as Shariah-compliant stocks with
Islamic banks, hence increasing the probability of defaults of such firms. Thus the negative
income gap of Islamic banks exposes the Islamic finance system to higher financial risk.
Consequently, policymakers should incentivize Islamic banks to turn the negative income gap
into a positive income gap through imposing higher capital requirements on fixed-rate nominal
assets using financing contracts such as but not limited to murabahah and ijarah.
References
Bach, B. and A. Ando, 1957. “The Redistribution of Effects of Inflation.” The Review of
Economics and Statistics 3, 1–13.
Bank Negara Malaysia, 2013. “KLIBOR Rate Setting.” Bank Negara Malaysia, 1-7.
Fama, Eugene F. and Kenneth R. French, 2004. “The Capital Asset Pricing Model: Theory and
Evidence.” Journal of Economic Perspectives 18.3, 25-46.
Fernandez-Perez, Adrian, Fernando Fernández-Rodríguez, and Simón Sosvilla-Rivero, 2014.
“The Term Structure of Interest Rates as Predictor of Stock Returns: Evidence for the IBEX
35 during a Bear Market.” International Review of Economics and Finance 31, 21-33.
Flannery, M.J., A.S. Hameed and R.H. Harjes, 1997. “Asset Pricing, Time-varying Risk Premia
and Interest Rate Risk.” Journal of Banking & Finance 21, 315–335.
Kasman, Saadet, Gülin Vardar, and Gökçe Tunç, 2011. “The Impact of Interest Rate and Exchange Rate Volatility on Banks' Stock Returns and Volatility: Evidence from Turkey.” Economic Modelling 28, 1328-1334.
Kessel, R., 1956. “Inflation-caused Wealth Redistribution: A Test of a Hypothesis.” The
American Economic Review 3, 128–141.
Kim, Suk-Joong, and Do Quoc Tho Nguyen, 2009. “The Spillover Effects of Target Interest Rate News from the U.S. Fed and the European Central Bank on the Asia-Pacific Stock Markets.” Int. Fin. Markets, Inst. and Money 19, 415-431.
Papadamou, Stephanos, and Costas Siriopoulos, 2014. “Interest Rate Risk and the Creation of The Monetary Policy Committee: Evidence from Banks’ and Life Insurance Companies’ Stocks in the UK.” Journal of Economics and Business 71, 45-67.
Securities Commission Malaysia, 2013. “List of Shariah-Compliant Securities by the Shariah
Advisory Council of the Securities Commission Malaysia.” Securities Commission Malaysia,
1-32.