Embed Size (px)
Citation preview
QUARTERLY JOURNAL OF THE ROYAL METEOROLOGICAL SOCIETY
Q. J. R. Meteorol. Soc.00: 1–27 (2008)
Published online in Wiley InterScience
(www.interscience.wiley.com) DOI: 10.1002/qj.000
The diabatic heat budget of the upper troposphere and
lower/mid stratosphere in ECMWF reanalyses
S. Fueglistaler∗1,B. Legras1, A. Beljaars2, J.-J. Morcrette2, A. Simmons2, A.M. Tompkins3,
S. Uppala2
1Laboratoire Meteorologique Dynamique, Ecole Normale Superieure, and CNRS, Paris, France.
(* now at: Applied Mathematics and Theoretical Physics, University of Cambridge, UK.)
2 European Centre for Medium-range Weather Forecasts, Reading, UK.
3 International Centre for Theoretical Physics, Trieste, Italia.
Abstract: We present an analysis of the diabatic terms in the thermodynamic energy equation from ERA-40 and the ECMWF
reanalysis ERA-Interim. We analyse the clear sky radiativeheating, the cloud radiative effects, and the impact from latent heat
exchange and mixing. The diabatic heat budget is closed withthe calculation of the temperature assimilation increment. The
previously noted excessive tropospheric circulation at low latitudes in ERA-40 is also reflected in the diabatic heat budget. The
temperature increment acts to cool the excessive model heating. Conversely, ERA-Interim requires heating from the assimilation
increment at low latitudes, suggesting too little convection. In the tropical tropopause layer (TTL), both reanalysesshow a strong
heating from the interaction of clouds with radiation, but lack of reliable independent estimates renders the role of clouds uncertain.
Both reanalyses show cooling in the TTL by the assimilation increment, suggesting that the models may overestimate the cloud
radiative heating, or that the convective parameterization scheme has difficulties to capture the thermal effects of deep convection.
In the stratosphere, ERA-40 shows unrealistic radiative heating due to problems in the temperature profile. The diabatic heat balance
is dominated by the the assimilation increment, and the residual circulation is much faster than in ERA-Interim. Conversely, ERA-
Interim is better balanced and requires a substantially smaller temperature increment. Its structure and magnitude ofradiative
heating/cooling at low/high latitudes is quite realistic.Overall, ERA-Interim provides a much improved residual circulation, but
uncertainties in the magnitude of terms in particular around the tropical tropopause remain large. Copyrightc© 2008 Royal
Meteorological Society
KEY WORDS General circulation, radiation, clouds, data assimilation
Received XX MONTH YEAR; Revised ; Accepted
∗Correspondence to: S. Fueglistaler, Dept. of Applied Mathematicsand Theoretical Physics, University of Cambridge, Cambridge, [email protected].
1 Introduction
One of the most prominent features of the zonal mean
structure of the atmosphere is the pronounced upward
Copyright c© 2008 Royal Meteorological Society
Prepared usingqjrms3.cls [Version: 2007/01/05 v1.00]

2 FUEGLISTALERET AL.
bulge of the tropopause over the tropics, rising from typ-
ically 10-11km over the extratropics to about 17.5 km
(cold point) over the tropics, allowing the possibility for
quasi-isentropic troposphere-stratosphere exchange (see
e.g. Holtonet al.,1995). The tropical tropopause is also
situated several kilometers higher than the typical outflow
level of deep convection, with tracers indicating a transi-
tion from troposphere to stratosphere (e.g. Folkinset al.,
1999) that begins above the level of main convective out-
flow. This region, also termed tropical tropopause layer
(TTL), is also important because of its role in regulating
tracer flux (e.g. water vapour or Very Short Lived Species,
VSLS) into the stratosphere.
Theoretical understanding of the transition from the
thermally direct (the circulation is driven by gradients
in heating) tropospheric Hadley-Walker circulation to the
thermally indirect (the circulation is driven by momen-
tum deposition of upward propagating waves) strato-
spheric Brewer-Dobson circulation is particularly chal-
lenging exactly because of its ‘transitional’ character.
Simplifications usually applied for studies of either cir-
culation (see e.g Held and Hou (1981) for the troposphere
and Dunkerton (1978) for the stratosphere) may not apply,
as little information exists about the magnitude of terms
a-priori.
Understanding the circulation requires an under-
standing of the heat budget, in particular the diabatic terms
arising from radiation and latent heat release, which are
both virtually impossible to measure directly. In the low
latitude upper troposphere/lower stratosphere (UT/LS), at
least three very different mechanisms may be important
for understanding the circulation: the direct effect of very
deep, possibly the level of neutral buoyancy overshoot-
ing convection; the effect of the spatial organisation of
tropical deep convection on quasi-stationary wave pat-
terns in the tropical UT/LS (Gill, 1980; Highwood and
Hoskins, 1996) and their impact on upwelling in that
layer (recently emphasized by Norton (2006)); and the
stratospheric upwelling induced by upward propagating
planetary-scale wavesin the sub- and extratropics(Holton
et al., 1995; Plumb and Eluskiewiz (1999)). Accurate
knowledge of the heat balance terms is required to resolve
the roles played by these processes.
The purpose of this paper is to draw attention to
the (diabatic) terms of the heat balance, and their uncer-
tainties. In doing so, we hope to promote more strin-
gent comparisons among models and observation-based
estimates of the heat balance terms. We have chosen
to present and document data from European Centre
for Medium-range Weather Forecasts (ECMWF) anal-
ysed data rather than a (free running) atmospheric general
circulation model (GCM) or even a coupled chemistry-
climate model (CCM) because of the tight constraints
put by the data assimilation on the temperature profile,
which in turn is crucial for accurate radiative transfer cal-
culations. Analysis (and reanalysis) data are frequently
used to study troposphere-stratosphere exchange (e.g.
Sprengeret al. 2003; Schoeberl 2004), to drive chemi-
cal transport models for the stratosphere (see Monge-Sanz
et al.(2008) for a comparison of results obtained with dif-
ferent ECMWF analyses), to diagnose eddy momentum
fluxes (e.g. Trenberth and Stepaniak 2003), and to docu-
ment the large-scale circulation (e.g. Dima and Wallace
2007). The assimilation process, however, is not energy
conserving and the model-internal heat budget is not nec-
essarily compatible with the circulation imposed by the
analysis process, a point we emphasise in this paper.
Understanding the role played by the assimilation process
remains an area of active research (e.g. Tanet al. 2004;
Copyright c© 2008 Royal Meteorological Society
Prepared usingqjrms3.cls
Q. J. R. Meteorol. Soc.00: 1–27 (2008)
DOI: 10.1002/qj

DIABATIC HEAT BUDGET 3
Pawsonet al.2007).
Assessment of the fidelity of the heat balance in a
GCM typically occurs through comparison of atmospheric
and surface temperature fields, rain rates and surface and
top-of-atmosphere radiative fluxes. Agreement of temper-
ature fields with observations, however, not necessarily
implies that the heat budget is correct, as errors in different
terms of the heat budget can mutually cancel. In contrast
to a GCM, temperature fields in analysis data should by
design agree with observations. Errors in the heat budget
of analysis data may manifest themselves in the form of
assimilation temperature increments.
The broad use of the ECMWF 40 years reanalysis
data (ERA-40) renders this data set attractiveas a start-
ing point for a discussion ofthe heat balance. However,
we found that ERA-40 produces very large assimilation
increments (further discussed below) and shows unreal-
istic radiative heating rates particularly at high latitudes.
We therefore make use of data obtained from an interim
reanalysis run at ECMWF (labelled ERA-Interim), which
shows less artefacts due to an improved data assimilation
system, a 4-dimensional variational assimilation scheme,
and a generally improved numerical weather prediction
model (Simmonset al.2006; Uppalaet al.2008). We also
show data from an experimental reanalysis at ECMWF
(called experiment 471, henceforth labelled EXP-471)
that also uses a 4-dimensional variational assimilation
scheme, but a model version between that of ERA-40 and
ERA-Interim. Because of the problems of ERA-40 , we
use mainly data from ERA-Interim to document the model
diabatic fields. In addition, we show specifically selected
data from ERA-40 and EXP-471 to highlight differences
between the three models and assimilation products. For
radiative heating rates, we also use previously published,
independent estimates for comparison. Our analysis pri-
marily focuses on the atmospheric layer from about 300
to 10 hPa at lower latitudes (about 45oS-45oN). However,
plots often show larger sections (from pole to pole, and
down to 500 hPa) in order to set the focus region into the
broader context, and we also discuss some of the promi-
nent features outside of the focus region (in particular the
southern high latitudes).
Section2 presents the data and methods. Section3
discusses the annual mean structure of the diabatic model
terms, and compares them to independent estimates. Sec-
tion 4 discusses some aspects of the Quasi-biennial Oscil-
lation (QBO) on the stratospheric radiative heating struc-
ture. Section5 discusses the impact of the assimilation
process on the heat budget of analysed data. Finally, Sec-
tion 6 provides an outlook.
2 Data and Method
2.1 ECMWF Analysis data
We use analysed data from the ECMWF 40 year reanaly-
sis project ERA-40 (Uppalaet al., 2005), an experimental
reanalysis run (EXP-471) and a recent interim multi-year
reanalysis (ERA-Interim). TableI summarizes key char-
acteristics of these reanalyses, a detailed description of
changes between ERA-40 and ERA-Interim is provided
by Simmonset al.(2006). The model heat budget is deter-
mined from the model forecasts at the intermediate time
steps 03, 09, 15 and 21 UTC; analysis times are 00, 06, 12
and 18 UTC.
ECMWF provides integrated (over the forecast
period) total diabatic heating rates, all sky radiative heat-
ing rates (separated into short- and longwave compo-
nents), and clear sky radiative heating rates. Data were
Copyright c© 2008 Royal Meteorological Society
Prepared usingqjrms3.cls
Q. J. R. Meteorol. Soc.00: 1–27 (2008)
DOI: 10.1002/qj
4 FUEGLISTALERET AL.
Table I. Setup of ECMWF reanalyses (see also Simmonset al.,2006). Resolution refers to spherical truncation/levels (TXX/LXX),diabatic heating calculated from model forecasts (fc.).1: Fouquartand Bonnel (1980);2: Rapid Radiative Transfer Model, (Mlaweret
al., 1997).
ERA-40 EXP-471 ERA-Interim
Period 1958-2002 2000 1989-200(7)Assimilation 3D-var 4D-var 4D-varAssim. cycle 6 hours 12 hours 12 hoursAnalysis UTC 00/06/12/18 00/06/12/18 00/06/12/18Heating from 6hr fc. 12hr fc. 12hr fc.Model cycle 23r4 29 31Resolution T159/L60 T159/L60 T255L/L60LW rad. RRTM 2 RRTM 2 RRTM 2
SW rad. 4-spect. int. 6-spect .int.1 6-spect .int.1
Ice part. size 40-130µm 30-60µm 30-60µmRad. bias corr. static VarBC VarBC
obtained on the 60 model eta levels (sigma levels fol-
lowing orography in the lower troposphere, flattening pro-
gressively to become pressure levels in the stratosphere),
interpolated onto a 1o/1o longitude/latitude grid. Prior to
calculating time-means, the data were linearly interpo-
lated in log-pressure space on fixed pressure levels. In
the case of assimilation increments, data were averaged
on the model levels and afterwards converted to pressure
levels based on time-mean surface pressure fields. Possi-
ble implications of this procedure are confined to levels
below about 125 hPa.
Note that ERA-40 provides an ozone field that is
based on a simplified ozone scheme (Cariolle and Deque,
1986; see also Oikonomou and O’Neill, 2006). However,
this ozone field is not used for the radiative transfer cal-
culations (it will be shown below that this ozone field
produces unrealistic radiative heating rates). Instead, all
three ECMWF models use a zonal mean, monthly mean
ozone climatology (Fortuin and Langematz, 1994; hence-
forth FL94) for the radiative transfer calculations. As a
consequence, the ECMWF radiative transfer calculations
cannot capture the impact of zonally asymmetric ozone
concentrations, or the impact of temporally (other than
annual) changing ozone concentrations.
2.2 Method
The thermodynamic energy equation in pressure coordi-
nates may be written as (e.g. Peixoto and Oort, 1992; eqn.
3.58)
∂T/∂t + ~v · gradT − ω(
κT/p− ∂T/∂p)
= Q/cp, (1)
where∂T/∂t is the temperature tendency,Q/cp is the dia-
batic heating/cooling,~v · gradT is the horizontal advec-
tion of temperature (with~v being the horizontal velocity
vector~v = {u, v}), andω(
κT/p − ∂T/∂p)
is the vertical
advection of temperature (all terms in units of Kelvin per
unit time). Note that this formulation does not explicitly
account for diffusive and turbulent (mixing) heat trans-
port.
The heat budget may be set in relation to the zonal
mean residual circulation using the transformed Eulerian
mean (TEM) framework. For the purpose here, namely a
discussion of the terms that constitute the diabatic heating
termQ/cp, a formulation such as eqn.1 is sufficient.
In the atmosphere, the diabatic heating termQ/cp
consists mainly of two terms, namely radiative heat-
ing/cooling (Qrad/cp) and latent heat fluxes (Qlat) from
phase changes of water. The ECMWF model forecasts
store the total diabatic temperature tendency, and the
temperature tendency from radiation. Hence, we cannot
reconstruct the diabatic term from latent heat exchange
alone. Rather, the ‘residual’ diabatic heating is the sum
of latent heat exchange and diffusive and turbulent heat
transport (Qmix/cp):
Q/cp = Qrad/cp +(
Qlat/cp + Qmix/cp
)
. (2)
Note that part of the condensate reevaporates at upper
levels, but generally latent heat release exceeds uptake,
Copyright c© 2008 Royal Meteorological Society
Prepared usingqjrms3.cls
Q. J. R. Meteorol. Soc.00: 1–27 (2008)
DOI: 10.1002/qj
DIABATIC HEAT BUDGET 5
and for simplicity we refer here to latent heat release only.
The radiative heating term may be further separated into
a clear sky term,Qclear (i.e. radiative transfer calculation
performed without clouds) and a cloud term (Qcloud) that
provides the modification due to the presence of clouds.
Thus we define
Qall ≡ Qclear + Qcloud, (3)
which we can further separate into longwave (LW) and
shortwave (SW) components, which are stored separately.
Note thatQcloud may be non-zero both inside clouds as
well as in cloud-free segments of an atmospheric profile
due to modified short and longwave fluxes arising from
clouds above and/or below.
In discussions of the interaction of temperature and
radiation we use the Newtonian cooling approximation
as a means for a qualitative interpretation of the relation
between errors in temperature and radiative heating. New-
tonian cooling reduces the complex budget of absorption
and emission in an atmospheric layer to the form
Q/cp ≈ −α ∗ (T − Teq) (4)
whereTeq is the radiative equilibrium temperature (i.e.
the temperature at which absorption equals emission),
andα is the inverse of the radiative relaxation timescale
τ = 1/α. The Newtonian cooling approximation arises
from a linearization of the radiative transfer equation, and
is useful for small perturbations in temperature. In this
limit, changes inTeq andα are small compared to those
in T , and the perturbation (denoted as primed quantities)
in radiative heating is approximately proportional to the
perturbation of the layer’s temperature, i.e.
Q′/cp ≈ −α ∗ T ′. (5)
That is, a negative temperature perturbation (‘colder’)
leads to larger radiative heating, andvice versa. The equi-
librium temperatureTeq depends on the divergence of
incoming radiation, and as such depends also on absorber
characteristics and concentrations, with the implication
that the impact of tracer perturbations on radiative heating
rates can also be qualitatively interpreted as a consequence
of a perturbation ofTeq, i.e. in analogy to equation 5
Q′/cp ≈ −α ∗ T ′
eq. Although useful for our purpose here
(to provide a qualitative interpretation of errors in radia-
tive heating), we emphasize that the Newtonian cooling
approximation is subject to limitations (see e.g. Goody
and Yung (1989)), and it should be borne in mind that: (i)
The approximation as formulated in equation 5 assumes
that the leading order term affecting radiative heating rates
in a given layer arises from the modification of local emis-
sion as a consequence of the layer’s temperature change;
(ii) Teq and α are not strictly independent, andα has
a strong dependence on both absolute temperature and
the vertical scale of a temperature perturbations (see for
example Fels, 1982; Bresseret al., 1995).
Finally, in the case of assimilated data, the heat bud-
get is closed by taking into account the assimilation tem-
perature increment between forecast (Tfc) and assimilated
temperature (Tassim) field, which we may write as
Qassim/cp = (Tassim − Tfc)/tfc (6)
wheretfc is the forecast period.
Integrating the assimilation increment into the
thermodynamic energy equation gives the equation for the
combined model and assimilation system. For simplicity,
we use finite differences, and combine the advective terms
into one termδTadv. Further, we use the superscripts ‘m’
to denote quantities derived from the model forecast, and
Copyright c© 2008 Royal Meteorological Society
Prepared usingqjrms3.cls
Q. J. R. Meteorol. Soc.00: 1–27 (2008)
DOI: 10.1002/qj

6 FUEGLISTALERET AL.
‘assim’ for quantities arising from the assimilation sys-
tem. Quantities without superscript refer to the true state.
Then (rewriting eqn.1),
δT + δTadv = δQ/cp, (7)
and for the model
δT m + δT madv = δQm/cp. (8)
By definition, the assimilation increment corrects the
temperature tendency difference between the true value
δT and the model valueδT m,
δT assim ≡ −(δT m − δT ) (9)
= −(δQm/cp − δQ/cp) + (δT madv − δTadv).
(10)
The total diabatic tendency in the assimilated system is the
sum of the model diabatic tendency and the assimilation
increment,
δT ∗ ≡ δQm/cp + δT assim (11)
= δQm/cp − (δQm/cp − δQ/cp) + (δT madv − δTadv)
(12)
= δQ/cp + (δT madv − δTadv). (13)
Hence, we see that the total diabatic tendency is indepen-
dent of model errors in the diabatic terms, and thatδT ∗
recovers the true diabatic heating in the absence of errors
in the advective terms (i.e. forδT madv = δTadv). However,
the same is not true for errors in the advective terms.
In this case, the total diabatic heatingδT ∗ recovers the
diabatic heating required to sustain the circulation (and
associated heat fluxes) as enforced by the wind and tem-
perature fields. Note that errors in the advective terms may
arise from errors both in the wind fields (horizontal and
vertical) and temperature field imposed by the assimila-
tion system, a point we will return to below.
2.3 Radiative transfer calculations
The radiative heating rates from the ECMWF models
(Morcrette 2002) are compared to independent radia-
tive transfer calculations using the model of Fu and
Liou (1993). The purpose of this comparison is not to
determine whether one of the two models is better, but
to provide a sense for the level of agreement of radiative
heating rates obtained from two different state-of-the-art
radiative transfer models, and for the uncertainty arising
from small differences in the tracer concentration profiles,
and cloud radiative properties.
In order to compare clear sky radiative heating rates,
we use temperature and tracer profiles obtained from a
subset of stations from the Southern Hemisphere Addi-
tional Ozone soundings (SHADOZ) program (Thomp-
son et al. 2003). (Stations used: Ascension, Fiji, Java,
Malindi, Nairobi, Natal, Paramaribo, Samoa and San
Cristobal.) Only profiles extending at least up to 30 hPa
were used. Above, profiles were extended up to 0.1 hPa
using ECMWF temperature and ozone data. The strato-
spheric water vapour profiles are based on a climatology
from Halogen Occultation Experiment (HALOE) obser-
vations. Results discussed here are not overly sensitive to
either the stratospheric water vapour profile, nor the verti-
cal extention to 0.1 hPa, but results are shown only up to
30 hPa where the ozone profile is given by the SHADOZ
measurements. No correction was applied to upper tropo-
spheric humidity from the sondes (which may underesti-
mate water vapour concentrations) other than eliminating
(rare) cases of supersaturation.
The impact of clouds on radiative heating rates is
compared to previously published estimates based on
Copyright c© 2008 Royal Meteorological Society
Prepared usingqjrms3.cls
Q. J. R. Meteorol. Soc.00: 1–27 (2008)
DOI: 10.1002/qj
DIABATIC HEAT BUDGET 7
observed cloud fields. Cortiet al. (2005) estimated tropi-
cal mean, annual mean cloud radiative heating based on
cloud field reconstructions derived from a combination
of ISCCP data and Lidar in Space Technology Experi-
ment (LITE, Winker and Trepte (1998)). Note that the
short duration of the LITE experiment does not allow an
‘annual mean’ estimate without assuming that the cloud
distribution during the observation period is representa-
tive for all seasons, which is not the case (see e.g. thin
cirrus cloud distributions shown by Wanget al.(1996) and
Spanget al. (2002)).
We further make use of the radiative transfer calcu-
lations of cloud radiative effects published by Fueglistaler
and Fu (2006). Their calculations are based on temper-
ature and humidity soundings and Millimeter cloud radar
cloud retrievals from the Atmospheric Radiation Measure-
ment (ARM) programm at the tropical Western Pacific
locations Manus and Nauru. These calculations represent
true annual means (here for year 2000) for locations of
frequent deep convection, but have the disadvantage that
they miss the highest, optically thinnest clouds. The impli-
cations of the limitations of these data sets are discussed
below.
3 Annual mean model diabatic heating
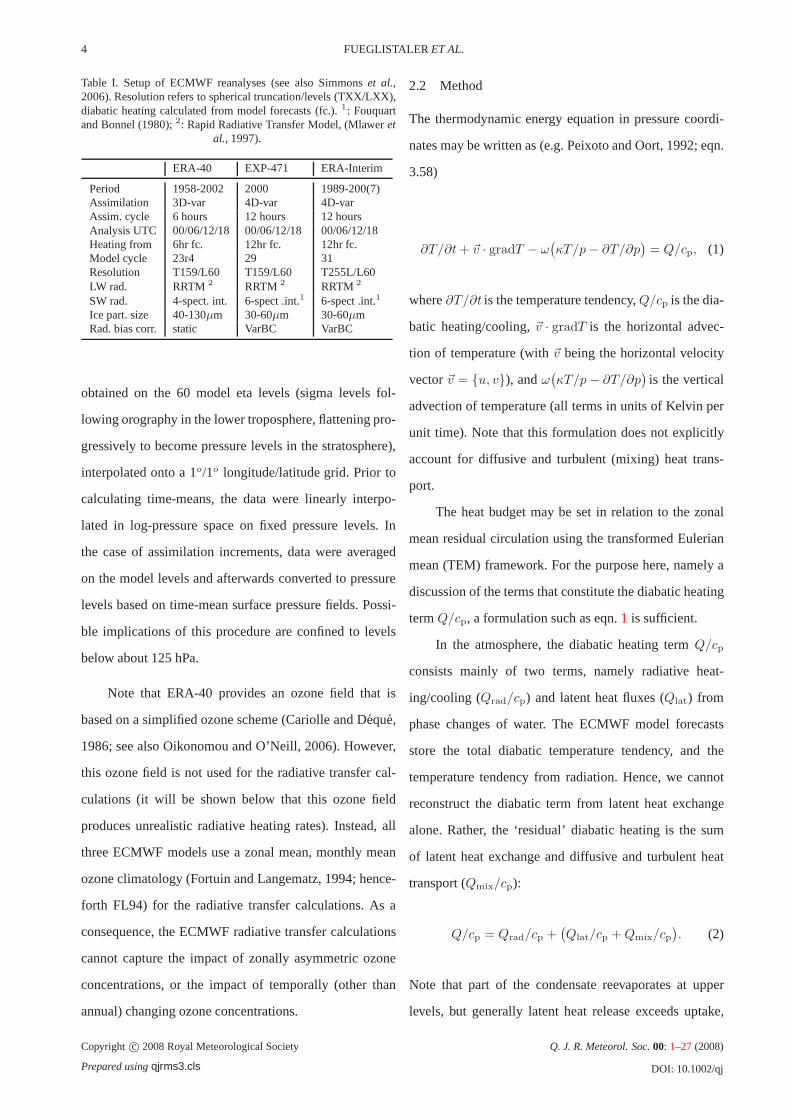
Figure1 shows the zonal mean, annual mean total diabatic
heating of ERA-Interim and ERA-40 (the same field from
EXP-471 (not shown) is similar to that of ERA-Interim).
The figure shows strong heating in the tropical tropo-
sphere associated with latent heat release. Substantial dif-
ferences between ERA-Interim and ERA-40 are observed
between about 300 and 150 hPa, where ERA-40 shows a
much stronger heating and broader region of net diabatic
heating than ERA-Interim. At about 150 hPa, both models
show a broadening of the diabatic upwelling region, with
pronounced maxima of diabatic heating over the subtrop-
ics around 70 hPa. Above, ERA-40 shows a narrowing of
the upwelling region between about 40 and 20 hPa. In the
same layer, ERA-Interim has a broader upwelling region,
but also shows a maximum of diabatic heating over the
equator.
-90 -60 -30 0 30 60 90latitude
500
300 250 200 150 125 100 75 60 50 40 30
20
10
p [h
Pa]
-0.5-0.5
-0.5
-0.5
-0.4-0.4
-0.4
-0.4
-0.4
-0.3
-0.3
-0.3
-0.3
-0.3
-0.3
-0.2
-0.2
-0.2
-0.2
-0.1
-0.1
-0.1
-0.1
0.0
0.0
0.0
0.0
0.1
0.1
0.1
0.1
0.2
0.2 0.2
0.3
0.3
0.4 0.5
1.0
Total model diabatic heating ERA-40
320K
320K
340K
340K
360K 360K
380K380K
400K
400K
450K450K
500K 500K
600K 600K
700K 700K
800K800K
(b)
-90 -60 -30 0 30 60 90latitude
500
300 250 200 150 125 100 75 60 50 40 30
20
10
p [h
Pa]
-0.5
-0.5
-0.5-0.5
-0.5
-0.5
-0.4
-0.4-0.4
-0.4
-0.4
-0.4
-0.3
-0.3
-0.3
-0.3
-0.3
-0.3
-0.2
-0.2
-0.2
-0.1
-0.1
-0.1
-0.1
0.0
0.0
0.0
0.0
0.1
0.1
0.1
0.1
0.2 0.2
0.2 0.2
0.3
0.3
0.3
0.4
0.4
0.5
Total model diabatic heating ERA-Interim
320K
320K
340K
340K
360K360K
380K
380K400K
400K
450K450K
500K 500K
600K 600K
700K 700K
800K800K
(a)
Figure 1. Zonal mean, annual mean (year 2000) total model diabaticheating rates (greyscale, in Kelvin/day; zero line bold) from (a)ERA-40 model. (b) ECMWF interim reanalysis model and Whitedashed lines show potential temperature in Kelvin. (Note changes
in contour spacing to capture full dynamic range.)
Figure 2 shows the zonal mean (left) and equato-
rial mean (5oS-5oN; right) of clear sky radiative heating
Copyright c© 2008 Royal Meteorological Society
Prepared usingqjrms3.cls
Q. J. R. Meteorol. Soc.00: 1–27 (2008)
DOI: 10.1002/qj

8 FUEGLISTALERET AL.
(Figs.2(a,b)), net radiative effect of clouds (Figs.2(c,d)),
and ‘residual’ (Figs.2(e,f)) of the ERA-Interim model for
the year 2000. (Adding up these fields gives the total dia-
batic heating shown in Figure1(b).)
3.1 Clear sky radiative heating rates
Figure 2(a) shows the annual (year 2000) mean, zonal
mean, clear sky radiative heating from ERA-Interim. The
figure shows the free troposphere and extratropical strato-
sphere to be radiatively cooling, and the tropical strato-
sphere heating. The level of clear sky zero net radiative
heating is located near 125 hPa (about 360 K pot. tem-
perature), in agreement with previously published esti-
mates (e.g. Folkinset al.(1999); Gettelmanet al.(2004);
Fueglistaler and Fu (2006)). In the stratosphere, the lati-
tude where heating turns to cooling is located near 40o,
also in agreement with previous estimates (e.g. Rosenlof
(1995)).
Figure 2(b) shows the annual mean zonal structure
of equatorial clear sky radiative heating rates. In gen-
eral, these heating rates are zonally quite uniform. Some
zonal asymmetries are found around 200 hPa, and at
tropopause levels. While in the troposphere water vapour
variations are the likely cause for the asymmetries, the
asymmetries at tropopause level arise from the tempera-
ture structure. Regions of lowest temperature (for example
over the Western Pacific) show largest radiative heating,
as expected from the perspective of Newtonian cooling,
assumingTeq andα are zonally nearly constant. However,
the latter may not be exactly correct because of varia-
tions in ozone concentrations which are (positively) cor-
related with the temperature field. Consequently, the use
of a zonal mean ozone climatology in the model may lead
to an overestimate of the amplitude of zonal variations of
clear sky radiative heating rates at tropopause levels.
Figure3 compares profiles of clear sky radiative heat-
ing rates from ERA-Interim, EXP-471 and ERA-40, and
radiative transfer calculations as detailed in Section2.3.
The panels on the left show tropical (20oS-20oN), annual
(2000) and zonal mean profiles of total (3a), short wave
(3c) and long wave (3e) radiative heating rates. The
three ECMWF calculations are quite similar, except above
about 40 hPa where ERA-40 longwave heating rates are
markedly lower than those of ERA-Interim and EXP-471,
which is also seen in the comparison at the locations of
the SHADOZ soundings only (Fig.3b/d/f).
Copyright c© 2008 Royal Meteorological Society
Prepared usingqjrms3.cls
Q. J. R. Meteorol. Soc.00: 1–27 (2008)
DOI: 10.1002/qj

DIABATIC HEAT BUDGET 9
-60 -40 -20 0 20 40 60 500
300 250 200 150 125 100 75 60 50 40 30
20
10
p [h
Pa]
-1.0
-1.0-0.6
-0.6
-0.5-0.5
-0.5-0.5
-0.4-0.4
-0.4
-0.4
-0.3 -0.3
-0.3
-0.3
-0.2
-0.2 -0.2
-0.2
-0.1
-0.1 -0.1
-0.1
0.0
0.0 0.0
0.0
0.1
0.1 0.1
0.2
0.2
0.2
0.3
0.3
0.3
0.4
0.4
0.4
0.5
clear sky radiation
320K
320K
340K
340K
360K
360K380K
380K400K
400K450K
450K500K
500K
600K 600K
700K 700K
800K 800K
(a)
-180 -135 -90 -45 0 45 90 135 180 500
300 250 200 150 125 100 75 60 50 40 30
20
10
p [h
Pa]
-1.0-1.0-0.6-0.6 -0.5
-0.5-0.4-0.4 -0.3-0.3 -0.2-0.2 -0.1-0.1 0.0 0.0
0.0
0.1 0.1
0.1 0.1
0.2 0.2
0.2 0.2
0.3 0.3
0.3 0.3
0.4 0.4
0.4 0.4
0.4 0.4
0.4 0.4
0.5 0.5
0.5
0.5 0.5
0.5
0.5
clear sky radiation
340K340K
360K360K
380K380K400K400K
450K450K
500K500K
600K600K
700K700K
800K800K
(b)
-60 -40 -20 0 20 40 60 500
300 250 200 150 125 100 75 60 50 40 30
20
10
p [h
Pa]
0.0 0.0
0.0
0.0
0.0 0.1
0.1
0.2
0.2
0.3
0.4
0.5
cloud rad. impact
320K
320K
340K
340K
360K
360K380K
380K400K
400K450K
450K500K
500K
600K 600K
700K 700K
800K 800K
(c)
-180 -135 -90 -45 0 45 90 135 180 500
300 250 200 150 125 100 75 60 50 40 30
20
10
p [h
Pa]
-0.1 0.0 0.0
0.0
0.0
0.1
0.1 0.1
0.1
0.2 0.2
0.2
0.2
0.2
0.3
0.3
0.3
0.3 0
.4
0.4
0.4
0.5
0.5
0.5
0.6
0.6
0.6 1.0
cloud rad. impact
340K340K
360K360K
380K380K400K400K
450K450K
500K500K
600K600K
700K700K
800K800K
(d)
-60 -40 -20 0 20 40 60latitude
500
300 250 200 150 125 100 75 60 50 40 30
20
10
p [h
Pa]
0.0
0.0
0.0
0.0
0.0
0.1
0.1
0.2
0.2
0.3
0.3
0.4
0.4
0.5
0.5
0.6
0.6
1.0
1.0
1.0
residual (latent+mix)
320K
320K
340K
340K
360K
360K380K
380K400K
400K450K
450K500K
500K
600K 600K
700K 700K
800K 800K
(e)
-180 -135 -90 -45 0 45 90 135 180longitude
500
300 250 200 150 125 100 75 60 50 40 30
20
10
p [h
Pa]
-0.2-0.1 0.0 0.0
0.0 0.0
0.0 0.0
0.0
0.1 0.1
0.2 0.2
0.3
0.3
0.4 0.4
0.5
0.5 0.5
0.6
0.6
0.6
1.0
1.0
1.0
2.0
2.0
residual (latent+mix)
340K340K
360K360K
380K380K400K400K
450K450K
500K500K
600K600K
700K700K
800K800K
(f)
-4.0-2.0-1.0-0.6-0.5-0.4-0.3-0.2-0.1 0.0 0.1 0.2 0.3 0.4 0.5 0.6 1.0 2.0 4.0
Figure 2. Annual mean diabatic heating terms (in Kelvin/day) of the ECMWF interim reanalysis model (year 2000). Left: zonal mean(shown from 60S to 60N); right: tropical (5S-5N) mean. Top row: clear sky radiative heating, middle row: cloud radiativeeffect; bottom
row: residual (latent heat exchange and mixing terms). (Note changes in contour spacing to capture full dynamic range.)
Copyright c© 2008 Royal Meteorological Society
Prepared usingqjrms3.cls
Q. J. R. Meteorol. Soc.00: 1–27 (2008)
DOI: 10.1002/qj

10 FUEGLISTALERET AL.
ERA40 EXP471 Interim (see caption)
Clear@Tropics
-1.0 -0.5 0.0 0.5 1.0400300
200150125100 75
50 40 30
p [h
Pa]
(a)
TOTAL
Clear@Stations
-1.0 -0.5 0.0 0.5 1.0400300
200150125100 75
50 40 30
(b)
TOTAL
-1.0 -0.5 0.0 0.5 1.0400300
200150125100 75
50 40 30
p [h
Pa]
(c)
SW
-1.0 -0.5 0.0 0.5 1.0400300
200150125100 75
50 40 30
(d)
SW
-1.0 -0.5 0.0 0.5 1.0dT/dt [K/day]
400300
200150125100 75
50 40 30
p [h
Pa]
(e)
LW
-1.0 -0.5 0.0 0.5 1.0dT/dt [K/day]
400300
200150125100 75
50 40 30
(f)
LW
Figure 3. Comparison of annual mean (year 2000) clear sky radia-tive heating rates (in Kelvin/day) in the tropics (20oS-20oN, panelsa/c/e) and at selected SHADOZ stations (panels b/d/f). The compari-son at selected stations (panels b,d,f; line with diamonds)is based onrad. transfer calculations using the temperature/ozone/water vapour
profiles of tropical stations of the SHADOZ program (see text).
Figure 4(a) shows the zonal mean temperature dif-
ference between ERA-Interim and ERA-40, and the dif-
ferences in all-sky shortwave (Fig.4b) and longwave
(Fig. 4c) radiative heating. The figure shows that through-
out the lower stratosphere at lower latitudes, ERA-40 has
higher temperatures than ERA-Interim.Consistent with
the Newtonian cooling approximation,the levels with
largest temperature differences (e.g. lower latitudes at
30 hPa) have largest differences in longwave radiative
heating.
Figure4 further shows that the largest differences in
temperatures, and hence in longwave radiative heating, are
found at high latitudes. The ERA-40 temperature profile
shows unrealistic oscillations, which give rise to corre-
sponding oscillations in the radiative heating profile.
Conversely, differences in shortwave heating are
more uniform between ERA-Interim and ERA-40 , except
in regions of clouds, where differences are also markedly
larger (further discussed below). The differences between
ERA-40 and ERA-Interim seen in the stratosphere are
related to differences in the shortwave radiative trans-
fer codes of the models (see TableI), and to different
upwelling short wave radiation as a consequence of dif-
ferences in the cloud fields.
The lower short wave radiative heating rates of ERA-
40 around 30 hPa combined with the lower longwave heat-
ing rates in that layer due to a warm bias lead to the ‘bot-
tleneck’ ofmodel diabatic heatingin ERA-40 in that layer
(Figures1a, and3). The problem of radiative heating in
the stratosphere at low latitudes in ERA-40 becomes par-
ticularly pronounced also during periods when the QBO
induces a warm anomaly (the role of the QBO is further
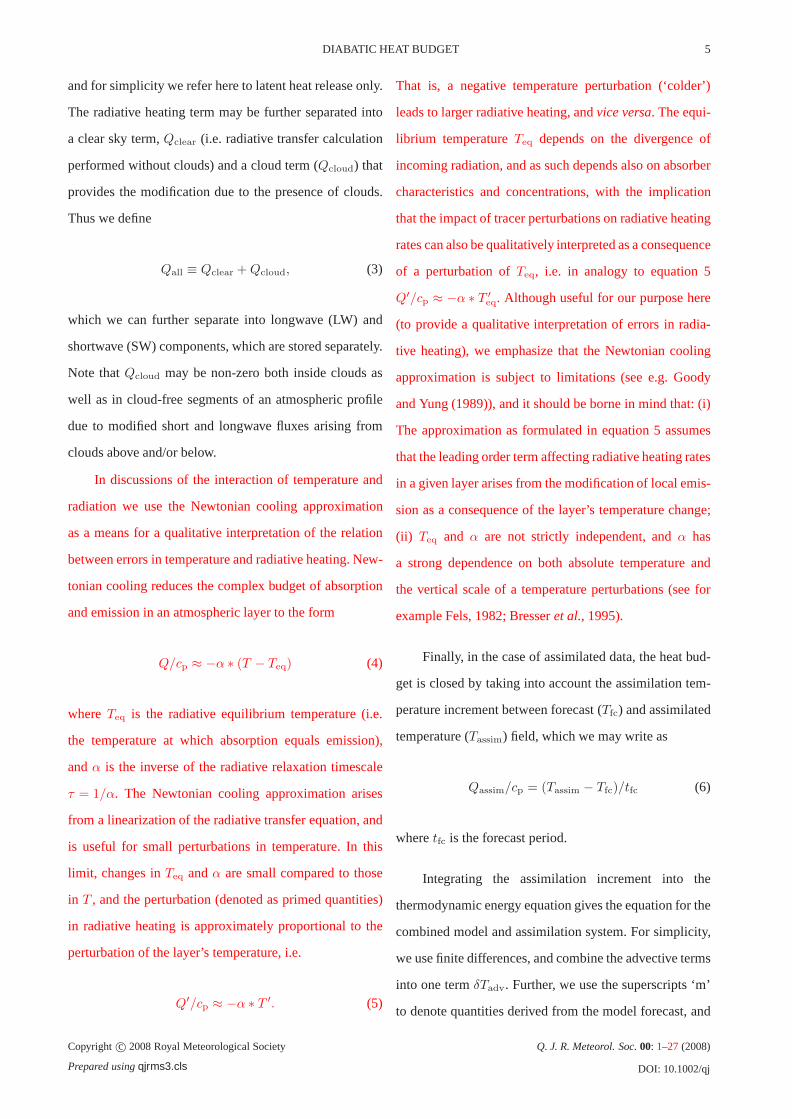
discussed below). Figure5 shows the total model dia-
batic heating of ERA-40 as in Figure1(a), but for the year
1997. It is readily seen that for this period radiative heating
around 20 hPa is negative almost everywhere, which (erro-
neously) implies that during this period vertical ascent
would experience a complete standstill.Were it not for the
assimilation increment (discussed below), temperature in
this layer would decrease.
The comparison of the clear sky radiative heating
rates from ECWMF and those based on the calculations
with the Fu-Liou model at the SHADOZ stations (Fig.3b)
shows that the shapes of the profiles are similar, but that
Copyright c© 2008 Royal Meteorological Society
Prepared usingqjrms3.cls
Q. J. R. Meteorol. Soc.00: 1–27 (2008)
DOI: 10.1002/qj

DIABATIC HEAT BUDGET 11
there are some important differences in magnitude. In
particular, the ECMWF profiles have about 0.2 K/day
more heating in the layer 120-60 hPa. Comparison of
radiative heating rates between the ECMWF radiative
transfer code and the Fu-Liou code based on identical
profiles shows generally good agreement, but the Fu-Liou
models yields slighly less longwave heating at tropopause
levels of about 0.1 K/day (pers. comm. S. Tegtmeier and
K. Krueger, 2007). Other causes for the differences in
the clear sky radiative heating rates shown in Figure3
are differing temperature and ozone profiles. We find that
the SHADOZ profiles have slightly higher temperature
around the tropopause than the ECMWF profiles (which
tends to give less longwave radiative heating; note that
this difference may arise from comparing temperatures
over different periods, and may not be interpreted as
an assessment of the fidelity of temperatures in either
data set), and that the SHADOZ ozone concentrations at
tropopause levels are generally lower than those of the
FL94 climatology used by ECMWF (which also tends to
give less radiative heating).
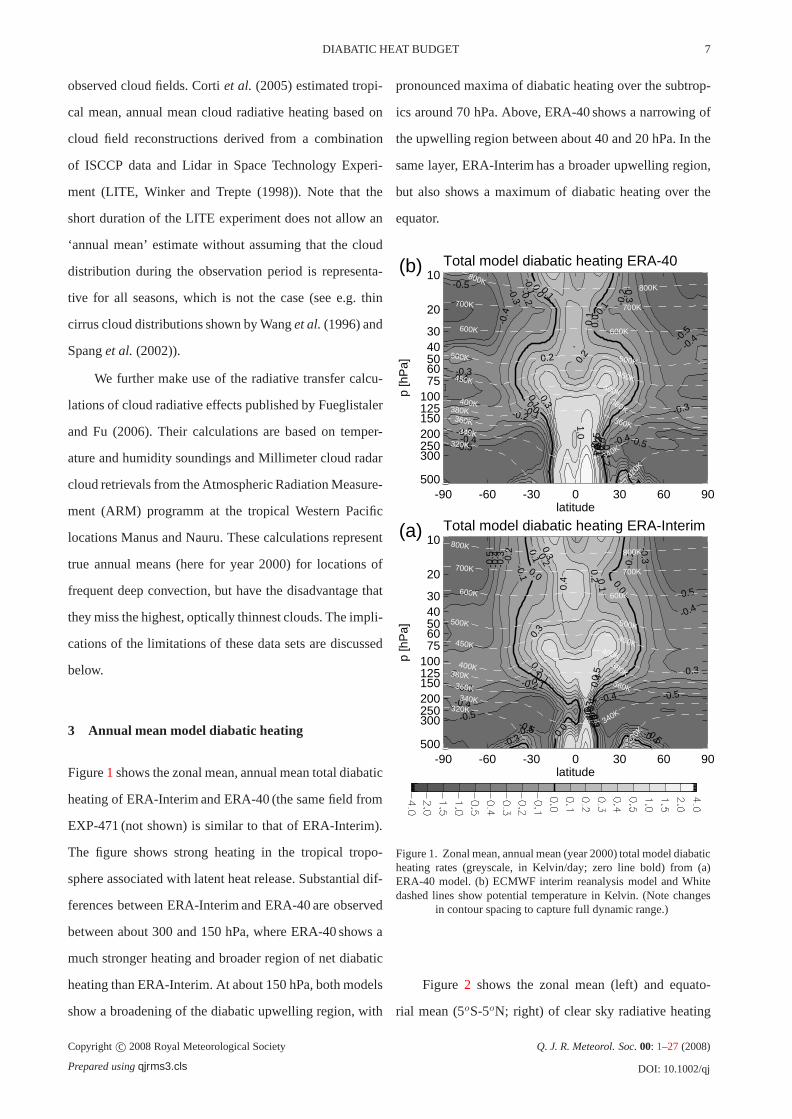
Figure 6(a) shows the annual mean ozone profile
averaged over all SHADOZ stations used here together
with the annual mean profile of the FL94 climatology at
the latitudes of the SHADOZ stations and the annual mean
(year 2000) profile of the ERA-40 ozone field, also at
the latitudes of the SHADOZ stations. Figure6(b) shows
that the differences in ozone concentrations translate into
substantial differences in radiative heating at tropopause
levels and in the lower stratosphere. The higher ozone
concentrations of the FL94 climatology account for an
increase in radiative heating at tropopause levels of
about 0.1 K/day when compared to the results using the
SHADOZ ozone profiles. The figure further shows that
(a)
-90 -60 -30 0 30 60 90
-90 -60 -30 0 30 60 90500300200150100 75 50 30 20
10
p [h
Pa]
Temperature difference
-1.5
-1.0
-1.0
-1.0 -1.0
-1.0
-1.0 -0.5
-0.5 -0.5
-0.5
-0.5
-0.5
0.0
0.0
0.0
0.0 0.0
0.5
0.5
0.5
1.0
1.0
[K]
-10.0 -5.0 -3.0 -2.0 -1.5 -1.0 -0.5 0.0 0.5 1.0 1.5 2.0 3.0 5.0 10.0
(b)
-90 -60 -30 0 30 60 90
-90 -60 -30 0 30 60 90500300200150100 75 50 30 20
10
p [h
Pa]
SW heating difference
-0.10-0.05
0.00
0.00 0.00
0.0
5
0.05
0.1
0
(c)
-90 -60 -30 0 30 60 90
-90 -60 -30 0 30 60 90latitude
500300200150100 75 50 30 20
10p
[hP
a]LW heating difference
-0.05-0.05
-0.05
-0.05
-0.05
-0.05 0.00
0.00 0.00
0.00
0.00
0.00
0.05 0.05
0.05
0.05
0.05 0.05
0.05
0.10 0.10
0.10
0.10
0.10 0.10
[K/day]
-0.60-0.50-0.30-0.20-0.10-0.05 0.00 0.05 0.10 0.20 0.30 0.50 0.60
Figure 4. Difference between ERA-Interim and ERA-40 (i.e. ERA-Interim minus ERA-40 ) of zonal, annual mean (year 2000) (a) tem-perature (in Kelvin), (b) shortwave radiative heating (in Kelvin/day),and (c) longwave radiative heating (in Kelvin/day). Note change of
contour line increments at±0.1Kelvin/day.
using the ERA-40 ozone field (as opposed to the FL94 cli-
matology) gives very unrealsitic radiative heating rates in
the stratosphere.
Hence, the difference in clear sky radiative heating
rates between the ECMWF models and the comparison
calculation arises from differences of the radiative transfer
models and from slightly different temperature and ozone
concentration profiles. The difference may appear small in
absolute numbers (about 0.2K/day at tropopause levels).
However, in relative terms the difference is large, with the
ECMWF clear sky radiative heating being about twice as
Copyright c© 2008 Royal Meteorological Society
Prepared usingqjrms3.cls
Q. J. R. Meteorol. Soc.00: 1–27 (2008)
DOI: 10.1002/qj
12 FUEGLISTALERET AL.
-90 -60 -30 0 30 60 90latitude
500
300 250 200 150 125 100 75 60 50 40 30
20
10p
[hP
a]
-0.5
-0.5
-0.5
-0.5
-0.5
-0.4
-0.4
-0.4
-0.4
-0.3
-0.3
-0.3
-0.3
-0.3
-0.2
-0.2
-0.2
-0.2
-0.1
-0.1
-0.1
-0.1
0.0
0.0
0.0 0.0
0.1
0.1
0.1
0.1
0.2
0.2
0.2
0.3
0.3
0.4
0.4
0.5 1.0 1.5
2.0
Total model diabatic heating ERA-40
320K
320K
340K
340K
360K 360K
380K380K
400K
400K
450K450K
500K 500K
600K 600K
700K 700K
800K800K
Figure 5. Zonal mean, annual mean (year 1997) total model diabaticheating rates (greyscale, in Kelvin/day; zero line bold) from ERA-40 model. White dashed lines show potential temperature in Kelvin.Plot may be compared with Figure1. (Note changes in contour
spacing to capture full dynamic range.)
large as those of the comparison calculation.
Figure 6. (a) Climatological mean ozone concentrations fromSHADOZ (solid), Fortuin+Langematz 1994 at SHADOZ latitudes(dashed) and annual mean (year 2000) ERA-40 ozone field atSHADOZ latitudes (dotted). (b) Corresponding radiative heatingrates (assuming diurnal mean insolation) calculated with the Fu-Liou rad. transfer model (all parameters other than ozone kept
equal).
3.2 Cloud net radiative heating
Clouds strongly modify absorption and emission, and
hence radiative heating rates within the cloud layer. Fur-
ther, the modification of radiative fluxes leads to effects
on heating rates above and below the cloud. Observa-
tions indicate a maximum of deep convective cloud occur-
rence frequency over the Western Pacific warm pool (e.g.
Hartmannet al. (2001)), and an increase of cloud occur-
rence frequency in the vicinity of the tropical tropopause
with clouds often being optically thin or even subvisible
(e.g. Wanget al. (1996)). Although optically thin, these
clouds are potentially important for the heat budget near
tropopause levels. Previous model calculations showed
that these thin clouds increase radiative heating rates by
order a few tenths of a Kelvin per day (with instantaneous
heating rates of order a few Kelvin per day), with a cor-
responding temperature increase of order one Kelvin (e.g.
Jensenet al. (1996); Rosenfieldet al. (1998)). Recently,
Boville et al. (2006) reported that a more accurate rep-
resentation of thin cirrus at tropopause levels helped to
eliminate a cold bias in this layer in the Community
Atmosphere Model (CAM3). (Note that the main effect
is - in terms of theNewtonian cooling approximation- to
increase the radiative equilibrium temperature, such that
for given upwelling, i.e. constant radiative heating, effec-
tive temperatures will be higher).
Figures2(c/d) show the zonal mean and equatorial
mean net cloud radiative effect of ERA-Interim. The
overall structure and magnitude of net cloud radiative
effect of all three ECMWF models are similar (differences
discussed below). The clouds are found to have mostly
a heating effect, that maximizes in the inner tropics
between 200 and 150 hPa, i.e. at the typical outflow
level of tropical deep convection. At 100 hPa, the effect
is of order 0.1 K/day and vanishes at the tropopause as
Copyright c© 2008 Royal Meteorological Society
Prepared usingqjrms3.cls
Q. J. R. Meteorol. Soc.00: 1–27 (2008)
DOI: 10.1002/qj

DIABATIC HEAT BUDGET 13
there are no further clouds. Not surprisingly, the zonal
structure of the cloud radiative effect (Figure2d) follows
that of the zonal structure of cloud distribution, with
maxima over Southern America, Africa and the Western
Pacific warm pool region. In the lower stratosphere, the
reduced upwelling longwave radiation outruns the effect
of the increased upwelling (reflected) shortwave flux (see
Fueglistaler and Fu (2006) for details), resulting in a net
decrease of radiative heating rates over regions of frequent
deep convection of order 0.1 K/day.
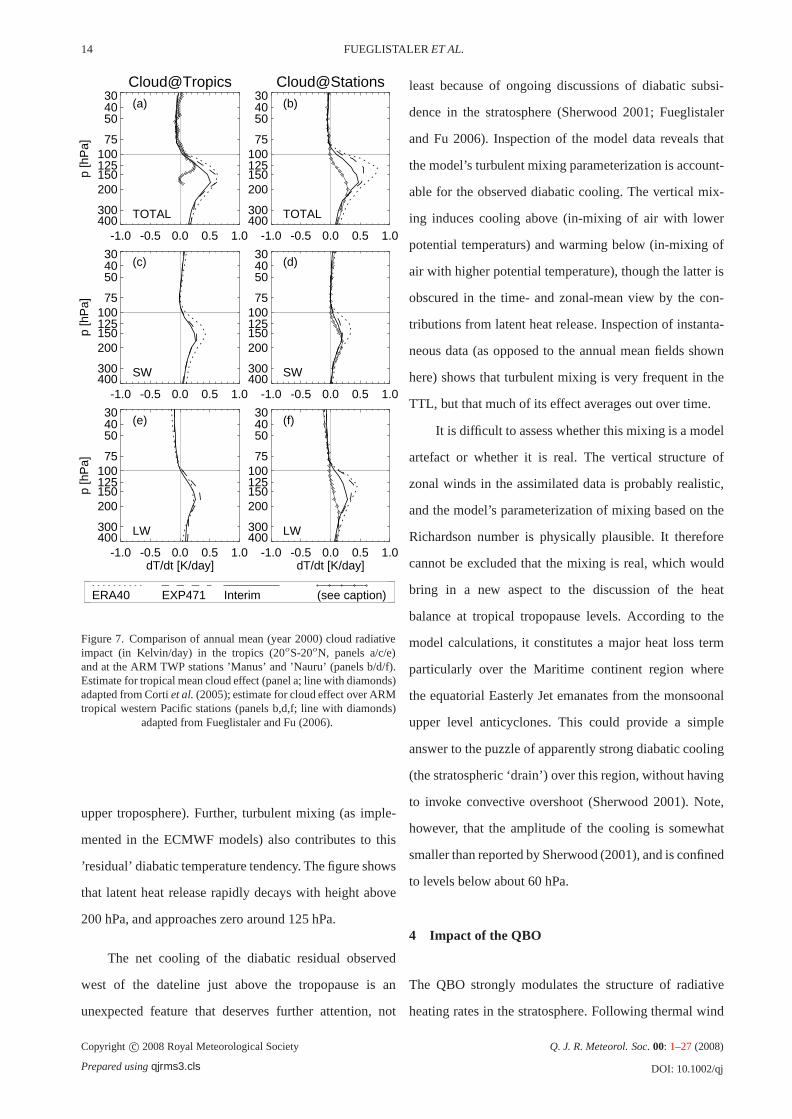
Figure 7 shows the net radiative impact of clouds
on radiative heating rates of the 3 ECMWF models, and
independent comparison calculations. The figure shows
that the shape of the profiles of the three ECMWF mod-
els are similar. ERA-Interim shows less net cloud radia-
tive heating around 150 hPa than ERA-40 and EXP-471.
The differences are larger for the comparison at selected
stations (right panels) than in the tropical mean (left pan-
els), which can be expected for a comparison at sin-
gle grid points. The decomposition of the total radia-
tive effect into shortwave and longwave effect (Figs.7
c,e) of the tropical mean shows that the similar total
effect of ERA-40 and EXP-471 actually arises from ERA-
40 having larger shortwave heating than ERA-Interim and
EXP-471, and EXP-471 having larger longwave heating
that ERA-Interim and ERA-40. At the stations Manus and
Nauru, ERA-40 has larger shortwave heating, and ERA-
Interim has smaller longwave heating, than the two other
ECMWF models.
The calculations of the net cloud effect by
Corti et al. (2005) (Figure7a) show a profile markedly
different from those of the ECMWF models. Their cloud
radiative effect approaches zero at about 150 hPa (data
below not available), whereas all ECMWF models show
a net radiative heating of clouds throughout the upper
tropical troposphere. Also, their maximum cloud radiative
heating (at about 175 hPa) is about a factor 3 larger than
the maximum calculated by Cortiet al..
The comparison of the cloud radiative heating of
ECMWF data with the estimate of Fueglistaler and
Fu (2006) over Manus and Nauru shows good agreement
up to about 200 hPa. Higher up, the millimeter cloud
radar misses optically thin cirrus clouds, and hence tends
to underestimate the cloud effect (though one cannot say
a-priori whether this means a negative or positive bias).
This clearly limits the conclusions that can be drawn from
a comparison in this layer, but we note that the discrep-
ancies are larger for longwave than shortwave heating.
Mc Farlaneet al. (2007) report cloud radiative heating of
climate models at the ARM TWP stations that are also
larger than those derived from a calculation similar to that
of Fueglistaler and Fu (2006). At 12 km (about 225 hPa),
Mc Farlaneet al. (2007) find cloud radiative impacts in
models exceeding 1 K/day, which is even larger than those
of the ECMWF models shown here.
Hence, uncertainties regarding the impact of clouds
on radiative heating rates are largest between 200 and
100 hPa, where both optically thick anvil clouds as well as
thin cirrus clouds occur, which requires a highly accurate
reconstruction of the cloud field (vertical profile, diurnal
cycle, condensed water content, and optical properties of
particles) to accurately calculate its radiative effect.
3.3 Latent heat
Figure2(c/f) shows the annual mean (year 2000) ‘resid-
ual’ diabatic heating rates, calculated as the difference
from the total diabatic tendency minus the total, all sky
radiative heating tendency. The resulting quantity repre-
sents primarily the net effect of phase changes of water
vapour (with latent heat release exceeding latent heat
uptake due to evaporation in much of the low latitude
Copyright c© 2008 Royal Meteorological Society
Prepared usingqjrms3.cls
Q. J. R. Meteorol. Soc.00: 1–27 (2008)
DOI: 10.1002/qj
14 FUEGLISTALERET AL.
ERA40 EXP471 Interim (see caption)
Cloud@Tropics
-1.0 -0.5 0.0 0.5 1.0400300
200150125100 75
50 40 30
p [h
Pa]
(a)
TOTAL
Cloud@Stations
-1.0 -0.5 0.0 0.5 1.0400300
200150125100 75
50 40 30
(b)
TOTAL
-1.0 -0.5 0.0 0.5 1.0400300
200150125100 75
50 40 30
p [h
Pa]
(c)
SW
-1.0 -0.5 0.0 0.5 1.0400300
200150125100 75
50 40 30
(d)
SW
-1.0 -0.5 0.0 0.5 1.0dT/dt [K/day]
400300
200150125100 75
50 40 30
p [h
Pa]
(e)
LW
-1.0 -0.5 0.0 0.5 1.0dT/dt [K/day]
400300
200150125100 75
50 40 30
(f)
LW
Figure 7. Comparison of annual mean (year 2000) cloud radiativeimpact (in Kelvin/day) in the tropics (20oS-20oN, panels a/c/e)and at the ARM TWP stations ’Manus’ and ’Nauru’ (panels b/d/f).Estimate for tropical mean cloud effect (panel a; line with diamonds)adapted from Cortiet al.(2005); estimate for cloud effect over ARMtropical western Pacific stations (panels b,d,f; line with diamonds)
adapted from Fueglistaler and Fu (2006).
upper troposphere). Further, turbulent mixing (as imple-
mented in the ECMWF models) also contributes to this
’residual’ diabatic temperature tendency. The figure shows
that latent heat release rapidly decays with height above
200 hPa, and approaches zero around 125 hPa.
The net cooling of the diabatic residual observed
west of the dateline just above the tropopause is an
unexpected feature that deserves further attention, not
least because of ongoing discussions of diabatic subsi-
dence in the stratosphere (Sherwood 2001; Fueglistaler
and Fu 2006). Inspection of the model data reveals that
the model’s turbulent mixing parameterization is account-
able for the observed diabatic cooling. The vertical mix-
ing induces cooling above (in-mixing of air with lower
potential temperaturs) and warming below (in-mixing of
air with higher potential temperature), though the latter is
obscured in the time- and zonal-mean view by the con-
tributions from latent heat release. Inspection of instanta-
neous data (as opposed to the annual mean fields shown
here) shows that turbulent mixing is very frequent in the
TTL, but that much of its effect averages out over time.
It is difficult to assess whether this mixing is a model
artefact or whether it is real. The vertical structure of
zonal winds in the assimilated data is probably realistic,
and the model’s parameterization of mixing based on the
Richardson number is physically plausible. It therefore
cannot be excluded that the mixing is real, which would
bring in a new aspect to the discussion of the heat
balance at tropical tropopause levels. According to the
model calculations, it constitutes a major heat loss term
particularly over the Maritime continent region where
the equatorial Easterly Jet emanates from the monsoonal
upper level anticyclones. This could provide a simple
answer to the puzzle of apparently strong diabatic cooling
(the stratospheric ‘drain’) over this region, without having
to invoke convective overshoot (Sherwood 2001). Note,
however, that the amplitude of the cooling is somewhat
smaller than reported by Sherwood (2001), and is confined
to levels below about 60 hPa.
4 Impact of the QBO
The QBO strongly modulates the structure of radiative
heating rates in the stratosphere. Following thermal wind
Copyright c© 2008 Royal Meteorological Society
Prepared usingqjrms3.cls
Q. J. R. Meteorol. Soc.00: 1–27 (2008)
DOI: 10.1002/qj

DIABATIC HEAT BUDGET 15
balance, layers with westerly (eastward) wind shear are
associated with high temperature anomalies, and layers
with easterly (westward) wind shear are associated with
low temperature anomalies.
1997 1998 1999 2000 2001 2002 2003 2004
100
10
1997 1998 1999 2000 2001 2002 2003 2004 200 150
100
70
50
30
20
10
p [h
Pa]
-0.10
-0.10-0.10-0.05
-0.05
-0.05
-0.05
0.00
0.00 0.00 0.00
0.00
0.00
0.05
0.05
0.05 0.10 0.10
(a)
1997 1998 1999 2000 2001 2002 2003 2004-90
-60
-30
0
30
60
90
1997 1998 1999 2000 2001 2002 2003 2004-90
-60
-30
0
30
60
90
latit
ude
-0.2
0
-0.2
0
-0.2
0 -0.2
0
-0.2
0
-0.20
-0.20
-0.1
0
-0.1
0
-0.10
-0.1
0 -0.10
-0.0
5
-0.0
5
-0.05
0.0
0
0.0
0
0.0
0
0.05 0.0
5
0.05
0.05
0.05
0.10
(b)
-2.00
-0.50
-0.40
-0.30
-0.20
-0.10
-0.05
0.00
0.05
0.10
0.20
0.30
0.40
0.50
2.00
Figure 8. (a) Timeseries of equatorial (10oS-10oN), interannual(i.e. after subtraction of mean annual cycle) clear sky radiativeheating rate anomalies from ERA-Interim(in Kelvin/day). The whiteline shows the pressure level of the plot below. (b) Timeseries ofclear sky radiative heating rates at 70 hPa after subtracting equatorial
values. (Note irregular increments for contour lines.)
Figure 8(a) shows the inner tropical (10oS-10oN)
clear sky radiative heating rate anomalies for ERA-
Interim after subtracting the annual cycle. In the tropo-
sphere, interannual variability is mainly associated with
ENSO (see e.g. the strong El-Nino situation in 1998).
Closer inspection (not shown) shows that the variations
arise from changes in the water vapour and temperature
profiles (affecting clear sky radiative heating rates) as well
as from changes in the cloud distribution (affecting the
cloud radiative impact, not shown). In the stratosphere, the
radiative heating rates show the familiar pattern of down-
ward propagating anomalies associated with the QBO.
-60 -40 -20 0 20 40 60latitude
100
70
50
30
20
10
p [h
Pa]
ECINTER: Q*rad corr dU/dlnp|Singapore
-0.6
-0.
6
-0.5
-0.5
-0.5
-0.4
-0.4
-0.4 -0.4
-0.
3
-0.3
-0.3
-0.3
-0.3
0.3
0.3
0.4
0.4
0.5
0.5
0.6
0.7
Figure 9. Correlation coefficient of (all sky) radiative heatingrate anomalies (from ERA-Interim) after subtraction of annualcycle, with zonal wind shear over Singapore, at correspondingpressure level. Equatorial westerly (eastward) wind shear(du/dz>0, du/dlnp< 0) is associated with negative heating rate anomalies(reduced upwelling) over the inner tropics, and enhanced upwellingover the subtropics. Contours show only correlation coefficients
≤ −0.3 and≥ 0.3.
The QBO-related variations in stratospheric circu-
lation induce variations in the stratospheric ozone field,
which in turn affect radiative heating rates. It is well
known that this feedback plays an important role for the
QBO (e.g. Hasebe (1994)). Since the ECMWF radia-
tive heating rates are calculated using a seasonally vary-
ing climatological mean ozone field, the model radia-
tive heating rates miss this feedback. Radiative transfer
calculations using QBO-related ozone variations derived
from SAGE II and HALOE measurements (not shown)
show, however, that the temperature-dependent variations
of heating rates are larger (about a factor 3) than those
arising from the ozone variations. Nonetheless, for model
calculations of stratospheric transport that may employ the
ECMWF radiative heating rates (as an alternative to the
vertical wind field, which is often noisy) this caveat should
Copyright c© 2008 Royal Meteorological Society
Prepared usingqjrms3.cls
Q. J. R. Meteorol. Soc.00: 1–27 (2008)
DOI: 10.1002/qj

16 FUEGLISTALERET AL.
be borne in mind.
Figure9 shows the correlation between zonal wind
shear over Singapore (as a proxy for the QBO) and the
radiative heating rate anomalies at the corresponding pres-
sure surface. The figure shows that westerly (eastward)
zonal wind shear over Singapore is associated with neg-
ative radiative heating rate anomalies (reduced upwelling)
over the inner tropics (andvice versa), in accordance with
the expectation from theNewtonian cooling approxima-
tion that positive temperatures anomalies in a layer in the
tropical stratosphere should be associated with reduced
radiative heating rates (andvice versa). Further, the fig-
ure shows that equatorial westerly wind shear (reduced
upwelling) is associated with enhanced upwelling over
the subtropics. The radiative heating rate anomalies of
the ECMWF reanalyses thus recover the secondary merid-
ional circulation associated with the QBO, and the latitude
where the correlation changes sign is consistent with the
latitudinal half-width (order 10olatitude) of the QBO (see
Baldwinet al. (2001)).
The modulation of the latitudinal structure of
upwelling by the QBO also plays a role for the promi-
nent ‘double peak’ structure of radiative heating around
70 hPa (see Figure1). Figure8(b) shows the timeseries of
radiative heating rates after subtracting the radiative heat-
ing at the equator on the 70 hPa pressure surface. This
slightly unconventional calculation highlights the differ-
ences between equatorial, and off-equatorial heating rates.
The figure shows that through much of the period 1997-
2003, radiative heating rates at 70 hPa over the subtropics
exceed those over the inner tropics, such that the double
peak structure shown in Figure 1 is not a simply because
of the particular phase of the QBO in the year 2000. Fig-
ure 8(b) shows thatonly during the progression from
low temperature anomaly (easterly wind shear; enhanced
equatorial upwelling) to high temperature anomaly (west-
erly wind shear; suppressed equatorial upwelling), radia-
tive heating rates are uniform over the entire tropics (over
the period shown in Figure8, this situation is found at the
beginning of 1997, end of 1998/beginning of 1999, end of
2001/beginning of 2002, and end of 2003).
The latitudinal structure of stratospheric radiative
heating rates provide important constraints and insight
into the processes that drive the stratospheric diabatic
residual circulation (e.g. Plumb and Eluskiewiz (1999)).
As with the equatorial heating rate anomalies, heating rate
variations arising from interannual ozone concentration
variations may modify the pattern shown in Figure8(b). It
is clear, however that the strong modulation of the merid-
ional structure of radiative heating arising from tempera-
ture variations alone calls for some caution with regards
to interpretations based on data that may not extend over
at least a full period of the QBO. Further, radiative heating
rates averaged over the inner tropics alone (as sometimes
seen in the literature) may not be adequate to quantify the
diabatic mass flux in the ascending branch of the strato-
spheric overturning circulation.
Finally, we note that the patterns in clear sky radiative
heating shown in this section are very similar for all sky
calculations, and that clouds have very little impact on
interannual variability of stratospheric heating rates.
5 Data assimilation
One of the distinct advantages of assimilated data is that
they have relatively tight constraints on the temperature
fields, which in turn is critical for accurate calculation
of radiative heating rates. However, the assimilation pro-
cess is not energy-conserving (for the atmosphere), and
assimilation increments (the difference between model
forecast and the final value after assimilation) may arise.
Copyright c© 2008 Royal Meteorological Society
Prepared usingqjrms3.cls
Q. J. R. Meteorol. Soc.00: 1–27 (2008)
DOI: 10.1002/qj

DIABATIC HEAT BUDGET 17
The model forecast can produce locally large deviations
from the observed state of the atmosphere, for example
due to a slight displacement in the forecast of the loca-
tion of convection or baroclinic instabilities. To first order,
the assimilation increment then serves to correct for these
errors in the forecast. However, when averged globally
and over time, these forecast errors may be expected to
roughly cancel, and the remainder are systematic errors in
the model heat budget. The question then is: what kind of
errors are these increments correcting?
5.1 Classification of errors
In section2we have shown that the assimilation increment
corrects for errors in the model diabatic terms, but that
errors in the advective terms are not corrected, but com-
pensated. In the latter case, the total diabatic heating does
not recover the true diabatic heating in the atmosphere.
Here, we consider it useful to classify errors in
the heat budget from the perspective of the model and
assimilation system. We distinguish the following types.
(I) Errors that arise from errors in the model itself,
for example due to an inaccurate radiative transfer
code, or problems with the parameterization of
convection. Another prominent example of a type
(I) error is lack of an internally generated QBO.
(II) Errors that arise due to incorrect representation of
data fields other than wind, whereby we distin-
guish errors from off-line fields (IIa) and errors from
assimilated fields (IIb). For example, the models
discussed here use an ozone climatology to calcu-
late radiative heating rates; an error in this climatol-
ogy produces an error in the radiative heating rates
even if the radiative transfer code is correct, and
we would label this error as type (IIa). Conversely,
the assimilation process may produce an unrealis-
tic temperature distribution, which again results in
incorrect radiative heating rates that we would clas-
sify as type (IIb) error. The differences in radiative
heating rates shown in Figure4 as a consequence of
differing temperature fields would be a good exam-
ple for a type (IIb) error.
(III) Errors that arise because of errors in the dynamical
fields (i.e. wind, and coupled via mass conservation,
the vertical wind field) that induce spurious heat
fluxes.
Note that errors of type (IIb) and (III) may result from
the assimilation process due to (a) biases in the observa-
tions (for example due to radiative effects on radiosonde
instruments), and (b) biases arising from the assimilation
process itself (of which we will discuss an example in
some detail below).
Hence, the interpretation of the assimilation incre-
ment is not straightforward, as it may serve to compen-
sate errors in the model physics, or problems associated
with the assimilation process. Errors of type (I) and (II)
directly affect the model diabatic heating termQ (see
equation1), and will produce a temperature drift∂T∂t
that
requires correction by the assimilation. Adding the correc-
tions required to compensate type (I) and (II) errors to the
model diabatic heating would greatly improve the model
estimate for the true diabatic heating (recall eqn.13).
However, it is virtually impossible to separate type (I) and
(II) from type (III) errors. Type (III) errors induce spu-
rious temperature trends via erroneous representation of
theadiabatic heat flux terms of equation1. The correction
required by the assimilation in this case wouldnot serve
to arrive at a correct diabatic heating, but to provide the
heating required to compensate the spurious heat fluxes.
Copyright c© 2008 Royal Meteorological Society
Prepared usingqjrms3.cls
Q. J. R. Meteorol. Soc.00: 1–27 (2008)
DOI: 10.1002/qj

18 FUEGLISTALERET AL.
Hence, it ensures that the erroneous representation of cir-
culation is balanced by the required heating, but does not
correct the erroneous circulation towards the true circula-
tion.
Additional constraints are required that can provide
clues on the interpretation of the heat budget of an assimi-
lated data set. In particular, in the absence of a temperature
drift of the entire atmosphere over the course of a year, the
annual mean diabatic mass flux across an isentropic sur-
face should be zero. This is anecessarycondition for a
correct representation of the atmospheric circulation, but
not asufficientcondition.
5.2 Analysis of assimilation increments
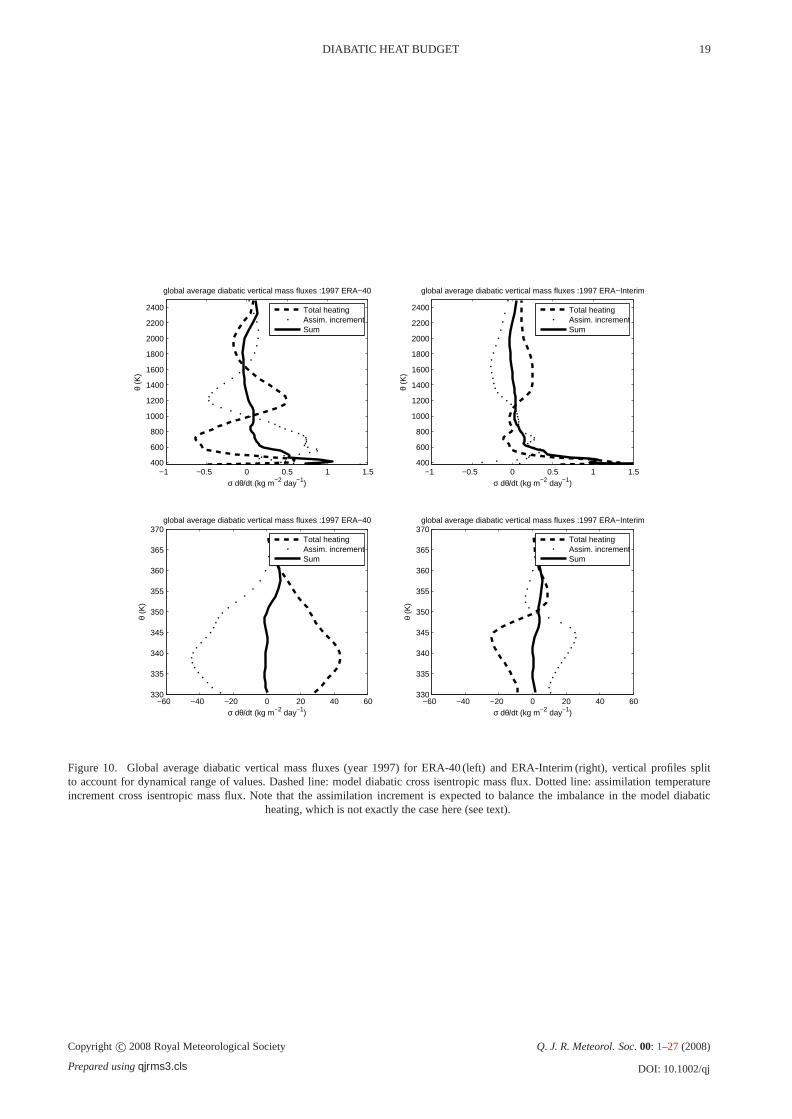
Figure10 shows the annual mean (year 1997, other years
are similar) diabatic mass flux integrated over isentropic
surfaces calculated from the model (forecast) total dia-
batic heating, and calculated from the assimilation incre-
ment. It is readily seen that the two terms indeed largely
cancel, i.e. the global mean assimilation increment on
isentropes prevents the model temperatures from drifting.
The previously noted underestimation of radiative heating
by ERA-40 around 30 hPa (recall Figure 5) is very evi-
dent in Figure 10(a). The large model diabatic heat loss
(dashed line) centered at a potential temperature of about
700 K (corresponding to about 30 hPa) is balanced by
a correspondingly large positive assimilation increment
(dotted line). Not unexpectedly, the imbalance is larger
in the upper troposphere and lower stratosphere (lower
plots) than in the stratosphere above. Further, the imbal-
ance is larger (about a factor two) in ERA-40 (left) than
in ERA-Interim (right), which suggests that the model and
assimilation process of ERA-Interim are closer to reality.
The figure further shows that the excessive diabatic
heating arising from excessive latent heat release in the
tropics in ERA-40 dominates the global balance from
330 K-360 K, such that the assimilation increment has to
cool this layer. In other words, the assimilation process
acts continously as a heat sink for ERA-40 in that layer.
Conversely, ERA-Interim shows too little heating up to
350 K, and the assimilation increment acts as a continous
heat source that warms the system in this layer.
Copyright c© 2008 Royal Meteorological Society
Prepared usingqjrms3.cls
Q. J. R. Meteorol. Soc.00: 1–27 (2008)
DOI: 10.1002/qj
DIABATIC HEAT BUDGET 19
−60 −40 −20 0 20 40 60330
335
340
345
350
355
360
365
370
θ (K
)
σ dθ/dt (kg m−2 day−1)
global average diabatic vertical mass fluxes :1997 ERA−40
Total heatingAssim. incrementSum
−60 −40 −20 0 20 40 60330
335
340
345
350
355
360
365
370
θ (K
)
σ dθ/dt (kg m−2 day−1)
global average diabatic vertical mass fluxes :1997 ERA−Interim
Total heatingAssim. incrementSum
−1 −0.5 0 0.5 1 1.5400
600
800
1000
1200
1400
1600
1800
2000
2200
2400
θ (K
)
σ dθ/dt (kg m−2 day−1)
global average diabatic vertical mass fluxes :1997 ERA−40
Total heatingAssim. incrementSum
−1 −0.5 0 0.5 1 1.5400
600
800
1000
1200
1400
1600
1800
2000
2200
2400
θ (K
)
σ dθ/dt (kg m−2 day−1)
global average diabatic vertical mass fluxes :1997 ERA−Interim
Total heatingAssim. incrementSum
Figure 10. Global average diabatic vertical mass fluxes (year 1997) for ERA-40 (left) and ERA-Interim (right), verticalprofiles splitto account for dynamical range of values. Dashed line: modeldiabatic cross isentropic mass flux. Dotted line: assimilation temperatureincrement cross isentropic mass flux. Note that the assimilation increment is expected to balance the imbalance in the model diabatic
heating, which is not exactly the case here (see text).
Copyright c© 2008 Royal Meteorological Society
Prepared usingqjrms3.cls
Q. J. R. Meteorol. Soc.00: 1–27 (2008)
DOI: 10.1002/qj

20 FUEGLISTALERET AL.
Within the expected accuracy, the globally averaged
total model heating and assimilation increment compen-
sate each other, except for the region from 350 K to about
the tropopause. We have checked for problems arising
from numerical inaccuracies (for example due to neces-
sary interpolations), but were not able to identify the cause
of the slight imbalance.
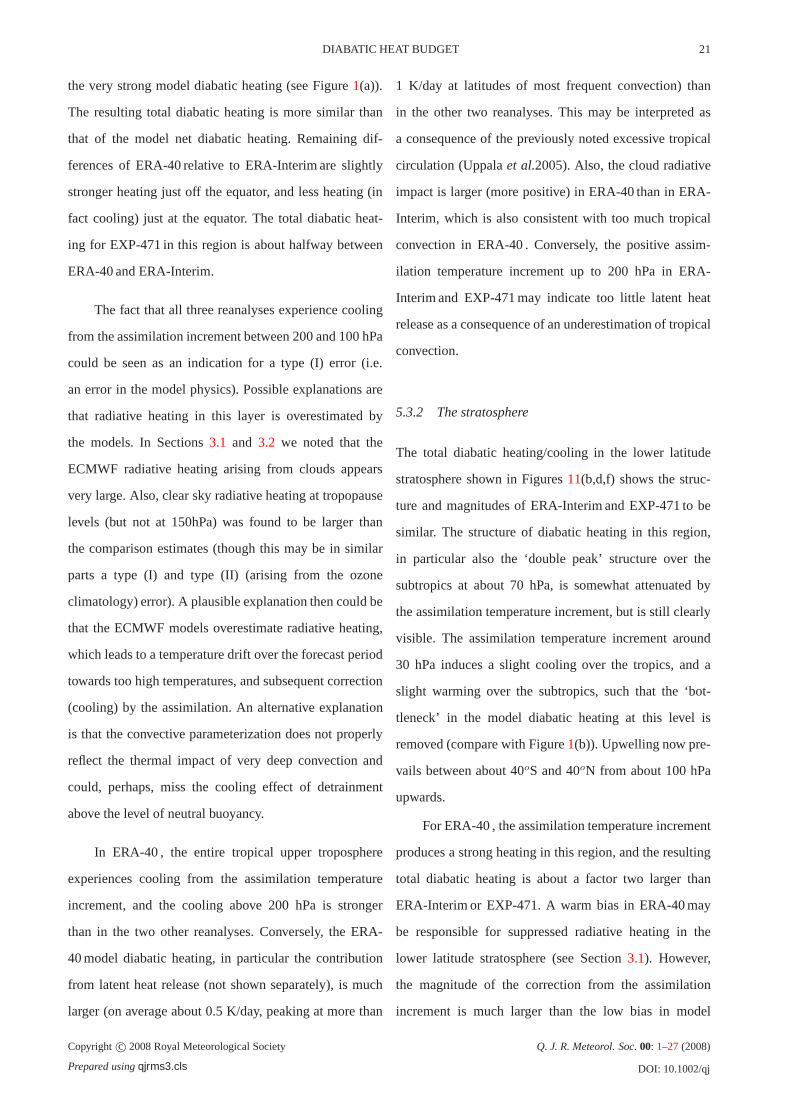
The full latitude/height structure of the annual, zonal
mean assimilation increment is shown in Figure11(left
column) for ERA-40 (top) EXP-471 (middle) and ERA-
Interim (bottom). The right column shows the correspond-
ing total diabatic heating (i.e. total model heating plus
assimilation increment). The magnitude of the assimila-
tion increment is by far largest for ERA-40 , while EXP-
471 and ERA-Interim have similar values. Also, the struc-
ture of the assimilation increments in the latitude-height
plane of ERA-Interim and EXP-471 is similar. At low lati-
tudes, ERA-Interim and EXP-471 show negative assimila-
tion increments (cooling) between about 200 and 100 hPa,
which rises to about 100 to 70 hPa over the subtropics.
Further, the assimilation increment is cooling the tropical
layer between about 50 and 30 hPa, while the remainder is
slightly warmed by the assimilation increment. Common
to all three reanalyses (but most pronounced in ERA-40 )
are oscillations in the vertical structure of the assimilation
increment at high latitudes. These oscillations are prob-
ably related to the problems of the vertical temperature
profile (recall discussion of Figure4).
The assimilation increment of ERA-40 at lower lat-
itudes shows quite a different structure than ERA-
Interim or EXP-471. Up to about 100 hPa, strong cool-
ing is observed throughout the tropics, followed by strong
heating above. The magnitude of the assimilation incre-
ment of ERA-40 in particular in the stratosphere is as
large, or even larger, than the net model diabatic heat-
ing/cooling.
5.3 Interpretation
Figures11(b,d,f) show the zonal mean total (being the
sum of the model diabatic heating and assimilation tem-
perature increment) diabatic heating for the year 2000 of
ERA-40 , EXP-471 and ERA-Interim. We interprete these
fields as being the diabatic heating fields correspond-
ing to the residual circulation as represented in each of
the reanalysis data. It is readily seen that the total dia-
batic heating of the three reanalyses are broadly similar
inasmuch as they show upwelling at lower latitudes and
descent over higher latitudes, but that there are also sub-
stantial differences. Since the true atmospheric diabatic
heat balance is not known, it is not possible to directly
assess the quality of each of the reanalyses. However,
combining the information from the model diabatic terms
with the assimilation temperature increment, and compar-
ing these terms between the three reanalyses, allows at
least a tentative interpretation and assessment.
5.3.1 The upper troposphere at lower latitudes
Comparison of Figure1 and Figures11(b,f) shows
that the assimilation temperature increment applied to
ERA-40 and ERA-Interim yields convergence for the total
(model plus assimilation increment) diabatic heating
between ERA-40 and ERA-Interim for this region. For
ERA-Interim, the heating provided by the assimilation
temperature increment between 300 and 200 hPa reduces
the prominent ‘bottleneck’-structure (i.e. net heating is
confined to a very narrow latitudinal belt just north of the
equator) in the model diabatic heating in this layer (see
Figure1(b)). Conversely, the cooling by the assimilation
increment between 300 and 100 hPa in ERA-40 reduces
Copyright c© 2008 Royal Meteorological Society
Prepared usingqjrms3.cls
Q. J. R. Meteorol. Soc.00: 1–27 (2008)
DOI: 10.1002/qj
DIABATIC HEAT BUDGET 21
the very strong model diabatic heating (see Figure1(a)).
The resulting total diabatic heating is more similar than
that of the model net diabatic heating. Remaining dif-
ferences of ERA-40 relative to ERA-Interim are slightly
stronger heating just off the equator, and less heating (in
fact cooling) just at the equator. The total diabatic heat-
ing for EXP-471 in this region is about halfway between
ERA-40 and ERA-Interim.
The fact that all three reanalyses experience cooling
from the assimilation increment between 200 and 100 hPa
could be seen as an indication for a type (I) error (i.e.
an error in the model physics). Possible explanations are
that radiative heating in this layer is overestimated by
the models. In Sections3.1 and 3.2 we noted that the
ECMWF radiative heating arising from clouds appears
very large. Also, clear sky radiative heating at tropopause
levels (but not at 150hPa) was found to be larger than
the comparison estimates (though this may be in similar
parts a type (I) and type (II) (arising from the ozone
climatology) error). A plausible explanation then could be
that the ECMWF models overestimate radiative heating,
which leads to a temperature drift over the forecast period
towards too high temperatures, and subsequent correction
(cooling) by the assimilation. An alternative explanation
is that the convective parameterization does not properly
reflect the thermal impact of very deep convection and
could, perhaps, miss the cooling effect of detrainment
above the level of neutral buoyancy.
In ERA-40 , the entire tropical upper troposphere
experiences cooling from the assimilation temperature
increment, and the cooling above 200 hPa is stronger
than in the two other reanalyses. Conversely, the ERA-
40 model diabatic heating, in particular the contribution
from latent heat release (not shown separately), is much
larger (on average about 0.5 K/day, peaking at more than
1 K/day at latitudes of most frequent convection) than
in the other two reanalyses. This may be interpreted as
a consequence of the previously noted excessive tropical
circulation (Uppalaet al.2005). Also, the cloud radiative
impact is larger (more positive) in ERA-40 than in ERA-
Interim, which is also consistent with too much tropical
convection in ERA-40 . Conversely, the positive assim-
ilation temperature increment up to 200 hPa in ERA-
Interim and EXP-471 may indicate too little latent heat
release as a consequence of an underestimation of tropical
convection.
5.3.2 The stratosphere
The total diabatic heating/cooling in the lower latitude
stratosphere shown in Figures11(b,d,f) shows the struc-
ture and magnitudes of ERA-Interim and EXP-471 to be
similar. The structure of diabatic heating in this region,
in particular also the ‘double peak’ structure over the
subtropics at about 70 hPa, is somewhat attenuated by
the assimilation temperature increment, but is still clearly
visible. The assimilation temperature increment around
30 hPa induces a slight cooling over the tropics, and a
slight warming over the subtropics, such that the ‘bot-
tleneck’ in the model diabatic heating at this level is
removed (compare with Figure1(b)). Upwelling now pre-
vails between about 40oS and 40oN from about 100 hPa
upwards.
For ERA-40 , the assimilation temperature increment
produces a strong heating in this region, and the resulting
total diabatic heating is about a factor two larger than
ERA-Interim or EXP-471. A warm bias in ERA-40 may
be responsible for suppressed radiative heating in the
lower latitude stratosphere (see Section3.1). However,
the magnitude of the correction from the assimilation
increment is much larger than the low bias in model
Copyright c© 2008 Royal Meteorological Society
Prepared usingqjrms3.cls
Q. J. R. Meteorol. Soc.00: 1–27 (2008)
DOI: 10.1002/qj

22 FUEGLISTALERET AL.
radiative heating rates. Hence, it is possible that ERA-
40 suffers from a type (III) error in this region. The
fact that ERA-Interim and EXP-471 require much smaller
assimilation increments suggests that the problem may be
related to the assimilation process rather than the model
itself.
At high latitudes, differences in the diabatic heat
budget between ERA-40 and ERA-Interim are particularly
pronounced. We have shown above that the peculiar oscil-
latory patterns in radiative heating rates in ERA-40 are a
consequence of an incorrect temperature profile, with lay-
ers that are too warm/cold having too much/little radiative
cooling. The assimilation increment of ERA-40 (and to
a much lesser degree in ERA-Interim) corrects for these
errors (see Figure11), and the resulting total (model dia-
batic plus assimilation temperature increment) diabatic
heating/cooling shows a more realistic structure (but note
that some weaker oscillatory patterns remain).
The comparison of the total diabatic heating between
ERA-40 on the one hand, and EXP-471 and ERA-
Interim on the other hand, shows that the stratospheric
circulation as represented by ERA-40 wind fields corre-
sponds to a much stronger diabatic residual circulation. It
is well known that stratospheric age of air calculated from
analysed data may give unrealistic values (e.g. Schoe-
berl et al. (2003)), and that calculations based on ERA-
40 wind fields have a strong bias towards too young air
(e.g. Scheeleet al. (2005), Monge-Sanzet al. (2008)).
However, a multitude of factors may lead to such a bias,
and little can be said about the diabatic residual circula-
tion from age of air calculations alone. Characterization
of stratospheric transport would thus greatly benefit from
a combination of age of air calculations with the calcula-
tion of the total diabatic heating.
Overall, ERA-Interim appears to provide a much
improved stratospheric temperature field, and diabatic cir-
culation. As documented in detail by Uppalaet al.(2005),
Simmonset al. (2007) and Uppalaet al. (2008), this
progress resulted from various factors. Perhaps most
importantly, a number of improvements in the data assim-
ilation system have led to a smaller difference between
the model background state and the state enforeced by the
assimilation system.
It was found that the radiative transfer calculations
using the fast radiative transfer model (RTTOV) for the
temperature retrieval from satellite radiances of the top
three channels 12, 13 and 14 of AMSU employed an inac-
curate modelling of the Zeeman effect (a type (I) error in
our classification). For ERA-Interim, the Zeeman effect
is simply removed, and the consistency between SSU
channel-3 and AMSU channel-14 is improved. Also, it
was found that in the old RTTOV the weighting function
for AMSU-A channel-14 was located too high, which cre-
ated problems particularly during polar night, when the
mesosphere is warmer than the stratosphere. However, the
introduction of AMSU radiances still causes a tempera-
ture jump at levels higher than 10 hPa in ERA-Interim.
Compared to these changes in the assimilation system, the
changes brought about by the use of a 6 spectral interval
version of the short wave radiative transfer model, leading
to slightly larger radiative heating rates in the stratosphere
(recall Figure4b) are probably minor.
The changes in the data assimilation system led to a
state that is closer to that of the model in particularly in
the upper stratosphere, with important consequences. In
ERA-40 , the large discrepancy led to very large assimila-
tion increments that apparently induced temperature oscil-
lations well down to the lower stratosphere. Because of the
deep vertical structure of satellite radiances, such oscilla-
tions cannot be effectively constrained by data other than
Copyright c© 2008 Royal Meteorological Society
Prepared usingqjrms3.cls
Q. J. R. Meteorol. Soc.00: 1–27 (2008)
DOI: 10.1002/qj

DIABATIC HEAT BUDGET 23
radiosondes. Indeed, we find (not shown) that the assimi-
lation increment at locations of radiosondes tries to elim-
inate these oscillations. However, their overall weight in
the assimilation system was insufficient to correct the spu-
rious oscillations imposed higher up.
While these problems can be understood in terms of
type (I) and type (II) errors, the important question about
the ultimate cause of the excessive diabatic circulation in
the stratosphere must remain unanswered. Only errors of
type (III) induce heat fluxes that require correction by the
assimilation increment that, when added to the total model
diabatic heating, do not add up to the true diabatic heating.
However, we could not locate asingle largestprocess
that may have induced the apparently large spurious heat
fluxes in ERA-40 .
Copyright c© 2008 Royal Meteorological Society
Prepared usingqjrms3.cls
Q. J. R. Meteorol. Soc.00: 1–27 (2008)
DOI: 10.1002/qj
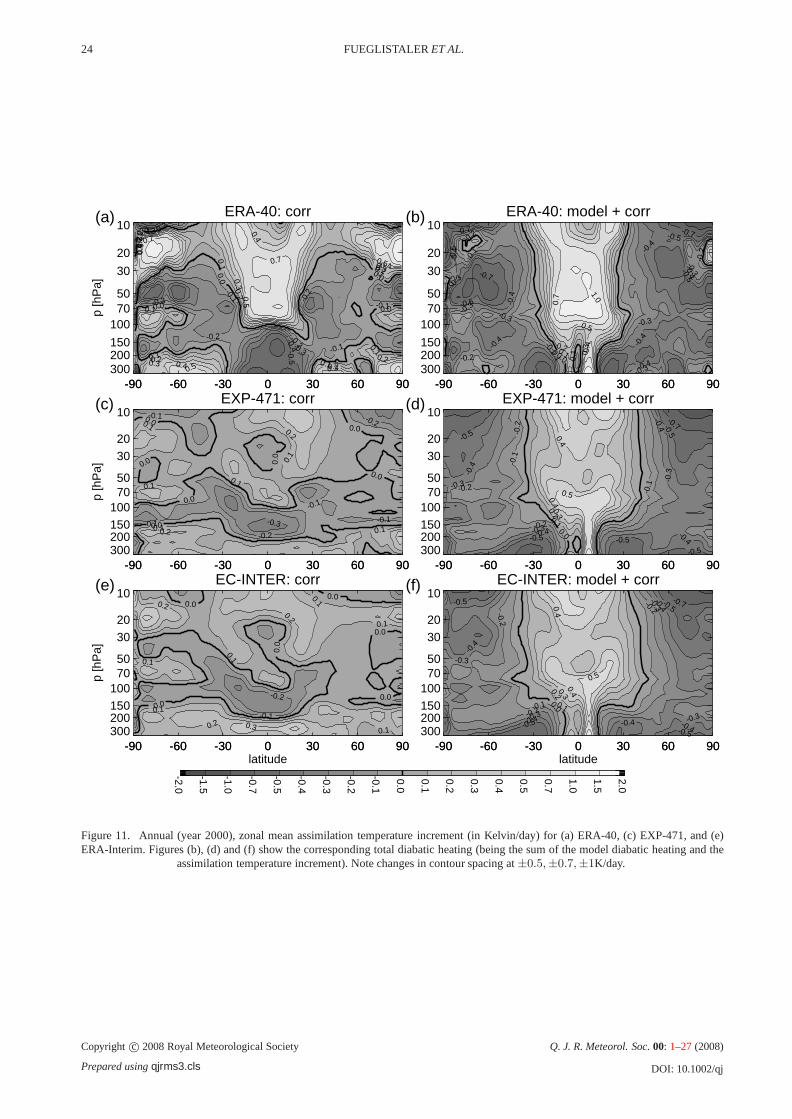
24 FUEGLISTALERET AL.
-90 -60 -30 0 30 60 90
-90 -60 -30 0 30 60 90300200150
100 70 50
30
20
10
p [h
Pa]
ERA-40: corr
-0.5-0.4
-0.3
-0.3
-0.3
-0.2
-0.2
-0.2
-0.2
-0.1
-0.1
-0.1
-0.1
0.0 0.0
0.0
0.0
0.0
0.1 0.1
0.1 0.1
0.1
0.1
0.1
0.2 0.2
0.2
0.2
0.2
0.2
0.3
0.3
0.3 0.3
0.3
0.4
0.4
0.4
0.4
0.5
0.5
0.5
0.5
0.7
0.7
(a)
-90 -60 -30 0 30 60 90
-90 -60 -30 0 30 60 90300200150
100 70 50
30
20
10ERA-40: model + corr
-0.7 -0.7
-0.7
-0.5
-0.5
-0.5
-0.5
-0.4
-0.4
-0.4
-0.4 -0
.4
-0.4
-0.4
-0.3
-0.3
-0.3
-0.3
-0.3
-0.3
-0.2
-0.2
-0.2
-0.2
-0.2-0.1
-0.1
0.0 0.1
0.1
0.2
0.3 0.4
0.5
0.7
1.0
(b)
-90 -60 -30 0 30 60 90
-90 -60 -30 0 30 60 90300200150100 70 50
30 20
10
p [h
Pa]
EXP-471: corr
-0.3
-0.2
-0.2-0.1 -0.1
-0.1
-0.1
0.0
0.0
0.0
0.0 0.0
0.0 0.0
0.1 0.1
0.1
0.1 0.1
0.1
0.2
0.2
(c)
-90 -60 -30 0 30 60 90
-90 -60 -30 0 30 60 90300200150100 70 50
30 20
10EXP-471: model + corr
-0.7
-0.5 -0.5
-0.5
-0.5
-0.5
-0.4 -0.4
-0.4
-0.4
-0.3
-0.3
-0.3
-0.2-0
.2
-0.2
-0.1
-0.1
0.0
0.1 0.2 0.3
0.4 0.4
0.5
(d)
-90 -60 -30 0 30 60 90
-90 -60 -30 0 30 60 90latitude
300200150100 70 50
30 20
10
p [h
Pa]
EC-INTER: corr
-0.2
-0.1 0.0
0.0
0.0
0.0
0.0 0.0
0.1
0.1
0.1
0.1
0.1
0.1 0.2
0.2
0.2
0.3
(e)
-90 -60 -30 0 30 60 90
-90 -60 -30 0 30 60 90latitude
300200150100 70 50
30 20
10EC-INTER: model + corr
-0.7
-0.5-0.5
-0.5 -0.5
-0.4 -0.4 -0.4
-0.4
-0.4
-0.3 -0.3
-0.3
-0.3
-0.2
-0.2
-0.2
-0.1
0.0
0.1
0.2 0.3
0.4
0.4
0.5
(f)
-2.0
-1.5
-1.0
-0.7
-0.5
-0.4
-0.3
-0.2
-0.1
0.0
0.1
0.2
0.3
0.4
0.5
0.7
1.0
1.5
2.0
Figure 11. Annual (year 2000), zonal mean assimilation temperature increment (in Kelvin/day) for (a) ERA-40, (c) EXP-471, and (e)ERA-Interim. Figures (b), (d) and (f) show the corresponding total diabatic heating (being the sum of the model diabaticheating and the
assimilation temperature increment). Note changes in contour spacing at±0.5,±0.7,±1K/day.
Copyright c© 2008 Royal Meteorological Society
Prepared usingqjrms3.cls
Q. J. R. Meteorol. Soc.00: 1–27 (2008)
DOI: 10.1002/qj
DIABATIC HEAT BUDGET 25
6 Outlook
The comparison of the total diabatic heating rates of the
three reanalyses illustrates our assertion given above that
the average diabatic circulation in reanalyses can be very
different, and that excessive heating in one place can be
compensated by excessive cooling in another without vio-
lating the constraints arising from energy conservation.
The results presented in this paper show that due care
should be used when deducing residual circulations from
(re-)analyses, as the observed differences in total diabatic
heating not only arise from model deficiences in diabatic
heating (which would not constitute a problem for analy-
ses of Eliassen-Palm fluxes, for example), but also due to
spurious heat fluxes associated with spurious eddy (verti-
cal and horizontal) heat fluxes. The fact that the temper-
ature assimilation increment is much smaller in the new
interim reanalyses than in ERA-40 suggests that the dia-
batic heat budget in these reanalyses is much closer to
reality. The improvement arises from a combination of
improvements in the model, and in the assimilation system
with a 4-dimensional variational assimilation procedure
and an improved correction for biases in the observations
entering the assimilation system.
The comparison between ERA-40 and ERA-Interim,
and the analysis of the corresponding assimilation incre-
ments, show that the next generation of reanalyses can
be expected to provide a fairly accurate representation
of the general circulation, and in particular also of its
diabatic residual circulation. Such reanalyses may then
allow to study the diabatic residual circulation, its driv-
ing processes, and variability and trends therein, with even
greater accuracy, and without the need ofad-hocsolu-
tions to satisfy the global heat budget. Some ambiguity
will remain as a result of the use of climatologies of, for
example, ozone, which induces type (IIa) errors that can
prevent direct use of model diabatic heating for further
analyses.
The progress seen between ERA-40 and ERA-
Interim, in particular the much smaller assimilation incre-
ment in the latter, gives hope that in the not so distant
future analysis data products are of high enough quality
that it may be also possible to analyse time series of the
assimilation increment for signals arising from changes
in the climate system that are not captured by the model.
Such an analysis would provide extremely valuable infor-
mation about model deficienciesaffecting their ability to
reliably predict climate changes.
In this work we have focussed on the diabatic terms
of the thermodynamic energy equation. Questions to be
addressed in future work are (i) to what extent the total
diabatic heat budget (including assimilation increment)
reconciles with the diabatic residual circulation deter-
mined via the transformed Eulerian mean equations, and
(ii) to what extent previously published analyses in the
TEM-framework based on older reanalysis (and opera-
tional analysis) data products suffer from the same defi-
ciences that lead to the large assimilation increments as
seen in ERA-40 .
Acknowledgements
SF would like to thank for support from the integrated
EU project ‘SCOUT’ through contract 505390-GOCE-
CT-2004. We greatefully acknowledge helpful comments
and constructive criticism from an anonymous reviewer
and S. Pawson.
References
Allan RP, Ringer MA, Pamment JA, Slingo A. 2004. Simulation of the
Earth’s radiation budget by the European Centre for Medium-Range
Weather Forecast 40-year reanalysis (ERA40),J. Geophys. Res., 109,
D18107, doi:10.1029/2004JD004816.
Copyright c© 2008 Royal Meteorological Society
Prepared usingqjrms3.cls
Q. J. R. Meteorol. Soc.00: 1–27 (2008)
DOI: 10.1002/qj
26 FUEGLISTALERET AL.
Baldwin MP,et al.2001. The quasi-biennial oscillation,Rev. Geophys.,
39 (2), 179–229.
Boville BA, Rasch PJ, Hack JJ, McCaa JR. 2006. Representation of
Clouds and Precipitation Processes in the Community Atmosphere
Model Version 3 (CAM3),J. Clim., 19,2184–2198.
Bresser G, Manning AJL, Pawson S, Rodgers CD. 1995. A New Param-
eterization of Scale-Dependent Radiative Rates in the Stratosphere,J.
Atmos. Sci., 52, (24),4429–4447.
Cariolle D, Deque M. 1986. Southern hemisphere medium-scale waves
and total ozone disturbances in a spectral general-circulation model,
J. Geophys. Res., 91, D10, 825-846.
Chevallier F, Bauer P, Kelly G, Jakob C,McNally T. 2001. Model Clouds
over Oceans as Seen from Space: Comparison with HIRS/2 and MSU
Radiances,J. Clim., 14,4216-4229.
Corti T, Luo BP, Peter T, Vomel H, Q.Fu Q. 2005. Mean radiative
energy balance and vertical mass fluxes in the equatorial upper
troposphere and lower stratosphere,Geophys. Res. Letts., 32,L06802,
doi:10.1029/2004GL021889.
Dima I, Wallace JM. 2007. Structure of the Annual-Mean Equatorial
Planetary Waves in the ERA-40 Reanalyses,J. Atmos. Sci., 64,2862–
2880, doi:10.1175/JAS3985.1.
Dunkerton T. 1978. On the Mean Meridional Mass Motions of the
Stratosphere and Mesosphere,J. Atmos. Sci., 35,2325–2333.
Fels SB. 1982. A Parameterization of Scale-Dependent Radiative
Damping Rates in the Middle Atmosphere,J. Atmos. Sci., 39,1141–
1152.
Folkins I, Loewenstein M, Podolske J, Oltmans SJ, Proffit M. 1999.
A barrier to vertical mixing at 14 km in the tropics: Evidencefrom
ozoneondes and aircraft measurements,J. Geophys. Res., 104 (D18),
22095–22102.
Fortuin JPF, Langematz U. 1994. An update on the global ozoneclima-
tology and on concurrent ozone and temperature trends.Proceedings
SPIE Vol. 2311, Atmospheric Sensing and Modeling, 207-216.
Fouquart Y, Bonnel B. 1980. Computation of solar heating of the Earth’s
atmosphere: A new parameterization.Beitr. Phys., 53, 35-62.
Fueglistaler S, Wernli H, Peter T. 2004. Tropical Troposphere-to-
Stratosphere Transport inferred from Trajectory calculations,J. Geo-
phys. Res., 109,D03108, doi:10.1029/2003JD004069.
Fueglistaler S, Fu Q. 2006. Impact of clouds on radiative heating rates
in the tropical lower stratosphere,J. Geophys. Res., 111,D23202,
doi:10.1029/2006JD007273.
Gettelman AE, de F. Forster PM, Fujiwara M, Fu Q, Vomel H,
Gohar LK, Johanson C, Ammerman M. 2004. Radiation bal-
ance of the tropical tropopause layer,J. Geophys. Res., 109,
doi:10.1029/2003JD004190.
Gill AE. 1980. Some simple solutions for heat induced tropical circula-
tion, Q.J.R. Meteorol. Soc., 106,447–462.
Goody RM, Yung YL 1989. Atmospheric Radiation, 2nd edition,
Oxford University Press, New York.
Hartmann DL, Moy LA, Fu Q. 2001. Tropical convection and the energy
balance at the top of the atmosphere,J. Clim. 14 (24),4495-4511.
Hasebe F. 1994. Quasi-Biennial Oscillations of Ozone and Diabatic
Circulation in the Equatorial Stratosphere,J. Atmos. Sci., 51 (5),729–
745.
Haynes PH, Marks CJ, McIntyre ME, Shepherd TG, Shine KP, 1991.
On the ‘Downward Control’ of Extratropical Diabatic Circulations by
Eddy-Induced Mean Zonal Forces,J. Atmos. Sci., 48 (4),651–678.
Held IM, Hou AY. 1980. Nonlinear Axially Symmetric Circulations in
a Nearly Inviscid Atmosphere,J. Atmos. Sci., 37, 515–533.
Highwood EJ, Hoskins BJ. 1998. The tropical tropopause,Q. J. R.
Meteorol. Soc., 124,1579–1604.
Jensen EJ, Toon OB, Selkirk HB, Spinhirne JD, and Schoeberl MR.
1996. On the formation and persistence of subvisible cirrusclouds
near the tropical tropopause,J. Geophys. Res., 101, 21361–21375.
Mc Farlane SA, Mather JH, Ackerman TP. 2007. Analysis of tropical
radiative heating profiles: A comparison of models and observations,
J. Geophys. Res.112, D14218, doi:10.1029/2006JD008290.
Mlawer EJ, Taubman SJ, Brown PD, Iacono MJ, Clough SA. 1997.
Radiative transfer for inhomogeneous atmospheres: RRTM, avali-
dated correlated-k model for the longwave,J. Geophys. Res., 102D,
16663-16682.
Monge-Sanz BM, MP Chipperfield, AJ Simmons, SM Uppala.
2008. Mean age of air and transport in a CTM: Comparison
of different ECMWF analyses,Geophys. Res. Letts., 34,L04801,
doi:10.1029/2006GL02815.
Morcrette J-J. 2002. Assessment of the ECMWF model cloudiness and
surface radiation fields at the ARM-SGP site.Mon. Wea. Rev., 130,
257-277.
Norton WA. 2006. Tropical Wave Driving of the Annual Cycle inthe
Tropical Tropopause Temperatures. Part II: Model Results,J. Atmos.
Sci., 63,1420–1431.
Oikonomou EK, O’Neill AO. 2006. Evaluation of ozone and water
vapor fields from the ECMWF reanalysis ERA-40 during 1991-1999
in comparison with UARS satellite and MOZAIC aircraft observa-
tions,J. Geophys. Res., 111,D14109, doi:10.1029/2004JD005341.
Pawson S, Stajner I, Kawa SR, Hayashi H, Tan WW, Nielsen JE, Zhu
Z, Chang LP, Livesey NJ. 2007. Stratospheric transport using 6-h-
averaged winds from a data assimilation system,J. Geophys. Res.,
112,D23103, doi10.1029/2006JD007673.
Peixoto JP, Oort AH. 1992.Physics of Climate. American Institute of
Physics.
Copyright c© 2008 Royal Meteorological Society
Prepared usingqjrms3.cls
Q. J. R. Meteorol. Soc.00: 1–27 (2008)
DOI: 10.1002/qj

DIABATIC HEAT BUDGET 27
Plumb RA. 1996. A ‘tropical pipe’ model of stratospheric transport,J.
Geophys. Res., 101 (D2),3957–3972.
Plumb RA, Eluszkiewicz J. 1999. The Brewer-Dobson Circulation:
Dynamics of the Tropical Upwelling,J. Atmos. Sci., 56,868–890.
Rosenfield JE, Considine DB, Schoeberl MR, Browell EV. 1998.The
impact of subvisible cirrus clouds near the tropical tropopause on
stratospheric water vapor,Geophys. Res. Letts., 25 (11),1883–1886.
Rosenlof KH. 1995. Seasonal cycle of the residual mean meridional
circulation in the stratosphere,J. Geophys. Res., 100 (D3),5173–
5191.
Scheele MP, PC Siegmund, PFJ van Velthoven. 2005. Stratospheric age
of airr computed with trajectories based on various 3D-Var and 4D-
Var data sets,Atmos. Chem. Phys., 5,1–7.
Schoeberl MR, AR Douglass, Z Zhu, S Pawson. 2003. A comparison of
the lower stratospheric age spectra derived from a general circulation
model and two data assimilation systems.J. Geophys. Res., 108 (D3),
4113, doi:10.1029/2002JD002652.
Schoeberl MR. 2004. Extratropical stratosphere-troposphere
mass exchange, J. Geophys. Res., 109, D13303,
doi:10.1029/2004JD004525.
Sherwood SC. 2000. A Stratospheric ‘Drain’ over the Maritime Conti-
nent,Geophys. Res. Letts., 27 (5),677-680.
Simmons A, Uppala S, Dee D, Kobayashi S. 2006. ERA-Interim:
New ECMWF reanalysis products from 1989 onwards,ECMWF
Newsletter, 110,25–35.
Spang R, Eidmann G, Riese M, Offermann D, Preusse P,
Pfister L, Wang PH. 2002. CRISTA observations of cirrus
clouds around the tropopause,J. Geophys. Res., 107 (D23),
doi:10.1029/2001JD000698.
Sprenger M, Maspoli MC, Wernli H. 2003. Tropopause folds andcross-
tropopause exchange: A global investigation based upon ECMWF
analyses for the time period March 2000 to February 2001,J.
Geophys. Res., 108, (D12),8518, doi:10.1029/2002JD002587.
Tan WW, Geller MA, Pawson S, da Silva A. 2004. A case study of exces-
sive subtropical transport in the stratosphere of a data assimilation
system,J. Geophys. Res., 109,D11102, doi:1029/2003JD004057.
Thompson AM, et al. 2003. Southern Hemisphere Additional
Ozonesondes (SHADOZ) 1998-2000 tropical ozone climatology 1.
Comparison with Total Ozone Mapping Spectrometer (TOMS) and
ground-based measurements,J. Geophys. Res., 108 (D2), 8238,
doi:10.1029/2001JD000967.
Trenberth KE, Stepaniak DP. 2003. Seamless poleward atmospheric
energy transports and implications for the Hadley circulation,J. Clim.,
16 (22),3706-3722.
Uppala SM,et al.2005. The ERA-40 re-analysis,Q. J. Roy. Meteorol.
Soc., 131,2961–3012.
Uppala S, Dee D, Kobayashi S, Berrisford P, Simmons A. 2008. Towards
a climate data assimilation system: status update of ERA-Interim,
ECMWF Newsletter, 115,12-18.
Wang PH, Minnis P, McCormick MP, Kent GS, Skeens KM. 1996. A 6-
year climatology of cloud occurrence frequency from Stratospheric
Aerosol and Gas Experiment II observations (1985-1990),J. Geo-
phys. Res., 101 (D23),29407–29429.
Winker DM, Trepte CR. 1998. Laminar cirrus observed near thetropical
tropopause by LITE,Geophys. Res. Lett., 25,3351–3354.
Copyright c© 2008 Royal Meteorological Society
Prepared usingqjrms3.cls
Q. J. R. Meteorol. Soc.00: 1–27 (2008)
DOI: 10.1002/qj