Embed Size (px)
Citation preview
CE
RT
IFIC
AT
E I
N S
UST
AIN
AB
LE
SY
STE
MS
AN
AL
YSI
S
History of the offshore wind industry Offshore wind made its first appearance off the shores of Denmark in 1991 (1). Since it’s initial introduction as a feasible option to capture a vast wind resource potential for electricity generation, offshore wind technologies have expanded in scope beyond the geographic region of the North Sea and beyond the basic turbine structure to capture the most wind potential energy while reducing environmental impacts and costs. The top 6 current leaders in global offshore wind generation include the UK, Denmark, China, Belgium, Germany, and the Netherlands (2). For approximately ten years after the construction of the first offshore turbines in 1991, little progress was made in the industry. That began to change in 2000, when EU offshore capacity started to gradually increase from 36 MW to 2,946 MW in 2010 (3). 2010 also saw the construction of the first offshore wind project outside of the EU; the Shanghai Donghai Bridge wind farm in China, with a capacity of 102 MW, began generating
power in June of that year (4,5). Although offshore wind farms were still less than 2% of the global installed wind capacity, capacity began to see real increases in 2011 (6). Since 2011, offshore wind capacity has increased 115%, with 15 countries having installed offshore wind farms (Figure 1). Most Wind farms are found in the EU, in the North and Baltic Seas and the Atlantic Ocean (7). Asia is the second powerhouse for offshore wind with farms in countries including China, Japan, and South Korea (8). Sadly, the U.S. is lagging behind, with only 0.02 MW of capacity in 2014(8). Trends in Technology Development In the past decade, the offshore wind market has seen an increase in average wind turbine size, average wind farm size, and improvement in performance and reliability (Figure 2) (9). Development in substructure technology, such as floating and tripod foundations, also enables wind farms to accommodate larger turbines in remote locations and deeper waters (Figure 3) (10). Currently, there are two
Team Members
Kate Buczek MEM Candidate Nicholas School of the Environment Siqi Han MEM Candidate Nicholas School of the Environment Kait Siegel MEM Candidate Nicholas School of the Environment
Dr. Jay S. Golden, Faculty Director Associate Professor of the Practice for Sustainable Systems Analysis Division of Earth & Ocean Sciences – Nicholas School of the Environment Director - Duke Center for Sustainability & Commerce at the Nicholas Institute http://center.sustainability.duke.edu/
GRADUATE CERTIFICATE IN SUSTAINABLE SYSTEMS ANALYSIS Nicholas School of the Environment
Duke University http://www.nicholas.duke.edu/sustainablesystems
Spring 2015
Source: Telegraph.co.uk, 2013
What does the history, present state, and future of
the global offshore wind industry look like?

FAST FACTS
There is currently 8,759 MW of installed offshore wind generation capacity in the world, most of which can be found in the EU. The EU has 8,046 MW of installed offshore wind capacity, capable of generating 29. 6 TWh of electricity.
China is the second largest offshore wind market, with 670 MW installed capacity. 76% of offshore wind turbines are installed on monopile foundations, which are suitable for water depth under 30m.
0
1000
2000
3000
4000
5000
6000
7000
8000
9000
10000
2011 2012 2013 2014
To
tal
Inst
all
ed
Ca
pa
city
(M
W)
Year
Other
Japan
China
UK
Sweden
Netherlands
Germany
Denmark
Belgium
Figure 1. Historical offshore wind installed capacity trends. Other countries category includes Finland, Ireland, Norway, Portugal, Sweden, South Korea, Spain, and the U.S. Source: GWEC 2011-2024
Figure 2. Average distance from shore, water depth, capacity, and turbine types of wind farms. Source: POWERED 2015.
CE
RT
IFIC
AT
E I
N S
UST
AIN
AB
LE
SY
STE
MS
AN
AL
YSI
S
full-scale floating turbines and two prototypes in the EU (11). Benefits of larger size of turbines and infrastructures include cost reduction in foundation construction, power grid, operations and maintenance, as well as higher utilization of space and efficiency of power generation (12). Globally, there has been a trend toward “bigger turbines and greater capacity” for offshore wind generation (13). By operating farther offshore and capitalizing on offshore oil drilling technologies for construction, offshore wind turbines can make up for much of this additional cost by the more constant laminar wind flow farther offshore as opposed to the more turbulent winds closer to the mainland (13).
CE
RT
IFIC
AT
E I
N S
UST
AIN
AB
LE
SY
STE
MS
AN
AL
YSI
S
CERTIFICATE IN SUSTAINABLE SYSTEMS ANALYSIS
Costs Costs are increased for offshore wind when compared with onshore wind resources due to the need to withstand harsh operating conditions, grid connection, installation, “balance-of-system” expenses, increased failures, increased maintenance expenses to get out to sea, and increased turbine downtime (14). A traditional onshore wind turbine costs about $2,200 per kilowatt (kW) while an offshore turbine is between 2 and 3 times more expensive at around $6,200 per kW (15). This higher cost doesn’t account for the improved performance of offshore wind turbines compared to those onshore. Although capital costs for offshore wind have increased in recent years, especially from 2011-2013 (16), with decreasing availability of steel, ever changing technologies, and extensive litigation and policies to get a turbine started, costs are projected to decline 40% by as early as 2030 (16). To reach this decline in costs, incentives and litigation would be instrumental—for instance, Shell hasn’t built an offshore wind farm since 2008 (17).
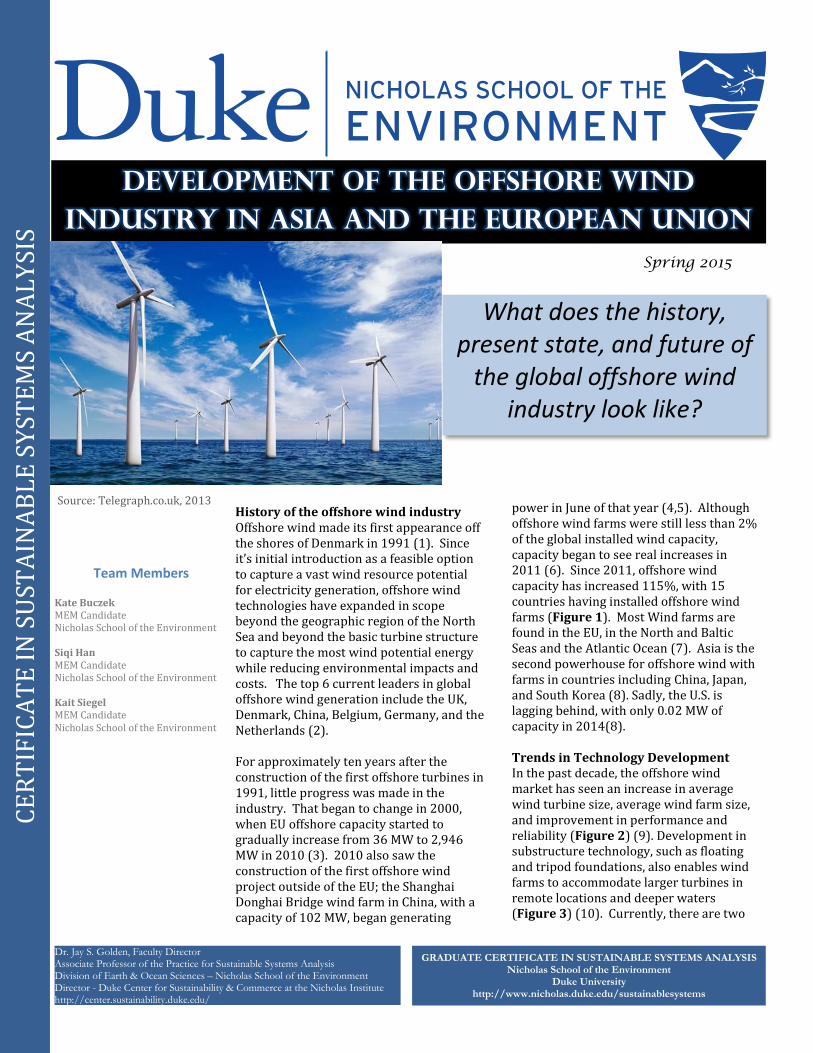
New floating turbine technologies can cost up to 10 times more than traditional offshore wind with a drilled base. Wind turbines are very sensitive to bouncing and turbulence, and thus floating structures are more difficult to promote stability for operations that maximize the laminar flow over the blades. (13). Despite these higher costs, it is projected that floating turbines may reach the market as early as 2025 (16).
Rare Earth Minerals have the potential to reduce costs associated with smaller, more efficient gear box construction that does not need to be serviced as often (13). Although these materials reduce turbine costs, China has the monopoly on these finite minerals so there is limited availability, and mining extraction can be harmful to the environment. Despite this initial environmental impact, rare earth minerals, once used in turbine gearbox production, can be recycled again and again in new turbine design as technologies improve (13).
Financial Market Drivers The whole process of construction and committing to build an offshore wind turbine can take up to 20 years, with environmental permitting procedures and industry standards typically lasting 6 to 8 years and construction taking about 12 months (13). With farther distances from shore, transmission and storage become issues making wind generation difficult to get to the people demanding it. Longer distances require DC transmission lines and thus more infrastructure costs and line losses associated with substations converting power back to AC electricity (18).
To overcome these financial burdens, governments often support initial loans for offshore wind farms to get the initial transmission loan agreements. The Crown Estate is an example of a financial governing body in the UK that helps wind farm operators get initial loans for capital investment. This organization leases projects and programs to help finance and develop offshore wind projects in the North Sea and pays for environmental bird and mammal permitting to get the projects started (19). Other financing
options include Power Purchase Agreements (PPA), transmission agreements where wind farms sign contracts with utilities and substations to ensure building a transmission line will not be in vain, and government initial loan guarantees.
Overall, the offshore wind industry has experienced financial success in Europe with Developers in the European offshore wind generation sites reporting internal rates of return in the 10-15% range, which indicates a trend toward investing in this form of renewable power generation (14). Decommissioning has market potential as well, a study by Deloitte and Douglas-Westwood estimates the total market potential for decommissioning of offshore wind turbines, oil, and gas from 2016 to 2031 in Denmark and the North Sea is worth about $47.5 billion (20).
Figure 3. Comparison of Floating and Bottom Based Turbine Costs. Source: Mhyr et. al , 2014
CE
RT
IFIC
AT
E I
N S
UST
AIN
AB
LE
SY
STE
MS
AN
AL
YSI
S C
ER
TIF
ICA
TE
IN
SU
STA
INA
BL
E S
YST
EM
S A
NA
LY
SIS
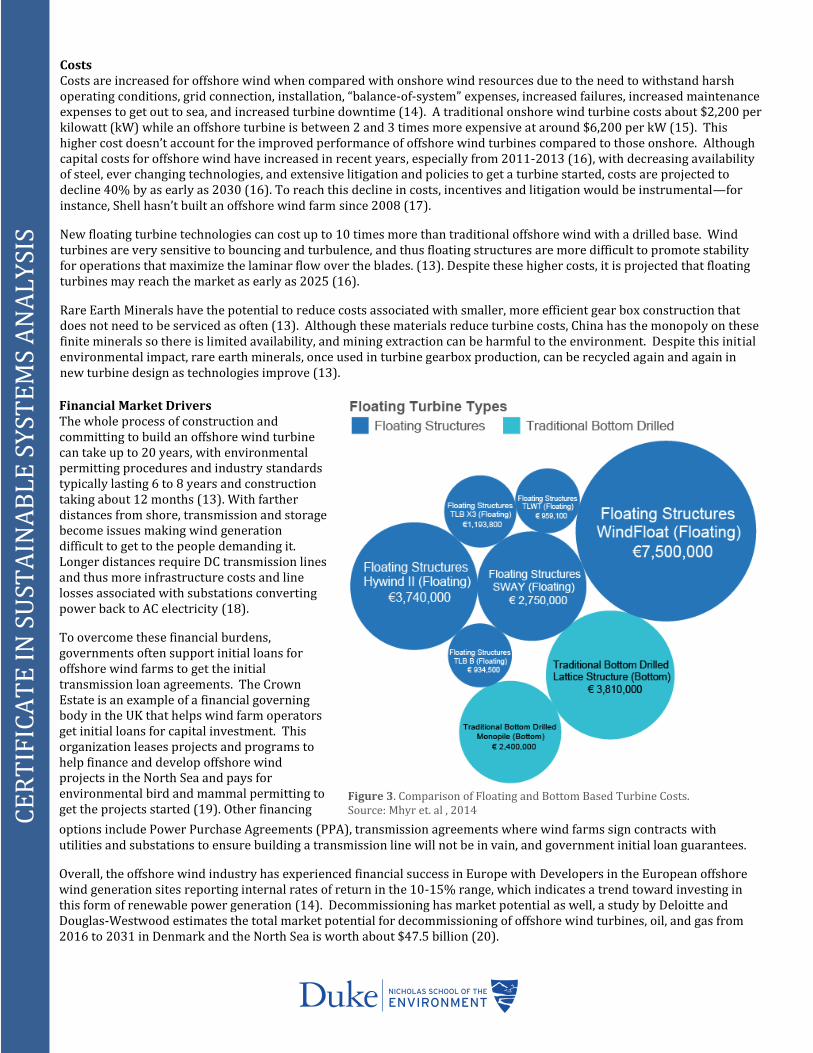
State of the Industry in 2014 As of 2014, global installed offshore wind capacity totaled 8,759 MW (8.7 GW), with wind farm locations following historical trends (Appendix) (8). Major players in the industry and incentives to construct turbines vary from region to region. The European Union is a leader in the industry and consequently has highest capacity of any region in the world. Capacity stood at 8,046 MW in 2014, a 24% increase from the previous year; over half of EU capacity is from turbines built by the UK (8). The 2,488 offshore turbines in the EU are capable of generating 29.6 TWh of electricity per year, approximately 1% of the EUs electricity needs (8). The main policy driving wind installations in the EU is the Renewable Energy Directive, enacted in 2009, and calls for the EU to derive 20% of its total energy from renewable sources by 2020(2). Individual countries provide further policy incentives for offshore wind development, including the Offshore Wind Industrial Strategy in the UK and the Renewable Energies Act, which provides feed in tariffs (Fit) for offshore wind generation, in Germany (21,22). A Memorandum of Understanding, signed by 10 EU countries in 2010, formalized the development of an international grid in the North Sea (23). This grid system could significantly enhance EU offshore wind generation by lowering costs, developing more
interconnection and competition between European power markets, and facilitating future large scale offshore wind generation (24). Asia’s market for offshore wind is significantly smaller than the EU’s, with only 725 MW of installed capacity as of 2014 (8). Nearly all of this capacity, 670 MW, is located in China, with the rest in Japan and South Korea (8). In China, the major policy driving offshore wind farm development is the 12th 5-year plan for Renewable Energy, which outlines a goal of 5 GW of installed offshore wind capacity by 2015(25). Japan uses a tariff system to support the offshore wind industry, and South Korea has begun to use a Renewable Portfolio Standard (RPS) to incentivize renewable technologies (2). Outlook and Projections Although projections show overall industry increases for offshore wind development, the Figure 4. Projected Global Wind Generation 2005-2018. Source: IEA 2013
rate of increase for some areas is slowing down. New installations in the Europe declined 5.34% between 2013 and 2014(8). The market is also expected to slow down significantly in 2016, with no plans for turbines to be commissioned that year (8). However, after 2016 the EU is expecting more than 98 GW of offshore development. The market in Asia is expected to continue growing, especially in China, Taiwan, and Japan. Taiwan has plans to develop 3 GW of offshore wind by 2030 and Japan has plans to begin construction on projects totaling 504 MW around 2020 (8). Offshore wind will continue to expand its presence globally; untapped markets include Brazil, Africa, and the Middle East (17). Recent projects have expanded to Korea, France, and the Caribbean as well (13).
For offshore wind to succeed in the future, turbines and turbine blades will continue to get larger (26), there will need to be fewer substations with less cabling, and joint ventures with the supply chain to bring prices down (13). Costs are expected to decline, especially in the EU by 2040 as mentioned above (Appendix).
Conclusions Since the construction of the first turbines in 1991, the offshore wind industry has grown from its infancy into a “mature teenager” (13). With technology advancements, cost reductions, and policy measures, this industry has the potential to continue to on its current trajectory.
Based on the data in this analysis, the future of offshore wind has the potential to capitalize on the higher capacity, and more constant winds off the global shores. This can only occur if infrastructure can support these ventures, costs decrease, suppliers can work together to improve the supply chain, and universal transmission and storage options become more viable moving forward.

CE
RT
IFIC
AT
E I
N S
UST
AIN
AB
LE
SY
STE
MS
AN
AL
YSI
S
Appendix
1. Global Offshore Wind Locations and Installed Capacity (MW) Source: GWEC 2014
2. Major Wind Turbine Manufacturers in the EU. Source: EWEA 2014
Appendix (Continued)
3. Major Offshore Wind Turbine Manufacturers in China in 2013. Source: GWEC 2014
Manufacturers Number of Turbines
Installed Capacity (MW)
Market Share (%)
Sinovel 56 170 39.7 Goldwind 44 109.5 25.5 Siemens 21 49.98 11.7 United Power 22 39 9.1 CSIC 4 14 3.3 SHE 6 13.6 3.2 DEC 2 8 1.9 XEMC 2 7.5 1.7 Envision 3 7 1.6 Mingyang 3 6 1.4 Sanyi 2 4 0.9 Total 165 428.58 100
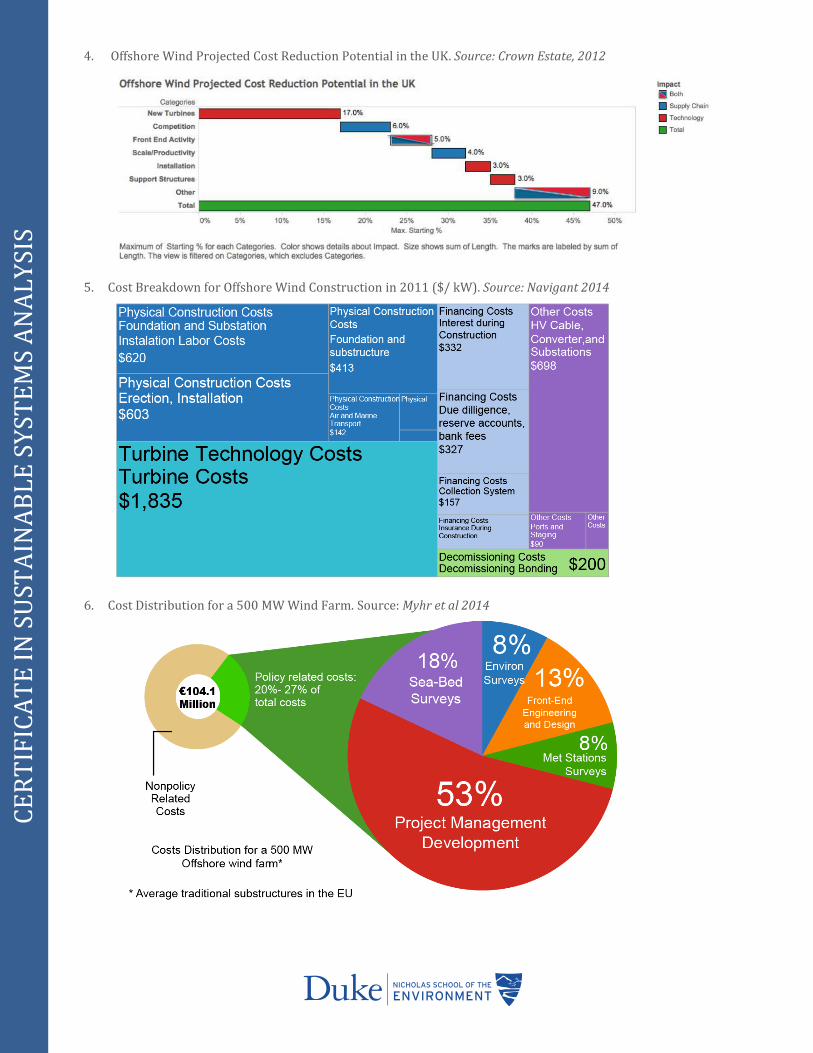
4. Offshore Wind Projected Cost Reduction Potential in the UK. Source: Crown Estate, 2012
5. Cost Breakdown for Offshore Wind Construction in 2011 ($/ kW). Source: Navigant 2014
6. Cost Distribution for a 500 MW Wind Farm. Source: Myhr et al 2014
CE
RT
IFIC
AT
E I
N S
UST
AIN
AB
LE
SY
STE
MS
AN
AL
YSI
S
CE
RT
IFIC
AT
E I
N S
UST
AIN
AB
LE
SY
STE
MS
AN
AL
YSI
S
References 1. BOEM. (n.d.). Offshore Wind Energy. Retrieved from http://www.boem.gov/renewable-energy-program/renewable- energy-guide/offshore-wind-`
energy.aspx
2. Global Wind Energy Council. (2014). Global Wind Report Annual Market Update 2013 (pp. 54–57). Retrieved from www.gwec.net
3. Global Wind Energy Council. (2011a). Global Wind Report Annual Market Update 2010 (pp. 38–39). Retrieved from www.gwec.net
4. Shanghai Donghai to Start Work on Offshore Wind Farm at Year End. (2013, June 20). Retrieved from http://www.bloomberg.com/news/articles/2013-06-20/shanghai-donghai-to-start-work-on-offshore-wind-farm-at-year-end
5. Global Wind Energy Council. (2011b). Global Wind Report Annual Market Update 2010 (p. 31). Retrieved from www.gwec.net
6. Global Wind Energy Council. (2012). Global Wind Report Annual Market Update 2011 (pp. 40–43). Retrieved from www.gwec.net
7. Offshore Statistics EWEA. (2015, January). Retrieved from http://www.ewea.org/statistics/offshore/
8. Global Wind Energy Council. (2015). Global Wind Report Annual Market Update 2014 (pp. 52–57). Retrieved from www.gwec.net
9. Robinson, Mike and Walt Musial.(2006). National Wind Technology Center National Renewable Energy Laboratory. “Offshore Wind Technology Overview.” Retrieved from http://www.nrel.gov/docs/gen/fy07/40462.pdf
10. Project of Offshore Wind Energy: Research, Experimentation, Development.(2015). Green Energy in Adriatic Sea. “Technological State of the Art.” Retrieved from http://www.powered-ipa.it/wp-content/uploads/2015/02/IPA-POWERED-WP3-ReportTask3.1-finalrelease-23feb15.pdf
11. Offshore Wind Energie. (N.A.) Federal Ministry for Economic Affairs and Energy of Germany. “Fundaments and foundation structures.” Retrieved from http://www.offshore-windenergie.net/en/information
12. EWEA. (2014). European Wind Energy Association. “The European offshore wind industry - key trends and statistics 2013”
13. Williams, D. (2015, April 10). Dick Williams, Shell Wind Technology, Interview.
14. PWC. (2011). Offshore proof Turning windpower promise into performance. Retrieved from http://www.pwc.com/en_GX/gx/utilities/publications/assets/offshore-windpower-turning-promise-into-performance.pdf
15. Johnson, Tim. (2015). Energy Tech. Lecture.
16. IEA. (2013). Medium-Term Renewable Energy Market Report 2013, OECD/IEA, Paris. Retrieved from http://www.iea.org/topics/renewables/subtopics/wind/
17. Frasier, C. (2015, April 6). Curtis Frasier, Former Shell North American Portfolio Director, Interview.
18. J. Green, A. Bowen, .J. Fingersh, and Y. Wan. (2007). Electrical Collection and Transmission Systems for Offshore Wind Power. NREL.
19. Offshore wind energy. (n.d.). Retrieved from http://www.thecrownestate.co.uk/energy-and-infrastructure/offshore-wind-energy/
20. Market for Decommissioning of offshore wind turbines worth billions. (2014, September 7). Retrieved from http://www.niras.com/current-events/news/2014/market-for-decommissioning-of-offshore-wind-turbines-worth-billions.aspx
21. UK government. (2013). Offshore Wind Industrial Strategy Summary Business and Government Action. Retrieved from https://www.gov.uk/government/uploads/system/uploads/attachment_data/file/226457/bis-13-1092ES-offshore-wind-industrial-strategy-summary.pdf
22. EEG-remuneration. (n.d.). Retrieved from http://www.offshore-windenergie.net/en/politics/eeg-remuneration
23. North Seas Countries’ Offshore Grid Initiative. (2014, September 3). Retrieved from http://www.benelux.int/nl/kernthemas/energie/nscogi-2012-report/
24. 3E, Senergy Econnect, SINTEF, dena, ForWind, IEO, NTUA. (2011). OffshoreGrid: Offshore Electricity Infrastructure in Europe. Retrieved from http://www.ewea.org/fileadmin/ewea_documents/documents/publications/reports/OffshoreGrid__report.pdf
25. Korsnes, M. (2014). China’s Offshore Wind Industry 2014. Centre for Sustainable Energy Studies. Retrieved from https://www.ntnu.no/documents/7414984/202064323/Offshore+Wind+in+China+2014.pdf/b0167dd4-6d47-40cc-9096-b3139c1459ef
26. Navigant. (2014). Offshore Wind Market and Economic Analysis. Retrieved from http://energy.gov/sites/prod/files/2014/08/f18/2014%20Navigant%20Offshore%20Wind%20Market%20&%20Economic%20Analysis.pdf
27. Anders Myhr , Catho Bjerkseter, Anders Ågotnes, Tor A. Nygaard. (2014). Levelised cost of energy for offshore floating wind turbines in a life cycle perspective. Renewable Energy, 66, 714–728.