Embed Size (px)
Citation preview
Research in Developmental Disabilities 34 (2013) 3361–3371
Contents lists available at SciVerse ScienceDirect
Research in Developmental Disabilities
The development of numerical magnitude processing and its
association with working memory in children with mildintellectual disabilitiesCarmen Brankaer *, Pol Ghesquiere, Bert De Smedt 1
Parenting and Special Education Research Unit, KU Leuven, Leopold Vanderkelenstraat 32, Box 3765, B-3000 Leuven, Belgium
A R T I C L E I N F O
Article history:
Received 3 May 2013
Received in revised form 1 July 2013
Accepted 1 July 2013
Available online 31 July 2013
Keywords:
Numerical magnitude representation
Working memory
Mild intellectual disability
Low math achievement
A B S T R A C T
The present research examined numerical magnitude processing and its association with
working memory in children with mild intellectual disabilities (MID). We investigated the
performance of 8-year-old children with MID on a symbolic (Arabic digits) and non-
symbolic (dot patterns) magnitude comparison task by means of a chronological-age/
ability-level-match design. We also examined whether the predicted problems with
numerical magnitude comparison could be explained by working memory by using three
working memory tasks. Findings revealed that children with MID performed more poorly
than their chronological age-matched peers on both the symbolic and non-symbolic
magnitude comparison tasks, suggesting impairments in these children’s ability to
represent numerical magnitudes. They also performed more poorly on working memory
compared to their typically developing age- and ability-matched peers, but when these
differences in working memory performance were additionally controlled for, the group
differences on the numerical magnitude comparison tasks remained. Both symbolic
numerical magnitude processing and central executive functioning predicted addition
performance in children with MID.
� 2013 Elsevier Ltd. All rights reserved.
1. Introduction
In our modern Western societies, numbers and mathematical abilities play a crucial role, for example when gettingchange in a shop or when reading timetables to catch a bus. Despite the fact that mathematics is interwoven with modernlife, 5% to 7% of the population experiences serious difficulties with the development of these mathematical skills(Butterworth, Varma, & Laurillard, 2011). One particular group of individuals that is expected to have mathematicaldifficulties are children with below-average intellectual abilities (e.g., Hoard, Geary, & Hamson, 1999; Janssen, De Boeck,Viaene, & Vallaeys, 1999). Of particular interest for research are the cognitive processes underlying these difficulties, becausethis knowledge provides a scientifically sound basis for appropriate remedial teaching and mathematics education. In thisrespect, it has been suggested that the ability to understand and process numerical magnitudes plays a crucial role in thedevelopment of mathematical skills (e.g., Butterworth et al., 2011; Gersten, Jordan, & Flojo, 2005). Therefore, a first goal ofthe present study was to investigate numerical magnitude processing and its development in children with mild intellectualdisabilities (MID). Because several studies also pointed to the importance of working memory, a more domain-general factor,
* Corresponding author. Tel.: +32 16 32 61 82.
E-mail addresses: [email protected] (C. Brankaer), [email protected] (B. De Smedt).1 Parenting and Special Education Research Unit, Leopold Vanderkelenstraat 32, Box 3765, B-3000 Leuven, Belgium. Tel.: +32 16 32 57 05;
fax: +32 16 32 59 33.
0891-4222/$ – see front matter � 2013 Elsevier Ltd. All rights reserved.
http://dx.doi.org/10.1016/j.ridd.2013.07.001
C. Brankaer et al. / Research in Developmental Disabilities 34 (2013) 3361–33713362
for the development of mathematics (e.g., De Smedt et al., 2009a; Friso-van den Bos, van der Ven, Kroesbergen, & van Luit,2013; Swanson & Kim, 2007) and mathematical difficulties (e.g., Swanson & Jerman, 2006), a second goal of the present studywas to additionally examine the role of working memory in numerical magnitude processing.
1.1. Numerical magnitude processing
The ability to understand and process numerical magnitude information emerges very early in development, as infants(Xu & Arriaga, 2007) and kindergarteners (Barth, Beckmann, & Spelke, 2008) are able to compare and add sets of non-symbolic objects or dots. Further, it has been suggested that over the course of development, children learn to link thesenon-symbolic magnitude representations with number words and Arabic digits (Griffin, 2003). Various studies havehighlighted the importance of numerical magnitude representations for successful mathematical development (e.g.,Butterworth et al., 2011, for a review). The ability to understand and represent numerical magnitudes seems to be related toand even predictive of mathematics achievement in typically developing children (Bugden & Ansari, 2011; De Smedt,Verschaffel, & Ghesquiere, 2009b; Halberda, Mazzocco, & Feigenson, 2008; Holloway & Ansari, 2009; Reigosa-Crespo et al.,2012). Furthermore, several studies have shown that children with mathematical difficulties experience problems withnumerical magnitude processing (De Smedt & Gilmore, 2011; Landerl, Bevan, & Butterworth, 2004; Mussolin, Mejias, &Noel, 2010).
Two explanations for these problems with numerical magnitude processing have been put forward. These problemsmight arise from a specific deficit in the innate ability to represent numerical magnitudes, as proposed by the defective
number module hypothesis (Butterworth, 2005). Another possibility is that these problems originate from impairments inaccessing numerical meaning from symbols, as suggested by the access deficit hypothesis (Rousselle & Noel, 2007). Todisentangle between both hypotheses, one needs to compare children’s performance on a symbolic (Arabic digits) and non-symbolic (dot patterns) numerical magnitude comparison task (Sekuler & Mierkiewicz, 1977), in which children have toindicate the numerically larger of two presented quantities. If children with mathematical difficulties perform more poorlythan typically developing children on both tasks, this favors the defective number module hypothesis. If, by contrast,children with mathematical difficulties perform more poorly than typically developing children on the symbolic, but not onthe non-symbolic magnitude comparison task, this supports the access deficit hypothesis. Although most of the existingbody of data indicates that children with mathematical difficulties show deficits in their ability to compare Arabic digits, dataon non-symbolic magnitude comparison tasks have been inconclusive so far (see De Smedt, Noel, Gilmore, & Ansari, in press;Noel & Rousselle, 2011 for an overview).
It is important to point out that this existing body of data only deals with children with mathematical disabilities and thatthese findings may therefore not be readily generalized to children with MID. Only but a few attempts have been made toexamine numerical magnitude comparison in children with a below-average intelligence or MID. Hoard et al. (1999)revealed that these children (MIQ = 78) were less accurate in comparing Arabic digits than their typically developing peers.However, only a symbolic magnitude comparison task was included in this study, which makes it impossible to determinewhether the children also had problems with non-symbolic magnitude comparison. More recently, Brankaer, Ghesquiere,and De Smedt (2011) investigated numerical magnitude processing in 10–11-year-old children with MID (MIQ = 62) moresystematically by comparing the performance of these children on both a symbolic and non-symbolic magnitudecomparison task with the performance of two control groups of typically developing children: One control group matched onchronological age to the children with MID and one control group matched on arithmetic achievement level to the childrenwith MID. Findings of this study demonstrated that children with MID performed more poorly than their chronological age-matched peers on both the symbolic and non-symbolic magnitude comparison tasks, although their difficulties on thesymbolic task were more pronounced.
It should be noted that the children in the study of Brankaer et al. (2011) were relatively old and already received someyears of (adapted) mathematics education. As Soltesz, Szucs and Szucs (2010) mentioned, the development of numericalmagnitude representation is supported and largely influenced by formal education and numerical enculturation. Therefore,it might be interesting to examine whether the results of Brankaer et al. (2011) can be replicated in younger children withMID, which was the aim of the present study.
1.2. Working memory
The present study also focused on working memory as a determinant of children with MID’s mathematicaldifficulties, because various studies in typically developing children and children with mathematical difficulties haveshown that this domain-general factor also plays an important role in, and even predicts, mathematics performance(Bull, Espy, & Wiebe, 2008; De Smedt et al., 2009a; Passolunghi & Siegel, 2004; Passolunghi, Vercelloni, & Schadee, 2007;Swanson & Kim, 2007). More specifically, because recent data pointed to an association between working memory andnumerical magnitude processing (Gullick, Sprute, & Temple, 2011; Passolunghi & Lanfranchi, 2012) and several studiesindicated working memory impairments in children with MID (e.g., Henry & MacLean, 2002; Schuchardt, Gebhardt, &Maehler, 2010; Van der Molen, Van Luit, Jongmans, & Van der Molen, 2009), we aimed to examine whether thepredicted difficulties with numerical magnitude comparison in children with MID could be explained by workingmemory.
C. Brankaer et al. / Research in Developmental Disabilities 34 (2013) 3361–3371 3363
The concept of working memory refers to a system that temporarily stores and manipulates information (Baddeley,2003). A widely used model of working memory is the multi-component model of Baddeley (1986, 2003), which has threemain components. A first component is the central executive, a system that controls and regulates complex cognitiveprocesses. This component is typically measured with complex span tasks, in which participants have to manipulate theinformation before they can replicate it. The other two components are called slave systems, and are only used for passiveinformation storage: the phonological loop stores verbal and auditory information while the visual-spatial sketchpad isresponsible for the storage of visual and spatial information. These two components are usually measured with simple spantasks, in which children have to repeat a series of phonological or visual-spatial items without manipulation. Both slavesystems are in direct contact with the central executive. All three working memory components of Baddeley’s model areassumed to play a role in mathematics performance, although task- and age-related differences with regard to thecontribution of the different components have been observed (Bull et al., 2008; De Smedt et al., 2009a; DeStefano & LeFevre,2004; Henry & MacLean, 2003).
Numerous studies have examined working memory in children with intellectual disabilities by using achronological-age/mental-age-match design (e.g., Henry & MacLean, 2002; Schuchardt et al., 2010; Van der Molenet al., 2009). There is converging evidence that children with MID experience problems with all components of workingmemory compared to their chronological age-matched peers (Schuchardt et al., 2010; Van der Molen et al., 2009). Theresults of comparisons between children with MID and mental age-matched children, however, have been lessclear, partly because various studies involved different populations, i.e., children differing in age and in degree ofintellectual disability, and used different tasks to measure working memory (Henry & MacLean, 2002; Schuchardt et al.,2010; Van der Molen et al., 2009). Nevertheless, the findings of these studies suggest that children with MIDhave problems with several components of working memory even when compared to their mental-age matchedpeers.
1.3. The present study
The aim of the present study was to examine numerical magnitude processing and its association with workingmemory in children with MID. Firstly, because the development of numerical magnitude representation is largelyinfluenced by formal education (Soltesz et al., 2010), we wanted to investigate whether the results of Brankaer et al.(2011) could be replicated in younger children with MID. It might be that difficulties in non-symbolic magnitudeprocessing were already compensated in older children with MID (see De Smedt & Gilmore, 2011 for a similar rationalein children with an average intelligence and mathematical difficulties). If this hypothesis is true, we expect largerdifferences in non-symbolic number representations in younger children with MID. Alternatively, Noel and Rousselle(2011) hypothesized that difficulties in non-symbolic magnitude processing result from a basic dysfunction in thebuilding process of an exact representation of symbolic numbers. This developmental perspective was, however, basedon developmental data from children with dyscalculia and can therefore not be easily generalized to children with MID.Nevertheless, if the hypothesis of Noel and Rousselle (2011) is true, and if children with MID would follow the samedevelopmental trajectory as children with dyscalculia, we particularly expect differences on the symbolic magnitudecomparison task and smaller differences on the non-symbolic task in younger children with MID. To investigate thesetwo possibilities, we systematically assessed symbolic and non-symbolic magnitude comparison in 8-year-old childrenwith MID. Additionally, in line with Brankaer et al. (2011), we tried to examine whether the development of magnituderepresentation in children with MID simply lags behind that of typically developing individuals (delay hypothesis) orwhether the development of children with MID is marked by deficits in specific cognitive processes, which makes thegeneral principles of development not applicable (deficit hypothesis) (Bennett-Gates & Zigler, 1998). This was done bycomparing the performance of children with MID with the performance of two control groups of typically developingchildren: one group matched on chronological age to the children with MID and one group matched on arithmeticachievement level to the children with MID. If the performance of children with MID differs from the performance ofchronological age matched children but not from the performance of arithmetic achievement matched children, thantheir development is marked by a delay. If, by contrast, their performance differs from the performance of both controlgroups, then their development is marked by a deficit. Based on the results of Brankaer et al. (2011), who suggested thatthe development of numerical magnitude representation in children with MID is marked by a delay, we hypothesizedthat the performance of our participants with MID would differ from the performance of their chronological agematched peers, but not from younger children with the same arithmetic achievement level. Because children’s reactiontime on the numerical magnitude comparison tasks might be influenced by their general processing speed, we alsoassessed a motor reaction time task to control for this variable in our analyses.
Secondly, against the background of the found associations between working memory and numerical magnitudeprocessing (Gullick et al., 2011; Passolunghi & Lanfranchi, 2012) and the working memory impairments in children withMID (e.g., Henry & MacLean, 2002; Schuchardt et al., 2010, Van der Molen et al., 2009), we also aimed to unravelwhether the predicted problems with numerical magnitude comparison in children with MID could be explainedby working memory. Additionally, we tried to examine the association between working memory, numerical magnitudeprocessing and arithmetical ability in more detail, an issue that has not been examined so far in children withMID.
C. Brankaer et al. / Research in Developmental Disabilities 34 (2013) 3361–33713364
2. Method
2.1. Participants
Participants with MID were selected from four special education schools that are specifically organized for childrenwith MID. Control children were recruited from six mainstream primary schools. Parental consent was obtained for 294children, who all completed a standardized arithmetic test (de Vos, 1992) to determine their arithmetic achievementlevel.
Because all children with MID needed a clinical diagnosis of MID and an attest that reports on their intelligence to getenrolled in special education schools for MID, intelligence scores for children with MID were retrieved from their schoolrecords. The following three standardized intelligence tests were administered as measures of intellectual ability: (1)the Dutch version of the Wechsler Preschool and Primary Scale of Intelligence—Revised (WPPSI-RNL; Vander Steene &Bos, 1997), (2) the Dutch version of the Wechsler Intelligence Scale for Children—Third Edition (WISC-IIINL; Kort et al.,2005), or (3) Snijders-Oomen Nonverbal Intelligence Test Revised (SON-R 2.5-7; Tellegen, Winkel, Wijnberg-Williams, &Laros (1998)). All intelligence tests were administered by specifically trained school psychologists. Againstthe background of the DSM-IV-TR criteria for defining mild intellectual disabilities (American Psychiatric andAssociation (APA), 2000), only children with an IQ between 55 and 75 were included in the group of children withMID. Moreover, we excluded children with known genetic syndromes that are associated with mathematical difficulties(i.e., Williams–Beuren syndrome, Velo-cardio-facial syndrome, Turner syndrome, Down syndrome and Fragile Xsyndrome).
All control children completed the Raven’s standard progressive matrices (Raven, Court, & Raven, 1992) as a measure ofintellectual ability to verify if they had average intellectual ability (i.e. between 85 and 115). None of them had adevelopmental disorder and none of them had repeated grade. Two control groups were selected: one group matched onchronological age to the children with MID (CA-group) and one group matched on arithmetic achievement level to thechildren with MID (AL-group).
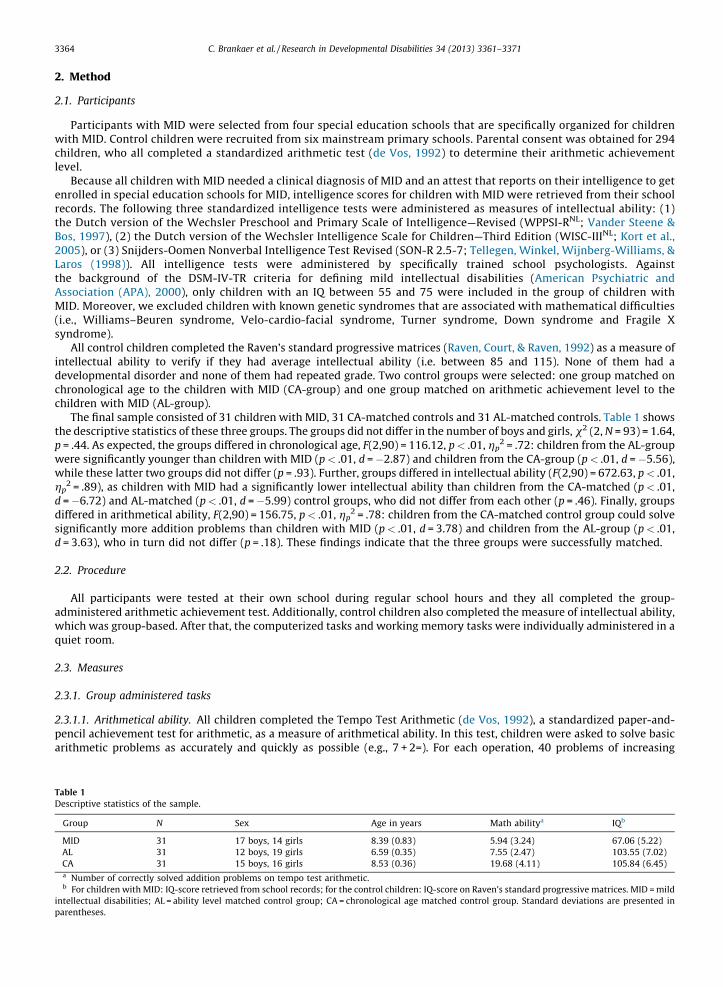
The final sample consisted of 31 children with MID, 31 CA-matched controls and 31 AL-matched controls. Table 1 showsthe descriptive statistics of these three groups. The groups did not differ in the number of boys and girls, x2 (2, N = 93) = 1.64,p = .44. As expected, the groups differed in chronological age, F(2,90) = 116.12, p < .01, hp
2 = .72: children from the AL-groupwere significantly younger than children with MID (p < .01, d = �2.87) and children from the CA-group (p < .01, d = �5.56),while these latter two groups did not differ (p = .93). Further, groups differed in intellectual ability (F(2,90) = 672.63, p < .01,hp
2 = .89), as children with MID had a significantly lower intellectual ability than children from the CA-matched (p < .01,d = �6.72) and AL-matched (p < .01, d = �5.99) control groups, who did not differ from each other (p = .46). Finally, groupsdiffered in arithmetical ability, F(2,90) = 156.75, p < .01, hp
2 = .78: children from the CA-matched control group could solvesignificantly more addition problems than children with MID (p < .01, d = 3.78) and children from the AL-group (p < .01,d = 3.63), who in turn did not differ (p = .18). These findings indicate that the three groups were successfully matched.
2.2. Procedure
All participants were tested at their own school during regular school hours and they all completed the group-administered arithmetic achievement test. Additionally, control children also completed the measure of intellectual ability,which was group-based. After that, the computerized tasks and working memory tasks were individually administered in aquiet room.
2.3. Measures
2.3.1. Group administered tasks
2.3.1.1. Arithmetical ability. All children completed the Tempo Test Arithmetic (de Vos, 1992), a standardized paper-and-pencil achievement test for arithmetic, as a measure of arithmetical ability. In this test, children were asked to solve basicarithmetic problems as accurately and quickly as possible (e.g., 7 + 2=). For each operation, 40 problems of increasing
Table 1
Descriptive statistics of the sample.
Group N Sex Age in years Math abilitya IQb
MID 31 17 boys, 14 girls 8.39 (0.83) 5.94 (3.24) 67.06 (5.22)
AL 31 12 boys, 19 girls 6.59 (0.35) 7.55 (2.47) 103.55 (7.02)
CA 31 15 boys, 16 girls 8.53 (0.36) 19.68 (4.11) 105.84 (6.45)a Number of correctly solved addition problems on tempo test arithmetic.b For children with MID: IQ-score retrieved from school records; for the control children: IQ-score on Raven’s standard progressive matrices. MID = mild
intellectual disabilities; AL = ability level matched control group; CA = chronological age matched control group. Standard deviations are presented in
parentheses.
C. Brankaer et al. / Research in Developmental Disabilities 34 (2013) 3361–3371 3365
difficulty were presented and children were required to solve as many problems as possible within a 1 min period. In thisstudy, only the addition problems were presented, as the children with MID did not yet receive enough instruction in otheroperations. The score on this test was the number of correctly solved problems within the time limit of 1 min.
2.3.1.2. Intellectual ability. Raven’s standard progressive matrices (Raven et al., 1992) was used to verify that all controlchildren had average intellectual ability. For each child in the CA- and AL-group, a standardized score (M = 100; SD = 15) wascalculated.
2.3.2. Computerized tasks
The computerized tasks were presented using the E-prime 2.0 software (Schneider, Eschmann, & Zuccolotto, 2002)and were all administered using a 15 inch laptop. Children were instructed to perform both accurately and quickly.Stimuli occurred in white on a black background in Arial font (size 72). Each trial started with a 250 ms fixation cross inthe centre of the computer screen. After 1000 ms the stimuli appeared and remained visible until response, except forthe non-symbolic magnitude comparison task where the stimuli disappeared after 840 ms, in order to avoid counting.Each trial was initiated by the experimenter by means of a control key. In these computer tasks, participants had torespond by pressing a key on a computer keyboard that was put in front of the laptop and was connected to it. The leftresponse key, labeled with a blue sticker, was d; the right response key, labeled with a yellow sticker, was k. Each taskwas preceded by three practice trials to familiarize the child with the key assignments. Answers and reaction timeswere recorded by the laptop.
2.3.2.1. Symbolic magnitude comparison. A classic numerical magnitude comparison task (Sekuler & Mierkiewicz, 1977) wasadministered. In this task, children had to indicate the numerically larger of two simultaneously presented Arabic digits, onedisplayed on the left and one displayed on the right side of the computer screen. Stimuli involved all combinations of thedigits 1 to 9, yielding 72 trials. Children had to answer by pressing the response key on the side of the larger digit. Theposition of the largest digit was counterbalanced.
2.3.2.2. Non-symbolic magnitude comparison. Children had to indicate the larger of two simultaneously presented dot arrays,one displayed on the left and one displayed on the right side of the computer screen. Stimuli comprised the samenumerosities as in the symbolic magnitude comparison task, yielding 72 trials. The stimuli were generated by means of theMATLAB script provided by Piazza, Izard, Pinel, Le Bihan and Dehaene (2004) and were controlled for non-numericalparameters, i.e., individual dot size, total occupied area, and density. This was done to reduce the likelihood that childrenwould rely on these non-numerical cues or perceptual features to make a correct decision. Similar to the symbolic magnitudecomparison task, children had to select the larger numerosity by pressing the response key on the side of the largernumerosity. The position of the largest numerosity was counterbalanced.
2.3.2.3. Control task: Motor reaction time. This task was included as a control for children’s response speed on the keyboard.Two figures appeared on the screen. One of them was coloured white and the child had to press as soon as possible on theside of this white figure. Twenty experimental trials were presented.
2.3.3. Working memory
2.3.3.1. Phonological loop. In the Digit Span Forward task a series of digits between 1 and 9 was presented acoustically. Theseseries were recorded to standardize the assessment. Children had to repeat the digits immediately in the presented order.There were three trials for each span length (from two to nine digits). The first two trials were taken from the WechslerIntelligence Scale for Children—3rd Edition (WISC-III) (Wechsler, 1992) and the third trial was taken from the WorkingMemory Test Battery for Children (WMTB-C) (Pickering & Gathercole, 2001). When the child failed three successive trials ofthe same length, testing on this task was terminated.
2.3.3.2. Visual-spatial sketchpad. In the Corsi Block task, the experimenter tapped out a sequence on a board with nine blocks.Children had to repeat this sequence in the same order. The task started with a sequence of two blocks, and gradually becamemore difficult (from two to nine blocks, with three trials for each span length). When the child failed two trials of the samelength, testing on this test was terminated.
2.3.3.3. Central executive. The Digit Span Backward task was similar to the Digit Span Forward task, both for construction andadministration, except that children had to repeat the sequence of auditory presented digits between 1 and 9 in the reverseorder. Testing on this task was terminated when the child failed two trials of the same length.
2.4. Statistical analyses
Group differences were evaluated by means of ANOVA. All post-hoc t-tests were Bonferroni corrected. Partial eta-squaredand Cohen’s d were calculated as measures of effect size.
C. Brankaer et al. / Research in Developmental Disabilities 34 (2013) 3361–33713366
3. Results
3.1. Control task
Before we turn to the results on the numerical magnitude comparison tasks, performance on the motor reaction task wasexamined. Accuracy on this task was very high and at ceiling (MID: 97%, AL: 96% and CA: 98%). With respect to children’sresponse speed, group differences were found by means of a one-way ANOVA, F(2,90) = 16.11, p < .01, hp
2 = .26: CA-matchedchildren (M = 445.56 ms, SD = 51.91) were significantly faster than children with MID (M = 625.31 ms, SD = 189.47; p < .01,d = �1.32) and AL-matched children (M = 591.02 ms, SD = 118.28; p < .01, d = �1.61), whereas the latter two groups did notdiffer from each other, p = .93. These differences were considered in subsequent analyses.
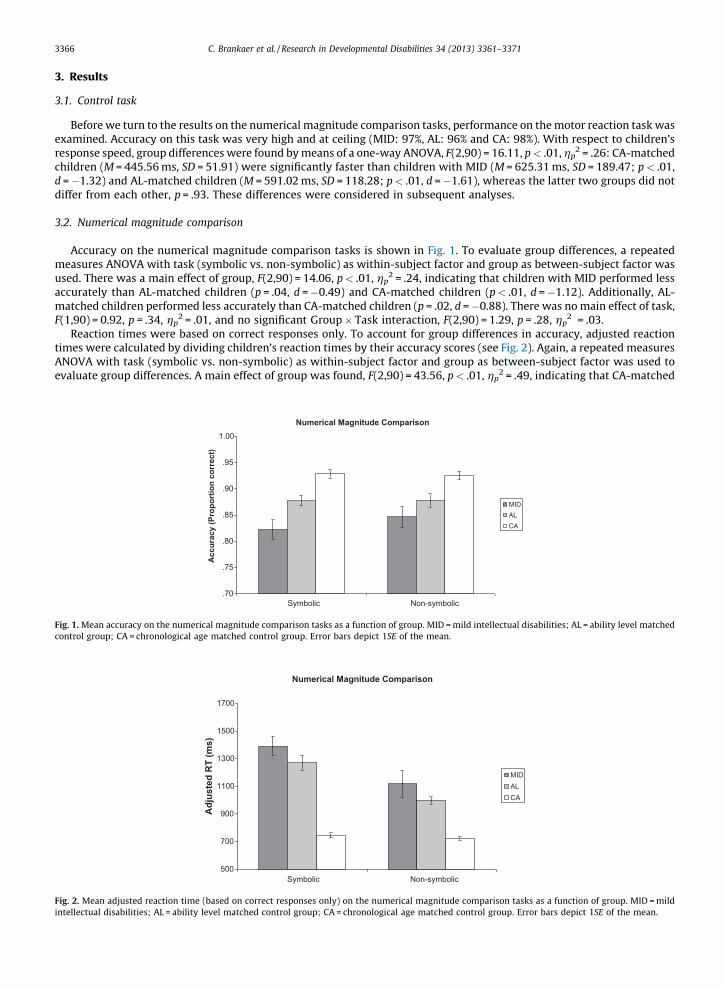
3.2. Numerical magnitude comparison
Accuracy on the numerical magnitude comparison tasks is shown in Fig. 1. To evaluate group differences, a repeatedmeasures ANOVA with task (symbolic vs. non-symbolic) as within-subject factor and group as between-subject factor wasused. There was a main effect of group, F(2,90) = 14.06, p < .01, hp
2 = .24, indicating that children with MID performed lessaccurately than AL-matched children (p = .04, d = �0.49) and CA-matched children (p < .01, d = �1.12). Additionally, AL-matched children performed less accurately than CA-matched children (p = .02, d = �0.88). There was no main effect of task,F(1,90) = 0.92, p = .34, hp
2 = .01, and no significant Group � Task interaction, F(2,90) = 1.29, p = .28, hp2 = .03.
Reaction times were based on correct responses only. To account for group differences in accuracy, adjusted reactiontimes were calculated by dividing children’s reaction times by their accuracy scores (see Fig. 2). Again, a repeated measuresANOVA with task (symbolic vs. non-symbolic) as within-subject factor and group as between-subject factor was used toevaluate group differences. A main effect of group was found, F(2,90) = 43.56, p < .01, hp
2 = .49, indicating that CA-matched
Numerical Magnitude Comparison
500
700
900
1100
1300
1500
1700
Symbolic Non-symbolic
Adj
uste
d R
T (m
s)
MIDALCA
Fig. 2. Mean adjusted reaction time (based on correct responses only) on the numerical magnitude comparison tasks as a function of group. MID = mild
intellectual disabilities; AL = ability level matched control group; CA = chronological age matched control group. Error bars depict 1SE of the mean.
Numerical Magnitude Comparison
.70
.75
.80
.85
.90
.95
1.00
Symbolic Non-symbolic
Acc
urac
y (P
ropo
rtio
n co
rrec
t)
MIDALCA
Fig. 1. Mean accuracy on the numerical magnitude comparison tasks as a function of group. MID = mild intellectual disabilities; AL = ability level matched
control group; CA = chronological age matched control group. Error bars depict 1SE of the mean.
Working memory
0
2
4
6
8
10
12
Digit span forward Corsi block Digit span backward
Acc
urac
y (n
umbe
r of c
orre
ctly
reca
lled
item
s)
MIDALCA
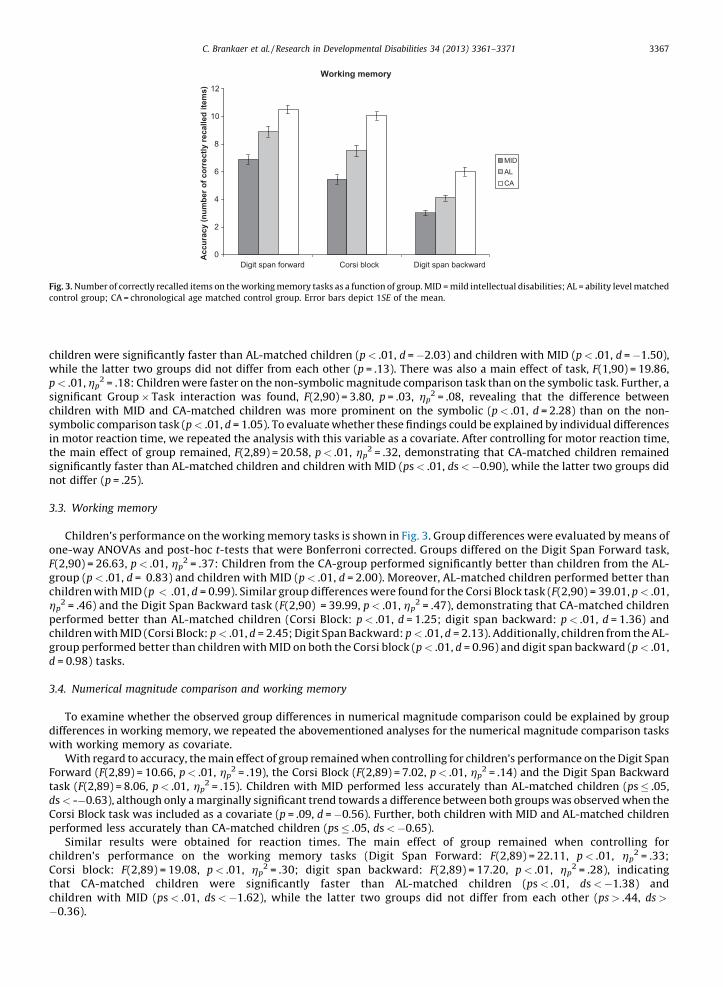
Fig. 3. Number of correctly recalled items on the working memory tasks as a function of group. MID = mild intellectual disabilities; AL = ability level matched
control group; CA = chronological age matched control group. Error bars depict 1SE of the mean.
C. Brankaer et al. / Research in Developmental Disabilities 34 (2013) 3361–3371 3367
children were significantly faster than AL-matched children (p < .01, d = �2.03) and children with MID (p < .01, d = �1.50),while the latter two groups did not differ from each other (p = .13). There was also a main effect of task, F(1,90) = 19.86,p < .01, hp
2 = .18: Children were faster on the non-symbolic magnitude comparison task than on the symbolic task. Further, asignificant Group � Task interaction was found, F(2,90) = 3.80, p = .03, hp
2 = .08, revealing that the difference betweenchildren with MID and CA-matched children was more prominent on the symbolic (p < .01, d = 2.28) than on the non-symbolic comparison task (p < .01, d = 1.05). To evaluate whether these findings could be explained by individual differencesin motor reaction time, we repeated the analysis with this variable as a covariate. After controlling for motor reaction time,the main effect of group remained, F(2,89) = 20.58, p < .01, hp
2 = .32, demonstrating that CA-matched children remainedsignificantly faster than AL-matched children and children with MID (ps < .01, ds < �0.90), while the latter two groups didnot differ (p = .25).
3.3. Working memory
Children’s performance on the working memory tasks is shown in Fig. 3. Group differences were evaluated by means ofone-way ANOVAs and post-hoc t-tests that were Bonferroni corrected. Groups differed on the Digit Span Forward task,F(2,90) = 26.63, p < .01, hp
2 = .37: Children from the CA-group performed significantly better than children from the AL-group (p < .01, d = 0.83) and children with MID (p < .01, d = 2.00). Moreover, AL-matched children performed better thanchildren with MID (p < .01, d = 0.99). Similar group differences were found for the Corsi Block task (F(2,90) = 39.01, p < .01,hp
2 = .46) and the Digit Span Backward task (F(2,90) = 39.99, p < .01, hp2 = .47), demonstrating that CA-matched children
performed better than AL-matched children (Corsi Block: p < .01, d = 1.25; digit span backward: p < .01, d = 1.36) andchildren with MID (Corsi Block: p < .01, d = 2.45; Digit Span Backward: p < .01, d = 2.13). Additionally, children from the AL-group performed better than children with MID on both the Corsi block (p < .01, d = 0.96) and digit span backward (p < .01,d = 0.98) tasks.
3.4. Numerical magnitude comparison and working memory
To examine whether the observed group differences in numerical magnitude comparison could be explained by groupdifferences in working memory, we repeated the abovementioned analyses for the numerical magnitude comparison taskswith working memory as covariate.
With regard to accuracy, the main effect of group remained when controlling for children’s performance on the Digit SpanForward (F(2,89) = 10.66, p < .01, hp
2 = .19), the Corsi Block (F(2,89) = 7.02, p < .01, hp2 = .14) and the Digit Span Backward
task (F(2,89) = 8.06, p < .01, hp2 = .15). Children with MID performed less accurately than AL-matched children (ps � .05,
ds < -�0.63), although only a marginally significant trend towards a difference between both groups was observed when theCorsi Block task was included as a covariate (p = .09, d = �0.56). Further, both children with MID and AL-matched childrenperformed less accurately than CA-matched children (ps � .05, ds < �0.65).
Similar results were obtained for reaction times. The main effect of group remained when controlling forchildren’s performance on the working memory tasks (Digit Span Forward: F(2,89) = 22.11, p < .01, hp
2 = .33;Corsi block: F(2,89) = 19.08, p < .01, hp
2 = .30; digit span backward: F(2,89) = 17.20, p < .01, hp2 = .28), indicating
that CA-matched children were significantly faster than AL-matched children (ps < .01, ds < �1.38) andchildren with MID (ps < .01, ds < �1.62), while the latter two groups did not differ from each other (ps > .44, ds >
�0.36).
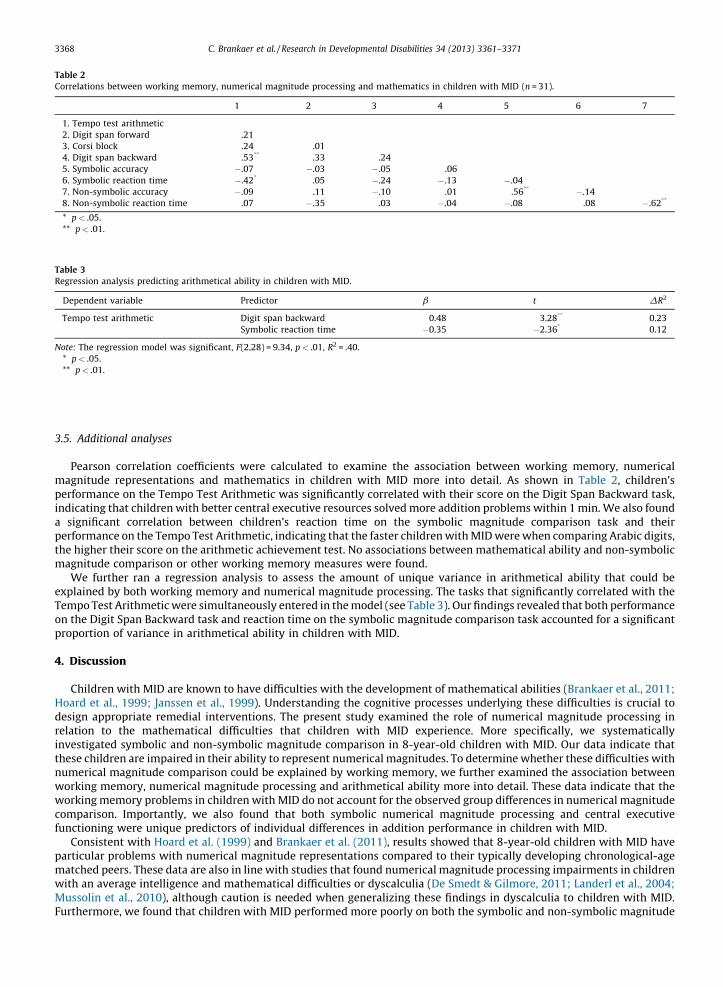
Table 2
Correlations between working memory, numerical magnitude processing and mathematics in children with MID (n = 31).
1 2 3 4 5 6 7
1. Tempo test arithmetic
2. Digit span forward .21
3. Corsi block .24 .01
4. Digit span backward .53** .33 .24
5. Symbolic accuracy �.07 �.03 �.05 .06
6. Symbolic reaction time �.42* .05 �.24 �.13 �.04
7. Non-symbolic accuracy �.09 .11 �.10 .01 .56** �.14
8. Non-symbolic reaction time .07 �.35 .03 �.04 �.08 .08 �.62**
* p < .05.
** p < .01.
Table 3
Regression analysis predicting arithmetical ability in children with MID.
Dependent variable Predictor b t DR2
Tempo test arithmetic Digit span backward 0.48 3.28** 0.23
Symbolic reaction time �0.35 �2.36* 0.12
Note: The regression model was significant, F(2,28) = 9.34, p < .01, R2 = .40.
* p < .05.
** p < .01.
C. Brankaer et al. / Research in Developmental Disabilities 34 (2013) 3361–33713368
3.5. Additional analyses
Pearson correlation coefficients were calculated to examine the association between working memory, numericalmagnitude representations and mathematics in children with MID more into detail. As shown in Table 2, children’sperformance on the Tempo Test Arithmetic was significantly correlated with their score on the Digit Span Backward task,indicating that children with better central executive resources solved more addition problems within 1 min. We also founda significant correlation between children’s reaction time on the symbolic magnitude comparison task and theirperformance on the Tempo Test Arithmetic, indicating that the faster children with MID were when comparing Arabic digits,the higher their score on the arithmetic achievement test. No associations between mathematical ability and non-symbolicmagnitude comparison or other working memory measures were found.
We further ran a regression analysis to assess the amount of unique variance in arithmetical ability that could beexplained by both working memory and numerical magnitude processing. The tasks that significantly correlated with theTempo Test Arithmetic were simultaneously entered in the model (see Table 3). Our findings revealed that both performanceon the Digit Span Backward task and reaction time on the symbolic magnitude comparison task accounted for a significantproportion of variance in arithmetical ability in children with MID.
4. Discussion
Children with MID are known to have difficulties with the development of mathematical abilities (Brankaer et al., 2011;Hoard et al., 1999; Janssen et al., 1999). Understanding the cognitive processes underlying these difficulties is crucial todesign appropriate remedial interventions. The present study examined the role of numerical magnitude processing inrelation to the mathematical difficulties that children with MID experience. More specifically, we systematicallyinvestigated symbolic and non-symbolic magnitude comparison in 8-year-old children with MID. Our data indicate thatthese children are impaired in their ability to represent numerical magnitudes. To determine whether these difficulties withnumerical magnitude comparison could be explained by working memory, we further examined the association betweenworking memory, numerical magnitude processing and arithmetical ability more into detail. These data indicate that theworking memory problems in children with MID do not account for the observed group differences in numerical magnitudecomparison. Importantly, we also found that both symbolic numerical magnitude processing and central executivefunctioning were unique predictors of individual differences in addition performance in children with MID.
Consistent with Hoard et al. (1999) and Brankaer et al. (2011), results showed that 8-year-old children with MID haveparticular problems with numerical magnitude representations compared to their typically developing chronological-agematched peers. These data are also in line with studies that found numerical magnitude processing impairments in childrenwith an average intelligence and mathematical difficulties or dyscalculia (De Smedt & Gilmore, 2011; Landerl et al., 2004;Mussolin et al., 2010), although caution is needed when generalizing these findings in dyscalculia to children with MID.Furthermore, we found that children with MID performed more poorly on both the symbolic and non-symbolic magnitude
C. Brankaer et al. / Research in Developmental Disabilities 34 (2013) 3361–3371 3369
comparison task, consistent with the defective number module hypothesis. The reaction time data, however, revealed thatthe group differences were most prominent on the symbolic magnitude comparison task. These findings are similar to thoseof Brankaer et al. (2011) and suggest that children with MID also have particular problems in accessing numerical meaningfrom symbols.
The present study used a chronological-age/ability-level-match design to further unravel whether the development ofmagnitude representation in children with MID was marked by a delay or a deficit. Results were not easy to interpret becausechildren with MID performed less accurately but equally fast as children from the AL-group on the numerical magnitudecomparison tasks. However, because Brankaer et al. (2011) found that older children with MID performed as accurately astheir AL-matched peers, it seems that the general development of magnitude representation in children with MID is delayed,but not fundamentally different from that of typically developing individuals.
Can the problems with numerical magnitude representation in children with MID be explained by their poor workingmemory abilities? To answer this question, we additionally investigated working memory skills in our sample. Children withMID performed more poorly than children from the CA- and AL-group on all three working memory tasks, suggesting deficitsin the central executive, the visual-spatial sketchpad and the phonological loop. These results are partially in line with Vander Molen et al. (2009), who found that children with MID performed more poorly than their mental-age-matched peers onthe Digit Span Backward and Corsi Block task. Regarding the Digit Span Forward task, however, Van der Molen et al. (2009)found no significant differences between the performance of children with MID and their mental-age-matched peers.Further, Schuchardt et al. (2010) found no group differences on the Digit Span Backward and Corsi Block task whencomparing the performance of children with MID and children from the mental-age matched group. It is crucial to note thatin the current study, control children were matched on arithmetic achievement level rather than mental age, which isdifferent from the working memory studies in MID reported above. This was done because children’s numerical processingskills are supported and largely influenced by formal mathematics education (Soltesz et al., 2010). Therefore, a matchingbased on arithmetic achievement level seemed most appropriate when focusing on numerical magnitude processing. It isimportant to emphasize that this matching procedure limits the comparability of the current findings with previous workingmemory studies in children with MID. Future studies should therefore replicate the current research by using a control groupthat is matched on mental age rather than mathematics achievement level.
The working memory impairments in children with MID could, however, not explain the observed difficulties withnumerical magnitude processing, as the group differences on the numerical magnitude comparison tasks remained whenworking memory was additionally controlled for. Moreover, the regression analysis indicates that both children’s symbolicmagnitude comparison skills and central executive resources are uniquely related to their performance on an arithmeticachievement test. These findings are, on the one hand, in accordance with studies that showed that working memory isassociated with mathematics achievement (Bull et al., 2008; De Smedt et al., 2009a; Passolunghi & Siegel, 2004; Passolunghiet al., 2007; Swanson & Kim, 2007) and, on the other hand, consistent with studies that highlighted the importance ofsymbolic numerical magnitude processing for the development of mathematical abilities (De Smedt et al., 2009b; De Smedt& Gilmore, 2011; Holloway & Ansari, 2009; Landerl et al., 2004; Rousselle & Noel, 2007). Additionally, the present findingssupport previous studies in typically developing children that found that both working memory and numerical magnituderepresentations are uniquely related to the development of mathematics (Geary, Hoard, Nugent, & Bailey, 2012; Passolunghi& Lanfranchi, 2012) and indicate that these findings can be generalized to children with MID.
An important limitation of the present study is that it was cross-sectional in nature, i.e., we tried to replicate the findingsof Brankaer et al. (2011) in 8-year-old children with MID to gain insight into the developmental process of numericalmagnitude representation in children with MID. A longitudinal design, in which one cohort is followed over time, would bemore appropriate to obtain information about children’s individual development. Moreover, a longitudinal design wouldallow us to determine whether the numerical processing skills of children with MID can actually predict their latermathematical abilities (see De Smedt et al., 2009b for a similar rationale).
The current findings have important implications for the screening and (remedial) mathematics education of childrenwith MID. Firstly, our data indicate that symbolic numerical magnitude processing and central executive functioning arerelated to mathematics achievement within the group of children with MID, suggesting that children with lower magnitudeprocessing skills or lower working memory capacities are most at risk for mathematical difficulties. Therefore, it might beuseful to develop screening tools to identify these at-risk children at an early age. An example of a potential screeninginstrument that focuses on children’s numerical magnitude representations is ‘The Number Sets Test’ (Geary, Bailey, & Hoard,2009), although the utility of this instrument for predicting mathematics achievement in children with MID still needs to beevaluated.
Secondly, because children with MID already have problems with numerical magnitude processing at the start of formalmathematics education, interventions should foster the development of numerical magnitude representations from an earlyage. Moreover, because these children seem to have particular problems with symbolic magnitude representations and arelation between their symbolic processing skills and mathematics achievement was found, interventions should not onlyfocus on the development of magnitude representations per se, but they should also provide plenty of opportunities wherechildren with MID learn to connect symbols and the quantities they represent. These interventions could be presented ingame-like formats, such as linear numerical board games (e.g., Ramani & Siegler, 2011). Board games could enhancechildren’s understanding of numerical symbols because they provide multiple cues to the connection between symbols andtheir quantities. For instance, the larger the numerical symbol in a square of the board game, the larger the number of
C. Brankaer et al. / Research in Developmental Disabilities 34 (2013) 3361–33713370
movements of the token a child has made and the larger the number of number words a child has heard and said (Siegler,2009). There also exist computerized intervention programs that focus on the association of numerical symbols with theirnumerical meaning (Kucian et al., 2011; Wilson, Revkin, Cohen, Cohen, & Dehaene, 2006). For future research, it might beinteresting to evaluate the effect of these games in children with MID.
Against the background of the working memory problems in children with MID, it might be worthwhile to exploretraining programs that target working memory (e.g., Melby-Lervag & Hulme, 2013, for a review). Most of these trainingprograms focused on typically developing children and children with ADHD or learning disabilities, although Van der Molen,Van luit, Van der Molen, Klugkist, and Jongmans (2010) developed a computerized working memory training specifically foradolescents with mild to borderline intellectual disabilities. While several training programs seemed to have short-termeffects on children’s working memory capacity, the generalization of working memory training to other skills, such asarithmetic, remains to be rather limited (Melby-Lervag & Hulme, 2013), although Van der Molen et al. (2010) showed that aworking memory training in adolescents led to higher scores in arithmetic at the follow-up test after the interventioncompared to the control condition. Future research should therefore test whether such generalization effects also occur inprimary school children with MID.
Acknowledgements
We would like to thank all participating children, parents and teachers. This study was supported by the Marguerite-Marie Delacroix Support Fund.
References
American Psychiatric and Association. (2000). Diagnostic and statistical manual of mental disorders (4th ed.). Washington, DC: American Psychiatric Associationtext revision.
Baddeley, A. D. (1986). Working memory. New York: Clarendon.Baddeley, A. (2003). Working memory: looking back and looking forward. Nature Reviews Neuroscience, 4, 829–839.Barth, H., Beckmann, L., & Spelke, E. S. (2008). Nonsymbolic, approximate arithmetic in children: abstract addition prior to instruction. Developmental Psychology,
44, 1466–1477.Bennett-Gates, D., & Zigler, E. (1998). Resolving the developmental-difference debate: an evaluation of the triarchic and systems theory models. In J. A. Burack, R.
M. Hodapp, & E. Zigler (Eds.), Handbook of mental retardation and development (pp. 115–131). Cambridge, UK: Cambridge University Press.Brankaer, C., Ghesquiere, P., & De Smedt, B. (2011). Numerical magnitude processing in children with mild intellectual disabilities. Research in Developmental
Disabilities, 32, 2853–2859.Bugden, S., & Ansari, D. (2011). Individual differences in children’s mathematical competence are related to the intentional but not automatic processing of Arabic
numerals. Cognition, 118, 32–44.Bull, R., Espy, K. A., & Wiebe, S. A. (2008). Short-term memory, working memory and executive functioning in preschoolers: longitudinal predictors of
mathematical achievement at age 7 years. Developmental Neuropsychology, 33, 205–228.Butterworth, B. (2005). Developmental dyscalculia. In J. I. D. Campbell (Ed.), Handbook of mathematical cognition (pp. 455–467). Hove: Psychology Press.Butterworth, B., Varma, S., & Laurillard, D. (2011). Dyscalculia: from brain to education. Science, 332, 1049–1053.De Smedt, B., & Gilmore, C. K. (2011). Defective number module or impaired access? Numerical magnitude processing in first graders with mathematical
difficulties. Journal of Experimental Child Psychology, 108, 278–292.De Smedt, B., Janssen, R., Bouwens, K., Verschaffel, L., Boets, B., & Ghesquiere, P. (2009). Working memory and individual differences in mathematics achievement:
a longitudinal study from first grade to second grade. Journal of Experimental Child Psychology, 103, 186–201.De Smedt, B., Noel, M. P., Gilmore, C., & Ansari, D. (in press). The relationship between symbolic and non-symbolic numerical magnitude processing and the typical
and atypical development of mathematics: evidence from brain and behavior. Trends in Neuroscience and Education.De Smedt, B., Verschaffel, L., & Ghesquiere, P. (2009). The predictive value of numerical magnitude comparison for individual differences in mathematics
achievement. Journal of Experimental Child Psychology, 103, 469–479.DeStefano, D., & LeFevre, J.-A. (2004). The role of working memory in mental arithmetic. European Journal of Cognitive Psychology, 16, 353–386.de Vos, T. (1992). Tempo-Test-Rekenen. Test voor het vaststellen van het rekenvaardigheidsniveau der elementaire bewerkingen (automatisering) voor het basis- en
voortgezet onderwijs. Handleiding. Nijmegem: Berkhout.Friso-van den Bos, I., van der Ven, S. H. G., Kroesbergen, E. H., & van Luit, J. E. H. (2013). Working memory and mathematics in primary school children: a meta-
analysis. Educational research review, 10, 29–44.Geary, D. C., Bailey, D. H., & Hoard, M. K. (2009). Predicting mathematical achievement and mathematical learning disability with a simple screening tool: the
number sets test. Journal of Psychoeducational Assessment, 27, 265–279.Geary, D. C., Hoard, M. K., Nugent, L., & Bailey, D. H. (2012). Mathematical cognition deficits in children with learning disabilities and persistent low achievement: a
five-year prospective study. Journal of Educational Psychology, 104, 206–223.Gersten, R., Jordan, N. C., & Flojo, J. R. (2005). Early identification and interventions for students with mathematics difficulties. Journal of Learning Disabilities, 38,
293–304.Griffin, S. (2003). The development of math competence in the preschool and early school years: cognitive foundations and instructional strategies. In J. M. Royer
(Ed.), Mathematical cognition (pp. 1–32). Connecticut: Information Age Publishing.Gullick, M. M., Sprute, L. A., & Temple, E. (2011). Individual differences in working memory, nonverbal IQ, and mathematics achievement and brain mechanisms
associated with symbolic and nonsymbolic number processing. Learning and Individual Differences, 21, 644–654.Halberda, J., Mazzocco, M. M. M., & Feigenson, L. (2008). Individual differences in non-verbal number acuity correlate with maths achievement. Nature, 455, 665–
668.Henry, L., & MacLean, M. (2002). Working memory performance in children with and without intellectual disabilities. American journal of Mental Retardation, 107,
421–432.Henry, L., & MacLean, M. (2003). Relationships between working memory, expressive vocabulary and arithmetical reasoning in children with and without
intellectual disabilities. Educational and Child Psychology, 20, 51–63.Hoard, M. K., Geary, D. C., & Hamson, C. O. (1999). Numerical and arithmetical cognition: performance of low- and average-IQ children. Mathematical Cognition, 5,
65–94.Holloway, I. D., & Ansari, D. (2009). Mapping numerical magnitudes onto symbols: the numerical distance effect and individual differences in children’s
mathematics achievement. Journal of Experimental Child Psychology, 103, 17–29.Janssen, R., De Boeck, P., Viaene, M., & Vallaeys, L. (1999). Simple mental addition in children with and without mild mental retardation. Journal of Experimental
Child Psychology, 74, 261–281.
C. Brankaer et al. / Research in Developmental Disabilities 34 (2013) 3361–3371 3371
Kort, W., Schittekatte, M., Bosmans, M., Compaan, E. L., Dekker, P. H., Vermeir, G., & Verhaeghe, P. (2005). Wechsler intelligence scale for children (3rd ed.).Amsterdam: NIP (Dutch version).
Kucian, K., Grond, U., Rotzer, S., Henzi, B., Schonmann, C., Plangger, F., Galli, M., Martin, E., & von Aster, M. (2011). Mental number line training in children withdevelopmental dyscalculia. Neuroimage, 57, 782–795.
Landerl, K., Bevan, A., & Butterworth, B. (2004). Developmental dyscalculia and basic numerical capacities: a study of 8–9-year-old students. Cognition, 93, 99–125.Melby-Lervag, M., & Hulme, C. (2013). Is working memory training effective? A meta-analytic review. Developmental Psychology, 49, 270–291.Mussolin, C., Mejias, S., & Noel, M. P. (2010). Symbolic and nonsymbolic number comparison in children with and without dyscalculia. Cognition, 115, 10–25.Noel, M. P., & Rousselle, L. (2011). Developmental changes in the profiles of dyscalculia: an explanation based on a double exact-and-approximate number
representation model. Frontiers in Human Neuroscience, 5, 165.Passolunghi, M. C., & Lanfranchi, S. (2012). Domain-specific and domain-general precursors of mathematical achievement: a longitudinal study from kindergarten
to first grade. British Journal of Educational Psychology, 82, 42–63.Passolunghi, M. C., & Siegel, L. S. (2004). Working memory and access to numerical information in children with disability in mathematics. Experimental Child
psychology, 88, 348–367.Passolunghi, M. C., Vercelloni, B., & Schadee, H. (2007). The precursors of mathematics learning: working memory, phonological ability and numerical
competence. Cognitive Development, 22, 165–184.Piazza, M., Izard, V., Pinel, P., Le Bihan, D., & Dehaene, S. (2004). Tuning curves for approximate numerosity in the human intraparietal sulcus. Neuron, 44, 547–555.Pickering, S., & Gathercole, S. (2001). Working memory test battery for children (WMTB-C). London: Psychological Corporation.Ramani, G. B., & Siegler, R. S. (2011). Reducing the gap in numerical knowledge between low- and middle-income preschoolers. Journal of Applied Developmental
Psychology, 32, 146–159.Raven, J. C., Court, J. H., & Raven, J. (1992). Standard progressive matrices. Oxford, UK: Oxford Psychologists Press.Reigosa-Crespo, V., Valdes-Sosa, M., Butterworth, B., Estevez, N., Rodrıguez, M., Santos, E., & Lage, A. (2012). Basic numerical capacities and prevalence of
developmental dyscalculia: the Havana survey. Developmental Psychology, 48, 123–135.Rousselle, L., & Noel, M. P. (2007). Basic numerical skills in children with mathematics learning disabilities: a comparison of symbolic vs. non-symbolic number
magnitude processing. Cognition, 102, 361–395.Schneider, W., Eschmann, A., & Zuccolotto, A. (2002). E-prime reference guide. Pittsburgh, PA: Psychology Software Tools.Schuchardt, K., Gebhardt, M., & Maehler, C. (2010). Working memory functions in children with different degrees of intellectual disability. Journal of Intellectual
Disability Research, 54, 346–353.Sekuler, R., & Mierkiewicz, D. (1977). Children’s judgments of numerical inequality. Child Development, 48, 630–633.Siegler, R. S. (2009). Improving the numerical understanding of children from low-income families. Child Development Perspectives, 3, 118–124.Soltesz, F., Szucs, D., & Szucs, L. (2010). Relationships between magnitude representation, counting and memory in 4- to 7-year-old children: a developmental
study. Behavioral and Brain Functions, 6, 13.Swanson, H. L., & Jerman, O. (2006). Math disabilities: A selective meta-analysis of the literature. Review of Educational Research, 76, 249–274.Swanson, L., & Kim, K. (2007). Working memory, short-term memory, and naming speed as predictors of children’s mathematical performance. Intelligence, 35,
151–168.Tellegen, P. J., Winkel, M., Wijnberg-Williams, B. J., & Laros, J. (1998). Snijders-Oomen nonverbal intelligence test, SON-R 2. 5-7. Manual & research report. Lisse:
Swets and Zeitlinger.Van der Molen, M. J., Van Luit, J. E. H., Jongmans, M. J., & Van der Molen, M. W. (2009). Memory profiles in children with mild intellectual disabilities: strengths and
weaknesses. Research in Developmental Disabilities, 30, 1237–1247.Van der Molen, M. J., Van luit, J. E. H., Van der Molen, M. W., Klugkist, I., & Jongmans, M. J. (2010). Effectiveness of a computerised working memory training in
adolescents with mild to borderline intellectual disabilities. Journal of Intellectual Disability Research, 54, 433–447.Vander Steene, G., & Bos, A. (1997). Wechsler preschool and primary scale of intelligence—revised, Flemish-Dutch version. Lisse: Swets & Zeitlinger.Wechsler, D. (1992). Wechsler intelligence scale for children—3rd UK edition (WISC-III UK). London: Psychological Corporation.Wilson, A. J., Revkin, S. K., Cohen, D., Cohen, L., & Dehaene, S. (2006). An open trial assessment of the number race, an adaptive computer game for remediation of
dyscalculia. Behavioral and Brain Functions, 2(20), 1–16.Xu, F., & Arriaga, R. I. (2007). Number discrimination in 10-month-old infants. British Journal of Developmental Psychology, 25, 103–108.