Embed Size (px)
Citation preview
The Development of Novel Contrast Agents
Robert E. Lenkinski PhD Department of Radiology
Bench Meets Bedside
Topics
Non-targeted agents Activatable agents Targeted and responsive agents
Non Targeted Contrast Agents
• FDA approved agents are widely used clinically in CT and MRI
• Micro-bubbles are less widely used in US
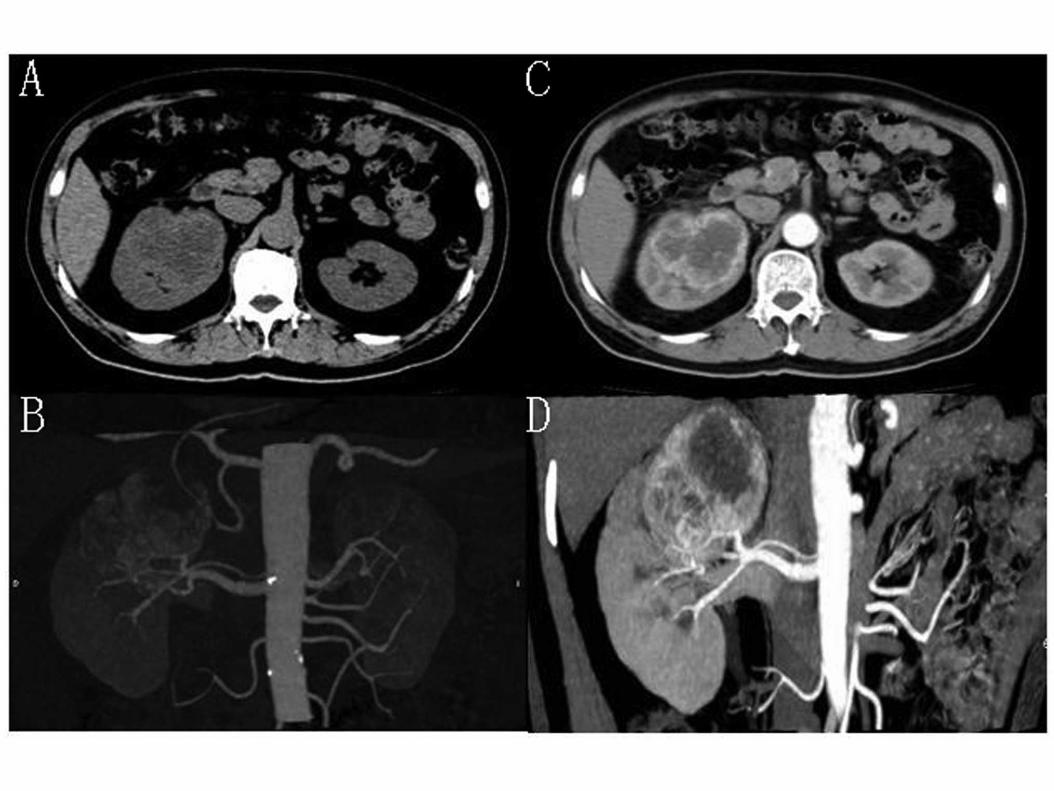
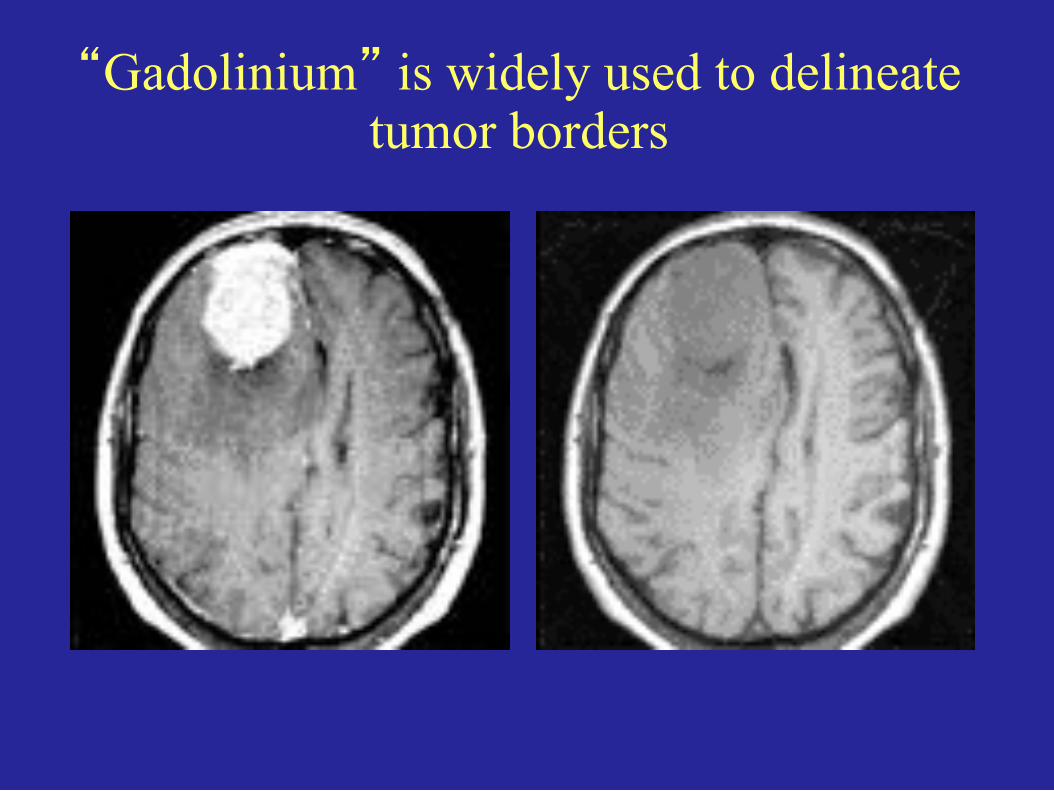
“Gadolinium” is widely used to delineate tumor borders
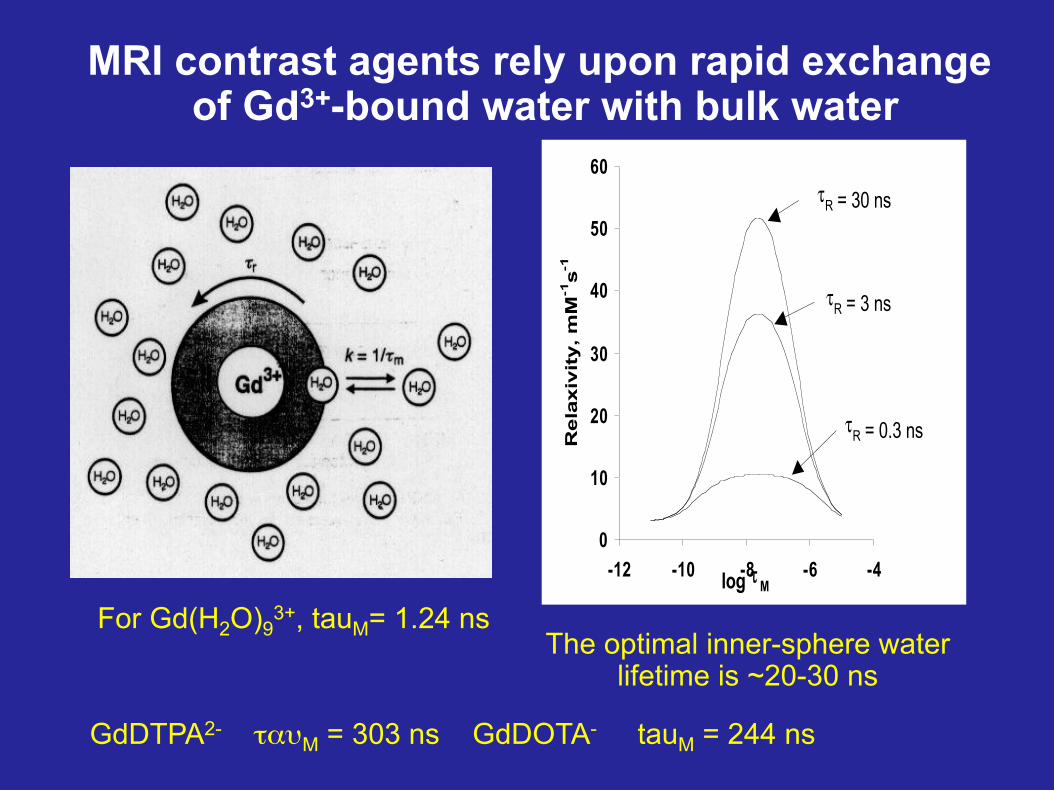
For Gd(H2O)93+, tauM= 1.24 ns
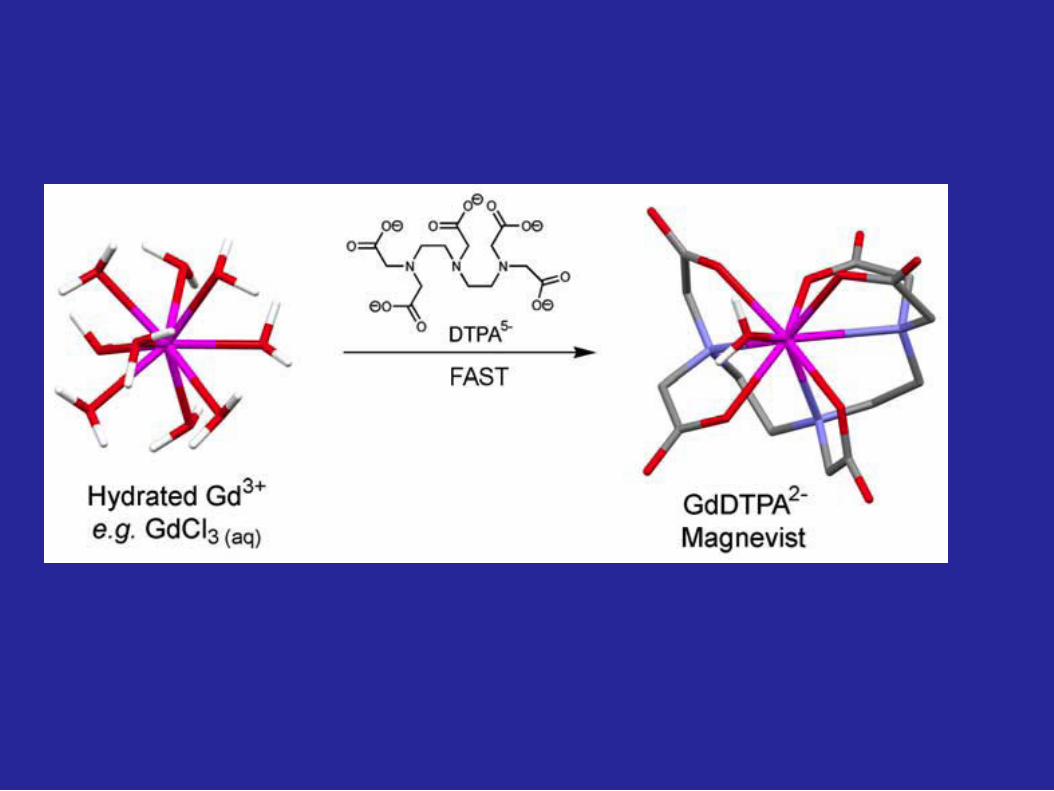
GdDTPA2- ταυM = 303 ns GdDOTA- tauM = 244 ns
MRI contrast agents rely upon rapid exchange of Gd3+-bound water with bulk water
0
10
20
30
40
50
60
-12 -10 -8 -6 -4log τMR
ela
xiv
ity, m
M-1
s-1
τR = 0.3 ns
τR = 30 ns
τR = 3 ns
The optimal inner-sphere water lifetime is ~20-30 ns
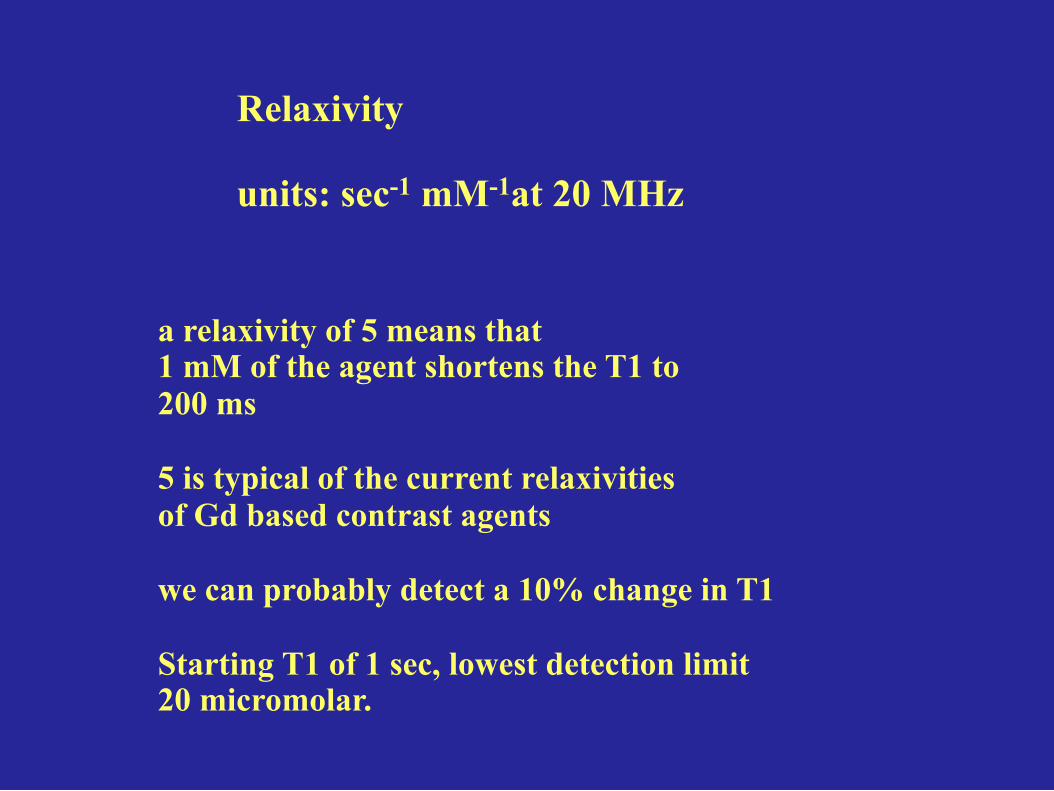
Relaxivity units: sec-1 mM-1at 20 MHz
a relaxivity of 5 means that 1 mM of the agent shortens the T1 to 200 ms 5 is typical of the current relaxivities of Gd based contrast agents we can probably detect a 10% change in T1 Starting T1 of 1 sec, lowest detection limit 20 micromolar.
Activatable agents Optical (fluorescence)
MRI/MRS based agents

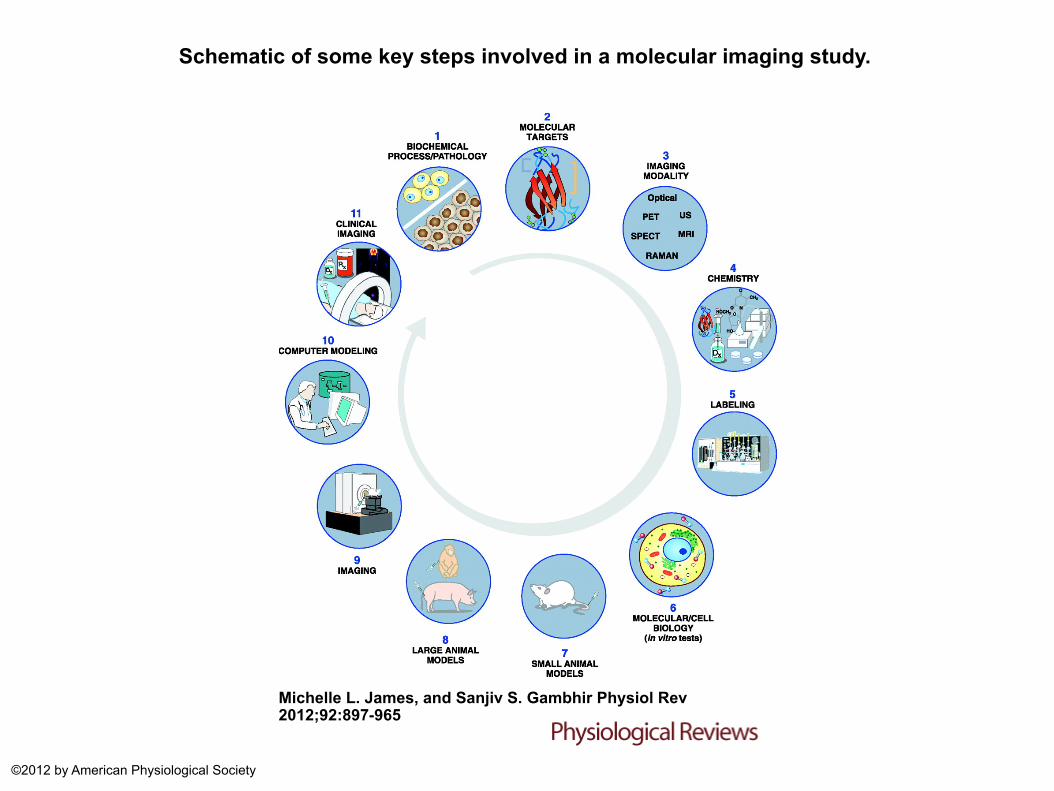
Schematic of some key steps involved in a molecular imaging study.
Michelle L. James, and Sanjiv S. Gambhir Physiol Rev 2012;92:897-965
©2012 by American Physiological Society
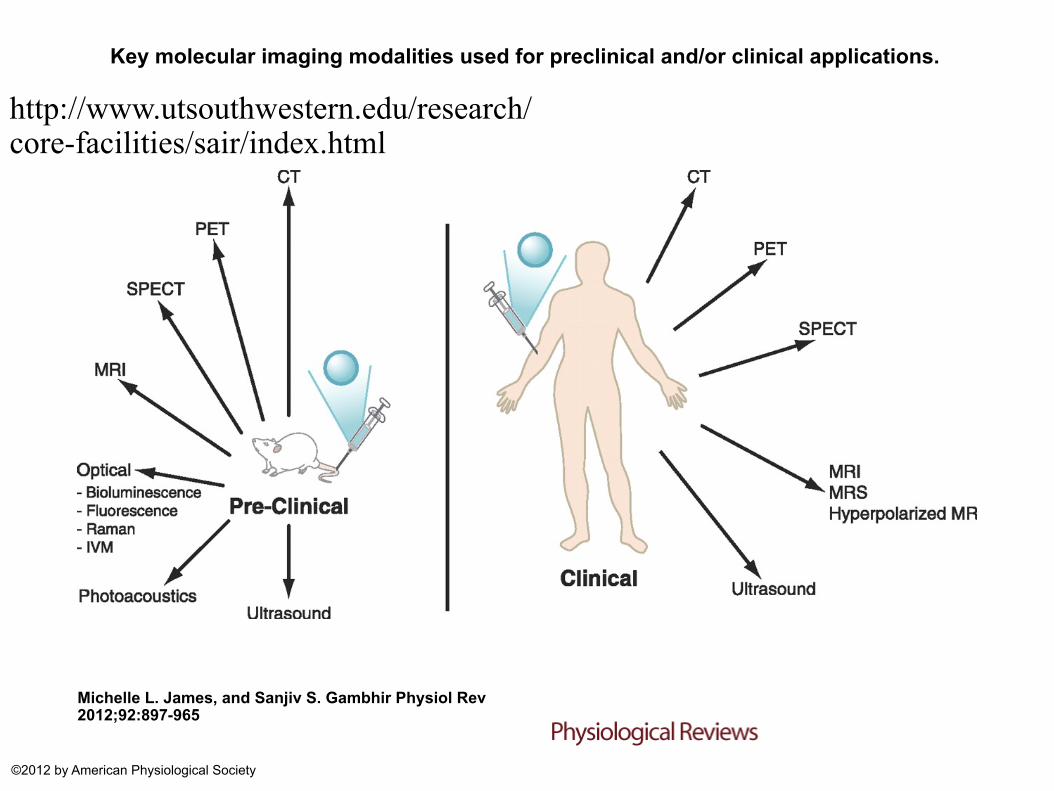
Key molecular imaging modalities used for preclinical and/or clinical applications.
Michelle L. James, and Sanjiv S. Gambhir Physiol Rev 2012;92:897-965
©2012 by American Physiological Society
http://www.utsouthwestern.edu/research/ core-facilities/sair/index.html
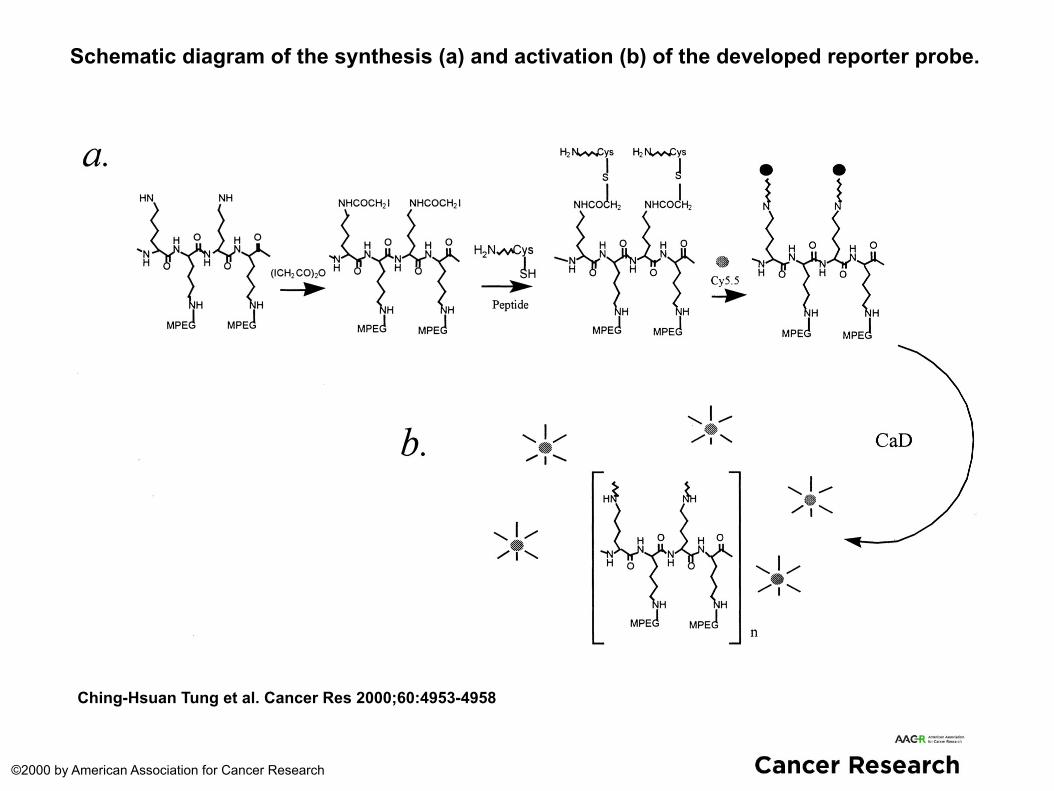
Schematic diagram of the synthesis (a) and activation (b) of the developed reporter probe.
Ching-Hsuan Tung et al. Cancer Res 2000;60:4953-4958
©2000 by American Association for Cancer Research
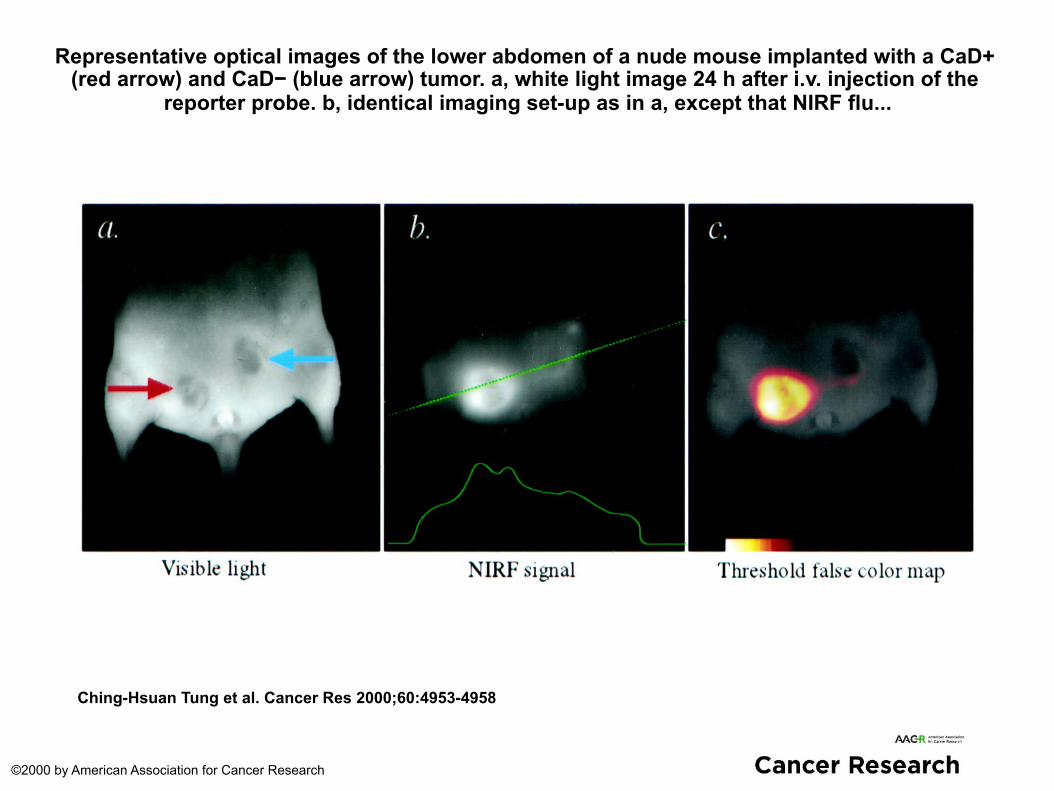
Representative optical images of the lower abdomen of a nude mouse implanted with a CaD+ (red arrow) and CaD− (blue arrow) tumor. a, white light image 24 h after i.v. injection of the
reporter probe. b, identical imaging set-up as in a, except that NIRF flu...
Ching-Hsuan Tung et al. Cancer Res 2000;60:4953-4958
©2000 by American Association for Cancer Research
Robert E. Lenkinski , John V. Frangioni, and Elena Vinogradov
Departments of Radiology and Medicine Beth Israel Deaconess Medical Center
Harvard Medical School
Contrast Agent Development for the Visualization of Micro-
calcifications
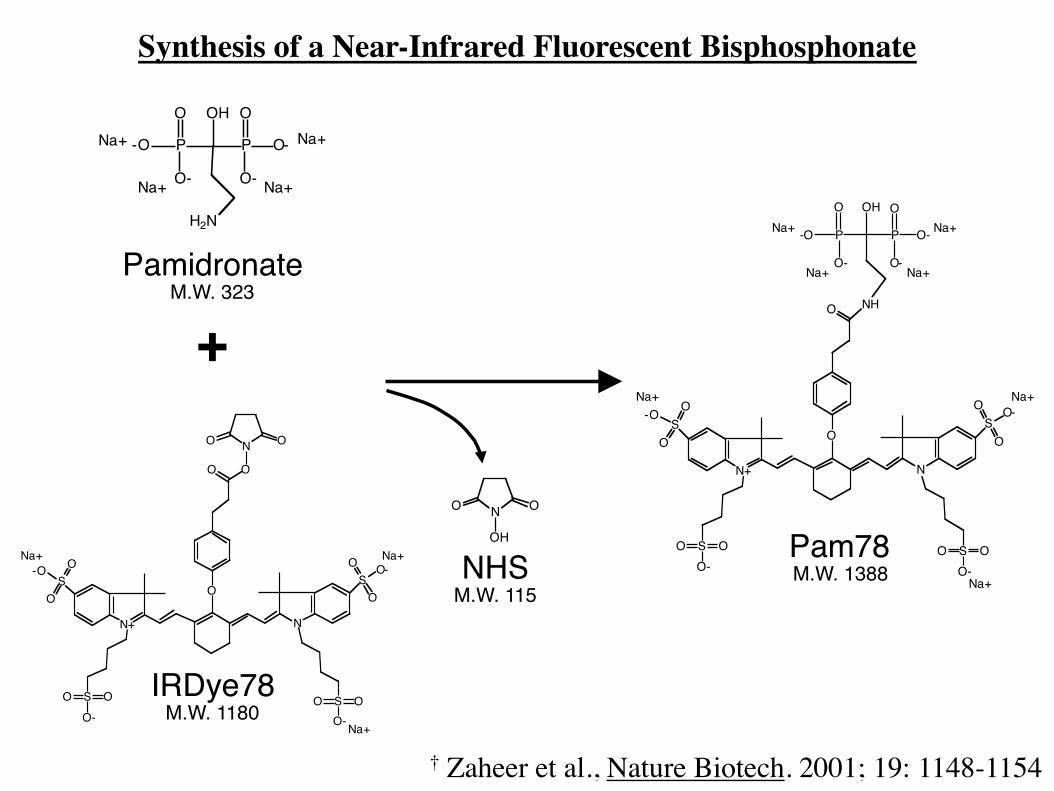
+
IRDye78M.W. 1180
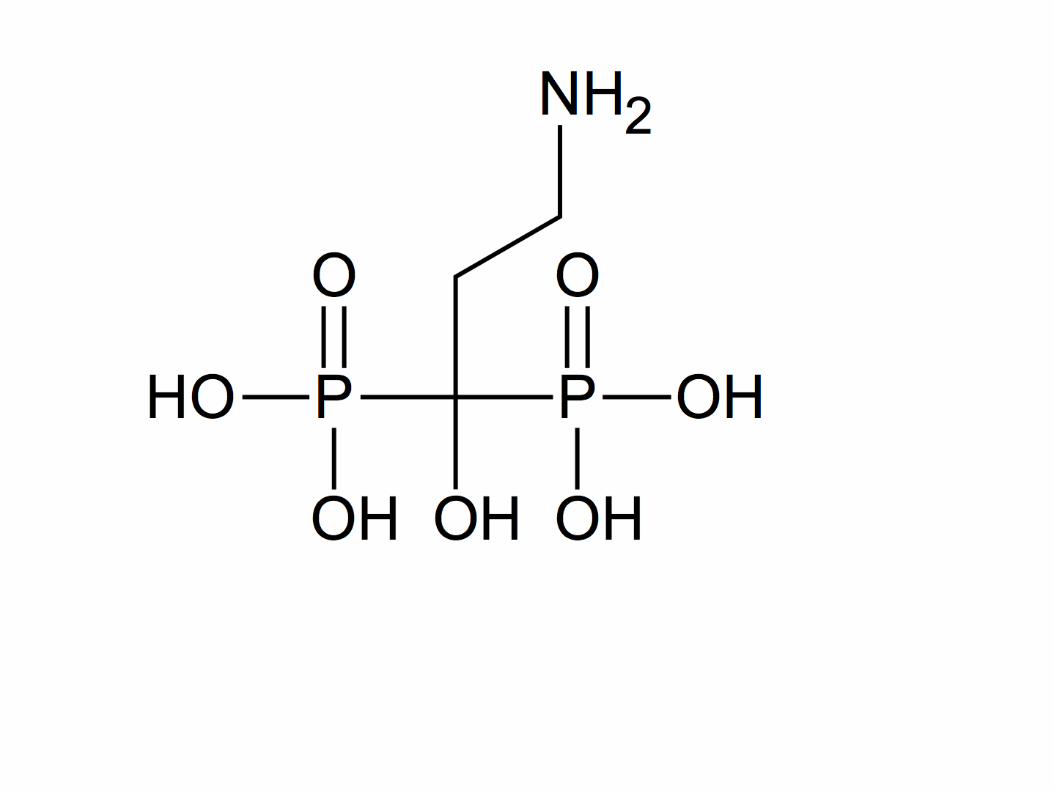
PamidronateM.W. 323
H2N
P
OH O
O-
O-P
O
O-
-ONa+ Na+
Na+ Na+
O ON
OH
Na+
SO
O-O
S OOO-
O
O
SO OO-
N+
SO
O O-
N
NH
P
OH O
O-
O-P
O
O-
-O
Na+
Na+
Na+ Na+
Na+ Na+
NHSM.W. 115
Na+
O ON
SO
O-O
S OOO-
O
O O
SO OO-
N+
SO
O O-
N
Na+
Na+
Pam78M.W. 1388
Synthesis of a Near-Infrared Fluorescent Bisphosphonate
† Zaheer et al., Nature Biotech. 2001; 19: 1148-1154
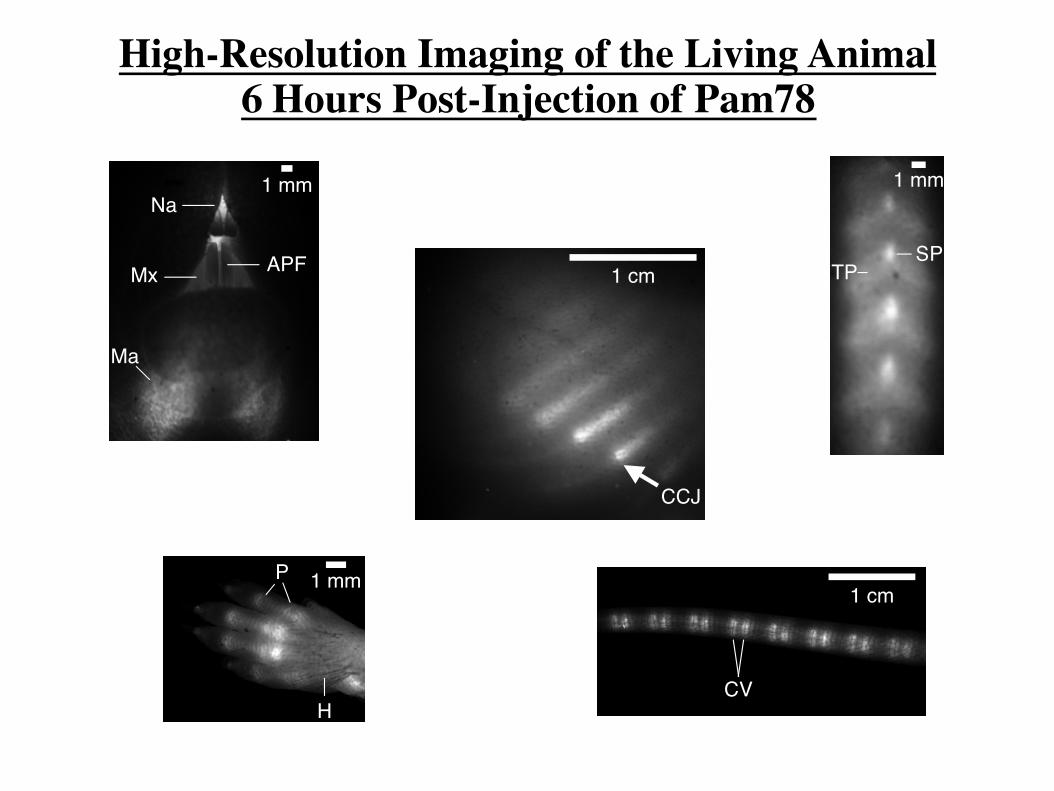
1 mmNa
Ma
Mx APF 1 cm
CCJ
1 mm
SPTP
1 mmP
H
1 cm
CV
High-Resolution Imaging of the Living Animal 6 Hours Post-Injection of Pam78
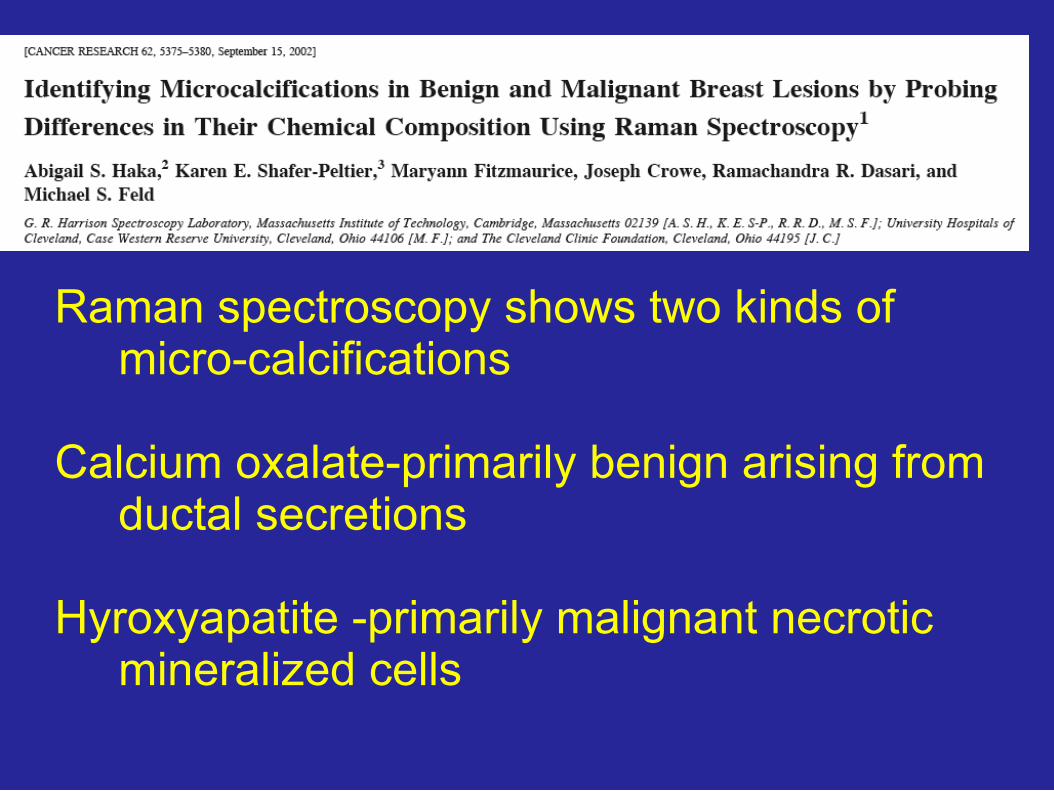
Raman spectroscopy shows two kinds of micro-calcifications
Calcium oxalate-primarily benign arising from
ductal secretions Hyroxyapatite -primarily malignant necrotic
mineralized cells
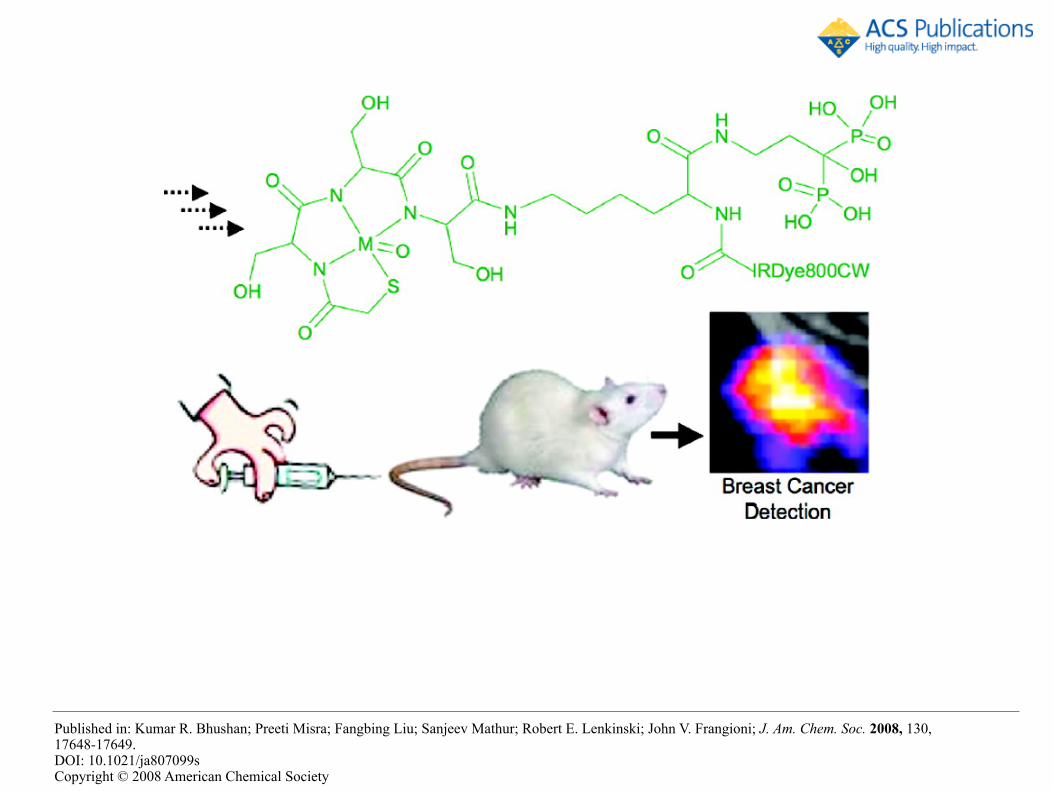
Published in: Kumar R. Bhushan; Preeti Misra; Fangbing Liu; Sanjeev Mathur; Robert E. Lenkinski; John V. Frangioni; J. Am. Chem. Soc. 2008, 130, 17648-17649. DOI: 10.1021/ja807099s Copyright © 2008 American Chemical Society
\
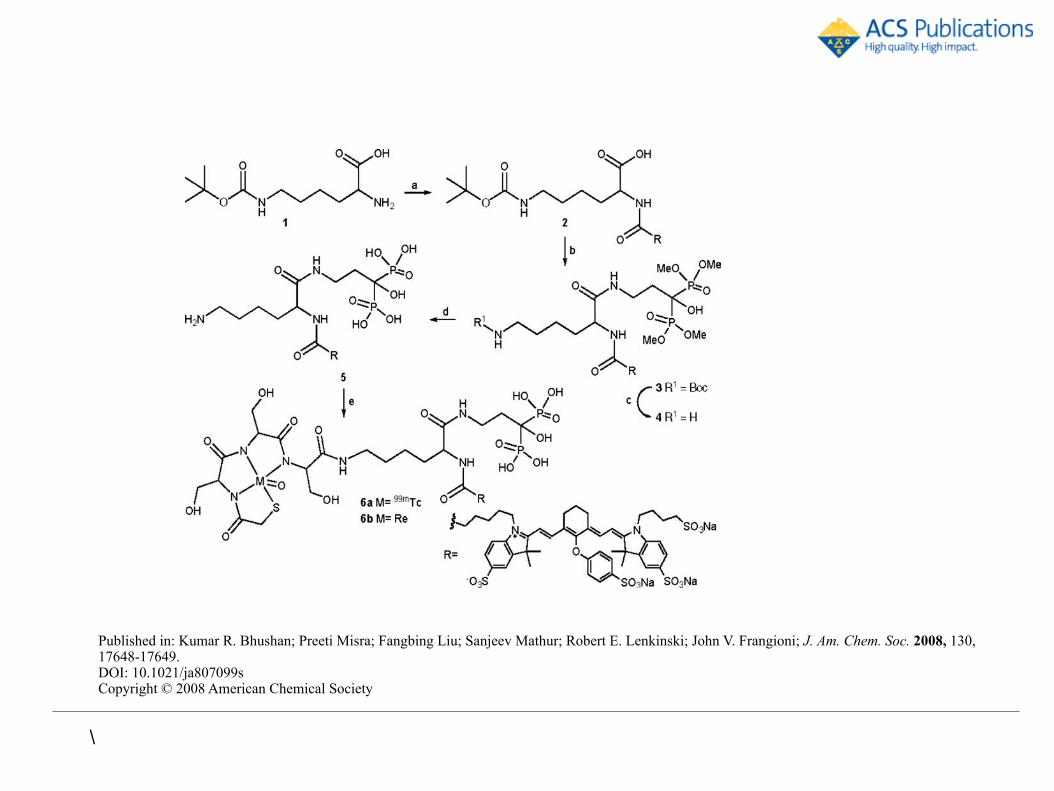
Published in: Kumar R. Bhushan; Preeti Misra; Fangbing Liu; Sanjeev Mathur; Robert E. Lenkinski; John V. Frangioni; J. Am. Chem. Soc. 2008, 130, 17648-17649. DOI: 10.1021/ja807099s Copyright © 2008 American Chemical Society
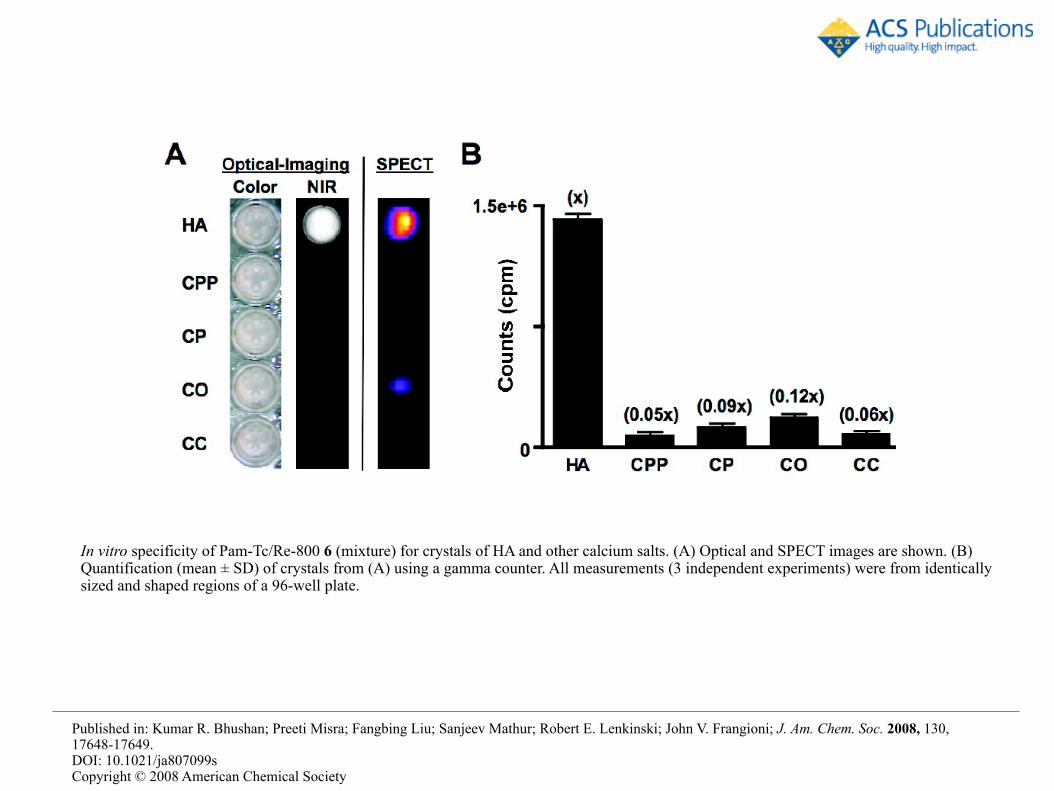
In vitro specificity of Pam-Tc/Re-800 6 (mixture) for crystals of HA and other calcium salts. (A) Optical and SPECT images are shown. (B) Quantification (mean ± SD) of crystals from (A) using a gamma counter. All measurements (3 independent experiments) were from identically sized and shaped regions of a 96-well plate.
Published in: Kumar R. Bhushan; Preeti Misra; Fangbing Liu; Sanjeev Mathur; Robert E. Lenkinski; John V. Frangioni; J. Am. Chem. Soc. 2008, 130, 17648-17649. DOI: 10.1021/ja807099s Copyright © 2008 American Chemical Society
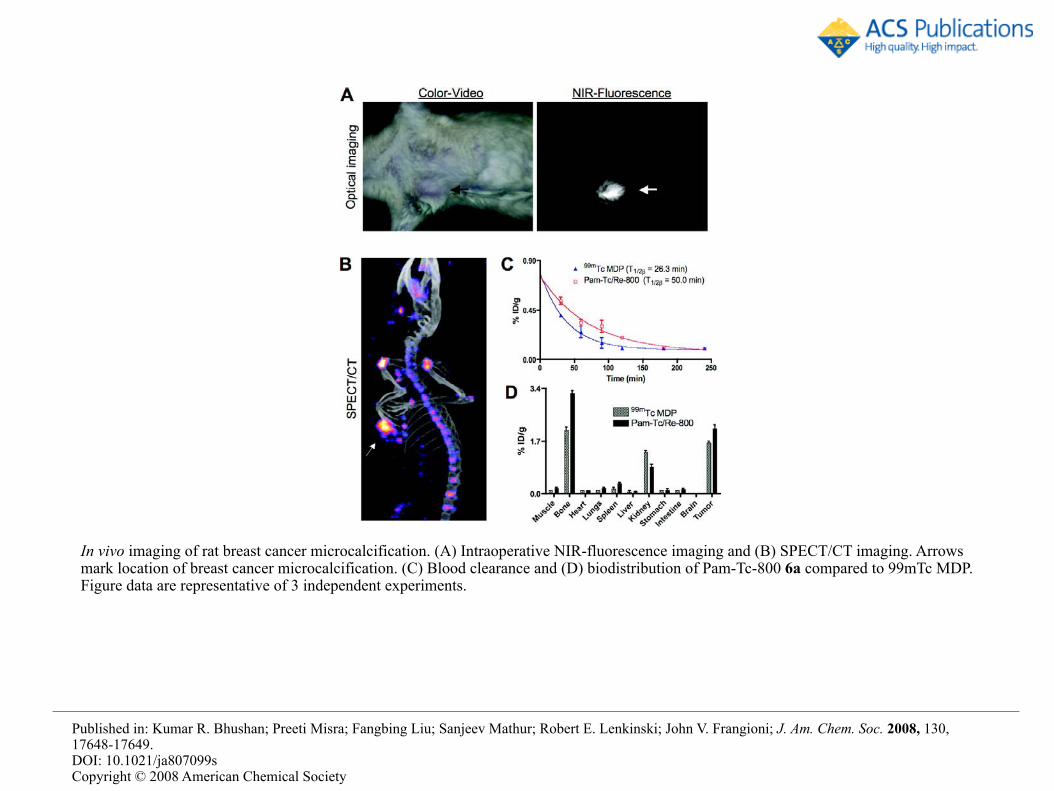
In vivo imaging of rat breast cancer microcalcification. (A) Intraoperative NIR-fluorescence imaging and (B) SPECT/CT imaging. Arrows mark location of breast cancer microcalcification. (C) Blood clearance and (D) biodistribution of Pam-Tc-800 6a compared to 99mTc MDP. Figure data are representative of 3 independent experiments.
Published in: Kumar R. Bhushan; Preeti Misra; Fangbing Liu; Sanjeev Mathur; Robert E. Lenkinski; John V. Frangioni; J. Am. Chem. Soc. 2008, 130, 17648-17649. DOI: 10.1021/ja807099s Copyright © 2008 American Chemical Society
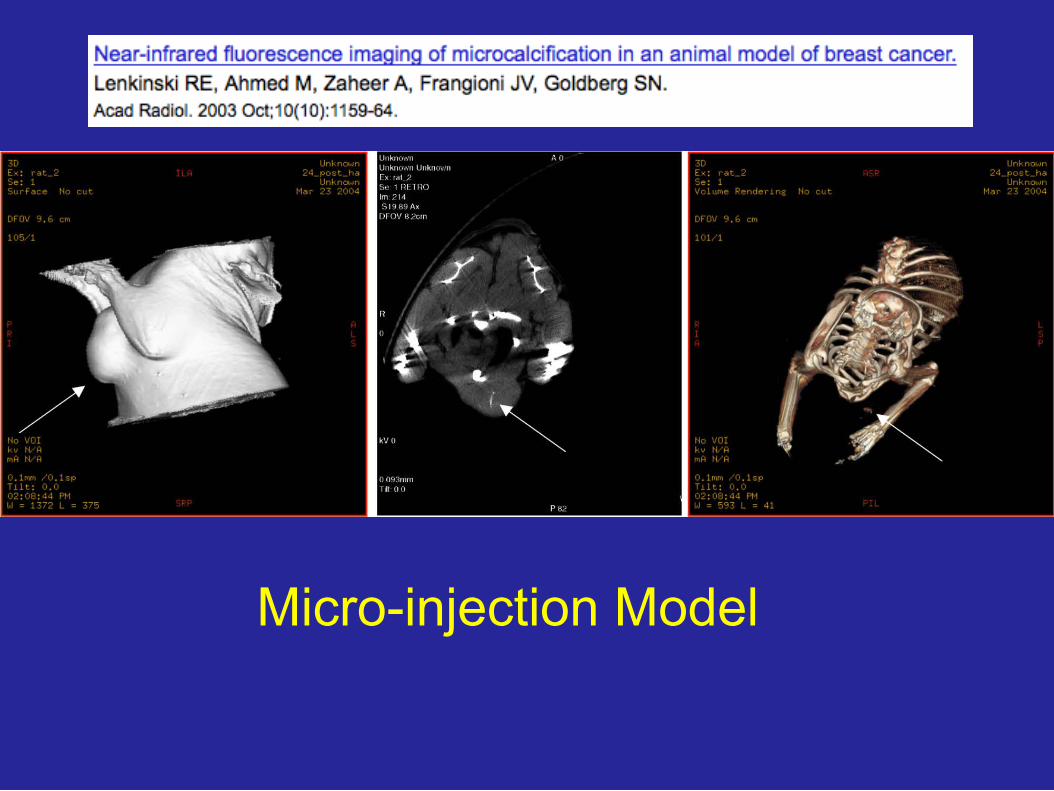
Micro-injection Model
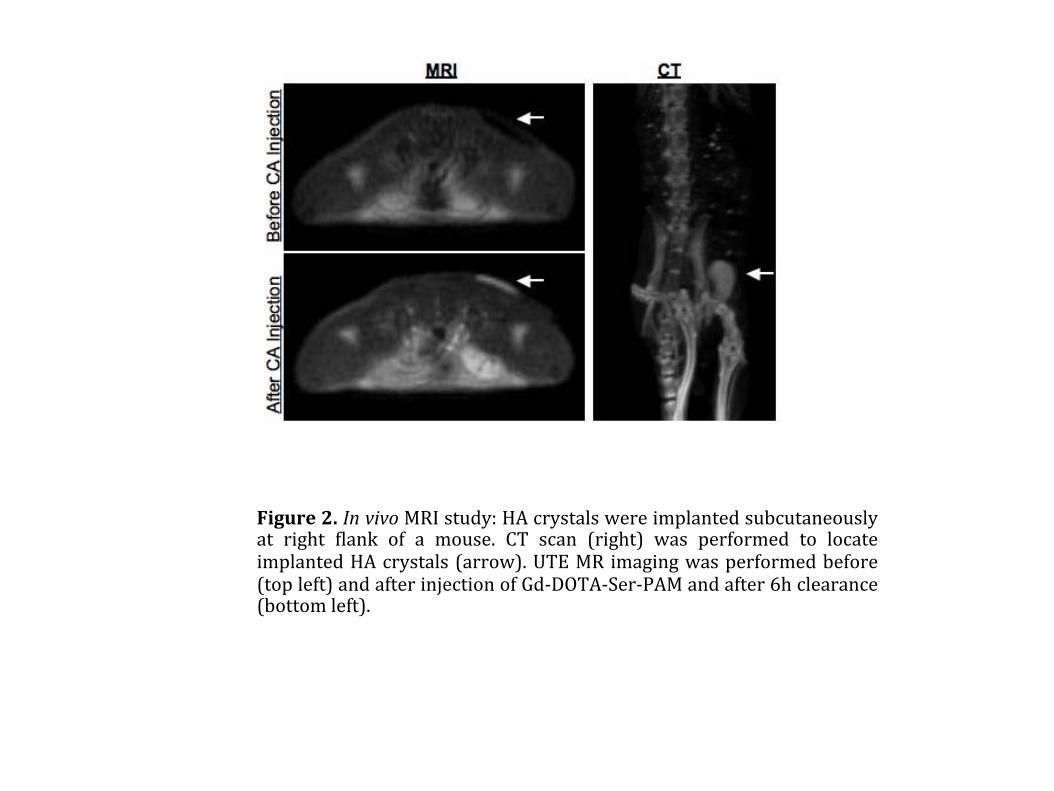
Figure 2. In vivo MRI study: HA crystals were implanted subcutaneously at right ;lank of a mouse. CT scan (right) was performed to locate implanted HA crystals (arrow). UTE MR imaging was performed before (top left) and after injection of Gd-‐DOTA-‐Ser-‐PAM and after 6h clearance (bottom left).
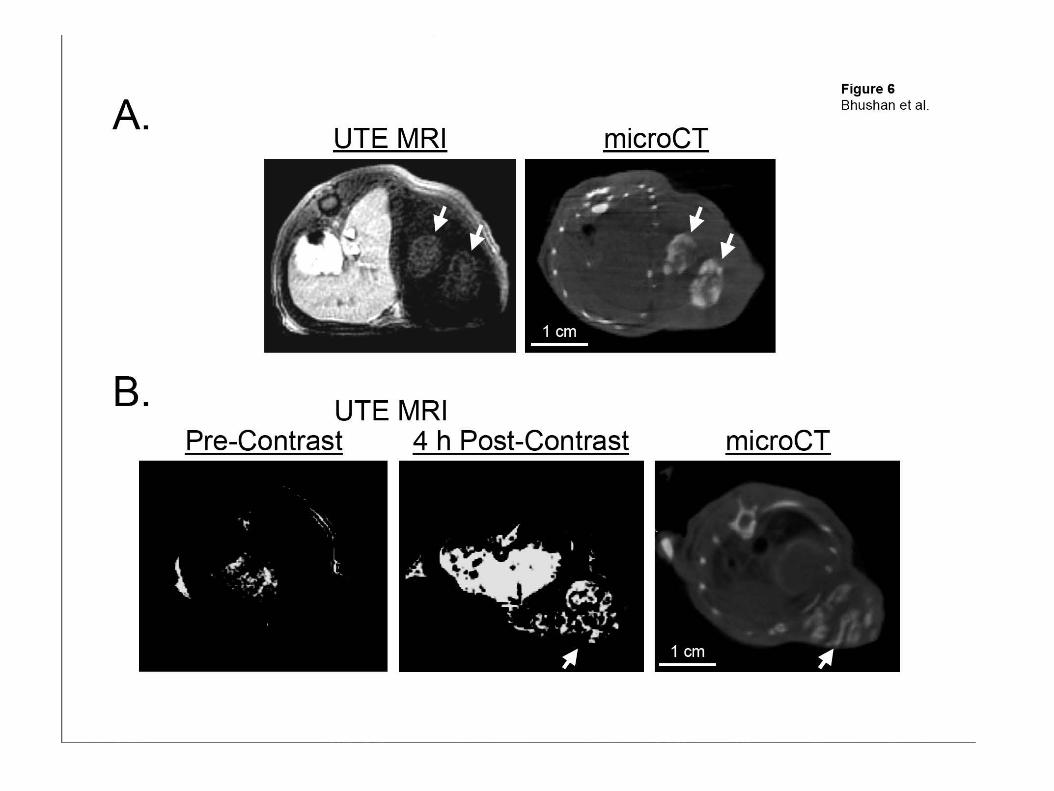
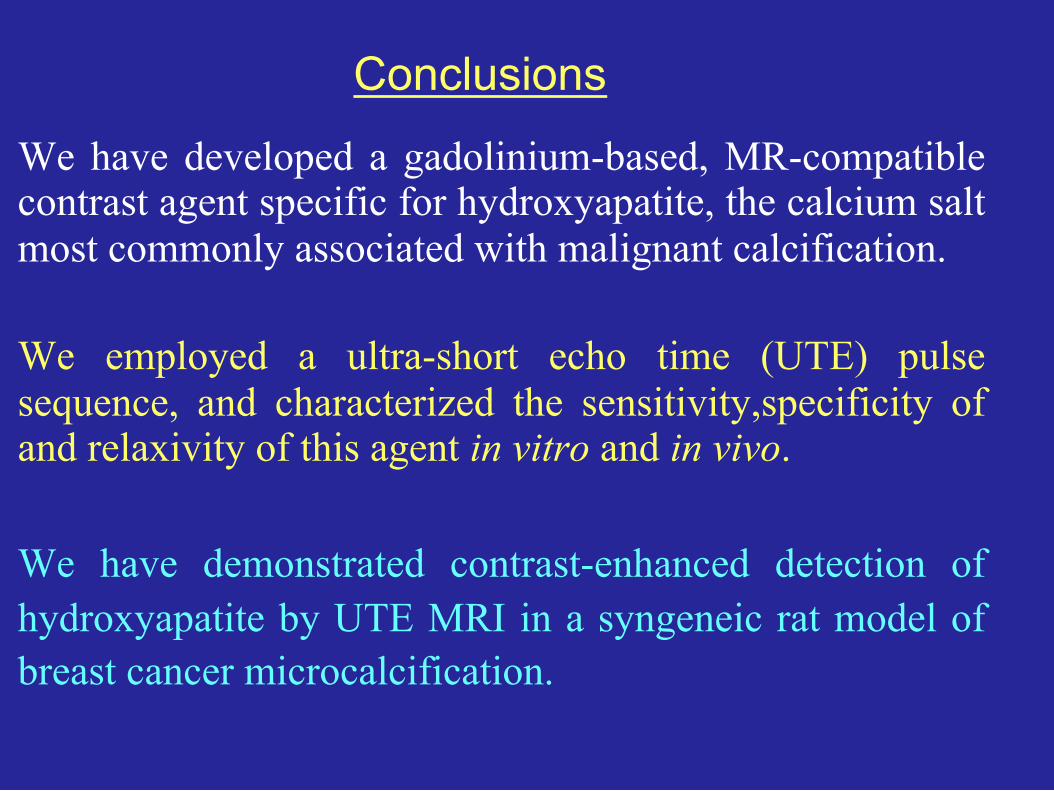
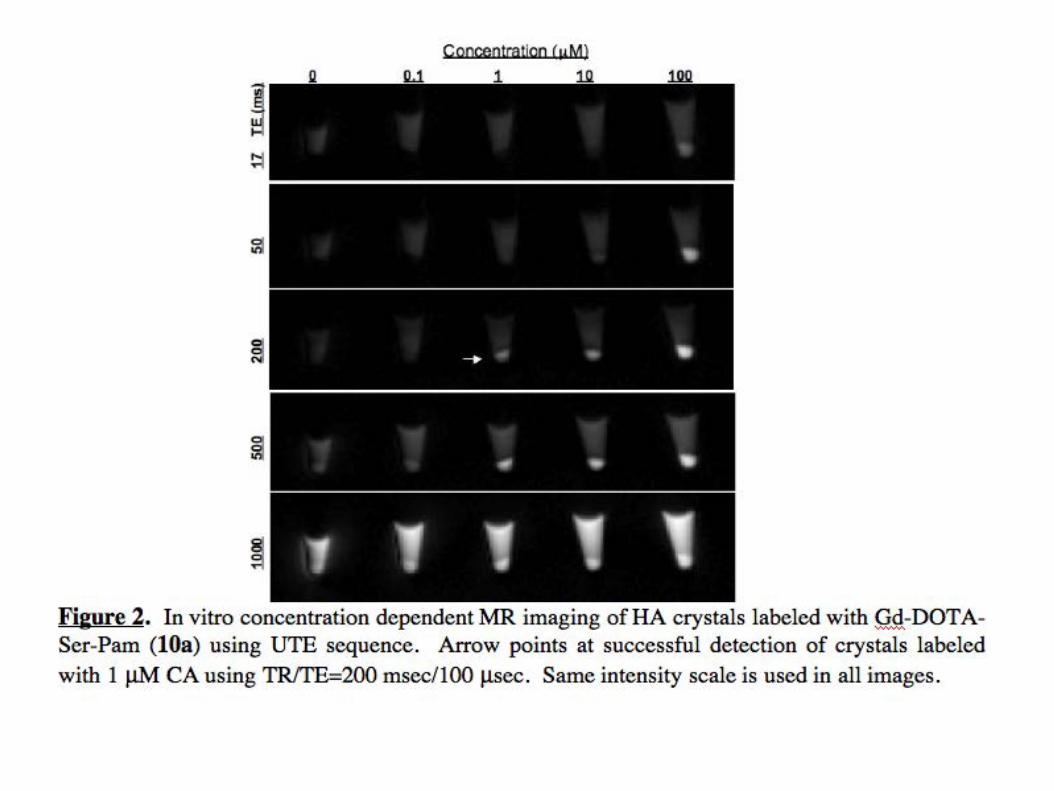
We have developed a gadolinium-based, MR-compatible contrast agent specific for hydroxyapatite, the calcium salt most commonly associated with malignant calcification. We employed a ultra-short echo time (UTE) pulse sequence, and characterized the sensitivity,specificity of and relaxivity of this agent in vitro and in vivo.
We have demonstrated contrast-enhanced detection of hydroxyapatite by UTE MRI in a syngeneic rat model of breast cancer microcalcification.
Conclusions
Schematic of some key steps involved in a molecular imaging study.
Michelle L. James, and Sanjiv S. Gambhir Physiol Rev 2012;92:897-965
©2012 by American Physiological Society