Embed Size (px)
Citation preview
Macroeconomic & Financial Management Institute of Eastern & Southern Africa
TTThhheee DDDeeevvveeelllooopppmmmeeennnttt ooofff FFFiiinnnaaannnccciiiaaalll MMMaaarrrkkkeeetttsss iiinnn RRRwwwaaannndddaaa::: CCCooonnnssstttrrraaaiiinnntttsss aaannnddd PPPrrrooossspppeeeccctttsss...
JJJooonnnaaattthhhaaannn GGGAAATTTEEERRRAAA SSSEEEBBBAAAGGGAAABBBOOO NNNaaatttiiiooonnnaaalll BBBaaannnkkk ooofff RRRwwwaaannndddaaa
MMMeeennntttooorrr::: MMMrrr... SSSttteeevvveeennn KKKAAABBBOOOYYYOOO DDDiiirrreeeccctttooorrr ooofff FFFiiinnnaaannnccciiiaaalll MMMaaarrrkkkeeetttsss
BBBaaannnkkk ooofff UUUgggaaannndddaaa
AAA TTTeeeccchhhnnniiicccaaalll PPPaaapppeeerrr SSSuuubbbmmmiiitttttteeeddd iiinnn PPPaaarrrtttiiiaaalll fffuuulllfffiiilllmmmeeennnttt ooofff ttthhheee AAAwwwaaarrrddd ooofff MMMEEEFFFMMMIII FFFeeellllllooowwwssshhhiiippp...
NNNooovvveeemmmbbbeeerrr 222000000999

ii
Abstract
Domestic Financial Markets are one of the major pillars of market based economy. Well-
functioning financial markets lead to economic growth; they check on macroeconomic volatility
and hence ensure financial stability. They perform the essential economic function of channelling
funds from households, firms and governments that have saved surplus funds to those that have a
shortage of funds. Thus, financial markets are critical for producing an efficient allocation of
capital, which contributes to higher production and efficiency for the overall economy.
This paper reviewed the current situation of the financial market in Rwanda and highlighted the
role of financial market in the mobilisation of domestic resources for investment in developing
countries in general, and Rwanda in particular. It also discussed the challenges and constraints that
impede the development of an effective domestic financial market in Rwanda. Lastly, the paper
details the strategies that could be employed to meet the goals set to make Rwanda the Financial
Hub for the EAC Region. Based on the experience from other developing countries in general and
from regional markets in particular, the paper recommends both medium and long term strategies
to pave way for an effective domestic financial market.
Main findings:
The Treasury Bills market has been very active especially from the second quarter of this year
2009. Commercial Banks have been bidding in the weekly auctions, sometimes aggressively, for
all the maturities offered. A typical problem has been that banks and all other investors buy and
hold the securities. That is, they purchase the instruments are keep them till maturity. This is due
mainly to lack of liquidity in the secondary market. The investors (both institutional and
individuals) have few opportunities to place their savings. As it currently stands, other than the
issues of BNR, the only alternative is commercial bank deposits.
It is evident also that commercial banks have excess liquidity which results from the contraction of
their loan portfolios (chapter 3). Banks have been, of recent, reluctant to issues new loans. It
appears that this problem of loans will take long to correct as the banks will need to either,
restructure the loans for the entities which can repay the outstanding loans or write off loans which
will not be repaid. In the meantime, banks have to improve on the profitability of other sectors of
their businesses. In this regard, new loans will not be negotiated if the price of the loan is not
iii
reflective of the economic conditions. The banking system will need to adopt the market derived
yield curve for this purpose.
The paper recommended therefore (chapter five) a regular issuance of Government instruments,
both Treasury Bills and Treasury Bonds to provide the foundation of the capital markets. By
establishing benchmarks from which the yield curve will be derived, the market will have the basis
for expanding, allowing other instruments (for example: debt, equity and mortgage securities) to be
priced based on their economic value and riskiness vis-à-vis the government yield curve. The
government will have a basis for privatisations; private companies will be able to issue equities to
capitalise on their investments or raise funds by issuing bonds to leverage the return on equity.
Diversified investment opportunities will present alternatives for the investors and will aid in the
creation of wealth over time.
Whereas the medium term strategies proposed are supposed to be undertaken by the concerned
domestic institutions, the long term initiatives proposed will have to take into consideration the
whole of EAC region.

iv
Table of Contents
Abstract ............................................................................................................................................. ii
Acronyms and Abbreviations .......................................................................................................... vi
List of Tables .................................................................................................................................viii
1.1 Background to the Study: ....................................................................................................... 9 1.2 Statement of the Research Problem: ..................................................................................... 10 1.3 Hypothesis of the Study: ....................................................................................................... 11 1.4 Research Design and Methodology: ..................................................................................... 11 1.5 Organisation of the Study: .................................................................................................... 12
Chapter Two: Theory and Literature Review. ................................................................................ 13
2.1 Introduction ...................................................................................................................... 13 2.2 The hierarchy in the development of Financial Markets: ................................................ 13 2.3 The sequencing ................................................................................................................. 14
2.3.1 The Money Market: .............................................................................................................. 15
2.3.2 The Foreign Exchange Market: ............................................................................................ 20
2.3.3 The Government Bond Markets: .......................................................................................... 23
2.3.4 Corporate Bond and Equity Markets .................................................................................... 27
2.4 Preconditions for Domestic Financial Markets Development ......................................... 28 2.5 Conclusion ........................................................................................................................ 32
Chapter Three: Diagnostic analysis of Rwanda’s Financial Sector. ............................................... 35
3.1 An Overview: ................................................................................................................... 35 3.2 Recent developments in the Financial Sector of Rwanda: ............................................... 35
3.2.1 The Money Market: .............................................................................................................. 36
3.2.2 The Capital Market: .............................................................................................................. 39
3.3 The Foreign Exchange Market: ........................................................................................ 40 3.3.1 The Reserves Management Policy: ...................................................................................... 41
3.3.2 Investment strategy: .............................................................................................................. 43
3.3.3 The Investment portfolio: ..................................................................................................... 44
3.4 Remittance flows from the Diaspora ................................................................................ 44 3.5 The Public Debt Policy and Debt Strategy in Rwanda .................................................... 46 3.6 The scale of financial depth in Rwanda ........................................................................... 49
3.6.1 Macroeconomic stability ...................................................................................................... 49
3.6.2 Banking Industry .................................................................................................................. 52
3.6.3 Non-Bank Financial Institutions (NBFI) .............................................................................. 59
3.6.4 The National Social Security Fund (NSSF). ........................................................................ 64
3.7 Settlements and Payment System ..................................................................................... 66 3.8 Major challenges facing Rwanda Financial Markets ....................................................... 69
Chapter Four: Financial Markets in the EAC Region ..................................................................... 71

v
4.1 Introduction ...................................................................................................................... 71 4.2 Financial Markets in UGANDA ...................................................................................... 71
4.2.1 Financial Market Instruments ............................................................................................... 72
4.2.2 The Uganda Securities Exchange (USE) .............................................................................. 72
4.3 Financial Markets in KENYA .......................................................................................... 74 4.3.1 Capital Markets Development in Kenya .............................................................................. 75
4.3.2 The Nairobi Stock Exchange (NSE) ..................................................................................... 76
4.4 Financial Markets in Tanzania ......................................................................................... 77 4.4.1 The Money Markets ............................................................................................................. 77
4.4.2 The Capital Market ............................................................................................................... 78
4.4.3 Dar Es Salaam Stock Exchange............................................................................................ 79
4.5 Integration of Financial Markets in the EA Region ......................................................... 81 4.6 Challenges to Financial Markets Integration in the EAC ................................................ 83
Chapter Five: Strategies for sustainable development (Roadmap).
......................................................................................................................................................... 88
5.1 Initiatives in the EAC Region .......................................................................................... 88 5.2 Recommended Strategies (Roadmap) .............................................................................. 89
5.2.1 A Matrix of the Recommended Roadmap for Rwanda: ....................................................... 90
5.2.2 A Matrix of Recommended Market Conventions for EAC: ................................................. 93
5.3 Conclusion ........................................................................................................................ 97 References ....................................................................................................................................... 98
vi
Acronyms and Abbreviations
ATS: Automated Trading System
ATM: Automated Teller Machines
BA: Bankers’ Acceptance
BCR: Commercial Bank of Rwanda
BHR: Rwanda Housing Bank
BK: Bank of Kigali
BNR: National Bank of Rwanda
BOT: Bank of Tanzania
BOU: Bank of Uganda
BPR: Popular Bank of Rwanda
BRD: Rwanda Development Bank
CBK: Central Bank of Kenya
CD: Certificate of Deposit
CDS: Central Depository System
CMA: Capital Market Authority
CMAC: Capital Markets Advisory Council
CMDC: Capital Market Development Committee
CMSA: Capital Market and Securities Authority
COMESA: Common Market of East and Southern Africa
CP: Commercial Paper
CSS: Credit and Savings Society
DSE: Dar Es Salaam Stock Exchange
EAC: East Africa Community
EASRA: East African States Securities Regulatory Authorities
ECOWAS: Economic Community of West African States
EDPRS: Economic Development and Poverty Reduction Strategy
FDI: Foreign Direct Investment
FMDP: Financial Markets Development Plan
FOREX: Foreign Exchange
FSDP: Financial Sector Development Plan
FSDP: Financial Sector Development Plan
vii
GDP: Gross Domestic Product
HIPC: Highly Indebted Poor Country
IFRS: International Financial Reporting Standards
IPO: Initial Public Offer
LDM: Licensed Dealing Members
MAC: Monetary Affairs Committee
MAGERWA: Magasin Generaux du Rwanda
MDI: Microfinance Deposit taking Institutions
MDRI: Multilateral Debt Relief Initiative
MFI: Micro-Finance Institutions
MOU: Memorandum of Understanding
NGO: Non-Governmental Organisation
NPC: National Payment Council
NPL: Non-Performing Loans
NSE: Nairobi Stock Exchange
NSSF: National Social Security Fund
OMO: Open Market Operations
PD: Primary Dealers
POS: Point of Sale
PPP: Public Private Partnership
PSP: Payment Service Providers
PvD: Payment versus Delivery
REPO: Repurchase Agreement
ROTC: Rwanda over the Counter
RWF: Rwandese Franc
SADC: Southern Africa Development Community
TMC: Treasury Management Committee
TZS: Tanzania Shillings
USD: United States Dollar
USE: Uganda Securities Exchange
viii
List of Tables Table 1: Volume of Money Market Transactions ...........................................................................37
Table 2: Evolution of Interest Rates on the Money Market............................................................38
Table 3: Evolution of Broad Money and its components ...............................................................38
Table 4: List of Treasury Bonds issued in Rwanda.........................................................................39
Table 5: Rwanda’s Major Macroeconomic Indicators....................................................................46
Table 6: Evolution of the Domestic Debt........................................................................................47
Table 7: Selected Financial Stability Indicators..............................................................................50
Table 8: Total Assets of Financial Institutions................................................................................52
Table 9: Trends of Interest Rate Spread..........................................................................................56
Table 10: MFI Consolidated Financial situation.............................................................................58
Table 11: Total Assets in Insurance Companies..............................................................................60
Table 12: Insurance access indicators..............................................................................................60
Table 13: Insurance Asset Components...........................................................................................62
Table 14: Pension Sector Total Asset Trends..................................................................................62
Table 15: NSSF Investment Policy..................................................................................................65
Table 16: NSSF Investment Portfolio..............................................................................................65
Table 17: NSSF Shareholding Status...............................................................................................66
Table 18: ATMs and POS per Inhabitant.........................................................................................67
Table 19: The Ratio of Currency in Circulation to Broad Money....................................................67

Chapter One: General Introduction
1.1 Background to the Study:
Rwanda is a landlocked country covering just 26.338 square kilometres. The population was
estimated at 9.6 million people at the end of 2008 with an estimated per capita income of $ 4701.
This makes Rwanda one of the most populated countries in Africa, yet the economy is agrarian
with agriculture employing almost 80% of the population.
Rwanda’s long term development plan, as articulated in Vision 20202, seeks to transform Rwanda
into a middle income country and an economic trade and communication hub by the year 2020.
Rwanda aims at increasing its GDP per capita up to $900 by 2020 and this ambitious target
implies that the economy has to expand by over 600% and would require a vibrant private sector,
massive local and foreign direct investments which should create several millions of new jobs in
the formal sector as well as the increase and diversification of exports. An effective financial
sector is fundamentally important and essential element for achieving this objective.
The World Bank and the International Monetary Fund completed a study on the Rwanda’s
Financial Sector in 2005 which concluded that it (the sector) was still “relatively shallow,
undiversified, dominated by an oligopolistic banking sector, and characterised by relatively high
lending rates, extremely low insurance penetration, a scarcity of long term debt, home mortgage
financing and equity capital, a virtual absence of regulation and supervision of pensions and
insurance, and an inadequately functioning payment system”3.
The key question is how to develop a financial market which is both efficient and reliable for long
term development in a country like Rwanda.
1 National Institute of Statistics: Quarterly Economic Review (March 2009) 2 Vision 2020 formulates long term development goals for Rwanda. It puts forward wide development objectives based around the pillars of good governance, private sector development, human resource development, infrastructural improvements, regional and international economic integration, etc. 3 Financial Sector Development Program Report (May 2007).

10
This study has been done and submitted in partial fulfilment for the Award of MEFMI
Fellowship. It has concentrated on the role of financial markets in the mobilisation of domestic
resources for investment in developing countries in general, and Rwanda in particular. It also
highlighted on the constraints and prospects hence proposing a roadmap for effective
implementation of the Financial Markets Development in Rwanda.
1.2 Statement of the Research Problem: One of the important challenges for most developing countries is to put themselves on a path of
sustained growth while alleviating poverty and improving social indicators. It is broadly accepted
that well-functioning financial markets are one of the most important determinants for economic
growth and development. The Financial system plays important roles in economic development of
a country. It mobilises savings without which investments could not be made. Stable and efficient
Financial Markets lead to economic growth; they check on macroeconomic volatility and hence
ensure financial stability. The ultimate objective of Financial Markets development is to make
possible an increase in financial resources and how to effectively put them to utilisation so as to
stimulate and accelerate the process of economic growth.
Developing financial markets therefore, is crucial for Rwanda as it seeks to achieve ambitious
development goals and raise the standards of living for its people. Long term investment
potentials, as well as ability to mobilise long term savings, will be extremely limited so long as
there are no feasible ways of mobilising long term investments in the domestic market place.
Within the framework of the above paragraphs therefore, the following research questions would
be asked:
1. What are the constraints or limitations to the development of Financial Markets in
Rwanda?
2. Which strategies are more practical and sustainable for the development (road map) of the
Financial Markets in Rwanda?
3. What is the impact of the Financial Markets development on the ordinary Rwandan
livelihoods?
11
1.3 Hypothesis of the Study: The study assumes that given an enabling environment, Financial Markets play a significant role
in the mobilisation of financial resources for the development and thus contributing to poverty
reduction through economic growth. For these markets to operate with some degree of efficiency,
the conditions are: a stable macroeconomic environment, an appropriate capital market
infrastructure and an adequate regulatory and supervisory framework in order to protect investors,
promote public confidence and guarantee market discipline. A crucial question for Rwanda is
how to ensure that all obstacles to financial intermediation have been eliminated. Thus,
providing an environment for businesses and individuals to create wealth through the money
industry is the basis for improving the livelihoods of rural households.
1.4 Research Design and Methodology: While focusing on Rwanda, the study will draw on some lessons from some of the regional
financial markets which went through the same process. The broad aim of the study was to
provide a roadmap on how to achieve an effective financial market that can be a model to
developing countries like Rwanda. The specific objectives of the study were to show how to
achieve:
1. A facilitating foundation of conditions and regulations within which issuers and investors
of long term funds can transact business with reasonable confidence and efficiency;
2. Effective demand for long term funds (from users that need these funds) that can be
operationalised in the form of implementable instruments; and
3. An effective supply of long term funds (from those that have long term funds to invest)
that can be made available to meet these demands.
The paper will therefore try to analyse:
The place of Financial Markets in the mobilisation of domestic savings for economic
development of Rwanda;
Diagnostic analysis of Rwanda’s financial sector;
The scale and nature of intermediation and financial depth in Rwanda;
The sequencing of reforms in the development of financial markets;
The constraints that might hinder the development;

12
The initiatives within the region (East Africa) aimed at the development of Financial
Markets in the EAC.
The study has employed different research methods:
The review of the existing literature on the Implementation and management of Financial
Markets in the Sub-Saharan Africa;
Collection of Information:
o Formulated a questionnaire to some potential domestic market participants;
o Collected data from the three East Africa Community countries (Uganda, Kenya
and Tanzania) while on attachment in their respective Central Banks.
o Visited the regional Capital Market Authorities, Stock Markets and other key
stakeholders in the Financial Sector;
Analysis of the findings, editing and refining of the document;
Formulated recommendations and conclusion.
1.5 Organisation of the Study: This study is organised into five chapters, with chapter one providing the background
information, statement of the problem, study objectives and explains the methodologies used. The
second chapter reviews literature on financial markets development in general and the
characteristics of financial markets in the developing countries. Whereas chapter three
concentrates on the analysis of the domestic financial market, chapter four highlights on the
developments of financial markets within the EAC countries. Chapter five presents the summary
of the proposed roadmap and some policy recommendations within the framework of developing
the Rwandan Financial Market.
13
Chapter Two: Theory and Literature Review.
2.1 Introduction The financial market is essentially the term used to describe the “money industry”. Financial
markets perform the essential economic function of channelling funds from households, firms and
governments that have saved surplus funds by spending less than their income to those that have a
shortage of funds because they wish to spend more than their income. They allow funds to move
from people who lack productive investment opportunities to people who have such opportunities.
Thus, financial markets are critical for producing an efficient allocation of capital, which
contributes to higher production and efficiency for the overall economy.
This chapter reviews the relevant literature on the development of Financial Markets especially in
developing countries. The chapter starts with the review of the hierarchical steps commonly
followed in the development of financial markets. It also attempts to discuss the constraints that
hamper the potentials of financial markets and highlights on their role in economic growth. The
chapter also looks at some of the theories about Financial Markets integration as well as on
institutional asset preferences.
2.2 The hierarchy in the development of Financial Markets:
The understanding of financial markets is more important now than perhaps any time in money
industry. Financial markets have come up over several hundred years and are undergoing constant
innovations to improve liquidity in a better manner. The economy has shifted away from
industrial workers to knowledge workers. Knowledge workers include “Financial market
professionals” who refer to anyone who makes money directly or indirectly from the market. The
need to develop domestic securities markets has increasingly attracted the attention of national
and international policy makers. However, sequencing the different steps in their developments
depends largely on country specific circumstances. The size of the economy, the level of
competition and sophistication of the financial sector, and the different types of investors present
in the country and their appetite for fixed income financial instruments are all important factors
14
determining not only the appropriate sequencing of initiatives to develop a securities market, but
also whether the public sector should be actively engaged in the development of different market
aspects.
2.3 The sequencing According to V. SUNDARARAJAN4, strategies to develop local financial markets must revolve
around mitigating risks injected in the financial system as markets develop and become more
sophisticated. “Domestic and external financial reforms thus need to be sequenced in a manner
that ensures that the central bank and financial institutions (as well as the infrastructure that
supports them) develop the capacity to manage the risks associated with a wider range of
permissible financial transactions, investible instruments, and loanable funds”.
Literature has suggested that financial markets can be sub-divided into:
i. Capital markets5 which consist of:
a. Stock markets which provide financing through the issuance of shares, and
enable the subsequent trading thereof.
b. Bond markets which provide financing through the issuance of Bonds, and
enable the subsequent trading thereof.
ii. Commodity markets, which facilitate the trading of commodities.
iii. Money markets which provide short term debt financing and investment.
iv. Derivatives markets which provide instruments for the management of financial risk.
v. Futures markets which provide standardised forward contracts for trading products at
some future dates.
vi. Insurance markets which facilitate the redistribution of various risks.
vii. Foreign exchange markets which facilitate the trading of foreign exchange.
4 V.SUNDARARAJAN: Presentation at the fifth Annual Financial Markets and Development conference on the Future of Domestic Capital Markets in Developing Countries. April 14-16, 2003 Washington DC. 5 The capital markets consist of primary markets and secondary markets. Newly issued securities are bought or sold in primary markets. Secondary markets allow investors to sell securities that they hold or buy existing securities.
15
However, within the context of the sequencing of financial markets development in low income
countries like Rwanda, the literature reviewed was mainly on, but not limited to, the
characteristics of the following markets:
Money Markets;
Foreign Exchange Markets;
Government Bond Markets; and
Corporate Bond and Equity Markets.
2.3.1 The Money Market:
The money market is better known as a place for large institutions and government to manage
their short-term cash needs. It is a market for overnight short-term funds and instruments having a
maturity period of one or less than one year. It is said to be the market for financial assets that are
close substitutes for money and a foundation of all financial markets as it is the medium through
which financial institutions manage their liquidity by lending to and borrowing from one another.
A money market is generally expected to perform three broad functions:
Provide a balancing mechanism to even out the demand for and supply of short term
funds;
Provide a focal point for central bank intervention for influencing liquidity and general
level of interest rates in the economy;
Provide reasonable access to suppliers and users of short term funds to fulfil their
borrowings and investment requirements at an efficient market clearing price.
Benefits of an efficient Money Market:
Besides the above functions, a well functioning money market facilitates the development of a
market for longer term securities. An efficient money market benefits a number of players:
It provides a stable source of funds to banks in addition to deposits, allowing alternative
financing structures and competition. It allows banks to manage risks arising from interest
rate fluctuations and to manage the maturity structure of their assets and liabilities.
16
A developed inter-bank market provides the basis for growth and liquidity in the money
including the secondary market for commercial paper and treasury bills.
An efficient money market encourages the development of non-bank intermediaries thus
increasing the competition for funds. Savers get a wide array of savings instruments to
choose from and invest their savings.
A liquid money market provides an effective source of long term finance to borrowers.
Large borrowers can lower the cost of raising funds and manage short term funding or
surplus efficiently.
A liquid and vibrant money market is necessary for the development of a capital market,
foreign exchange market and market in derivative instruments. The money market
supports the long term debt market by increasing the liquidity of securities. The existence
of an efficient money market is a precondition for the development of a government
securities market and a forward foreign exchange market.
Money Market Instruments:
There are several different instruments in the money market, offering different returns and
different risks. The major money market instruments include:
Treasury Bills:
Treasury Bills (T-bills) are the most marketable money market security. They are short term
securities that mature in one year or less from their issue date. Treasury bills are issued through a
competitive bidding process at auctions and they are purchased for a price that is less than the
face (par) value; when they mature, the government pays the holder the full par value. T-bills are
so popular because they are among the few money market instruments that are affordable to the
individual investors.
Certificate of Deposit:
A Certificate of Deposit (CD) is a time deposit with a bank. CDs are generally issued by
commercial banks but they can be bought through brokerages. They bear a specific maturity date

17
and a specified interest rate. Like all time deposits, the funds may not be withdrawn on demand
like those in a checking account.
The main advantage of CDs is their relative safety and the ability to know the return ahead of
time and they offer slightly higher yields than T-Bills because of the slightly higher default risk
for a bank though, the likelihood that a large bank will go broke is pretty slim.
Commercial Paper:
Commercial Paper (CP) is an unsecured, short term loan issued by a corporation, typically for
financing working capitals. For many corporations, borrowing short term money from
commercial banks is often laborious task. In order to avoid this, they resort to commercial papers
which are usually issued at a discount rate, reflecting current market interest rate.
Bankers’ Acceptance:
A Bankers’ Acceptance (BA) is a short term credit investment created by a non financial
institution and guaranteed by a bank to make payment. Acceptances are traded at discounts from
face value in the secondary market. For corporations, a BA acts as negotiable instruments for
financing imports, exports or other transactions. This is especially useful when the
creditworthiness of a foreign trade partner is unknown. One of its advantages is that it does not
need to be held until maturity as it can be sold off in the secondary markets where investors and
institutions constantly trade Bankers’ acceptance.
Repurchase Agreement:
Repurchase agreements (REPO)6 are an essential instrument for money market development.
Those who deal in government securities (usually T-Bills) use REPOS as a form of overnight
borrowing. A dealer sells the securities to a lender and agrees to repurchase them back at an
agreed future date and at an agreed price. Because they are usually of very short term maturity,
and given that they are always backed by the government, REPOS provide lenders with extremely
low risk.
6 REPO is whereby the central bank lends securities against cash, or the reverse repurchase agreement, whereby the central bank borrows securities against cash.
18
In such agreements, government securities of any maturity can serve as collateral. However, the
choice of reserve management methods to absorb excess reserves will have little effect on
liquidity if the central bank has insufficient access to securities needed for market intervention. As
a collateralised instrument, REPO facilitates inter-bank lending by minimising the credit risk
exposure of each counterparty, which in turn, reduces the dispersion of inter-bank lending rates. If
the cash borrower fails to repay its loan, the lending institution is already in possession of the
collateral underlying the REPO operation.
The role of money market in the development of Capital Market:
A well functioning money market facilitates the development of a market for long term securities.
It provides a stable source of funds to banks in addition to deposits allowing alternative financing
structures and competition. It allows banks to manage risks arising from interest rate fluctuations
and to manage the maturity structure of their assets and liabilities. A developed inter-bank market
provides the basis for growth and liquidity in the money market including the secondary market
for commercial papers and T-Bills.
An efficient money market encourages the development of non-bank intermediaries thus
increasing the competition for funds. Savers get a wide array of savings instruments to choose
from and invest their savings. A liquid money market provides an effective source of long term
finance to borrowers. This lowers the costs of raising funds for investments.
A liquid and vibrant money market is necessary for the development of a capital market, foreign
exchange market and market in derivative instruments. The money market supports the long term
debt market by increasing the liquidity of securities. The existence of an efficient money market
is a precondition for the development of a government securities market and a forward foreign
exchange market.
According to the World Bank’s Handbook7, “At the nascent stages of market development,
priority should be given to strengthen and develop the short term market. This requires initiatives
related to developing an active money market with market determined price setting. In most
7 The World Bank (2001): Developing Government Bond Markets

19
cases, progress in this area cannot be achieved without the active participants of the central bank.
Supporting the development of an effective REPO market is a key priority at this stage”.
There are three8 key conditions required to develop a well-functioning money market:
i. Banks and other financial institutions must be commercially motivated to respond to
incentives to actively manage risk and maximise profit;
ii. The central bank must shift from direct to indirect methods of implementing monetary
policy;
iii. The government must have a good capacity for cash management, thereby giving the
central bank greater freedom in setting its operating procedures.
Therefore, money markets are essential for conducting indirect, market-based monetary policy
operations and for providing the liquidity necessary for a market in government bonds and in
private sector securities. The way market policy is implemented will largely determine the
incentives that market participants have to buy and sell securities.
The role of the Central Bank in money market development:
As an economy grows, financial markets can be expected to broaden and deepen, but experience
shows that the pace and pattern of market development may need guidance from monetary and
government authorities. The central bank’s operating procedures greatly influence the stability of
the money market. The central bank should begin with developing new monetary instruments,
reforming the system of reserve requirements, and designing the terms and conditions of access to
standing facilities9.
Money market development depends crucially on the soundness of financial institutions. In the
absence of creditworthy counterparts, market participants would be reluctant to deal in the inter-
bank market, and would instead transact with the central bank. Market participants should be able
to assess one another’s creditworthiness on the basis of timely disclosure of reliable financial
information, underpinned with high accounting standards and certified with external audits.
8 Idem, Page 63 9 V. SUNDARARAJAN (2003): Presentation at the fifth Annual Financial Markets and Development conference on the Future of Domestic Capital Markets in Developing Countries. April 14-16, 2003 Washington DC.

20
Central bank policies and standing facilities should be designed and conducted in a manner that
give incentives for market participants to trade money among themselves before trading with the
central bank. To manage liquidity effectively, the central bank must have the technical capacity to
forecast liquidity and possess the instruments to inject and withdraw funds from the market. The
ability to manage the quantity of reserve money accurately will give the central bank freedom to
provide incentives to market liquidity and to restrain volatility of interest rates. Unfortunately, the
single greatest problem most central banks face is poor ability to manage the quantity of excess
reserves.
In the absence of accurate liquidity management, the central bank needs to adopt offsetting
operating tactics. The central bank’s choice of settings for the target level of excess reserves, the
reserve compliance period, and accommodation policy will be constrained by the need to
compensate for the possible effects of poor liquidity management on market volatility. One
tactical remedy is Open Market Operations after final clearing has occurred, when the exact
quantity of excess reserves is known. This tactic permits only daily control. However, greater
market stability would result if the central bank were to use flow forecasts to select maturities for
repurchase operations that smooth the profile of excess reserves some distance into the future.
2.3.2 The Foreign Exchange Market:
The foreign exchange (FOREX) market is similar to the money market, but differs in that each
transaction involves the simultaneous exchange of local and foreign currency10. Foreign exchange
transactions involve one party purchasing a quantity of one currency in exchange for paying a
quantity of another. It therefore plays an important role in facilitating cross-border trade, financial
transactions and investment. This market is one of the largest (it encompasses the entire globe)
and most liquid of the financial markets in the world. Its twenty four (24) hour access makes it
even more attractive for investors. No matter what time of day you want to trade, there will be
someone trading in some distant location around the world. It is a framework in which
participants are connected by computers, telephones and telex (SWIFT) and operates in most
10 The definition is from Wikipedia, the free encyclopedia.

21
financial centres globally. The major exchanges are Singapore, Hong Kong, Tokyo, Bahrain,
London, New York, San Francisco and Sydney.
Market Participants:
There are two main parts to the foreign exchange market. The first part is the inter-bank, which is
often called the wholesale market. The second part is the client, which is often called the retail
market. Throughout these two categories, there approximately five different types of participants:
a. Foreign Exchange Dealers: The bank and non-bank foreign exchange dealers operate in
both inter-bank and client markets. They profit from buying foreign exchange at bid price
and reselling it at a slightly higher ask price. This helps the efficiency of the market as a
whole because the competitions among dealers narrow the spread between bid and ask
prices.
b. Participants in commercial and investment firms make up the second type of
participants. This group consists of importers, exporters, tourists and other portfolio
investors. They use the market basically to help them invest. Some of those participants
use the foreign exchange market to hedge, which is a way to reduce their risk.
c. Speculators11 and arbitragers12 are the third group type that seeks to profit from the
foreign exchange market. These people are out to make money for themselves without the
need or obligation to serve clients or to ensure a continuous market. They seek profitable
rates in order to profit with the least possible risk involved. Large banks are sometimes
part of this group.
d. Central banks and Treasuries: They use the market to acquire or spend their country’s
foreign exchange reserves as well as to influence the price at which their own currency is
traded. This is something that they do with reserves and in many instances; they do best
when they willingly take a loss on their foreign exchange transactions. Their motive is not
to profit, but to influence the market. This makes them different from all other market
participants.
11 Sophisticated individuals who trade with significant leverage, taking on above average risk in hopes of above average returns. 12 Traders who buy a product at low price from one market and simultaneously sell it in other markets at high price.
22
e. Lastly, foreign exchange brokers are the last of the five groups involved in the foreign
exchange market. These participants facilitate trading between dealers but are not partners
in the transactions. They typically charge a fee for their service and often seen as go-
betweens for large traders. It is a broker’s business to know at any moment exactly which
dealers want to buy or sell any currency.
Transactions in the Foreign Exchange Markets:
Transactions can be executed on a spot, forward or swap basis. A spot transaction requires almost
immediate delivery of foreign exchange. In the inter-bank market, a spot transaction involves the
purchase of foreign exchange with delivery and payment between banks to take place normally on
the second following business day. The date of settlement is referred to as the “value date”.
A forward transaction requires delivery at a future value date of a specified amount of one
currency for a specified amount of another currency. The exchange rate to prevail at the value
date is established at the time of the agreement, but payment and delivery are not required until
maturity.
A swap transaction involves the simultaneous purchase and sale of a given amount of foreign
exchange for two different value dates. The most common type of swap is a spot against forward,
where the dealer buys a currency in the spot market and simultaneously sells the same amount in
the forward market. Since this agreement is executed as a single transaction, the dealer incurs no
unexpected foreign exchange risk.
Factors affecting the development of Foreign Exchange Market:
a. Availability of foreign exchange: The development of foreign exchange market requires
that foreign exchange be freely available for various external transactions. At a minimum,
exchange controls and regulations affecting foreign exchange dealings should be modified
to ensure market based allocation and pricing of foreign exchange.

23
b. The role of the central bank: As with money markets, the central bank plays an
important role in the development of the foreign exchange market. This includes
implementing transparent criteria for licensing dealers, improving information technology
to facilitate inter-bank dealings and strengthening payments & clearing systems.
c. Necessary infrastructures: Like all other financial markets, the soundness of market
participants and the integrity of the payments and settlement systems are important to the
development of the foreign exchange market. In many emerging markets, significant
obstacles to market development include: instability in foreign exchange flows, lack of
confidence, inefficiencies in the payment systems and lack of adequate communication
technology. Thus, market participants should be able to evaluate their counterparties’
creditworthiness on the basis of reliable and timely information. Similarly, settlement risks
should be minimised by improving domestic payments and clearing systems.
d. Information dissemination: The dissemination of information is essential for the
efficient pricing of foreign exchange. Information systems and trading platforms should
also be well organised to ensure buying and selling rates are set freely. Building the
confidence of retail market customers is particularly important because the retail market is
the medium through which foreign currency inflows and outflows are channelled to the
inter-bank market.
2.3.3 The Government Bond Markets:
Bond markets play an important role in meeting the financing requirements of governments. A
government bond refers to the bond issued by a national government denominated in the
country’s own currency13. Bonds issued by national governments in foreign currencies are
normally referred to as Sovereign Bonds.
13 Definition from www.answers.com
24
According to Herring and Chatusripitak (2002)14, the government bond market is the central pillar
of domestic capital markets. It provides a market determined term structure of interest rates that
reflects the opportunity cost of money at each maturity. A well-functioning government bond
market is often the forerunner of a private sector bond market and it provides the institutional and
operational infrastructure for the private sector market. In his paper, M.S Mohanty15 asserts that
the benefits of developing a liquid bond market go beyond financing government deficits at lower
costs. Thus, firstly, a liquid government bond market will facilitate pricing of other and riskier
financial assets. Secondly, it has a direct impact on the degree to which other segments of
financial markets (forward and futures markets, including foreign exchange hedging) can be
developed to support risk management functions. Thirdly, the depth of money and bond markets
has a decisive influence on the effectiveness of central banks’ monetary policy and the yield curve
in a liquid bond market carries important information for the conduct of monetary policy.
Amarakoon Bandara (2008)16 states that the development of a liquid, sound and deep bond market
has important positive spill-over effects on an economy. A well-developed bond market increases
the competitiveness and efficiency of the financial system by:
a) Mitigating maturity and currency mismatches by reducing the public and corporate sectors
over-reliance on short-term bank loans and foreign borrowing;
b) Enhancing the stability of the financial system by creating alternatives to banks, thus
reducing their relative power and related moral hazard problems;
c) Enabling raising long-term capital efficiently for long-term investments and asset creation;
d) Facilitating efficient financing of the government budget from non-bank sources and
thereby improving risk management on public debt; and
e) Creating an environment to conduct monetary policy effectively and efficiently by
providing diverse financial products.
14 As quoted by V. SUNDARARAJAN in the Financial Markets Development: Sequencing of reforms to ensure stability. 15 BIS Papers n° 11: Improving liquidity in government bond markets: What can be done? 16 Bond Market development in Sri Lanka: A way forward.
25
Factors affecting the development of government bond market:
Government securities market development must be viewed as a dynamic process in which
continued macroeconomic and financial sector stability are essential to building an efficient
market and establishing the credibility of the government as an issuer of debt securities.
Establishing a liquid government bond market hinges on several factors17 :
The government must be committed to financing its borrowing requirements at market-
based prices, permanently moving away from the use of funding at below market rates
from captive investor sources. Without the credibility in the government’s financial
policies, investors will be reluctant to invest and trade in government securities. The
government’s ability to borrow from domestic bond market should be legally well defined
and sufficiently broad to achieve a range of objectives. In addition, the essential elements
of market infrastructure, including securities settlement and registration, the use of market
intermediaries and the organisation of trading in the secondary market must be put in
place.
Bond design features and regulatory incentives are equally important. The design of
government securities should be standardised and their issuance concentrated in a limited
number of popular benchmark maturities. Issuance on a regular basis at benchmark
maturities can help create a benchmark yield curve, spur greater investor demand, enhance
market liquidity and lower issuance costs.
Measures to develop the government bond market should place first priority on
developing an effective primary market in short term maturities. Initiatives to deepen the
money market, especially through REPOS can reinforce demand for and liquidity in the
short term of the market. At the early stage of market development, the infrastructure for
trading and settlement should be simple, secure and capable of handling a sufficient
volume of daily transactions. Priority should be given to building a safe spot trading
system, leaving the infrastructure for more advanced transactions (like swaps, futures and
options) for later.
17 IMF and World Bank, 2001 as quoted by V. SUNDARARAJAN in the Financial Markets Development: Sequencing of reforms to ensure stability.
26
Consideration should also be given to the use of Primary Dealers*. Primary Dealers can
greatly facilitate trading, especially in countries where the technological infrastructure is
weak.
*Primary Dealers:
A Primary Dealer (PD) is a financial institution appointed by the Central Bank to exclusively
participate in the primary tender of government and central bank securities. A PD acts as an
intermediary between authorities and other market players. The main objective of setting up a
system of primary dealership is largely to promote the development of a vibrant secondary market
for government and central bank securities.
According to Marco Arnone18 and George Iden, the main purposes of a primary dealer system
include strengthening the primary market by helping to build a stable, dependable source of
demand for securities, by proving liquidity in the secondary market, devoting capital resources to
underwriting (as a proprietary buyer) to absorb an occasional shortfall of liquidity, building
distribution channels (to act as intermediaries) and providing market information, including
prices, volumes and spreads between bids and offers. These objectives in turn, serve the overall
goals of:
i. Lowering the cost and associated risk of servicing the public debt;
ii. Developing financial markets;
iii. Enabling the central bank to use indirect instruments of monetary policy; and
iv. Encouraging savings by providing a relatively risk-free investment with attractive returns.
A well functioning primary dealership arrangement therefore, is critical for the effectiveness of
monetary policy, as well as for government financing requirements. However, by selecting certain
firms as primary dealers and not others, authorities concentrate market activity in a smaller
number of firms, which has both positive and negative implications19. On the positive side,
especially in the early phases of market development, there can be important efficiencies
associated with larger volumes of financial transactions, including automation and more advanced
18 IMF Working Paper (WP/03/45): Primary Dealers in Government Securities: Policy Issues and Selected Countries’ Experience. 19 Idem, page 8.
27
technology, and use of highly skilled personnel. Acquiring these resources has substantial fixed
costs and spreading these costs over a larger volume makes them more economical. In addition,
there are advantages to the debt manager in limiting the number of institutions with which it has
to deal in conducting auctions of government securities. A general benefit of a primary dealer
system is that it reduces both risks and the risk management burden. The quality criteria reduce
credit, execution, settlement and operational risks; and the limited number of dealers makes the
administrative and credit monitoring burden more manageable.
On the other hand, setting up a primary dealer system might lead to:
Limited competition which can contribute to oligopolistic behaviour. The selection can in
some respects run counter to the principle of establishing a level playing field.
The risk that the public may view the primary dealers as possessing an implicit guarantee
by the government. Also, the selected primary dealer might engage in more risky
behaviour believing that the government would not stand by and let it fail. In this regard,
the primary dealer might be induced to take on more risks than it otherwise would.
Since establishing a system of primary dealers has its advantages and disadvantages, the
justification for establishing the system lies on whether the system satisfies the public goals that
might otherwise not be met. One of the main goals is to maintain or enhance the liquidity of the
secondary markets. A liquid market may involve external benefits that accrue to other parties that
are not directly involved in the government securities market.
2.3.4 Corporate Bond and Equity Markets
A Corporate Bond is a debt security issued by a corporation and sold to investors. The backing for
the bond is usually the payment ability of the company, which is typically money to be earned
from future operations. In some cases, the company’s physical assets may be used as collateral for
bonds20. A Corporate bond that matures in less than one year is typically called “Commercial
Paper”.
20 Definition from: www.investopedia.com/terms.
28
The development of a corporate bond market builds on the presence of a strong government bond
market and on the infrastructure created to support government securities. Market efficiency and
integrity hinge critically on transparency in financial information and in market prices.
Authorities responsible for regulating the market should ensure accurate and timely disclosure of
financial information for investors to properly assess issuer creditworthiness, value debt securities
and make informed investment decisions. Similarly, pricing information should be widely
available. A transparent market where pre-trade and post-trade information is disseminated to
traders and investors, lowers spreads, improves efficiency and attracts more participants by
increasing their confidence in pricing process.
Equity21 market is a system through which company shares are traded. The equity market offers
investors an opportunity to participate in a company’s success through an increase in its stock
price. Also known as the stock market, it is one of the most vital areas of a market economy
because it gives companies access to capital and investors a slice of ownership in a company with
the potential to realise gains on its future performance.
Equity markets require strong regulatory frameworks and supportive legal infrastructure. Equity
instruments are private property instruments, which require mechanisms to enforce legal
ownership rights and facilitate ownership transfer. If shares are not fully transferable and
questions of ownership arise, there will be a negative impact on liquidity and the corporate ability
to raise financing.
2.4 Preconditions for Domestic Financial Markets Development
The literature suggests that the development of Financial Markets is facilitated by, among other
things, the sound and sustainable macroeconomic policies, well developed public and market
infrastructures and effective oversight arrangements. A substantial number of authors agree that
sound macroeconomic environment, well developed banking sector, transparent and accountable
institutions and shareholder protection are the necessary preconditions for the efficient
functioning of financial markets especially in Africa.
21 Equity refers to ownership.
29
Sound and Sustainable macroeconomic policies
A stable macroeconomic environment is crucial for the development of the financial markets.
“Low and predictable rates of inflation are more likely to contribute to financial markets
development and economic growth. Both domestic and foreign investors will be unwilling to
invest where there are expectations of high inflation”22.
According to Ananda Slva23, a prudent monetary policy supported by fiscal policy while allowing
appropriate adjustment in exchange rate is important to achieve macro economic stability and
contain inflationary pressures which are fundamental to financial markets development.
“Achieving macroeconomic stability, that is, to maintain the inflation rate, contain high monetary
expansion and the fiscal deficit at sustainable levels are the key prerequisites for the development
of the market, thereby ensuring price stability is crucial in further developing bond market.
Therefore, preparation of a medium term macroeconomic framework supported by fiscal policy is
the most essential to bring the inflation to a sustainable level”. Inflation targeting can improve the
coordination between monetary policy and other macroeconomic policies.
Well developed public and Market infrastructures
The strength of financial markets rests on the strength of their supporting infrastructures. The
design of market infrastructure is a key consideration in developing markets. Distortions and
imperfections in infrastructure can impede and distort the functioning of markets.
SUNDARARAJAN (2003: Page 5) highlights that “Adequate and well enforced contracts,
insolvency procedures, governance structures, accounting and disclosure standards are necessary
to the functioning of financial markets and building confidence in their integrity”.
Effective Oversight arrangements and Reporting Standards
The regulation and supervision of financial markets plays a major role in determining their ability
to attract capital. Investors are either deterred or ask higher returns, from markets which lack
22 IMF Working Paper “Stock Market Development in Sub-Saharan Africa: Critical Issues and Challenges” by Charles Amo Yartey and Charles Komla Adjasi. 23 Bond Market Development: Monetary and Financial System Stability issues-2008
30
transparency and where the enforcement of prudential norms is uncertain or inconsistent. Weak
regulation and supervisory institutions can deter innovation and competition.
Uniform high quality financial reporting standards improve the transparency of financial
information and allow investors and creditors to better understand and price for risk. Globally,
accounting standards are being harmonised around International Financial Reporting Standards
(IFRS). The benefits from IFRS adoption flow from the improved transparency of information
they provide which allows investors and creditors to more accurately assess the condition of a
financial institution or enterprise and, when investing cross-border, to make assessments on the
same financial reporting principles they apply at home, reducing the cost of analysis and
increasing confidence in its results. In a region context, IFRS facilitates the standardisation of
regulatory regimes, financial reporting and tax harmonisation. These developments encourage the
flow of capital within the region and investments from outside the region. Therefore, prudential
regulation and supervision need to be strengthened in line with the growing complexity of
financial markets and risks and the diversity of financial institutions and products. Moreover, the
supervisory framework and enforcement mechanisms are critical source of external discipline on
banks and essential to developing a credit and risk culture in the financial system.
Securities Markets:
Securities markets should play a central role in efficiently mobilising and allocating financial
resources. Well regulated, transparent, liquid and accessible securities markets will permit
investors to identify investment opportunities, permit firms and governments to raise debt and
equity, and provide the means for financial institutions to manage their portfolios and diversify
risk. According to SUNDARARAJAN (2003: Page 5), “shortcomings in monetary policy
instruments and financial markets- including money, foreign exchange and government securities
markets- can impede monetary control by the central bank, price discovery and risk management
by financial and nonfinancial firms and lead to excessive government borrowing from the central
bank”.
31
Payments Systems:
Payments systems play a critical role in the functioning of the financial system, and the costs,
speed, reliability and accessibility of these systems has a major impact on the activities of
business and individuals. High cost, slow, unreliable and difficult to access payments systems
promote the use of cash over electronic payments. Poorly functioning payments systems slow the
development of securities markets by increasing settlement costs, raising the costs attached to
domestic and cross-border trade, and creating high barriers to the development of access to
financial products. The absence of reliable and safe payment settlement arrangements can weaken
monetary control and exacerbate systemic risks. Such arrangements are critical for ensuring
liquidity and the smooth functioning of markets.
Legal Frameworks:
Legal frameworks have an impact on all activities within a financial system. An appropriate legal
framework for issuance and trading of debt instruments is necessary to provide both issuers and
investors with certainty as to obligations, duties and procedure. It provides the basis for regulation
and supervision of the system and governs all aspects of transactions within the system.
Credit Information:
Central banks, supervisory agencies and Finance Ministries rely on financial information to
evaluate and monitor financial sector soundness. Accurate and readily accessible credit
information is required by banks and other lenders to assess correctly the debt capacity and
repayment history of potential borrowers, and it is an important source of support for the
expansion of credit to retail and small business borrowers. As with many forms of financial
information, making credit histories available to banks benefits creditworthy borrowers in three
ways:
1. By increasing the ability of potential creditors to accurately assess their credit risk
profile, borrowers with good credit histories are able to access credit in larger volumes
and at cheaper rates;
2. The automation of credit information allows lenders to reduce their credit processing
costs by employing computerised credit scoring models, in turn allowing reduced rates

32
and broader access as a result of the ability to assess thousands of borrowers
simultaneously at low cost; and
3. Where credit information is either transportable or accessible to all licensed lenders,
access to, and reduced costs for, credit are promoted by intensified competition because
lenders are able to identify and market to potential customers while a borrower’s existing
creditors are unable to restrict competition by denying access to her credit history.
Therefore, the design of the market infrastructure is a key consideration in developing markets.
The design of clearing and settlement systems for securities is a crucial factor in market
development. The development of active money and debt markets requires sound banking
institutions, which can compete effectively in deposits and loan markets through adjustments in
the interest rates and efficient pricing of risks. In addition to their role in money markets, banks
are key players in other financial markets, and their ability to cope with volatility in these markets
can be crucial for both market development and sound banking. A sound banking system will
help to sustain the development of financial markets through its role as market intermediaries,
providers of back-up lines of credit and holders and managers of a portfolio of traded securities.
2.5 Conclusion
Financial markets are understood as encompassing a diversity of institutions from the small-scale
to the formal commercial sector, and increasingly Non-Governmental Organisations (NGO) and
non-bank financial institutions24. They provide a variety of functions including those of savings
mobilisation, the provision of credit and other intermediation functions, money transfers and
payments.
Economic growth in a modern economy hinges on an efficient financial sector that pools
domestic savings and mobilises foreign capital for productive investments. A well-functioning
financial sector contributes to “the maintenance of economic stability; it provides a means of
payment and makes possible secure financial and commercial transactions; it helps to mobilise
24 Journal of African Economies, 1997 : Financial Markets and the Poor.
33
domestic and external savings; and it is crucial for the efficient allocation of capital to productive
investments25”.
The financial market’s contribution to economic growth lies in the central role it plays in
mobilising savings and allocating these resources efficiently to the most productive uses and
investments in the real sectors. Financial markets serve six basic functions26:
Borrowing and Lending: The primary functions of financial institutions are to aggregate
household savings and allocate these funds to investment projects. Financial markets
permit the transfer of funds (purchasing power) from one agent to another for either
investment or consumption purposes. By pooling the savings of many households,
financial intermediaries enable the undertaking of large scale projects. Strong financial
intermediaries lead to better resources allocation.
Price Determination: Financial markets provide vehicles by which prices are set both for
newly issued financial assets and for the existing stock of financial assets.
Information Aggregation and Coordination: Banks collect and produce a large amount
of information. Financial markets act as collectors and aggregators of information about
financial asset values and the flow of funds from lenders to borrowers. This reduces the
intensity of information asymmetry between lenders and borrowers and improves the
allocation of resources.
Risk sharing: Banks and financial intermediaries bring about significant improvements
in risk diversification by supplying a wide array of financial assets with very specific
features. Financial markets allow a transfer of risk from those who undertake investments
to those who provide funds for those investments.
Liquidity: One of the main functions of financial intermediaries is the maturity
transformation of financial assets. The consequent increase in the array of financial assets
stimulates the supply of financial funds and of savings and investments. Financial
markets provide the holders of financial assets with a chance to resell or liquidate these
assets.
25 OECD-Promoting Pro-Poor Growth: Private sector development. Page 54. 26 Frederic S. Mishkin : The Economics of Money, Banking and Financial Markets. 7th Edition, Addison-Wesley, Boston.
34
Efficiency: Financial intermediaries reduce transaction costs and information costs
through the economies of scale involved in their activities. They supply specific services
which reduce frictions and let financial flows move more easily and at lower cost through
the system.
Strong Financial Markets and Institutions play an important role in supporting economic
development, because they enhance the exchange of goods and services, the mobilisation of
resources (both domestic and international), the efficient allocation of factors of production, and
the diversification of risk. At the macro-economic and sector levels, well-functioning financial
markets are essential to broad-based income growth through their role in mobilising scarce capital
from domestic and foreign sources. At the level of individual livelihoods, financial markets play
potentially critical functions: they can be a principal means for the poor to get access to financial
assets; through facilitating savings, they are one of the means of reducing the vulnerability
associated with uneven and unpredictable year-to-year changes in circumstances; and they can
help convert illiquid assets into liquid ones.

35
Chapter Three: Diagnostic analysis of Rwanda’s Financial Sector.
3.1 An Overview:
The Rwanda Financial Sector is relatively still young. The FinScope Technical Report27 of
December 2008 concluded that it is characterised by “an oligopolistic banking sector, with a very
low penetration of insurance services and undiversified financial products”. Although Rwanda
(like most other countries in Sub-Saharan Africa) has made significant progress in the last decade,
it still remains an under-developed, agrarian based economy with around 60%28 of the population
living under poverty line. This chapter will review the recent developments in the financial
market of Rwanda; analyse the nature of intermediation and financial depth as well as the
challenges faced.
3.2 Recent developments in the Financial Sector of Rwanda:
When BNR was set up in May 1964, the financial system in place was still embryonic and could
not adequately meet all financial needs to finance the growing economy. The banking system was
still incapable of making sensible sector-based allocation of the scarce savings and avoiding
excessive monetary creation without clear and precise instructions from the monetary authorities.
Prior to the introduction of the “Structural Adjustment Program” in 1990, the BNR went through
an era of direct control in terms of its monetary policy implementation. It was entitled to
determine a specific amount of credit that banks were supposed to grant to their customers
(setting credit ceiling) and determine credit allocation according to economic activities and
priorities set (selective credit control). The direct monetary policy was perceived inefficient and
its predominance affected not only economic financing conditions but also distorted financial
resource allocation because credit flow was not determined by relative profitability of its use.
However, such a monetary policy remained unchanged till 1990.
In November 1990, Rwanda changed its economic strategy and like most other SSA Countries,
embraced the economic liberalisation program; privatised the financial sector and encouraged 27 In the framework of Financial Sector Development Program (FSDP), Rwanda conducted the first FinScope as one of the implementation steps. 28 Republic of Rwanda: Rwanda vision 2020.

36
market determined prices and entry of foreign players in the market so as to enhance market
competition. The Central Bank Act was revised to ensure its independence to formulate and
implement monetary policy and to enforce financial sector stability market discipline. The
National Bank of Rwanda’s supervisory capacity was strengthened to enhance regulatory
framework and comply with the Basel Principles of effective supervision.
Although the Structural Adjustment Program was adopted in 1990, the financial reform delayed
till 1995. The transformation to monetary policy indirect instruments usually involves two stages:
- A shift from direct instruments towards more reliance on Open-Market Operations in the
primary market; and
- A further shift towards greater use of more fully flexible operations as active secondary
markets develop in more mature financial system.
This second stage requires a developed financial system and a competitive banking system with a
variety of instruments in terms of nature and maturities. Therefore, following the financial
liberalisation in Rwanda, three distinct periods can be identified:
a. Period between 1995 and August 1997: Direct instruments were completely abandoned
but since there was no money market in place, the financial market instruments were very
limited. Only Reserve Requirements and the Refinancing Rate were used to regulate the
liquidity.
b. The period between August 1997 and August 2005: This period was marked by the
establishment of the Money Market and the introduction of some open market
instruments.
c. The period from August 2005 till today: We have seen an introduction of new systems of
interest rates management and further development of monetary policy indirect
instruments.
3.2.1 The Money Market:
The money market in Rwanda exists since September 1997 and BNR used to intervene by
injecting or mopping up excess liquidity so as to control the increase in monetary aggregates.
Every time it deemed necessary and in order to keep the reserve money constantly close to the
desired level, the BNR intervened using different monetary policy instruments and based on the
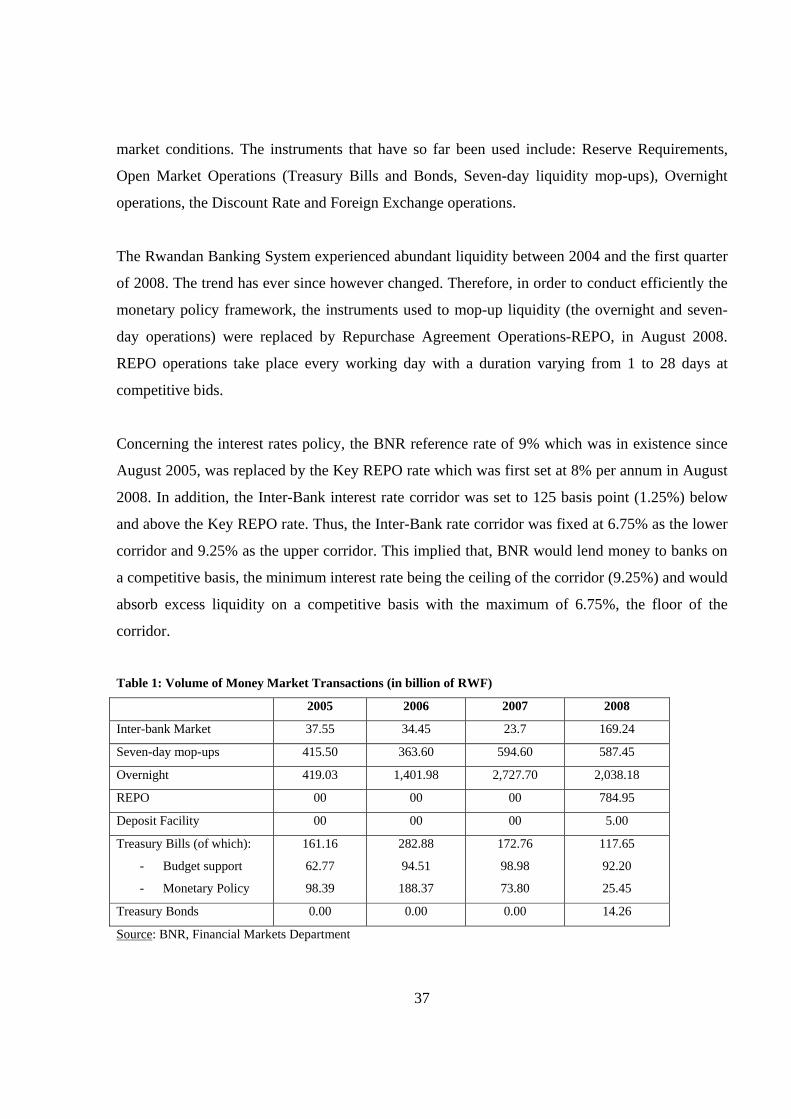
37
market conditions. The instruments that have so far been used include: Reserve Requirements,
Open Market Operations (Treasury Bills and Bonds, Seven-day liquidity mop-ups), Overnight
operations, the Discount Rate and Foreign Exchange operations.
The Rwandan Banking System experienced abundant liquidity between 2004 and the first quarter
of 2008. The trend has ever since however changed. Therefore, in order to conduct efficiently the
monetary policy framework, the instruments used to mop-up liquidity (the overnight and seven-
day operations) were replaced by Repurchase Agreement Operations-REPO, in August 2008.
REPO operations take place every working day with a duration varying from 1 to 28 days at
competitive bids.
Concerning the interest rates policy, the BNR reference rate of 9% which was in existence since
August 2005, was replaced by the Key REPO rate which was first set at 8% per annum in August
2008. In addition, the Inter-Bank interest rate corridor was set to 125 basis point (1.25%) below
and above the Key REPO rate. Thus, the Inter-Bank rate corridor was fixed at 6.75% as the lower
corridor and 9.25% as the upper corridor. This implied that, BNR would lend money to banks on
a competitive basis, the minimum interest rate being the ceiling of the corridor (9.25%) and would
absorb excess liquidity on a competitive basis with the maximum of 6.75%, the floor of the
corridor.
Table 1: Volume of Money Market Transactions (in billion of RWF)
2005 2006 2007 2008
Inter-bank Market 37.55 34.45 23.7 169.24
Seven-day mop-ups 415.50 363.60 594.60 587.45
Overnight 419.03 1,401.98 2,727.70 2,038.18
REPO 00 00 00 784.95
Deposit Facility 00 00 00 5.00
Treasury Bills (of which):
- Budget support
- Monetary Policy
161.16
62.77
98.39
282.88
94.51
188.37
172.76
98.98
73.80
117.65
92.20
25.45
Treasury Bonds 0.00 0.00 0.00 14.26
Source: BNR, Financial Markets Department

38
The interbank market picked momentum in 2008. This had an impact on the overnight operations
which had been on an increase in volume.
Table 2: Evolution of Interest Rates on the Money Market (Annual average percentages)
2005 2006 2007 2008
Deposit Rate 8.67 8.20 7.62 6.02
Lending Rate 15.78 15.87 15.97 16.15
Interbank Rate 8.28 8.26 7.21 7.14
Mop-up Rate 7.36 8.69 6.54 6.08
REPO* Rate - - - 6.50
Central Bank Discount Rate 13.08 12.50 12.50 11.52
Treasury Bills (Weighted) 9.18 9.82 7.46 6.91
Source: BNR, Financial Markets Department
*The REPO operations were introduced in August 2008, replacing the seven-day mop up
operations.
Table 3: Evolution of Broad Money and its components (In billions of RWF)
2005 2006 2007 2008
Narrow Money (M1) 131.8 156.0 217.9 225.7
Broad Money (M2) 246.2 321.0 425.7 466.6
Currency in circulation 47.0 52.7 63.2 80.9
Deposits
Of which:
- Demand deposits
- Time deposits
- FOREX deposits
(equivalent in RWF)
199.2
84.8
70.8
43.7
268.2
103.3
105.8
59.2
362.4
154.7
139.1
68.6
385.6
144.9
158.4
82.3
GDP Evolution (in billion) 1 327.1 1 583.0 1 866.1 2 437.2
Ratio of M2 to GDP 18.55% 20.28% 22.81% 19.14%
Source: BNR, Financial Markets Department.
The ratio M2/GDP measures the overall size of the financial deepening and it is strongly
correlated with both the level and rate of change of the real GDP per capita. An increase in this
ratio signifies that the economy is effective in translating liquidity expansion into output. M2 is
often taken as an adequate measure of the size of the financial sector.

39
3.2.2 The Capital Market:
Within the framework of capital market development, three Government Bonds have so far been
issued, with the aim of supporting the development of capital market in Rwanda. Two 2 year
bonds were issued with periodic interest of 8% and a three year bond pays 8.25%. All these
bonds, totalling 14.257 billion RWF are listed on the Rwanda over the Counter Bond Market
(ROTC).
Table 4: T-Bonds issued as at December 31st 2008. Auction date Amount of the
T-Bond in Rwanda Francs
Offered amount by
Bidders
Retained amount by the Central
Bank
Average price/RWF
100
Interest rate
Maturity
17/01/2008 5 Billion 7.550 Billion 5 Billion 99.951 8% 2 Years 31/01/2008 5 Billion 4.257 Billion 4.257 Billion 99.558 8% 2 Years 28/02/2008 5 Billion 7.227 Billion 5 Billion 99.444 8.25% 3 Years Source: BNR: Department of Financial Markets.
Trading operations commenced on January 31st 2008 and as of June 30th 2009, the ROTC bond
market had transacted a total turnover of 566 million RWF in 52 deals. According to CMAC29,
the two active debt securities so far are the two 2 year Treasury Bonds which are maturing in
January 2010. These Treasury Bonds alone transacted in 47 deals the worth of 484.3 million RWF
at prices ranging between RWF 98.00 and 102.95.
In the same spirit, Commercial Bank of Rwanda (BCR) took advantage of the emerging capital
market and launched a corporate bond programme to finance its mortgage portfolio. The 5 Billion
Rwanda Francs will be issued in series of 1 Billion and it will mature in 2017. As of December
31st 2008, the corporate bond had transacted at 100.25 in three deals worth 150 Million RWF with
periodic interest of 9% per annum.
29 The Capital Market Advisory Council (CMAC) was established by the Prime Minister’s order and it is mainly responsible for providing strategic leadership in the development of Capital Market in Rwanda.

40
Holders of the T-Bonds:
These Bonds are mainly held by the Commercial Banks with 82.8% followed by other financial
institutions with 12.9%.
Amount (RWF) %age Commercial Banks 11 800 940 000 82,77 Other Financial Institutions30 1 839 000 000 12,90 Insurance Companies 350 000 000 2,45
Social Security Fund 267 060 000 1,87 Total 14 257 000 000 100
Others*:
- Rwanda Development Bank - Continental Discount House
3.3 The Foreign Exchange Market:
The financial transactions between Rwanda and foreign countries relating to current and capital
transactions have been liberalised. In conformity with the law n° 11/97 of 26th July 1997, the
BNR organises and supervises the foreign exchange market. Under the terms of this law, the Bank
ensures the control and the supervision of the financial and banking system and in this regard, it
issues licenses to banks and Bureau de Change wishing to deal in foreign exchange.
30 These include the Rwanda Development Bank and the Continental Discount House.
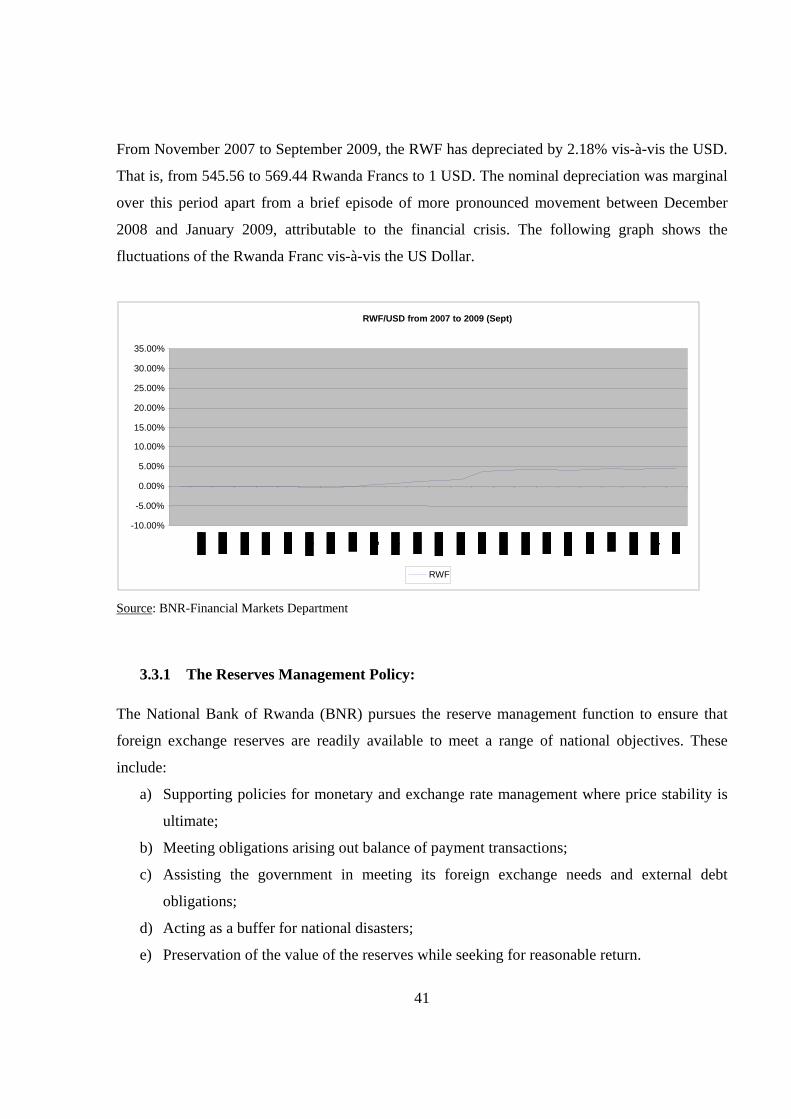
41
From November 2007 to September 2009, the RWF has depreciated by 2.18% vis-à-vis the USD.
That is, from 545.56 to 569.44 Rwanda Francs to 1 USD. The nominal depreciation was marginal
over this period apart from a brief episode of more pronounced movement between December
2008 and January 2009, attributable to the financial crisis. The following graph shows the
fluctuations of the Rwanda Franc vis-à-vis the US Dollar.
Source: BNR-Financial Markets Department
3.3.1 The Reserves Management Policy:
The National Bank of Rwanda (BNR) pursues the reserve management function to ensure that
foreign exchange reserves are readily available to meet a range of national objectives. These
include:
a) Supporting policies for monetary and exchange rate management where price stability is
ultimate;
b) Meeting obligations arising out balance of payment transactions;
c) Assisting the government in meeting its foreign exchange needs and external debt
obligations;
d) Acting as a buffer for national disasters;
e) Preservation of the value of the reserves while seeking for reasonable return.
RWF/USD from 2007 to 2009 (Sept)
-10.00%
-5.00%
0.00%
5.00%
10.00%
15.00%
20.00%
25.00%
30.00%
35.00%
RWF
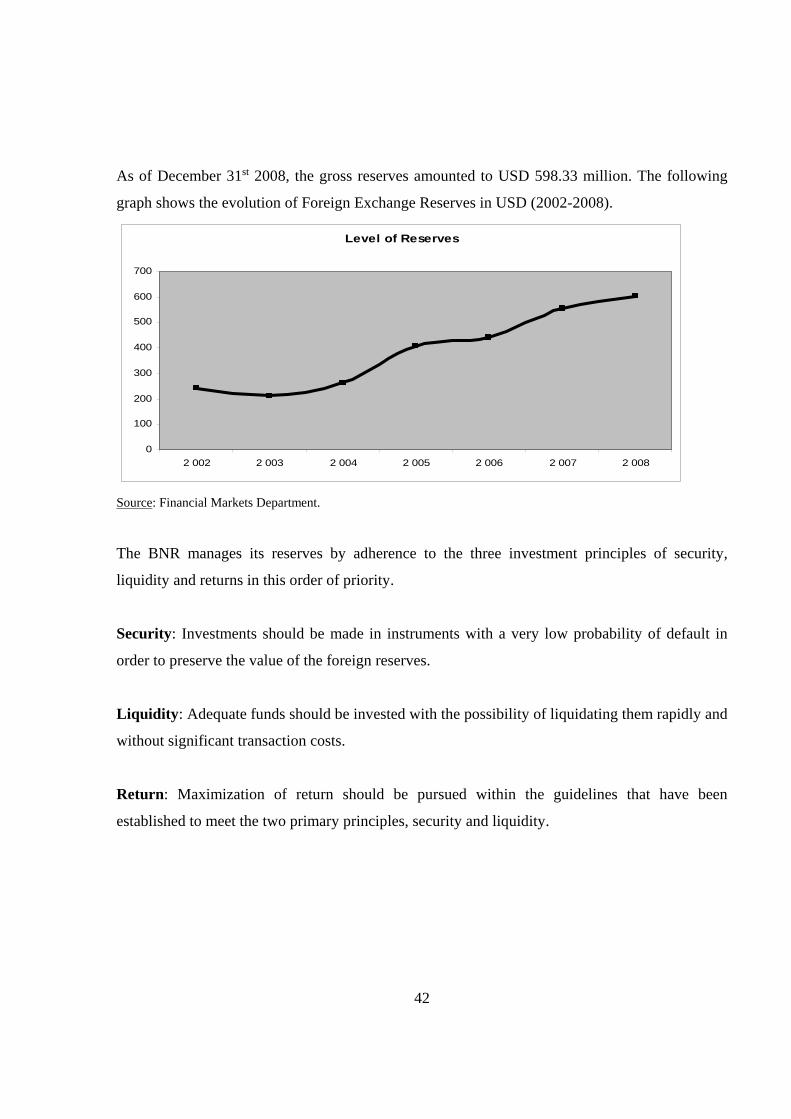
42
As of December 31st 2008, the gross reserves amounted to USD 598.33 million. The following
graph shows the evolution of Foreign Exchange Reserves in USD (2002-2008).
Level of Reserves
0
100
200
300
400
500
600
700
2 002 2 003 2 004 2 005 2 006 2 007 2 008
Source: Financial Markets Department.
The BNR manages its reserves by adherence to the three investment principles of security,
liquidity and returns in this order of priority.
Security: Investments should be made in instruments with a very low probability of default in
order to preserve the value of the foreign reserves.
Liquidity: Adequate funds should be invested with the possibility of liquidating them rapidly and
without significant transaction costs.
Return: Maximization of return should be pursued within the guidelines that have been
established to meet the two primary principles, security and liquidity.

43
3.3.2 Investment strategy:
The investment strategy consists of the allocation of the foreign exchange reserves into two
separate portfolios: the liquidity and investment portfolios, each with a particular objective, size,
benchmark and duration.
The Liquidity portfolio:
The purpose of the liquidity portfolio is to meet the short term transaction requirements by the
bank. It is invested in such a way that it can be available or used at short notice. This implies that
about half of the liquidity portfolio should be invested in tradable money market instruments
that can be liquidated at spot value (two days), without incurring any transaction costs.
The size of the liquidity portfolio should be 2/3 of the total reserves. The liquidity portfolio is
initially divided into two parts:
- 1/2 minimum liquidity
- 1/2 liquidity buffer
Over time, the size of the liquidity buffer does vary. However, when the liquidity buffer is fully
exhausted and a further fall in reserves reduces the size of the minimum liquidity portfolio, a part
of the investment portfolio is liquidated to replenish the minimum liquidity portfolio. Likewise,
when the size of the liquidity buffer exceeds the predetermined minimum level, the surplus is
transferred back to the investment portfolio.
Benchmark: The liquidity portfolio benchmark is one month market index (1 month libid31).
Duration: The duration of the liquidity portfolio is one month and must be maintained in a range
of 0 to 2 months around the benchmark.
31 Libid: London Inter-bank Bid Rate
44
3.3.3 The Investment portfolio:
The objective of the investment portfolio is to enhance the total return of the reserves by
outperforming the benchmark within the acceptable risk parameters. Part of the investment
portfolio has been entrusted to external managers32 in order to enhance the return and to share
their expertise and skills in fund management. The size of the investment portfolio is 1/3 of the
total reserves and the benchmark is 3 months money market index (3 months US Treasury Bill),
with an option to higher benchmark (6 months money market index). The duration of the
investment portfolio benchmark is 3 months. The permissible range is 0 to 36 months.
Risk parameters:
Minimum of 50% of reserves must be invested in AAA Sovereign assets and supranational
organisations. The maximum to be invested in any single central bank or supranational should not
exceed 1/3 of the total reserves. Exposure to private credit risk must not exceed 50% of reserves.
The maximum amount to be deposited with any single private bank should not exceed 10% of the
total reserves.
The minimum long term acceptable credit rating is AA- (Standard & Poor), Aa3 (Moody) and
AA- (Fitch). The minimum short term acceptable credit rating is A-2 (Standard & Poor), P-2
(Moody) and F-2 (Fitch).
3.4 Remittance flows from the Diaspora
Many families in the developing world depend on funds sent to them by migrant relatives
working abroad. This is fast becoming a big source of live hood to cover day to day living,
construct residential housing and often make small investments. A remittance is basically a
person to person transfer of funds of relatively low value and can be domestic or international. In
economies with a lot of rural-urban migration, funds flowing from urban places to rural areas are
remittances and the international remittances involve cross-border person to person payments.
32 External fund managers must have adequate internal ethical guidelines for their own activities and be members of Financial Services Authority for those based in UK or any other regulatory authority for those based in Europe and members of Security and Exchange Commission for those based in USA.
45
Due to the rapid growth in the need for remittance services by Rwandans in the country and the
Diaspora, the BNR has focused on the role of overseeing the remittances service providers;
including licensing. This is done in line with the international General Principles for remittances.
These principles are: Transparency and consumer protection; Payment System infrastructure;
Legal and regulatory environment; Market structure and competition; and finally, Governance and
risk management.
Unquestionably, the remittance flows to Rwanda by Rwandans in the Diaspora have increased
tremendously and the table below clearly depicts this situation in Millions of US Dollars.
2006 2007 2008 2009 Remittances 63.87
103.03
139.89
129.63 (end September)
Over the past two years, the BNR has worked on putting in place an enabling regulatory
framework for remittances majorly, to increase competition, reduce the costs/price and ensure
access to such services.
i. The Central Bank law was amended to give power to the Central Bank to
regulate and supervise payment systems/services of which remittances are part
and parcel;
ii. The payment systems law was drafted and was passed by Parliament, which
defines remittances as part of payment services;
iii. The Payment Services Regulation was passed. This regulation removes the
exclusive contracts that Western Union and Money Gram impose on the banks.
The regulation goes further to allow the Central Bank to license “stand alone” remittance
companies and mobile payment services. The regulation also allows Microfinance Institutions to
partner with any company to offer remittance services and sets the criteria for licensing. This is
geared towards increasing competition and lowering the price for remitting money back home,
which has been a hindrance to the Rwandan Diaspora.
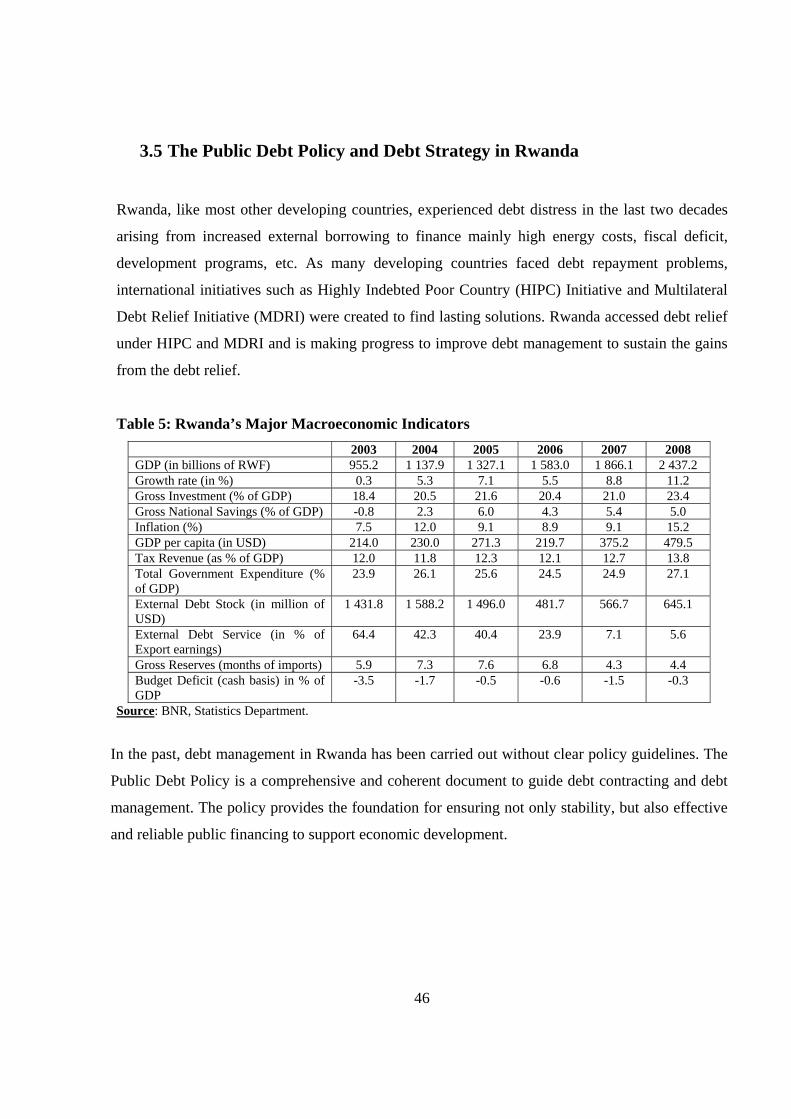
46
3.5 The Public Debt Policy and Debt Strategy in Rwanda
Rwanda, like most other developing countries, experienced debt distress in the last two decades
arising from increased external borrowing to finance mainly high energy costs, fiscal deficit,
development programs, etc. As many developing countries faced debt repayment problems,
international initiatives such as Highly Indebted Poor Country (HIPC) Initiative and Multilateral
Debt Relief Initiative (MDRI) were created to find lasting solutions. Rwanda accessed debt relief
under HIPC and MDRI and is making progress to improve debt management to sustain the gains
from the debt relief.
Table 5: Rwanda’s Major Macroeconomic Indicators
2003 2004 2005 2006 2007 2008 GDP (in billions of RWF) 955.2 1 137.9 1 327.1 1 583.0 1 866.1 2 437.2 Growth rate (in %) 0.3 5.3 7.1 5.5 8.8 11.2 Gross Investment (% of GDP) 18.4 20.5 21.6 20.4 21.0 23.4 Gross National Savings (% of GDP) -0.8 2.3 6.0 4.3 5.4 5.0 Inflation (%) 7.5 12.0 9.1 8.9 9.1 15.2 GDP per capita (in USD) 214.0 230.0 271.3 219.7 375.2 479.5 Tax Revenue (as % of GDP) 12.0 11.8 12.3 12.1 12.7 13.8 Total Government Expenditure (% of GDP)
23.9 26.1 25.6 24.5 24.9 27.1
External Debt Stock (in million of USD)
1 431.8 1 588.2 1 496.0 481.7 566.7 645.1
External Debt Service (in % of Export earnings)
64.4 42.3 40.4 23.9 7.1 5.6
Gross Reserves (months of imports) 5.9 7.3 7.6 6.8 4.3 4.4 Budget Deficit (cash basis) in % of GDP
-3.5 -1.7 -0.5 -0.6 -1.5 -0.3
Source: BNR, Statistics Department.
In the past, debt management in Rwanda has been carried out without clear policy guidelines. The
Public Debt Policy is a comprehensive and coherent document to guide debt contracting and debt
management. The policy provides the foundation for ensuring not only stability, but also effective
and reliable public financing to support economic development.
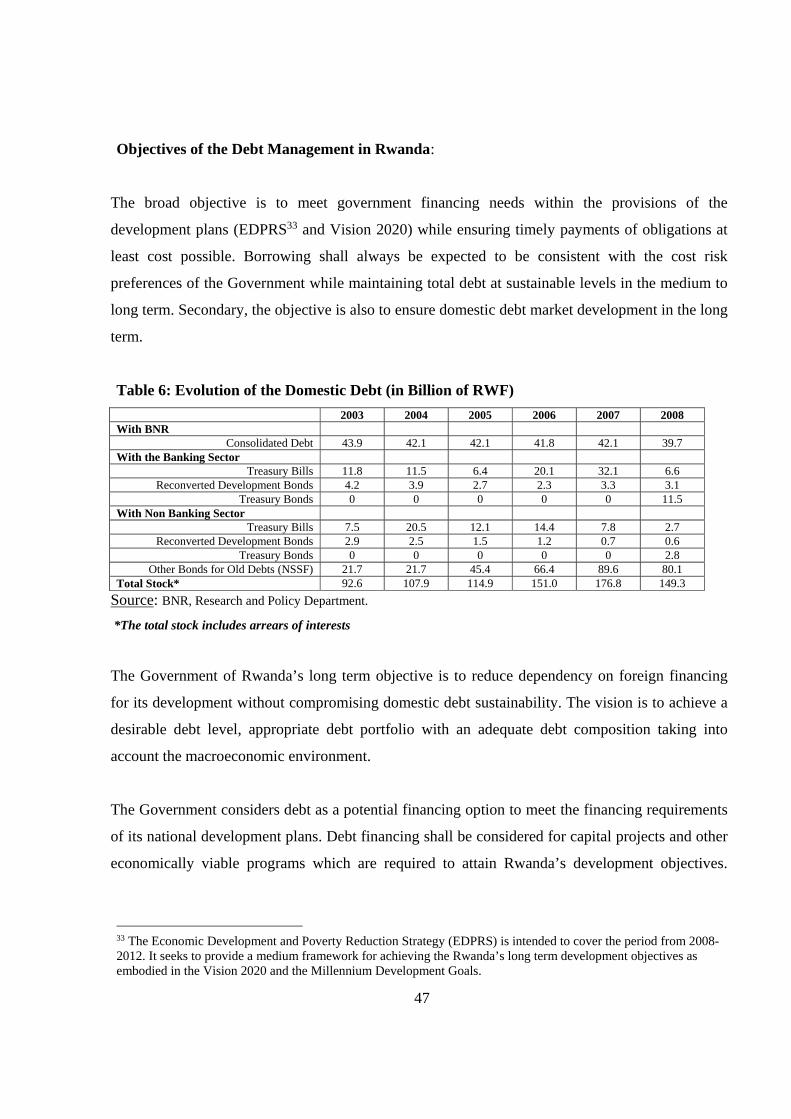
47
Objectives of the Debt Management in Rwanda:
The broad objective is to meet government financing needs within the provisions of the
development plans (EDPRS33 and Vision 2020) while ensuring timely payments of obligations at
least cost possible. Borrowing shall always be expected to be consistent with the cost risk
preferences of the Government while maintaining total debt at sustainable levels in the medium to
long term. Secondary, the objective is also to ensure domestic debt market development in the long
term.
Table 6: Evolution of the Domestic Debt (in Billion of RWF)
2003 2004 2005 2006 2007 2008 With BNR
Consolidated Debt 43.9 42.1 42.1 41.8 42.1 39.7 With the Banking Sector
Treasury Bills 11.8 11.5 6.4 20.1 32.1 6.6 Reconverted Development Bonds 4.2 3.9 2.7 2.3 3.3 3.1
Treasury Bonds 0 0 0 0 0 11.5 With Non Banking Sector
Treasury Bills 7.5 20.5 12.1 14.4 7.8 2.7 Reconverted Development Bonds 2.9 2.5 1.5 1.2 0.7 0.6
Treasury Bonds 0 0 0 0 0 2.8 Other Bonds for Old Debts (NSSF) 21.7 21.7 45.4 66.4 89.6 80.1
Total Stock* 92.6 107.9 114.9 151.0 176.8 149.3
Source: BNR, Research and Policy Department.
*The total stock includes arrears of interests
The Government of Rwanda’s long term objective is to reduce dependency on foreign financing
for its development without compromising domestic debt sustainability. The vision is to achieve a
desirable debt level, appropriate debt portfolio with an adequate debt composition taking into
account the macroeconomic environment.
The Government considers debt as a potential financing option to meet the financing requirements
of its national development plans. Debt financing shall be considered for capital projects and other
economically viable programs which are required to attain Rwanda’s development objectives.
33 The Economic Development and Poverty Reduction Strategy (EDPRS) is intended to cover the period from 2008-2012. It seeks to provide a medium framework for achieving the Rwanda’s long term development objectives as embodied in the Vision 2020 and the Millennium Development Goals.
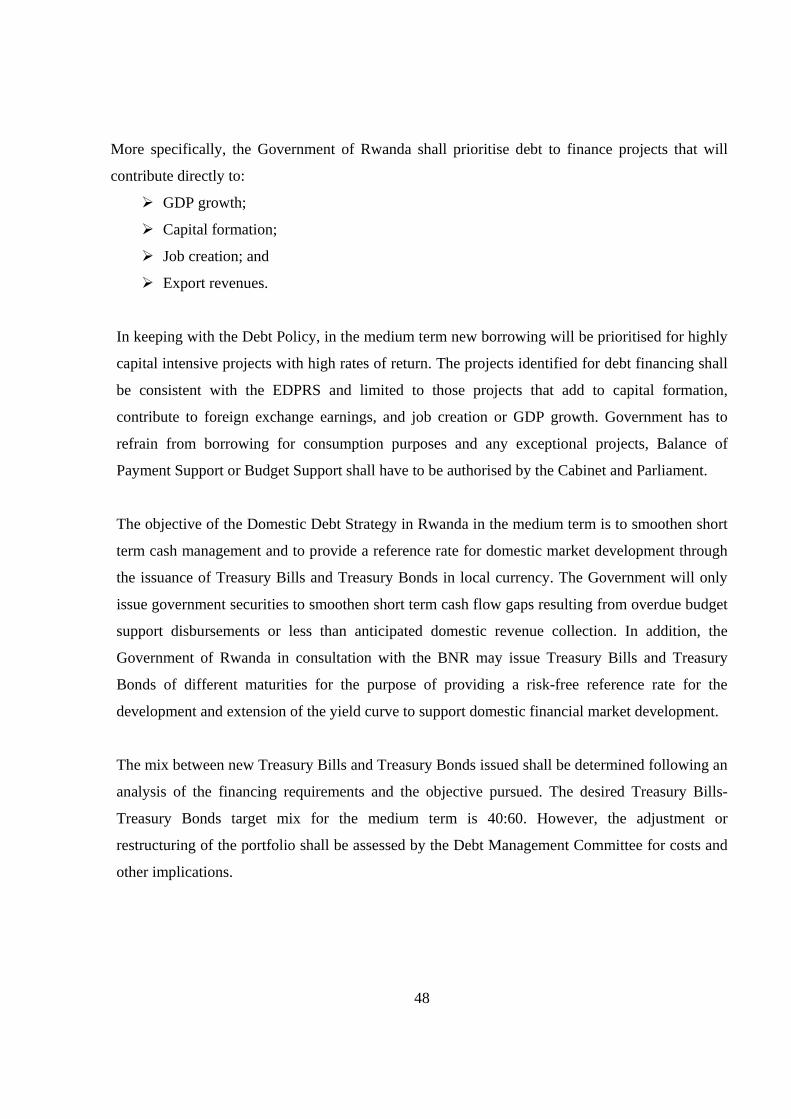
48
More specifically, the Government of Rwanda shall prioritise debt to finance projects that will
contribute directly to:
GDP growth;
Capital formation;
Job creation; and
Export revenues.
In keeping with the Debt Policy, in the medium term new borrowing will be prioritised for highly
capital intensive projects with high rates of return. The projects identified for debt financing shall
be consistent with the EDPRS and limited to those projects that add to capital formation,
contribute to foreign exchange earnings, and job creation or GDP growth. Government has to
refrain from borrowing for consumption purposes and any exceptional projects, Balance of
Payment Support or Budget Support shall have to be authorised by the Cabinet and Parliament.
The objective of the Domestic Debt Strategy in Rwanda in the medium term is to smoothen short
term cash management and to provide a reference rate for domestic market development through
the issuance of Treasury Bills and Treasury Bonds in local currency. The Government will only
issue government securities to smoothen short term cash flow gaps resulting from overdue budget
support disbursements or less than anticipated domestic revenue collection. In addition, the
Government of Rwanda in consultation with the BNR may issue Treasury Bills and Treasury
Bonds of different maturities for the purpose of providing a risk-free reference rate for the
development and extension of the yield curve to support domestic financial market development.
The mix between new Treasury Bills and Treasury Bonds issued shall be determined following an
analysis of the financing requirements and the objective pursued. The desired Treasury Bills-
Treasury Bonds target mix for the medium term is 40:60. However, the adjustment or
restructuring of the portfolio shall be assessed by the Debt Management Committee for costs and
other implications.

49
3.6 The scale of financial depth in Rwanda
In order to understand the scale of the financial depth in Rwanda, we need to review the key
anchors of the financial sector development. In this study, we shall limit ourselves to the
following areas:
(i) Macroeconomic Stability;
(ii) Banking and access to credit;
(iii) Contractual savings regulation (pensions and insurance); and
(iv) Payments systems.
3.6.1 Macroeconomic stability
From 1995, The Government of Rwanda supported by its development partners has been
implementing fundamental economic and financial reforms which allowed progressive building
up of a sustained macroeconomic stability. This was in response to the key objective of achieving
high economic growth and substantial poverty reduction in Rwanda.
The macroeconomic stability has been enhanced during the last 5 years, thanks particularly to a
credible monetary policy along with supporting fiscal management and ongoing financial
reforms. Rwanda’s Real GDP has grown on annual average by 7.9%, the inflation maintained at
acceptable levels and the external position remained viable with a positive balance of payments
and sufficient reserves representing around 6 months of imports of goods and service on annual
average. Fiscal balance improved as investments contributed to growth and increase in tax
revenues. It is also important to note that Rwanda reached the completion point in 2005 under the
HIPC initiatives which resulted in the cancellation of most of Rwanda’s external debt. This
achievement increased markedly Government expenditures on health, education, and other social
services which have a tangible impact on poverty. The fiscal management has been conducted in a
manner that avoids inflationary pressures or crowding out of the private sector.
In fact, during the last 5 years, as a result of efficient and well coordinated monetary and fiscal
policies supported by relatively high external capital inflows, the Government of Rwanda
managed to compensate the country’s weak financial depth and low domestic savings
mobilization and achieved high economic growth and maintained the macroeconomic stability.
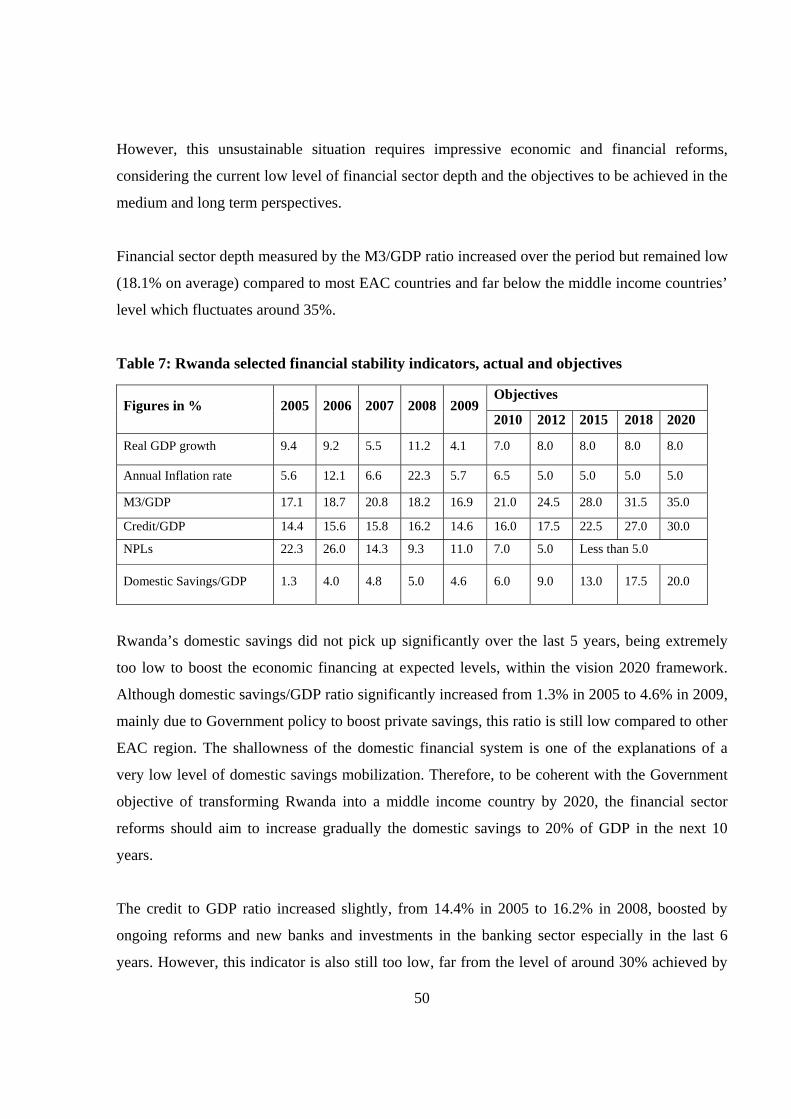
50
However, this unsustainable situation requires impressive economic and financial reforms,
considering the current low level of financial sector depth and the objectives to be achieved in the
medium and long term perspectives.
Financial sector depth measured by the M3/GDP ratio increased over the period but remained low
(18.1% on average) compared to most EAC countries and far below the middle income countries’
level which fluctuates around 35%.
Table 7: Rwanda selected financial stability indicators, actual and objectives
Figures in % 2005 2006 2007 2008 2009 Objectives
2010 2012 2015 2018 2020
Real GDP growth 9.4 9.2 5.5 11.2 4.1 7.0 8.0 8.0 8.0 8.0
Annual Inflation rate 5.6 12.1 6.6 22.3 5.7 6.5 5.0 5.0 5.0 5.0
M3/GDP 17.1 18.7 20.8 18.2 16.9 21.0 24.5 28.0 31.5 35.0
Credit/GDP 14.4 15.6 15.8 16.2 14.6 16.0 17.5 22.5 27.0 30.0
NPLs 22.3 26.0 14.3 9.3 11.0 7.0 5.0 Less than 5.0
Domestic Savings/GDP 1.3 4.0 4.8 5.0 4.6 6.0 9.0 13.0 17.5 20.0
Rwanda’s domestic savings did not pick up significantly over the last 5 years, being extremely
too low to boost the economic financing at expected levels, within the vision 2020 framework.
Although domestic savings/GDP ratio significantly increased from 1.3% in 2005 to 4.6% in 2009,
mainly due to Government policy to boost private savings, this ratio is still low compared to other
EAC region. The shallowness of the domestic financial system is one of the explanations of a
very low level of domestic savings mobilization. Therefore, to be coherent with the Government
objective of transforming Rwanda into a middle income country by 2020, the financial sector
reforms should aim to increase gradually the domestic savings to 20% of GDP in the next 10
years.
The credit to GDP ratio increased slightly, from 14.4% in 2005 to 16.2% in 2008, boosted by
ongoing reforms and new banks and investments in the banking sector especially in the last 6
years. However, this indicator is also still too low, far from the level of around 30% achieved by

51
middle income countries. During the past years, higher spread between lending and deposit rates
remained one of the key challenges for the private sector access to credit. Interest rates in
commercial banks were characterized by an upward trend resulting in uncertainties in the credit
markets, on both demand and supply sides, as the nonperforming portfolio was quite high but on
declining trend. With the development of the financial sector, banks became more aggressive in
deposits collection and increased deposit interest rates to reach 7.9% on average and positive real
interest rates have been achieved since last year following the declining inflation rate in Rwanda.
However, lending rates have also been increasing during the last 5 years (16.1% on average),
Exchange rate in Rwanda is market driven; the BNR interventions are made depending on
developments in market conditions, with the objective of smoothening the nominal exchange rate.
Exchange rate of Rwandan Franc against US Dollar depreciated at the beginning of the decade
due to the insufficient level of foreign assets in the banking system and then appreciated
following the social and political stability experienced since 2004 accompanied by the scaling up
of external foreign exchange in terms of budget support, export earnings and other private
inflows, driven by FDI and remittances.
FRW nominal exchange rate against regional currencies and USD
The real effective exchange rate (REER) behaved in a similar manner as the nominal exchange
rate. While it depreciated during the first half of the last decade, the REER was on appreciating
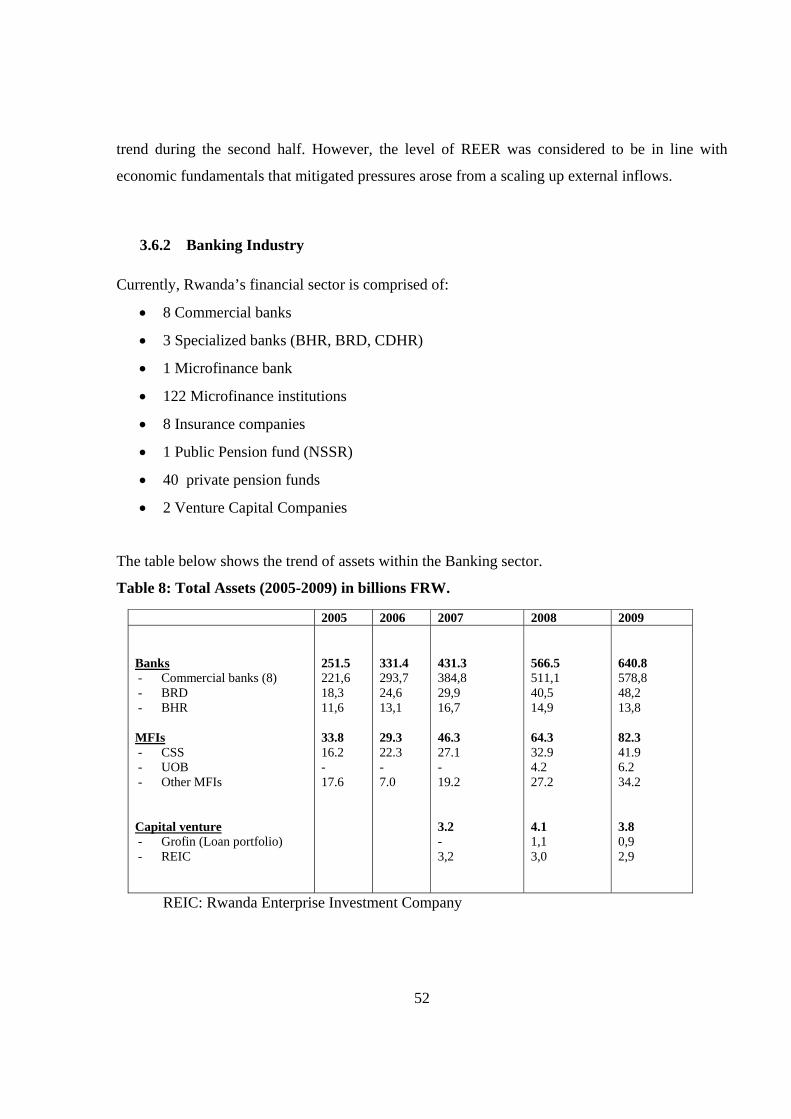
52
trend during the second half. However, the level of REER was considered to be in line with
economic fundamentals that mitigated pressures arose from a scaling up external inflows.
3.6.2 Banking Industry
Currently, Rwanda’s financial sector is comprised of:
8 Commercial banks
3 Specialized banks (BHR, BRD, CDHR)
1 Microfinance bank
122 Microfinance institutions
8 Insurance companies
1 Public Pension fund (NSSR)
40 private pension funds
2 Venture Capital Companies
The table below shows the trend of assets within the Banking sector.
Table 8: Total Assets (2005-2009) in billions FRW.
2005 2006 2007 2008 2009 Banks - Commercial banks (8) - BRD - BHR MFIs - CSS - UOB - Other MFIs Capital venture - Grofin (Loan portfolio) - REIC
251.5 221,6 18,3 11,6 33.8 16.2 - 17.6
331.4 293,7 24,6 13,1 29.3 22.3 - 7.0
431.3 384,8 29,9 16,7 46.3 27.1 - 19.2 3.2 - 3,2
566.5 511,1 40,5 14,9 64.3 32.9 4.2 27.2 4.1 1,1 3,0
640.8 578,8 48,2 13,8 82.3 41.9 6.2 34.2 3.8 0,9 2,9
REIC: Rwanda Enterprise Investment Company
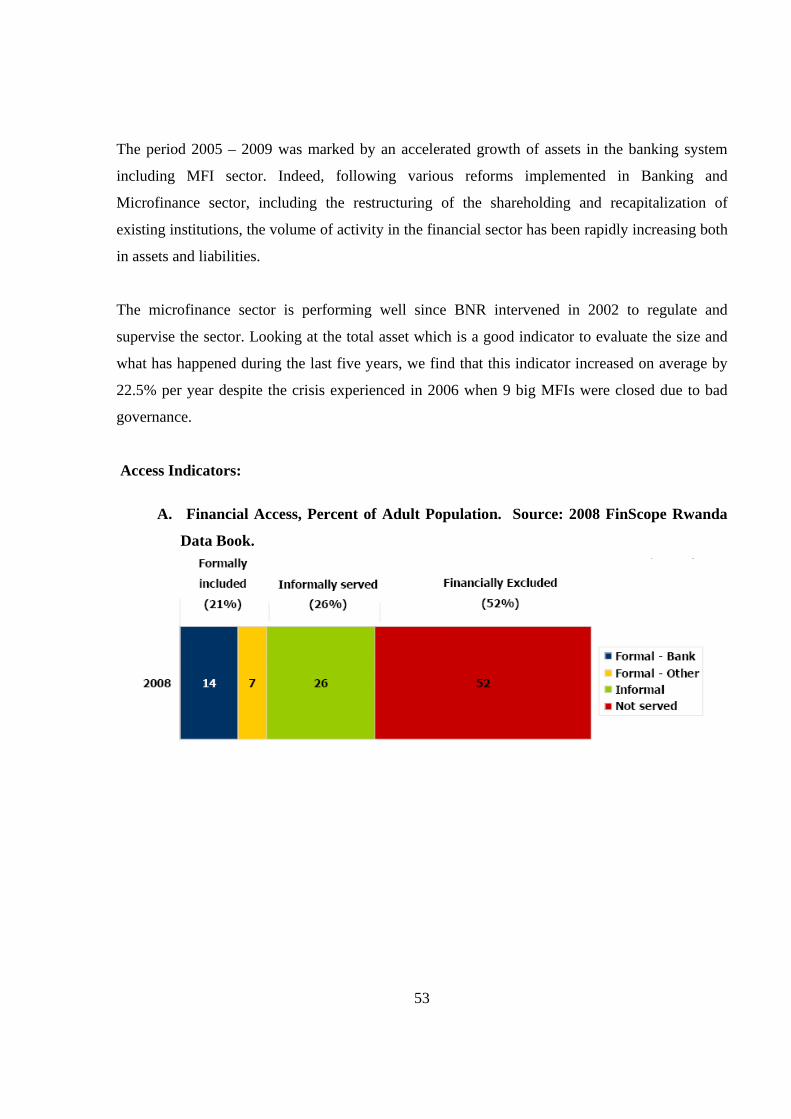
53
The period 2005 – 2009 was marked by an accelerated growth of assets in the banking system
including MFI sector. Indeed, following various reforms implemented in Banking and
Microfinance sector, including the restructuring of the shareholding and recapitalization of
existing institutions, the volume of activity in the financial sector has been rapidly increasing both
in assets and liabilities.
The microfinance sector is performing well since BNR intervened in 2002 to regulate and
supervise the sector. Looking at the total asset which is a good indicator to evaluate the size and
what has happened during the last five years, we find that this indicator increased on average by
22.5% per year despite the crisis experienced in 2006 when 9 big MFIs were closed due to bad
governance.
Access Indicators:
A. Financial Access, Percent of Adult Population. Source: 2008 FinScope Rwanda
Data Book.
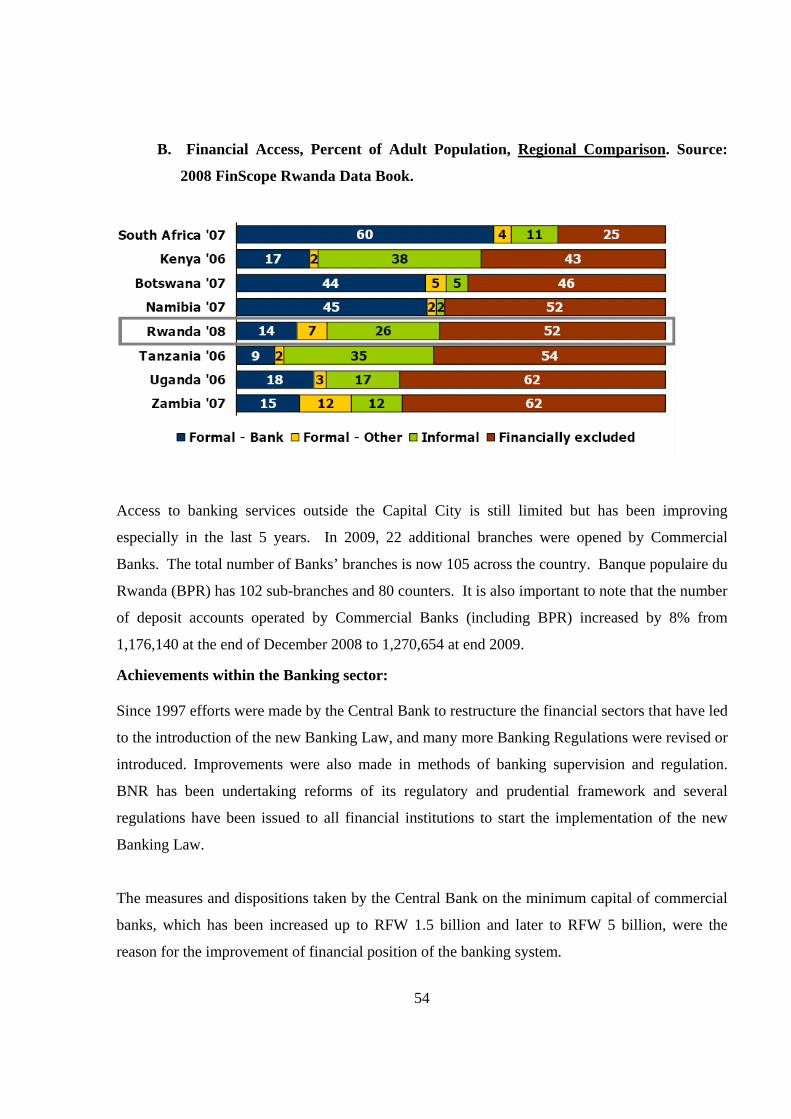
54
B. Financial Access, Percent of Adult Population, Regional Comparison. Source:
2008 FinScope Rwanda Data Book.
Access to banking services outside the Capital City is still limited but has been improving
especially in the last 5 years. In 2009, 22 additional branches were opened by Commercial
Banks. The total number of Banks’ branches is now 105 across the country. Banque populaire du
Rwanda (BPR) has 102 sub-branches and 80 counters. It is also important to note that the number
of deposit accounts operated by Commercial Banks (including BPR) increased by 8% from
1,176,140 at the end of December 2008 to 1,270,654 at end 2009.
Achievements within the Banking sector: Since 1997 efforts were made by the Central Bank to restructure the financial sectors that have led
to the introduction of the new Banking Law, and many more Banking Regulations were revised or
introduced. Improvements were also made in methods of banking supervision and regulation.
BNR has been undertaking reforms of its regulatory and prudential framework and several
regulations have been issued to all financial institutions to start the implementation of the new
Banking Law.
The measures and dispositions taken by the Central Bank on the minimum capital of commercial
banks, which has been increased up to RFW 1.5 billion and later to RFW 5 billion, were the
reason for the improvement of financial position of the banking system.

55
The banks restructuring was accelerated as well with the acquisition of 90% of BCDI by Ecobank
in 2007, the acquisition of 75% of BANCOR share capital by ACCESS BANK from NIGERIA in
2008, the acquisition of 40% COGEBANQUE share capital by a group of three institutional
investors (BIO, AFRINCINVEST and CAPITAL SHORE) in 2008 and the launch of Kenya
Commercial Bank Rwanda in 2009.
In addition, the “Banques Populaires” network was upgraded from a microfinance institution to a
commercial bank in 2008 with the participation of a strategic investor, RABOBANK, who
currently holds 35% of BPR share capital.
These restructuring followed earlier investments (due to privatization) in BCR and Bacar (now
Fina Bank) with the takeover of Actis and Fina Bank, Kenya respectively in 2004.
Challenges to Banking and Access to credit
The key challenges include:
1. How to improve quickly the access indicators to be close to middle income counties.
2. Resource mismatch to finance increasing demand for investment:
o The banks’ resources are mainly short term;
o Low domestic saving mobilization; and
o Low external saving mobilization.
3. High interest rate spread (8.5%) due to:
a. High risk premium as the size of NPL is high (11% end 2009);
b. High unit cost due to small size of income generating assets; and
c. High and volatile inflation rates.
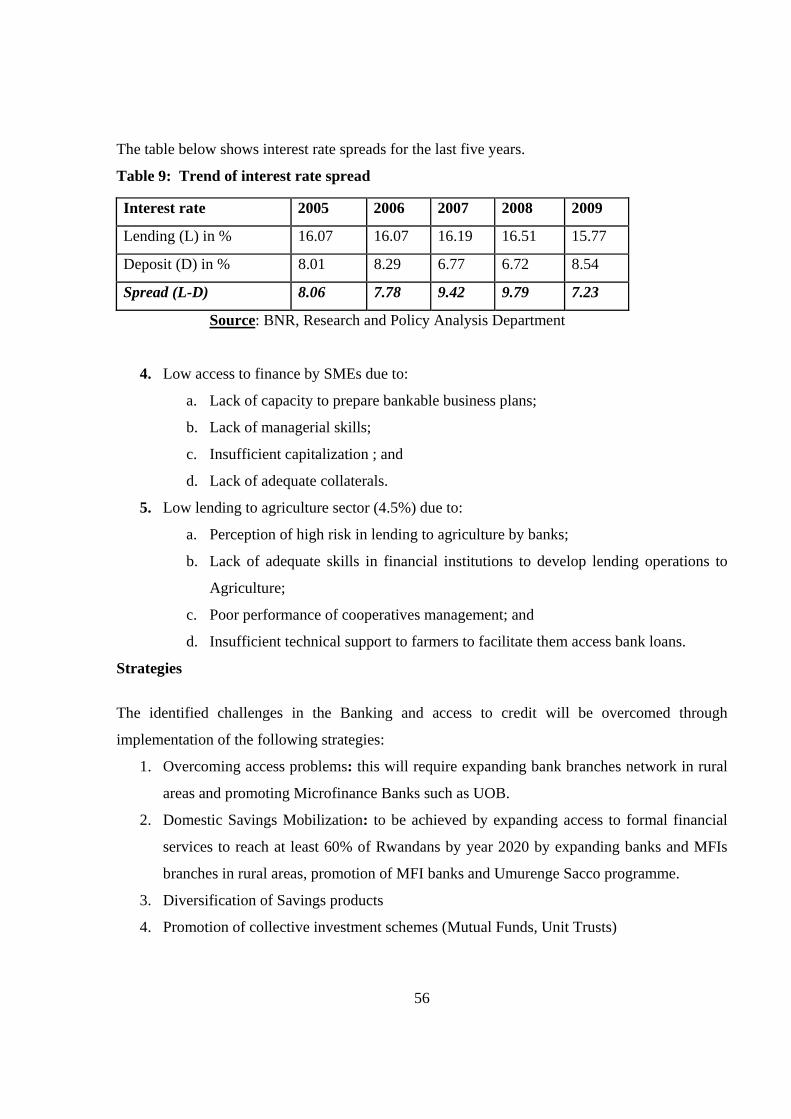
56
The table below shows interest rate spreads for the last five years.
Table 9: Trend of interest rate spread
Interest rate 2005 2006 2007 2008 2009
Lending (L) in % 16.07 16.07 16.19 16.51 15.77
Deposit (D) in % 8.01 8.29 6.77 6.72 8.54
Spread (L-D) 8.06 7.78 9.42 9.79 7.23
Source: BNR, Research and Policy Analysis Department
4. Low access to finance by SMEs due to:
a. Lack of capacity to prepare bankable business plans;
b. Lack of managerial skills;
c. Insufficient capitalization ; and
d. Lack of adequate collaterals.
5. Low lending to agriculture sector (4.5%) due to:
a. Perception of high risk in lending to agriculture by banks;
b. Lack of adequate skills in financial institutions to develop lending operations to
Agriculture;
c. Poor performance of cooperatives management; and
d. Insufficient technical support to farmers to facilitate them access bank loans.
Strategies
The identified challenges in the Banking and access to credit will be overcomed through
implementation of the following strategies:
1. Overcoming access problems: this will require expanding bank branches network in rural
areas and promoting Microfinance Banks such as UOB.
2. Domestic Savings Mobilization: to be achieved by expanding access to formal financial
services to reach at least 60% of Rwandans by year 2020 by expanding banks and MFIs
branches in rural areas, promotion of MFI banks and Umurenge Sacco programme.
3. Diversification of Savings products
4. Promotion of collective investment schemes (Mutual Funds, Unit Trusts)
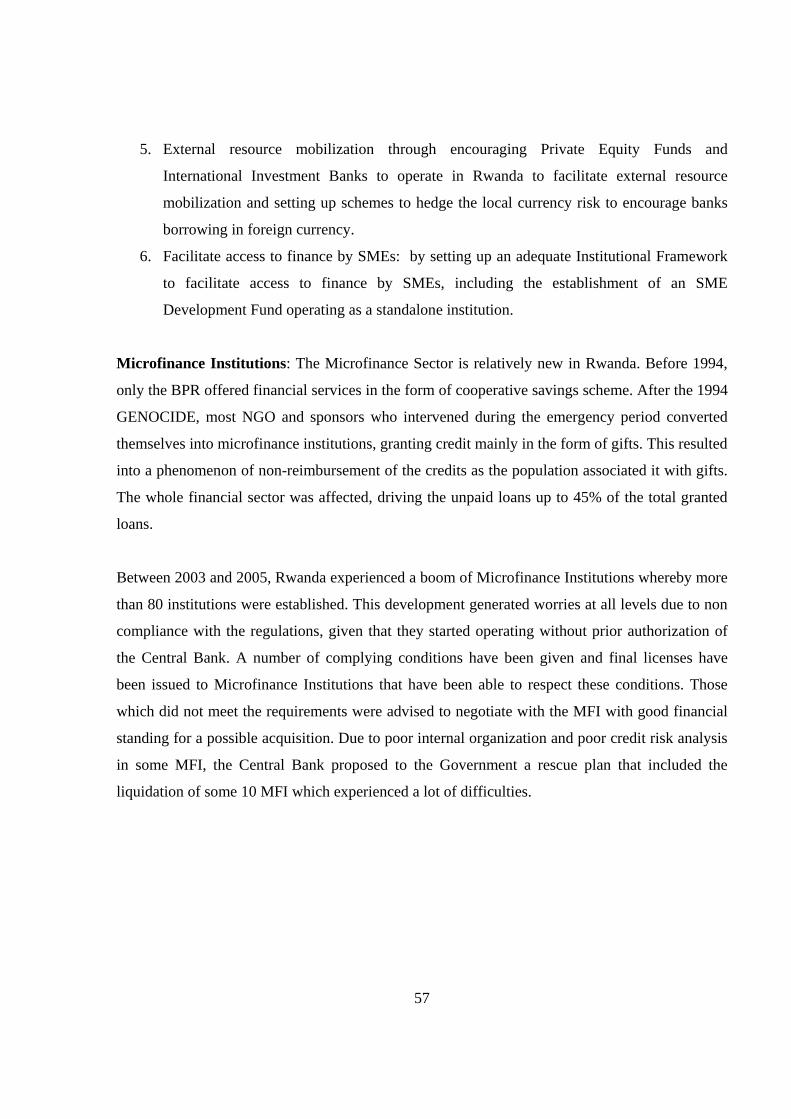
57
5. External resource mobilization through encouraging Private Equity Funds and
International Investment Banks to operate in Rwanda to facilitate external resource
mobilization and setting up schemes to hedge the local currency risk to encourage banks
borrowing in foreign currency.
6. Facilitate access to finance by SMEs: by setting up an adequate Institutional Framework
to facilitate access to finance by SMEs, including the establishment of an SME
Development Fund operating as a standalone institution.
Microfinance Institutions: The Microfinance Sector is relatively new in Rwanda. Before 1994,
only the BPR offered financial services in the form of cooperative savings scheme. After the 1994
GENOCIDE, most NGO and sponsors who intervened during the emergency period converted
themselves into microfinance institutions, granting credit mainly in the form of gifts. This resulted
into a phenomenon of non-reimbursement of the credits as the population associated it with gifts.
The whole financial sector was affected, driving the unpaid loans up to 45% of the total granted
loans.
Between 2003 and 2005, Rwanda experienced a boom of Microfinance Institutions whereby more
than 80 institutions were established. This development generated worries at all levels due to non
compliance with the regulations, given that they started operating without prior authorization of
the Central Bank. A number of complying conditions have been given and final licenses have
been issued to Microfinance Institutions that have been able to respect these conditions. Those
which did not meet the requirements were advised to negotiate with the MFI with good financial
standing for a possible acquisition. Due to poor internal organization and poor credit risk analysis
in some MFI, the Central Bank proposed to the Government a rescue plan that included the
liquidation of some 10 MFI which experienced a lot of difficulties.
58
Table 10: MFI Consolidated financial situation as at December 31st 2008
Total Assets (in billion RWF) 60.950
Total Deposits (in billion RWF) 39.156
Loans (net amount) in billion RWF 41.088
Non-Performing loans (in billion RWF) 2.259
Provisions (in billion RWF) 1.136
Cash (on hand and held in banks) 10.065
Equity (subsidies included) in billion of
RWF
16.731
Source: BNR, Supervision of Microfinance Institution Department.
It should be noted that 61% of the total deposits and 59% of the total loans are found in a single
Microfinance- the Credit and Savings Society (CSS). Its deposits and loans amounted to RWF
24.1 and 24.9 billion respectively. Regarding the total assets, CSS holds 50% of the entire MFI
system. In terms of outreach, the number of beneficiaries of financial services provided by MFI is
estimated at 665 thousand as at December 31st 2008.
In order to supervise the microfinance sector more efficiently, in 2009 the Central Bank
transformed the Division in charge of Supervision of SACCOs and other MFIs into a full
Department called “Microfinance Supervision Department” within the Financial Stability
Directorate. This demonstrates the importance of the microfinance sector in the country.
In line with the microfinance best practices and the professionalization of microfinance sector, the
new microfinance Law No 40/2008 of August 26th, 2008, establishing the organization of
microfinance activities was published in the Official Gazette No. 13 of March 3rd, 2009. The
implementing regulation of this Law has been published in the Official Gazette of the Republic of
Rwanda No. 28 of July 13th, 2009.
For MFIs with the legal status of limited liability companies, the minimum of the paid up
capital have been put on Rwf 300 million from Rwf 100 million while the minimum for
banks moved from Rwf 1.5 billion to Rwf 5 billion
59
At the same time, the Central bank recognizes a medium category of banks which finances
only microfinance activities in a professional manner. The minimum of the paid up capital
for this category has been put on Rwf 1.5 billion
3.6.3 Non-Bank Financial Institutions (NBFI)
The inclusion of NBFI supervision within the mandate of the BNR was in recognition of the
valuable role that these institutions play in the stability of the financial system and in the
economic growth of the country. NBFI play an important role in the spreading of risks, protecting
invested capital and facilitating the growth of business, as well as providing the public with high
quality investment vehicles. Well regulated NBFI provides a reliable source of long term
financing for developmental projects that constitute a sound base for the country’s economic
growth. To accomplish this new role, the Central Bank law was amended to enable BNR to
develop a consolidated regulation and supervision of NBFI (pensions and Insurance) by law no.
55/2007 of 30/11/2007. Since then, a number of activities have been done to ensure the stability
of non bank financial institutions. These activities range from legal framework to financial
performance monitoring.
Insurance Sector:
Despite some recent developments within the NBFI, there is still a long way in as far as
population coverage is concerned. According to the FinScope Rwanda 2008 data, the insurance
penetration in Rwanda is extremely low and there is no evidence of shift towards greater
penetration.
1% of Rwandan adults have life insurance products;
Less than 1% of adult Rwandans have third party, household or other insurance products;
In terms of product penetration, private medical insurance illustrates a slightly better
performance than other types of insurance- 2% of adult Rwandans use private medical
insurance scheme.

60
80% of adult Rwandans have health insurance through the Government community based
health insurance scheme which increases the proportion of adult Rwandans who are using
health insurance products.
According to the NBFI Supervision Department at BNR, the insurance penetration ratio has
increased from 1.01% in 2006 to 1.61% at the end of 200834. It is argued that once the legal and
regulatory framework for supervising the insurance sector are put in place, there would be a
quickened pace in the growth of the insurance sector. With respect to the pension sector, the
proposed liberalisation and the introduction of provident fund in Rwanda are expected to bring
about significant growth in the sector.
Table 11: Total assets trends in Insurance companies (In millions FRW)
2005 2006 2007 2008 2009 (unaudited)
Private insurers (6) 22,51 25,65 33,26 40,75 45,00
Public insurers (2) 9,34 18,62 28,44 39,32 50,00
Total 31,85
44,27 61,70 80,10 95,00
Table 12: Insurance access indicators
2005 2006 2007 2008 2009
Insurance sector penetration 1.03% 1.26% 1.48% 1.61% 1.89%
Insurance sector penetration is very low but improving at a reasonable pace. It should be noted
that the data presented exclude Mutuelles de Santé.
Insurance sector reforms
The new insurance law was enacted and a number of insurance regulations are now in place:
The regulation N°05/2009 on capital, licensing and other requirements for insurers;
The regulation N°06/2009 on licensing and other requirements for insurance
intermediaries;
34 BNR-NBFI Supervision un-published Report 2008.
61
The regulation N° 07/2009 on corporate governance requirements for insurance
business;
The regulation N°04/2009 on external auditors;
The regulation N°12/2009 on market conduct requirements for insurers and insurance
intermediaries;
The regulation N°001/2010 on market capacity facilitation for foreign insurers.
Rwanda became a member of International Associations of Insurance supervisors (IAIS) effective
from March 2009 hence information sharing with other insurance supervisors and access to
standards and guidelines regulating the industry. Supervisory framework and supervision tools
for insurers have been put in place.
Most private insurers offer both short-term and long-term insurance businesses while the public
insurers deal with medical insurance (classified as short-term insurance) only. The new Insurance
Law35 which took effect on March 31st 2009 requires the separation of short-term and long-term
insurance businesses. The largest two (2) private insurers (SONARWA and SORAS) account for
70% of the total gross premiums of the private insurers. They also combine the largest market
share in terms of total assets (77%) and total capitalization (82%). On the other hand, RAMA is
the largest of the public insurers.
The total assets of the Insurers stood at RWF 80 Billion as of December 31st 2008. The Private
Insurers’ share was RWF 41 Billion, accounting for slightly more than a half of the total assets.
The table below gives the summary of the asset components.
35 Law n° 52/2008 of September 10th 2008 which appeared in the Official Government Gazette on March 31st 2009 stipulates the organization of Insurance Business in Rwanda.
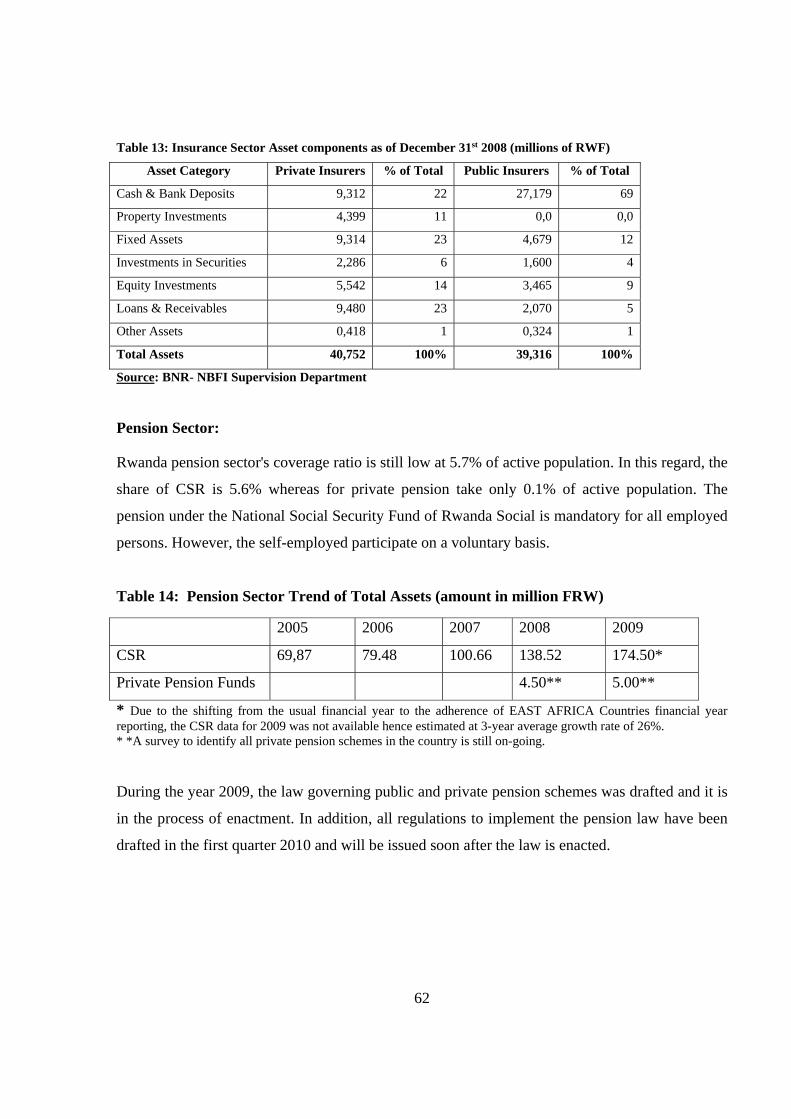
62
Table 13: Insurance Sector Asset components as of December 31st 2008 (millions of RWF)
Asset Category Private Insurers % of Total Public Insurers % of Total
Cash & Bank Deposits 9,312 22 27,179 69
Property Investments 4,399 11 0,0 0,0
Fixed Assets 9,314 23 4,679 12
Investments in Securities 2,286 6 1,600 4
Equity Investments 5,542 14 3,465 9
Loans & Receivables 9,480 23 2,070 5
Other Assets 0,418 1 0,324 1
Total Assets 40,752 100% 39,316 100%
Source: BNR- NBFI Supervision Department
Pension Sector:
Rwanda pension sector's coverage ratio is still low at 5.7% of active population. In this regard, the
share of CSR is 5.6% whereas for private pension take only 0.1% of active population. The
pension under the National Social Security Fund of Rwanda Social is mandatory for all employed
persons. However, the self-employed participate on a voluntary basis.
Table 14: Pension Sector Trend of Total Assets (amount in million FRW)
2005 2006 2007 2008 2009
CSR 69,87 79.48 100.66 138.52 174.50*
Private Pension Funds 4.50** 5.00**
* Due to the shifting from the usual financial year to the adherence of EAST AFRICA Countries financial year reporting, the CSR data for 2009 was not available hence estimated at 3-year average growth rate of 26%. * *A survey to identify all private pension schemes in the country is still on-going.
During the year 2009, the law governing public and private pension schemes was drafted and it is
in the process of enactment. In addition, all regulations to implement the pension law have been
drafted in the first quarter 2010 and will be issued soon after the law is enacted.
63
Key Challenges in NBFI
Low insurance penetration: Despite that the insurance business in Rwanda dated back in
1975, the insurance penetration is still very low. Only a small number of citizens are
insured. This limits the domestic saving mobilization.
Professionalism: The insurance sector is facing a number of problems including lack of
qualified personnel especially in risks assessment, actuarial studies, loss adjustments, etc.
These weaknesses are reflected in poor underwriting performance by private insurers.
Legal and regulatory systems are still at the infant stage: Though insurance companies
operated in Rwanda for a relatively long time, it started being regulated since 2007. It is
clear that a number laws and regulations are to be drafted so as to properly shape the
insurance business in Rwanda.
Lack of legal framework for the pension sector. This law should encourage the
establishment and governance of private pension schemes including the mutual funds for
rural population.
Lack of policy encouraging the culture of savings.
Strategies
Increase insurance coverage through public awareness, product diversification, elaborating
regulations encouraging insurance penetration like mandatory insurance law.
Encourage the insurance practitioners to get professional skills through education,
training.
Implement fully Risk Based supervision for insurance companies.
Increase the pension coverage from 5.7% to at least 25% by 2020.
Put in place incentives measures to encourage Private Pension Schemes and Personal
Retirement Account.
Enhance corporate governance principles.
Institute enforcing measures to comply with the pension management ethics and best
practices.
Contractual savings awareness campaigns and clearly specify whose mandate it is.
Financial literacy programs at the national level.

64
3.6.4 The National Social Security Fund (NSSF).
Due to the importance of the NSSF, a close look at its investment policy is important in as far
financial market development in Rwanda is concerned. The National Social Security Fund of
Rwanda “Caisse Sociale du Rwanda” is a publicly owned establishment that manages two social
security branches of Pension and Occupational hazards. The purpose of the Fund is to provide
occupational hazards and disease benefits and other social security benefits to employees of the
public and private sector. Since its inception in 1962, the mandate for the Fund has been to collect
members’ contributions; provide benefits to eligible members and productively invest any excess
funds.
Pension coverage is generally limited to those individuals who are employees in the formal
sector- approximately 7% of the working population36. Actual estimates indicate that only 5.6%
of the working population (2.3% of the total population) is covered. The pension provides
insurance against the risks associated with old age, disability and death. It is primarily aimed at
providing retired persons with an income on a basis proportionate to the number of years worked
and wages earned.
The Investment Policy of NSSF (2007-2011):
Because investment earnings are the Fund’s most important funding source for its day to day
operations, the Board and Management of NSSF adopted both the long term fixed income and
none fixed income investment policy at 50%. A range of ±5% around the fixed income and none
fixed income split is judged to be reasonable and is not expected to prejudice the long term policy
mix. To diversify risk and enhance expected returns, the Fund’s fixed income and none fixed
income investments will be allocated among the following major asset classes and maintained
within the corresponding ranges as a percentage of the Fund’s market value.
36 Republic of Rwanda: National Social Security Policy (Page 12), February 2009.

65
Table 15: NSSF Investment Policy
Investment Class Benchmark Minimum Maximum
Fixed Income:
- T-Bills/Bonds
- Fixed deposits
- Cash & Current accounts
- Foreign investments
- Corporate bonds/loan
- Mortgage loans / securities lending
5%
5%
5%
5%
10%
20%
0%
3%
3%
0%
7%
15%
10%
10%
10%
10%
15%
25%
Total 50% 45% 55%
Non Fixed Income:
- Real Estate
- Private Equity
- Private Income
30%
15%
5%
15%
10%
0%
35%
20%
10%
Total 50% 45% 55%
Source: CSR Investment Policy and Guidelines
The Fund’s portfolio as of December 31st 2008 however, does not respect this policy because the
fixed income accounted for 64%. The performance objective is to earn a return that is at least 2%
above the underlying inflation. The following table gives the total investment portfolio of the Fund as
of December 31st 2008.
Table 16: Investment Portfolio %age Value in RWF
Real Estate 6,13 8 447 827 525
Commercial Buildings 1,29 1 773 501 000
Ongoing Projects 9,79 13 494 152 111
Local Equity 12,67 17 467 928 327
Foreign Equity 7,91 10 903 419 565
Government Bonds 0,19 267 062 500
Mortgage Loans 2,87 3 962 632 571
Corporate Loan (BRD) 1,68 2 315 244 166
Corporate Bond (BCR) 0,25 350 000 000
Treasury Bonds 42,23 58 203 306 491
Land for Development 14,98 20 651 805 346
100,00 137 836 879 602
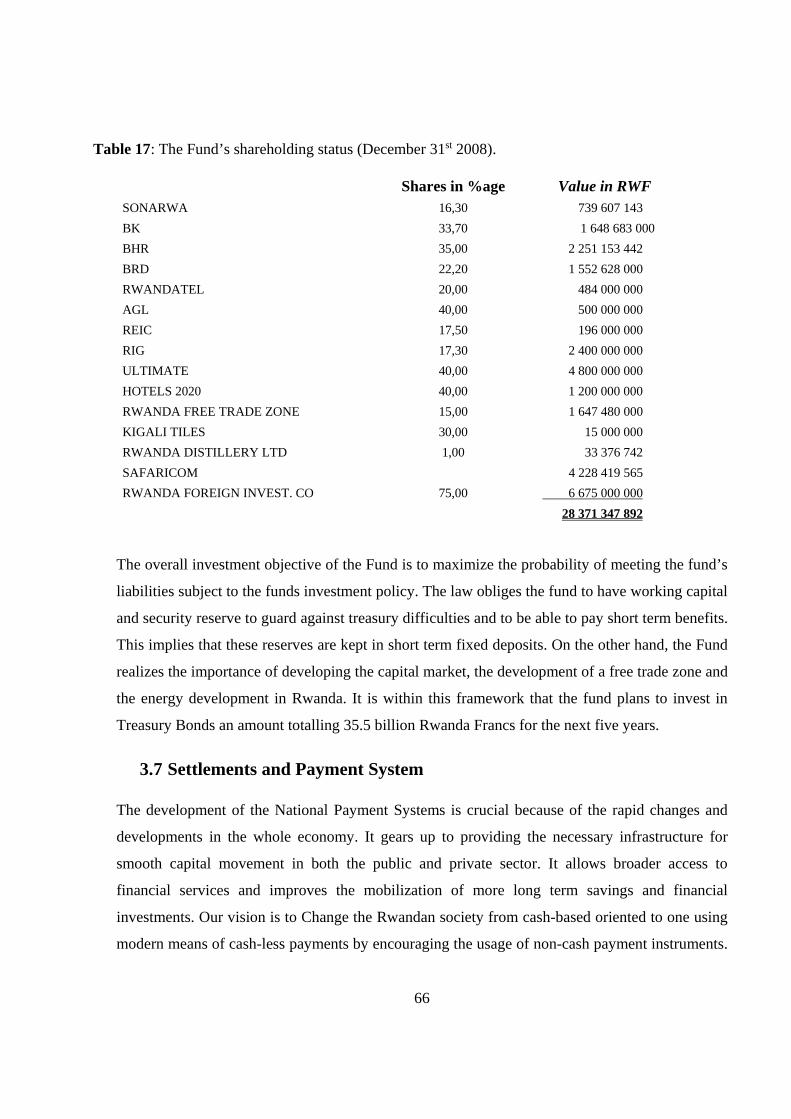
66
Table 17: The Fund’s shareholding status (December 31st 2008).
Shares in %age Value in RWF SONARWA 16,30 739 607 143
BK 33,70 1 648 683 000
BHR 35,00 2 251 153 442
BRD 22,20 1 552 628 000
RWANDATEL 20,00 484 000 000
AGL 40,00 500 000 000
REIC 17,50 196 000 000
RIG 17,30 2 400 000 000
ULTIMATE 40,00 4 800 000 000
HOTELS 2020 40,00 1 200 000 000
RWANDA FREE TRADE ZONE 15,00 1 647 480 000
KIGALI TILES 30,00 15 000 000
RWANDA DISTILLERY LTD 1,00 33 376 742
SAFARICOM 4 228 419 565
RWANDA FOREIGN INVEST. CO 75,00 6 675 000 000
28 371 347 892
The overall investment objective of the Fund is to maximize the probability of meeting the fund’s
liabilities subject to the funds investment policy. The law obliges the fund to have working capital
and security reserve to guard against treasury difficulties and to be able to pay short term benefits.
This implies that these reserves are kept in short term fixed deposits. On the other hand, the Fund
realizes the importance of developing the capital market, the development of a free trade zone and
the energy development in Rwanda. It is within this framework that the fund plans to invest in
Treasury Bonds an amount totalling 35.5 billion Rwanda Francs for the next five years.
3.7 Settlements and Payment System The development of the National Payment Systems is crucial because of the rapid changes and
developments in the whole economy. It gears up to providing the necessary infrastructure for
smooth capital movement in both the public and private sector. It allows broader access to
financial services and improves the mobilization of more long term savings and financial
investments. Our vision is to Change the Rwandan society from cash-based oriented to one using
modern means of cash-less payments by encouraging the usage of non-cash payment instruments.

67
The following are the issues to consider while embarking on a payment system development
program: 1) Card based payment systems, including International cards and connectivity and
Domestic cards; 2) Mobile Payment Services; 3) Remittances and 4) Large Value Payments
including, Real Time Gross Settlement System (RTGS), Automated Clearing House (ACH), and
the Central Securities Depository (CSD).
Access Indicators: Indicators of developments in payment systems are hinged on some key ratios for instance;
number of ATMs, POS and payment cards per 1000 inhabitants and the ratio of currency in
circulation to broad money (M2).
Table 18: ATMs, POS per 1 million inhabitants and cards per 1 000 inhabitants
Country ATMs POS Cards
Rwanda 3 14 1
Kenya 21 66 23
Tanzania 3 41 5
Uganda 9 17 50
South Africa 743 13 821 698
Singapore 404 6 101 1 289
Source: The World Bank, Payment Systems WORLDWIDE, 2008. Table 19: Currency in circulation (CC) to broad money (M2 and M1) in selected Countries (in %)
Country 2001 2002 2003 2004 2005 2006 2007 2008 2009 France (CC/ M1) 7.4 8.4 9.3 9.5 9.4 9.9 6.8 Australia (CC/M2) 8.8 10.7 10 9.8 9.9 9.8 9.1 8.1 Kenya (CC/M2) 12.6 12.1 11.8 15.1 Tanzania (CC/M2) 32.4 30 31 39.9 Uganda (CC/M2) 29.5 29.2 31.3 32.8 RWANDA (CC/M2) 25.1 24.4 27.2 28.5 27.2 24.1 22 23 19.2
The ratio of currency in circulation to M1 or M2 is very much higher in Rwanda than in advanced
economies even if we do better or compare with some regional countries. The acceptable levels
are between 5 and 10 percent. The way forward in this situation is the adoption of modern

68
payment instruments where individuals/companies transact and yet the liquidity remains in the
banking system.
Developments: The developments made so far can be classified in three parts; governance, infrastructure related
and legal and regulatory issues.
Infrastructure and Governance issues
A stock taking exercise was done
An NPS framework and strategy was published
The NPC and its working groups were set up
Mobile Payment Service Providers licensed
BNR started to license stand alone Remittance service Providers
A National Switch was set up:
Production of cards for the banks
Interconnection of all ATMs and POS to ensure interoperability
A Semi automated Clearing that achieves T+2 clearing and settlement is in place
Legal and regulatory
The NBR act was amended to include payment system oversight
The payment systems law was published
A regulation governing Payment Services Providers was passed
A law on negotiable instruments including cheques was published
The Central Securities Depository law is in Parliament
The electronic transactions law is in parliament
Guidelines for card based payment systems exist
69
Challenges in the National Payment System (NPS)
Challenges encountered in the National Payment Systems include: Setting up modern payment
systems is very costly and Banks are reluctant to invest; Connectivity and reliability of the
network which often breaks and this creates a reputational risk for the systems; there are no good
commercial working relationship between SIMTEL and the banks. SIMTEL’s pricing structure
includes very high prices which end up prohibiting usage of cards. In general shifting from cash
and paper takes awhile amongst the population.
Projects in the progress: To ensure modern Payment Systems these are the projects being worked on
Developing a Card based Payment system
All banks now understand the need to modernize
All banks have written and sent their cards strategies to the Central Bank and
an action plan has been made (see Annex II).
A strong awareness campaign
Implementation of the RIPPS (March 2010 to March 2011)
Real Time Gross Settlement System (RTGS)
Central Securities Depository (CSD)
Automated Clearing House (CSD)
3.8 Major challenges facing Rwanda Financial Markets
The major challenge in the provision of financial services to the private sector in Rwanda is the
lack of long term finance. Financial systems in Rwanda are dominated by commercial banks,
which typically have not been reliable sources of long term capital. Non bank sources of medium
to long term financing (such as leasing, mortgage and contractual savings) are also
underdeveloped. Hence, the principal challenge for the Rwanda financial sector development is
70
related with having in place an effective financial market system with the objective of developing
long-term debt and equity capital for the private sector. Although there have been some efforts to
improve on the situation, the authorities have to find adequate responses in the short and medium
term to address the following challenges:
Macroeconomic environment: It is critical to maintain macroeconomic stability
especially by keeping inflation in single digits. This will give entrepreneurs and investors
some confidence to get involved in long term economic operations. There is also a need to
improve fiscal discipline in order to lower interest rates and reduce crowding out.
Supply of Securities: The Government’s commitment to privatisation of state enterprises
through the capital market should be recommended. An effort should be made to privatise
the large state owned enterprises as soon as possible. A viable private sector is critical to
capital market development.
Demand for Securities: It is important to promote the development of Collective
Investment Schemes as means of aggregating the demand of individuals for securities. The
development of the life insurance industry should also be encouraged as it is important in
generating long term-term funds for investment in the capital market.
Market development: Bond market development in Rwanda deserves urgent attention. A
typical problem is that banks which account for 90% participation on the market are buy-
and- hold investors, meaning that when they purchase most instruments, they will hold till
maturity. This is due to lack of available alternatives, but more especially, due to lack of
liquidity in the secondary market. The current efforts aimed at lengthening the maturity of
government debt should continue. This is desirable not only in terms of the benefits for
government finances but also in terms of providing a benchmark for corporate bonds.
Developing credit rating systems is vital to the emergence of corporate bond markets.
Improving liquidity on the market will require the modernisation of trading systems and
reduction in transaction costs.
Regional integration: The success of regional integration will depend on finding
solutions to key country-level problems. It is therefore important to closely link regional
market integration to local efforts to develop individual capital markets.

71
Chapter Four: Financial Markets in the EAC Region
4.1 Introduction
The East African Countries have continued to face greater development challenges. For a long
time, governments of this region have depended on donor aid to finance their long-term projects.
But with increasing uncertainty and harsh donor conditions, mobilisation of domestic resources as
an alternative source of financing has gained greater significance. This chapter reviews the
Capital Market Development within the region as well as analysing the efforts put in place by
Uganda, Kenya and Tanzania within the framework of developing the financial markets and the
challenges encountered. It will also analyse the regional initiatives undertaken in as far as
Integration of Financial Markets in the EA Region is concerned.
4.2 Financial Markets in UGANDA
The financial sector of Uganda is diverse. It is composed of formal and informal financial
institutions that operate in a variety of ways. The formal financial sector is composed of the Bank
of Uganda (the Central Bank) with the mandate of supervising and regulating operations of all
deposit taking institutions that fall in the following categories:
Commercial Banks. As of December 31st 2008, Uganda had 21 local commercial banks
with about 301 branches in total throughout the country37.
Credit Institutions: These institutions operate more or less like banks but do not offer
current account deposit facilities. They were three licensed credit institutions by December
31st 2008 and these included: Capital Finance Corporation Ltd; Mercantile Credit Bank
Ltd and the Post Bank Uganda Ltd. These institutions deal mainly in time and savings
deposits and are not members of the cheque clearing house.
Microfinance Deposit taking Institutions (MDIs): these are Finca Uganda Ltd; Pride
Microfinance Ltd and Uganda Finance Trust Ltd.
Along these institutions are the FOREX Bureaus38 and Money Remittance39 Businesses which are
equally licensed by the Bank of Uganda. Although these institutions do not take public deposits,
37 The Bank of Uganda. Bank Supervision Report 2008.
72
they operate in the public domain and in public interest as they offer services of buying, selling
and transferring foreign exchange for the public.
There are other players in the Uganda Financial Sector which include the East African
Development Bank Ltd; Uganda Development Bank Ltd; National Social Security Fund40;
Uganda Securities Exchange and thousands of microfinance institutions and Saving & Credit
Cooperative Organisations.
4.2.1 Financial Market Instruments
The BOU issues Treasury Bills and Treasury Bonds for Monetary Policy purposes. The budget
for infrastructure projects is covered by grants which constitute 42%41 of the total revenue.
Treasury Bills comprise of 91; 182; 273 and 362 day instruments. The Treasury Bonds are for 2;
3; 5 and 10 year maturities. Auctions for Treasury Bonds were introduced in January 2005.
Treasury Bonds are auctioned every 28 days42. Most issuance is done through the reopening of an
existing bond which facilitates liquidity and creation of benchmark bonds.
The bonds support monetary policy implementation by improving liquidity management and
promoting market development. These securities also assist in providing a framework for pricing
of securities in the secondary market. USE has raised over 1.7 trillion43 Uganda shillings from
Government bonds.
4.2.2 The Uganda Securities Exchange (USE)
In the late 1990s, both the Bank of Uganda (BOU) and Commercial Banks in Uganda supported
the introduction of Long-Term Government Bonds. The BOU was keen to develop a benchmark
38 The number of licensed FOREX Bureaus were 114 at the end of 2008. 39 By the end of the year 2008, there were 26 money remittance operators with a total of 70 branches countrywide. 40 The Bank of Uganda was appointed by the Ministry of Finance to act as the Technical Advisor on NSSF matters pending the establishment of a Social Security and Pension Sector Regulator. 41 NASDAQ OMX Assistance for strengthening the Market place for trading Bonds in East Africa, May 4th 2009. 42 Source: The Bourse- Celebrating 10 years of Uganda Securities Exchange. 43 Idem
73
yield curve to promote capital market development and stimulate long term bond issuance by the
private sector.
In 1994, BOU chaired the Capital Markets Development Committee (CMDC) which was
comprised of the stakeholders of capital market interests from financial markets, industry and the
government. The CMDC oversaw the introduction of the Capital Markets Statute 1996 which
introduced the Capital Markets Authority (CMA) and made provision for the licensing of the
Uganda Securities Exchange (USE). The CMDC worked with Government to adopt a strategy of
privatising parastatals by listing them on the Stock Exchange.
The Stock Exchange Market in Kampala (USE) was launched in June 1997 but has started its
activities in January 1998. The CMA is at the helm of the capital markets industry as a regulator.
“The Capital Markets Authority Act, Cap. 84 (CMA Act), gives the CMA the mandate to create,
maintain and regulate Uganda’s capital markets and ensure that securities are issued and traded
in an orderly, fair and efficient manner”44. As at 30th June 2008, the following were the market
players licensed and regulated by CMA.
1. Uganda Securities Exchange (USE)-Stock Exchange;
2. Baroda Capital Markets Ltd (Broker/Dealer, Investment Advisor and member45 of USE);
3. Crane Financial Services Ltd (Broker/Dealer, Investment Advisor and member of USE);
4. Dyer and Blair Uganda Ltd (Broker/Dealer, Investment Advisor and member of USE);
5. Equity Stock Brokers Ltd (Broker/Dealer, Investment Advisor and member of USE);
6. MBEA Brokerage Services Ltd (Broker/Dealer, Investment Advisor and member of USE);
7. Crested Stocks and Securities Ltd (Broker/Dealer and Investment Advisor);
8. Inter Alliance International (Uganda) Ltd (Investment advisor);
9. Made in Africa IB (EA) Ltd (Investment advisor);
10. Iroko Securities (Investment advisor);
11. PKF Consulting Ltd (Investment advisor);
12. Mr. Andrew Franklin (Investment advisor);
44 CMA Annual Report, June 30th 2008. 45 Source: CMA Financial Statements for the year ended 30th June 2008. Only members of USE are allowed to transact business on the Stock Exchange.
74
13. PricewaterhouseCoopers Ltd (Investment advisor);
14. Dero Capital Uganda Ltd (Investment advisor);
15. Bullion Capital Ltd (Investment advisor);
16. African Alliance Uganda Ltd (Fund Manager, Unit Trust Manager, Investment Advisor,
Broker/Dealer and member of USE);
17. ReNaissance Capital (U) Ltd (Fund Manager, Investment Advisor, Broker/Dealer and
member of USE);
18. Stanbic Investment Management Services (Fund Manager and Investment advisor);
19. AIG Global Investment Company (East Africa) Ltd (Fund Manager and Investment
Advisor);
20. DFCU Bank Ltd (Trustee, Collective Investment Schemes);
21. Fidelity Capital Management Ltd.
The USE is the only registered exchange so far, in form of a mutual trust held by registered
brokers/dealers and financial advisers. It has the platforms for trading shares and government
treasury bonds.
4.3 Financial Markets in KENYA
In the 1980s, the Government of Kenya realised the need to design and implement policy reforms
to foster sustainable economic development with an efficient and stable financial system. While
Kenya’s financial sector is viewed as substantially diversified, it is dominated by banking
institutions which have not evolved to provide long term capital adequately.
In recent years, Kenya developed its public debt policy based on internal analysis and external
advice. The Market Leaders’ Forum46 also plays an important role in debt policy and capital
markets development. The proportion of bonds in domestic debt has risen to almost 70%47
compared to only around 15% in 1999. Public debt is held mainly by commercial banks with 46 This Forum is composed of representatives from the Central Bank of Kenya, Commercial Banks, the Retirement Benefits Authority, the Treasury, the Nairobi Stock Exchange, Fund Managers and Insurance Companies. The Forum is chaired by the Governor of the Central Bank of Kenya. 47 Source: NASDAQOMX: Assistance for Strengthening the Market Place for Trading Bonds in the East Africa. May 2009.
75
about 50% and the rest with insurance companies and pension funds. Retail investors hold only a
minor share of government securities.
The Central Bank of Kenya issues Government debt through multiple price auctions. The
minimum amount offered is Kenya Shillings 50 thousand and bids can be either competitive or
non competitive. The non competitive price is calculated as the average of the accepted
competitive prices. All government bonds are listed on the NSE.
4.3.1 Capital Markets Development in Kenya
The Capital Markets in Kenya have continued to play an important role in the mobilisation of
domestic and international capital and facilitated efficient allocation to productive investments.
The coming into operation of the Capital Markets Authority in 1990 constituted one of the major
steps by the Government towards strengthening the domestic capital markets as part of the
essential financial sector reforms. The establishment of deep and vibrant capital markets that
caters for the needs of all borrowers and lender is central to the achievement of Kenya’s socio-
economic development agenda.
The Government continues to grant to the Capital Markets Industry tax and non-tax incentives
thus encouraging the development of this market both from a demand and supply perspective. A
large part of the financing of the infrastructure and projects scheduled for implementation in the
Kenyan economy during the period of 2008-2012 is expected to come from the private sector in
the form of both local and Foreign Direct Investment (FDI)48. To facilitate this, the government
has developed a policy on Public Private Partnership (PPPs). The Capital Markets Authority is
expected to play a critical role in mobilising resources especially for the development of the
country’s infrastructure.
48 Capital Markets Authority (Kenya): Annual Report, June 30th 2008.
76
4.3.2 The Nairobi Stock Exchange (NSE)
The NSE is the most ancient stock exchange market of the EAC region. It was established in 1954
but dealing in shares and stocks had started in the 1920’s when the country was still a British
colony. There was however no formal market, no rules and no regulations to govern stock broking
activities. Trading was done on gentleman’s agreement in which standard commissions were
charged with clients being obligated to honour their contractual commitments of making good
delivery, and settling relevant costs.
In the beginning, it was constituted under the form of Brokers’ association and in 1991, the NSE
was registered under the Companies Act and phased out the “Call Over” trading system in favour
of the floor based Open Outcry System. On September 11th 200649, the NSE saw the
commencement of automated trading system.
The following is the list of the firms, members of the NSE:
1. DRUMMOND Investment Bank Ltd;
2. SUNTRA Investment Bank Ltd;
3. BOB Mathews Stockbrokers Ltd;
4. NIC Capital Securities Ltd;
5. STERLING Investment Bank Ltd;
6. DISCOUNT Securities Ltd;
7. GENGHIS Capital Ltd;
8. DYER & Blair Investment Bank Ltd;
9. RELIABLE Securities Ltd;
10. AFRIKA Investment Bank Ltd;
11. APEX AFRIKA Investment Bank Ltd;
12. STANDARD Investment Bank Ltd;
13. AFRICAN Alliance Kenya Securities;
14. NGENYE KARIUKI & Co. Ltd;
15. CFC Financial Services;
49 Nairobi Stock Exchange: Market Fact File, November 2008.

77
16. ABC Capital Ltd;
17. FAIDA Investment Bank Ltd;
18. KESTREL Capital (EA) Ltd;
19. RENAISSANCE Capital (Kenya) Ltd.
4.4 Financial Markets in Tanzania
Financial markets in Tanzania have evolved significantly in recent years following the financial
sector reforms which were undertaken during the past two decades50. Financial markets consist of
money markets, bonds, equities, foreign exchange, and collective investment schemes. The Bank
of Tanzania (BOT) is closely involved in the financial markets for implementation of monetary
policy, ensuring government financing needs and stability of the market. The BOT conducts Open
Market Operations (OMO), which involves selling and buying government securities, i.e.
Treasury bills and bonds. The Repurchase Agreements (REPO) with commercial banks also are
done via OMO. The selling of government securities and REPO mop-up the liquidity from the
economy whilst redemption of these instruments injects liquidity.
4.4.1 The Money Markets
Treasury Bills Market: Treasury Bills of four maturities (35, 91, 182, and 364 days),
issued in the primary market on a fortnight basis and later on traded over the counter in
the secondary market. Secondary market trading is done over the counter. Treasury Bills
are issued for monetary policy and financing of the government deficit. Investors of bids
worth more than TZS 50 million can participate directly while bids worth less than TZS
50 million participate through dealers. The major participants are commercial banks,
which account for more than 75 percent of the market and it is limited resident investors
only. That is, non-residents (individuals and corporations) are not allowed to purchase
government securities. The minimum threshold for participation directly in the auctions is
50 Bank of Tanzania: The Second Generation Financial Sector Reforms, June 2007.

78
5 million Tanzania shillings while participation through registered Primary Dealers is 500
million Tanzania shillings minimum.
Interbank Foreign Exchange Market: There are 29 participating banks, including the
Bank of Tanzania. Exchange rate is market determined.
Repurchase Agreements (REPO). These are conducted by the BOT with Commercial
Banks which have signed the Master Repurchase Agreement. REPOs are conducted for
monetary policy, i.e. fine-tuning the liquidity. Depending on liquidity conditions, the BOT
conducts also Reverse REPO with Commercial Banks.
Inter-Bank Cash Market: It provides opportunity for lending and borrowing amongst
Commercial Banks.
4.4.2 The Capital Market
The capital market in Tanzania can be described as ‘emerging’, having been established in 1994.
The Capital Market and Securities Authority (CMSA) regulate the Capital Market. The markets
include:
Bond Market: The bond market started in 1997 when the 2-year bond was introduced.
Currently, the market constitutes of government bonds and corporate bonds. Government
bonds are of four maturities, i.e. 2, 5, 7 and 10 years issued by BOT on behalf of the
Government of Tanzania. They are traded in the primary market and later on in the
secondary market at the Dar Es Salaam Stock Exchange (DSE). As at 19th November
2007, the capitalization of the government bonds market was TZS 832.9 billion51. The
auction is done once every month and is dominated by Institutional Investors mainly
Pension Funds and Insurance companies. Settlement of successful bids is T+1 and coupon
payments are done semi-annually.
Corporate Bond: As of December 31st 2008, Five Corporate bonds had been issued and
listed at the DSE. These include:
51 Bank of Tanzania: Open Market Operations, Foreign Exchange Developments and Interest Rate Developments in Tanzania.
79
o The East African Development Bank which was listed in January 2000;
o The East and Southern Africa Trade and Development Bank which was listed in
January 2004;
o BIDCO52 Oil and Soap Limited which was listed in February 2004;
o Barclays Bank (Tanzania) Limited which was listed at DSE in July 2005;
o Standard Chartered Bank (Tanzania) Limited which was listed in July 2005.
Equity Market: The Equity Market consists of ten companies listed at DSE, out of which
three are non-resident (cross-listed). The participation of non-residents in Initial Public
Offer (IPO) is limited to 60% of the shares. The resident companies were privatised.
4.4.3 Dar Es Salaam Stock Exchange
The Dar Es Salaam Exchange (DSE) effectively began its activities in April 199853. DSE provides
liquidity by way of providing a continuous market for securities whereby securities are exchanged
for cash. The pricing mechanism ensures that buyers and sellers can do so at a price determined
by demand and supply forces. The DSE has facilitated and continue to facilitate the privatisations
of some parastatal organisations which were hitherto under the control of the Government whose
shares have been sold by the Government through the DSE.
The DSE membership consists of Licensed Dealing Members (LDM) and Associate Members.
LDMs are classified according to the activities or transactions they are licensed to perform. The
LDM that are allowed to transact at the DSE as agents or on behalf of the investors are known as
Brokers whereas those allowed to transact as principals or on their own behalf are known as
Dealers. Associate members are all non-LDM members who have interest in the development of
capital markets in Tanzania including listed companies, institutional investors, professional
associations as well as individuals.
The listed companies at the DSE include:
52 This is a resident company, guaranteed by Barclays Bank, engaged in manufacturing, distribution and marketing of various brands of soap, vegetable oil and fats. Source: Bank of Tanzania. 53 Dar Es Salaam Stock Exchange (DSE) Hand Book. March, 2008.
80
1. TOL Gases Ltd (TOL): Dealing in the production and distribution of industrial gases,
welding equipments, medical gases, etc;
2. Tanzania Breweries Ltd (TBL): Dealing in the production, marketing and distribution of
malt beer in Tanzania;
3. Tanzania Tea Packers Ltd (TATEPA): Growing, processing, blending, marketing and
distribution of tea and instant;
4. Tanzania Cigarette Co. Ltd (TCC): Manufacturing, marketing, distribution and sale of
cigarettes;
5. Tanga Cement Co. Ltd (SIMBA): Production, sale and marketing of cement;
6. Swissport Tanzania Ltd (SWISSPORT): Airports handling of passengers and cargo;
7. Tanzania Portland Cement Co. Ltd (TWIGA): Production, sale and marketing of cement;
8. Kenya Airways Ltd (KA): Passengers and cargo transportation to different destinations in
the world;
9. East African Breweries Ltd (EABL): Holding Company in various companies that are
involved in production of malt beer in Kenya, Uganda and Mauritius;
10. Jubilee Holdings Ltd (JHL): Holding Company in several companies that are involved in
insurance businesses in Kenya, Uganda and Tanzania.
The last three on the list are cross-listed companies. Trading is conducted at the DSE Trading
Floor through an Automated Trading System (ATS). This is an electronic system which matches
bids and offers using an electronic matching engine. Matched orders are displayed on the
computer terminal in the trading room and projected in the public gallery.
Clearing and settlement are conducted through an electronic Central Depository System (CDS)
which has been operational since 1999. The CDS facilitates the delivery of securities in time for
the settlement of trades to be implemented within five working days (T+5). It is expected
however to improve to T+3. Both the CMSA and DSE monitor the market trading activities to
detect possible market malpractices. The Chief Executive Officer of the DSE has the authority to
suspend anytime offers and bids that are deemed to be suspicious.

81
4.5 Integration of Financial Markets in the EA Region
In numerous forums, African leaders have underscored the imperative of greater coordination and
harmonisation among the continent’s many regional economic communities. Successful
consolidation of African Countries in large regional economic blocks is now a reality with such
successful blocks as the Common Market of East and Southern Africa (COMESA), the Economic
Community of West African States (ECOWAS) and the South African Development Community
(SADC).
The East African Community (EAC) is a regional organisation comprising Kenya, Tanzania,
Uganda, Rwanda and Burundi which is implementing integration programmes on economic,
social and political arenas. The member countries have committed to the creation of an enabling
environment within which the private sector can flourish and generate faster growth in individual
countries. One of the pillars of this effort is the pursuit of financial markets development, with a
view to maximising the ability of financial sectors to mobilise resources and efficiently allocate
them to the most productive sectors of the respective economies.
A principal component of financial sector development efforts is the expansion of capital markets
in the EAC. Capital markets are important for mobilising medium and long-term funds for
productive investment and could significantly contribute to meeting the fixed-capital needs of the
private sector in the Community. Currently, financial systems in the EAC are dominated by
commercial banks which have not been reliable sources of long- term capital. An active, efficient
and effective capital market will therefore help mobilise and allocate long-term finance, widen the
array of financial instruments available to savers and investors, as well as increase diversity and
competition in the EAC financial systems.
Integration of the capital markets means that investors will buy and sell securities in any East
African Stock Market without restrictions; participants in capital markets will freely offer their
services throughout EA and that identical security will trade at essentially the same price across
markets after foreign exchange adjustments. The expectations are that a regional approach will:
a. Create the much needed critical mass of demand and supply lager than can ever be
achieved in individual countries;
82
b. Enhance competition in the securities industry and lower transaction costs;
c. Provide a framework for sharing information, expertise and experiences;
d. Provide a viable platform for linkages with more developed markets, both within Africa
and beyond.
The expectations are designed to follow a commonly agreed methodology and aim to achieve
deep and efficient financial sectors in the context of harmonised regulatory frameworks and
progressive regional integration of capital markets. Regional integration will therefore offer a
better chance for the EAC capital markets to fulfil their potential as providers of long-term
finance to the private sector in East Africa.
The EAC has taken several steps to increase regional financial integration. The regional capital
market initiative began in 1997, with the formation of the East African Member States Securities
Regulatory Authorities54 (EASRA), comprising of Capital Market Regulators from Kenya,
Tanzania and Uganda. EASRA members signed a Memorandum of Understanding (MOU),
adopting a regional approach to developing capital markets in East Africa. The contents of the
MOU became an integral part of the 1999 EAC Treaty. Among other things, the treaty provided
for the following:
a. The harmonisation of capital market policies;
b. The harmonisation of regulatory and legislative frameworks governing capital markets;
c. The promotion of cooperation among the three exchanges and the regulators;
d. The promotion of cross-border listing and trading of securities;
e. The development of regional rating system for securities.
On January 01st 2005, a Customs Union came into force. The Common Market is scheduled to
commence by January 01st 2010 and it is expected that by 2012, EAC Monetary Union will have
been established55.
54 The World Bank: Capital Market Integration in the East African Community, Dec 2002. 55 Report of the 12th Technical Meeting of the EAC Monetary Affairs Committee, May 2009.

83
4.6 Challenges to Financial Markets Integration in the EAC
There are serious challenges and impediments to the development of Financial Markets in Africa
in general and in the EAC in particular. The markets are characterised by the low level of market
turn-over, weak market infrastructure (banking systems), weak enforcements (legal and
regulatory) and illiquid markets. The EAC Central Banks do also face challenges in conducting
financial markets operations, attributed partly to inadequate supportive institutional,
infrastructure, legal and regulatory frameworks. There are therefore significant issues that need to
be addressed if the dream of a viable regional market is to be realised.
a. Macroeconomic and Policy environment: Efficient and effective capital markets require
macroeconomic stability. Sound and stable macroeconomic policies are essential to the
proper functioning of the financial markets. The EAC governments should therefore make
vigorous efforts to sustain the price stability. There is also need to improve fiscal
discipline in order to lower interest rates.
b. Legal and Regulatory Issues: Although EAC capital markets and there regulatory
regimes are at different stages of development, the legal and regulatory framework in
place in individual countries is reasonably sound and could serve as a basis for developing
a regional market. The fact that three of the five EAC member countries share a common
legal tradition is a bonus for the pursuit of a regional approach. However, with Rwanda
and Burundi still using a different legal framework, the harmonisation of the regulatory
and legislative frameworks and structures remains a challenge.
c. Small market turn-over and limited market depth: EAC countries do experience
relatively small volumes of trade. The markets are shallow with short term Treasury Bills
dominating the instruments issued. The private sector has not made significant use of
equity market as a source of financing. The major factors limiting the supply of equities in
the EAC market are related to the reluctance of family owned business to dilute
ownership; the tedious and costly process of making public offers; and generally the
underdeveloped state of the private sector in the region.
d. Narrow investor base and low financial intermediation: Markets in the EAC region are
dominated by commercial banks which are often characterised with excess liquidity. They
are found of holding to maturity the securities bought at the primary market. This makes
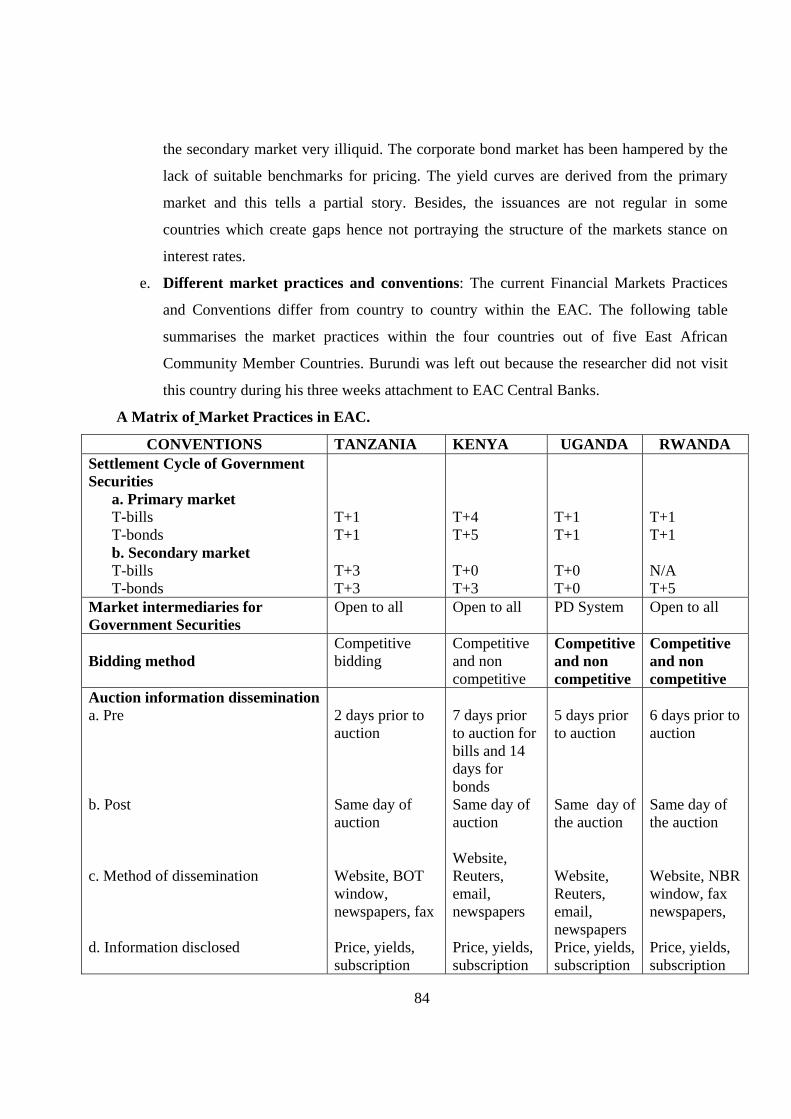
84
the secondary market very illiquid. The corporate bond market has been hampered by the
lack of suitable benchmarks for pricing. The yield curves are derived from the primary
market and this tells a partial story. Besides, the issuances are not regular in some
countries which create gaps hence not portraying the structure of the markets stance on
interest rates.
e. Different market practices and conventions: The current Financial Markets Practices
and Conventions differ from country to country within the EAC. The following table
summarises the market practices within the four countries out of five East African
Community Member Countries. Burundi was left out because the researcher did not visit
this country during his three weeks attachment to EAC Central Banks.
A Matrix of Market Practices in EAC.
CONVENTIONS TANZANIA KENYA UGANDA RWANDA Settlement Cycle of Government Securities
a. Primary market T-bills T-bonds b. Secondary market T-bills T-bonds
T+1 T+1 T+3 T+3
T+4 T+5 T+0 T+3
T+1 T+1 T+0 T+0
T+1 T+1 N/A T+5
Market intermediaries for Government Securities
Open to all Open to all PD System Open to all
Bidding method
Competitive bidding
Competitive and non competitive
Competitive and non competitive
Competitive and non competitive
Auction information dissemination a. Pre
b. Post
c. Method of dissemination
d. Information disclosed
2 days prior to auction Same day of auction Website, BOT window, newspapers, fax Price, yields, subscription
7 days prior to auction for bills and 14 days for bonds Same day of auction Website, Reuters, email, newspapers Price, yields, subscription
5 days prior to auction Same day of the auction Website, Reuters, email, newspapers Price, yields, subscription
6 days prior to auction Same day of the auction Website, NBR window, fax newspapers, Price, yields, subscription

85
CONVENTIONS TANZANIA KENYA UGANDA RWANDA e. Auction day
Wednesday for both
Wednesday for bonds; Thursday for bills
Wednesday for both
Thursday for both
Tenors a. T-bills (Days)
b. T-bonds (Years)
35, 91, 182 and 364 2, 5, 7 and 10
91, 182 and 364 2, 5,10, 15, 20 and 25
91, 182 and 364 2, 3, 5 and 10
28, 91, 182 and 364 2 , 3 and 5
Tenors issued per auction
a. T-bills
b. T-bonds
All four maturities issued per auction One bond tenor per auction
One bill tenor per auction One bond tenor per auction
All three maturities issued per auction One bond tenor per auction
Different maturities issued per auction One bond tenor per auction
Auction frequency of Government Securities a. T-bills
b. T-bonds
Fortnightly Monthly
Weekly (91&182); 364 days bimonthly Monthly
Fortnightly Monthly
Weekly Quarterly
Issuance Calendar Similar to the auction frequency
Similar to the auction frequency
Similar to the auction frequency
Similar to the auction frequency
Depository arrangements CDS for government securities at BOT CDS for equities and corporate bonds at DSE
CDS for government securities at CBK CDS for equities and corporate bonds at CDSC
CDS for government securities at BOU CDS for equities and corporate bonds at USE
Excel based CDS for both government securities and equities at NBR.
Capital Account Liberalization Partially liberalized
Fully liberalized
Fully liberalized
Fully liberalized
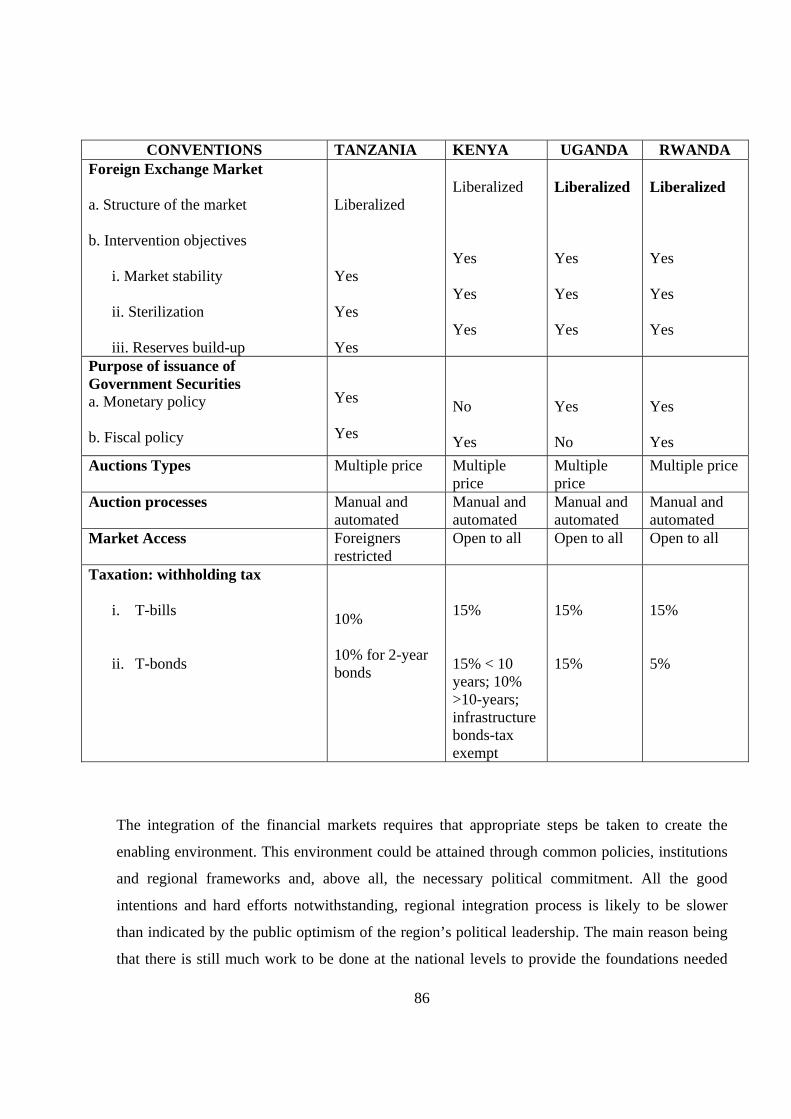
86
CONVENTIONS TANZANIA KENYA UGANDA RWANDA Foreign Exchange Market
a. Structure of the market
b. Intervention objectives
i. Market stability ii. Sterilization iii. Reserves build-up
Liberalized Yes Yes Yes
Liberalized Yes Yes Yes
Liberalized Yes Yes Yes
Liberalized Yes Yes Yes
Purpose of issuance of Government Securities a. Monetary policy b. Fiscal policy
Yes Yes
No Yes
Yes No
Yes Yes
Auctions Types Multiple price Multiple price
Multiple price
Multiple price
Auction processes Manual and automated
Manual and automated
Manual and automated
Manual and automated
Market Access Foreigners restricted
Open to all Open to all Open to all
Taxation: withholding tax i. T-bills
ii. T-bonds
10% 10% for 2-year bonds
15% 15% < 10 years; 10% >10-years; infrastructure bonds-tax exempt
15% 15%
15% 5%
The integration of the financial markets requires that appropriate steps be taken to create the
enabling environment. This environment could be attained through common policies, institutions
and regional frameworks and, above all, the necessary political commitment. All the good
intentions and hard efforts notwithstanding, regional integration process is likely to be slower
than indicated by the public optimism of the region’s political leadership. The main reason being
that there is still much work to be done at the national levels to provide the foundations needed

87
for regional harmonisation and integration. It should be realised at this stage that regional
integration will not yield the expected benefits unless parallel steps are taken to develop markets
at the country level and closely link regional market integration with national market
development.
88
Chapter Five: Strategies for sustainable development (Roadmap).
5.1 Initiatives in the EAC Region
Many African countries have, in recent years, embarked on financial sector reforms in the context
of the overall reforms of their economies. These reforms have focused on improving the legal,
regulatory and supervisory, reducing financial repression, restoring bank soundness, rehabilitating
financial infrastructures and privatisation of public-owned enterprises. There are challenges in
every country in formulating, designing, sequencing and implementing such reforms. In addition
to these challenges, the EAC Region continues to face obstacles which include narrow issuer and
investor base, limited product range, inadequate skills, among others. In order to address these
challenges, member countries undertook various reforms that have resulted in several milestones.
These include, but not limited to the following:
Five –Year Financial Markets Development Plan-FMDP (2008-2012)
At its 8th meeting held in Mwanza, Tanzania in May 2005, the Monetary Affairs Committee
(MAC) of the EAC agreed on a common financial markets development approach as a basis for
regional economic and financial markets integration. Although some progress have been
registered among the governments and central banks of the East African Countries to promote
financial markets development, more is needed to make financial markets efficient and effective
in mobilising and allocating resources for economic growth and development. The MAC
therefore directed its sub-committee on financial markets to develop a comprehensive strategic
framework for financial markets development that would guide the East African Central Banks in
preparing their respective 5-year financial markets development plans.
Of all the EAC member states; Kenya, Uganda, Rwanda and Tanzania formulated Five-Year
Financial Markets Development Plans (FMDP) which were approved for implementation during
the 11th MAC meeting held in May 2008 in Kampala, Uganda. This provides a basis for
deepening the financial markets as well as setting the stage for regional integration. Uganda
launched its FMDP on September 9th 2008. BOT and CBK are already implementing the plans.
89
The FMDP in Rwanda was restructured so as to bring it to conformity with the MAC framework
and it was adopted by the management of the Bank for implementation in 2008.
Consultative forum with the market
In order to provide a platform for regular consultations with stakeholders in the financial markets,
central banks adopted different approaches. CBK and BOT established Market Leaders Fora in
2001 and 2004 respectively. The BOU instead introduced Financial Markets Development
Secretariat to play the same role. These forums have been instrumental in spearheading reforms,
playing an advisory role and information sharing on markets developments. BNR established the
Financial Markets Coordination Unit in September 2009. BRB is in the process of setting up
similar platform.
Within the same framework, there is information sharing at regional level where central banks
share information on relevant studies and survey findings in areas related to financial markets
development. Nonetheless, Central Banks in the EAC Region face some challenges in the
implementation of the 5-year FMDP, attributed partly to inadequate supportive institutional,
infrastructure, legal and regulatory frameworks. However, the ongoing financial sector reform
programs and the common financial markets frameworks within the Partner States will provide a
good foundation for comprehensive financial markets development.
5.2 Recommended Strategies (Roadmap)
The ultimate objective of Rwanda’s long term development plan is to transform the country into a
middle-income country and an economic trade, communication and financial hub by the year
2020. Developing the financial sector is of paramount importance for a successful and sustainable
economic development. To achieve this objective, the Government of Rwanda adopted an
ambitious five year Financial Sector Development Plan (FSDP 2008-2012) which is being
implemented. The following roadmap however, describes the practical medium and long term
action plans that would help Rwanda achieve an effective financial market.
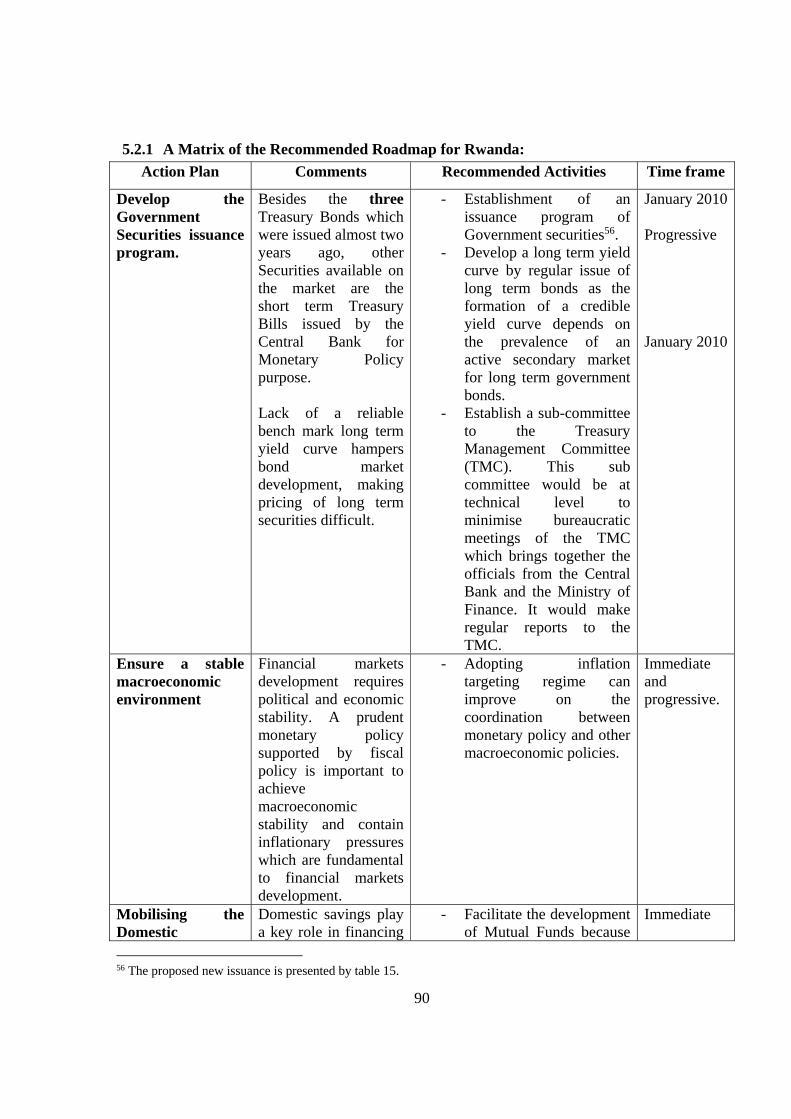
90
5.2.1 A Matrix of the Recommended Roadmap for Rwanda:
Action Plan Comments Recommended Activities Time frame
Develop the Government Securities issuance program.
Besides the three Treasury Bonds which were issued almost two years ago, other Securities available on the market are the short term Treasury Bills issued by the Central Bank for Monetary Policy purpose. Lack of a reliable bench mark long term yield curve hampers bond market development, making pricing of long term securities difficult.
- Establishment of an issuance program of Government securities56.
- Develop a long term yield curve by regular issue of long term bonds as the formation of a credible yield curve depends on the prevalence of an active secondary market for long term government bonds.
- Establish a sub-committee to the Treasury Management Committee (TMC). This sub committee would be at technical level to minimise bureaucratic meetings of the TMC which brings together the officials from the Central Bank and the Ministry of Finance. It would make regular reports to the TMC.
January 2010 Progressive January 2010
Ensure a stable macroeconomic environment
Financial markets development requires political and economic stability. A prudent monetary policy supported by fiscal policy is important to achieve macroeconomic stability and contain inflationary pressures which are fundamental to financial markets development.
- Adopting inflation targeting regime can improve on the coordination between monetary policy and other macroeconomic policies.
Immediate and progressive.
Mobilising the Domestic
Domestic savings play a key role in financing
- Facilitate the development of Mutual Funds because
Immediate
56 The proposed new issuance is presented by table 15.
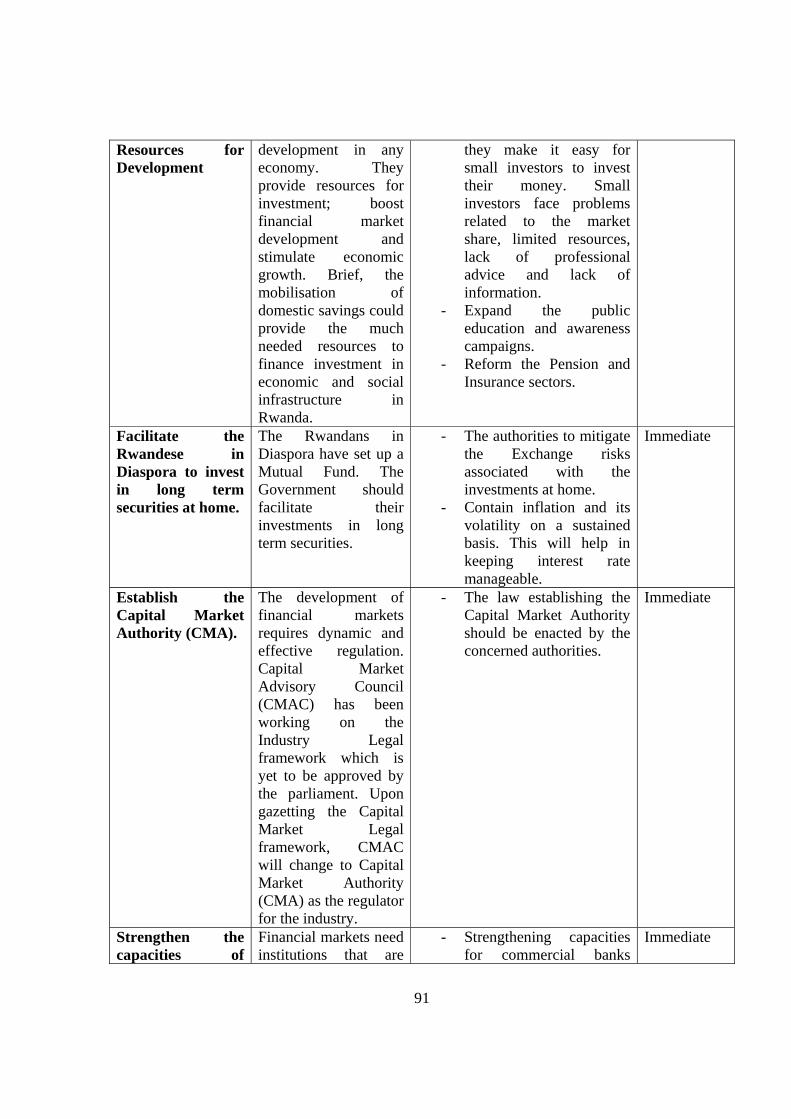
91
Resources for Development
development in any economy. They provide resources for investment; boost financial market development and stimulate economic growth. Brief, the mobilisation of domestic savings could provide the much needed resources to finance investment in economic and social infrastructure in Rwanda.
they make it easy for small investors to invest their money. Small investors face problems related to the market share, limited resources, lack of professional advice and lack of information.
- Expand the public education and awareness campaigns.
- Reform the Pension and Insurance sectors.
Facilitate the Rwandese in Diaspora to invest in long term securities at home.
The Rwandans in Diaspora have set up a Mutual Fund. The Government should facilitate their investments in long term securities.
- The authorities to mitigate the Exchange risks associated with the investments at home.
- Contain inflation and its volatility on a sustained basis. This will help in keeping interest rate manageable.
Immediate
Establish the Capital Market Authority (CMA).
The development of financial markets requires dynamic and effective regulation. Capital Market Advisory Council (CMAC) has been working on the Industry Legal framework which is yet to be approved by the parliament. Upon gazetting the Capital Market Legal framework, CMAC will change to Capital Market Authority (CMA) as the regulator for the industry.
- The law establishing the Capital Market Authority should be enacted by the concerned authorities.
Immediate
Strengthen the capacities of
Financial markets need institutions that are
- Strengthening capacities for commercial banks
Immediate
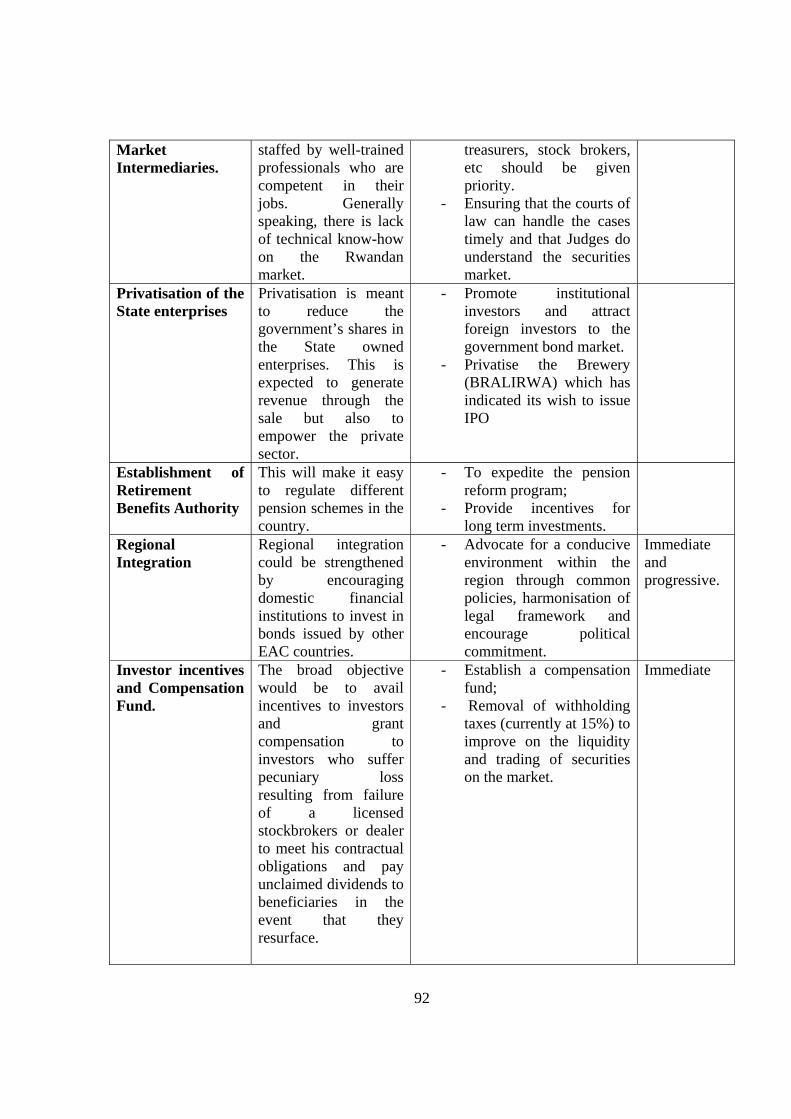
92
Market Intermediaries.
staffed by well-trained professionals who are competent in their jobs. Generally speaking, there is lack of technical know-how on the Rwandan market.
treasurers, stock brokers, etc should be given priority.
- Ensuring that the courts of law can handle the cases timely and that Judges do understand the securities market.
Privatisation of the State enterprises
Privatisation is meant to reduce the government’s shares in the State owned enterprises. This is expected to generate revenue through the sale but also to empower the private sector.
- Promote institutional investors and attract foreign investors to the government bond market.
- Privatise the Brewery (BRALIRWA) which has indicated its wish to issue IPO
Establishment of Retirement Benefits Authority
This will make it easy to regulate different pension schemes in the country.
- To expedite the pension reform program;
- Provide incentives for long term investments.
Regional Integration
Regional integration could be strengthened by encouraging domestic financial institutions to invest in bonds issued by other EAC countries.
- Advocate for a conducive environment within the region through common policies, harmonisation of legal framework and encourage political commitment.
Immediate and progressive.
Investor incentives and Compensation Fund.
The broad objective would be to avail incentives to investors and grant compensation to investors who suffer pecuniary loss resulting from failure of a licensed stockbrokers or dealer to meet his contractual obligations and pay unclaimed dividends to beneficiaries in the event that they resurface.
- Establish a compensation fund;
- Removal of withholding taxes (currently at 15%) to improve on the liquidity and trading of securities on the market.
Immediate
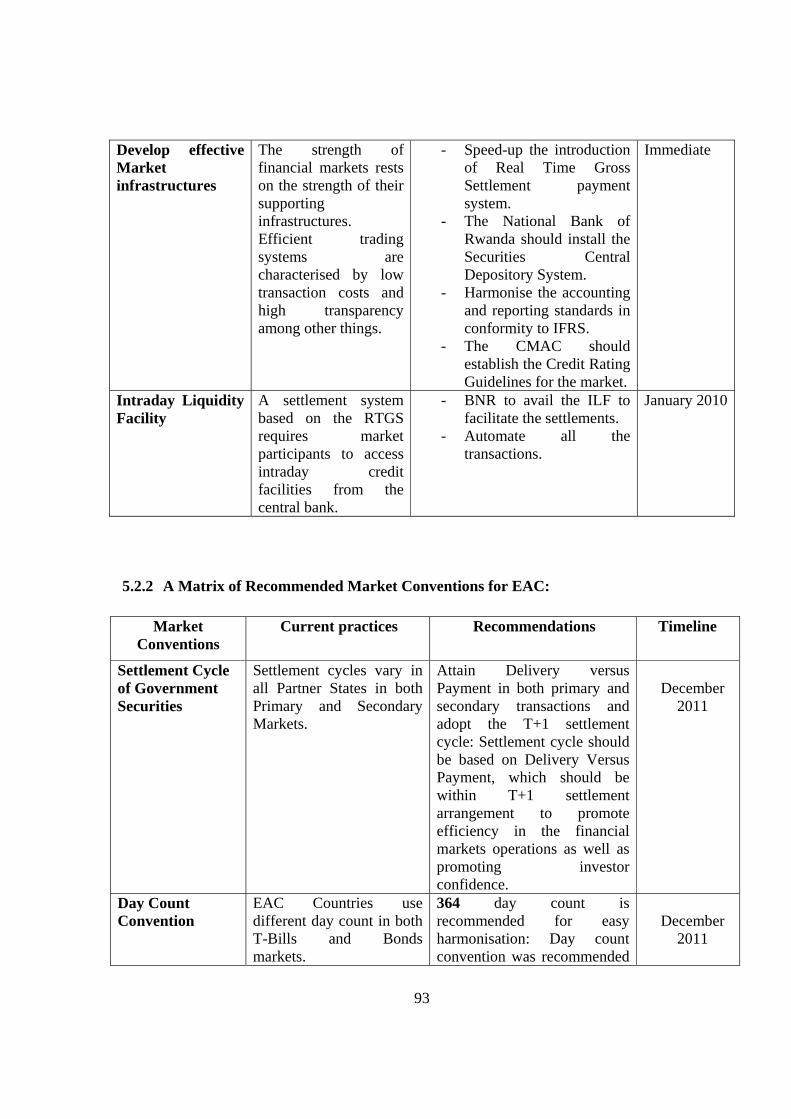
93
Develop effective Market infrastructures
The strength of financial markets rests on the strength of their supporting infrastructures. Efficient trading systems are characterised by low transaction costs and high transparency among other things.
- Speed-up the introduction of Real Time Gross Settlement payment system.
- The National Bank of Rwanda should install the Securities Central Depository System.
- Harmonise the accounting and reporting standards in conformity to IFRS.
- The CMAC should establish the Credit Rating Guidelines for the market.
Immediate
Intraday Liquidity Facility
A settlement system based on the RTGS requires market participants to access intraday credit facilities from the central bank.
- BNR to avail the ILF to facilitate the settlements.
- Automate all the transactions.
January 2010
5.2.2 A Matrix of Recommended Market Conventions for EAC:
Market
Conventions Current practices Recommendations Timeline
Settlement Cycle of Government Securities
Settlement cycles vary in all Partner States in both Primary and Secondary Markets.
Attain Delivery versus Payment in both primary and secondary transactions and adopt the T+1 settlement cycle: Settlement cycle should be based on Delivery Versus Payment, which should be within T+1 settlement arrangement to promote efficiency in the financial markets operations as well as promoting investor confidence.
December
2011
Day Count Convention
EAC Countries use different day count in both T-Bills and Bonds markets.
364 day count is recommended for easy harmonisation: Day count convention was recommended
December
2011

94
Market Conventions
Current practices Recommendations Timeline
to be 364 days in order to standardize computation of coupons in the region.
Market intermediaries for Government Securities
In some countries, bidding is open to all while others use Primary Dealers.
Set up Market intermediaries for cross border trading in the region.
December 2011
Bidding method In Tanzania, they only accept competitive bids
Adopt Competitive and Non Competitive methods: All Partner States should adopt competitive and non competitive methods of bidding to promote retail investor participation in government securities.
June 2011
Auction information dissemination
Information disclosure (pre & post auction) and the methods used differ in all countries.
Ensure comprehensive and transparent information dissemination: All Partner States should ensure comprehensive and transparent information dissemination to promote transparency and build investor confidence in financial markets operations.
December 2010
Auction day Auction day differs from one country to another.
Wednesday should be the Auction day within the EAC Countries: All Partner States should carry out auctions of Government securities on Wednesdays to support liquidity forecasting and the 2-week reserve requirements maintenance period in commercial banks.
December 2011
Tenors
Tenures (Bills & Bonds) differ from one country to another.
Establish 91, 182 and 364-day Treasury Bills and 2, 5, 10 and 15-year Bonds as benchmarks.
December
2011 Types of tenors issued in the auction
For T-Bills and Bonds Issue Treasury bills for all benchmark maturities at once and issue one bond maturity at a time: All Partner States
December 2011

95
Market Conventions
Current practices Recommendations Timeline
should issue all Treasury bill tenors in the same auction to support the development of the yield curve, suit investor preference and enable banks to properly manage their liquidity. They should also issue one bond maturity per auction to support market development and avoid fragmenting the market.
Auction frequency of Government Securities
In some countries, it is done weekly whereas in others it is done fortnightly.
Issue T-Bills fortnightly and Treasury Bonds monthly.
December 2011
Issuance Calendar
Publish calendars to promote transparency and certainty in the market.
December 2011
Horizontal REPO Trading
Not very active in most EAC Countries
Ensure the framework is in place: Put in place a Horizontal REPO trading framework to mitigate risk; facilitate better pricing and liquidity distribution.
December 2010
Collateral instruments for horizontal REPO
Eligible instruments will be government securities until financial markets infrastructure is in place.
December 2011
Depository arrangements
Tanzania, Uganda and Kenya have different Central Depository Systems for Government securities from those of Equities and Corporate Bonds.
In the short and medium term, depositories should be merged at national level (one per country) and interfaced at regional level. The Pan-EAC CDS shall be envisaged in the long term.
December 2011
Capital Account Liberalization (CAL)
CAL partially liberalized in Tanzania and Burundi.
Full capital account liberalization in line with the Common Market Protocol.
December 2012

96
Market Conventions
Current practices Recommendations Timeline
Foreign Exchange Market
The structure of the FX market, intervention objectives and types of interventions are not similar in EAC Countries.
Adopt a common operational framework for conducting FOREX Operations.
June 2011
Instruments used in open market operations
Different instruments are used in OMO from country to country.
Adopt a common standard for Instruments used for OMO in the region.
December2011
Trading platform
OTC Trading and Stock Exchange
Adopt a common framework that encourages trading on both platforms.
December 2011
Auction committees
In Kenya, the Auction Committee has a member from the Government Treasury
Establish a common regional standard that encourages transparency. We need to establish a common regional standard on auction management procedures that promote transparency while minimizing controls.
December 2011
Central Bank Standing Facilities
Available facilities in EAC include the Intraday; Overnight; Lombard; Rediscount and Automatic borrowing window.
Harmonize procedures and guidelines for accessing central bank standing facilities.
December 2011
Market Access Foreigners are restricted in Tanzania
Lift all restrictions to market access.
December 2011
Coding (ISIN) All members except Kenya do not use International Securities Identification Numbers.
Adopting the ISIN coding of all securities in the market in line with International Best Practices.
December 2011
Taxation (withholding tax) on T-Bills and T-Bonds.
The rate differs from country to country. (Between 10 and 15%).
Collaborate with Ministries of Finance to remove the WHT on Government bonds so as to provide incentives to the investors.
December 2011
97
5.3 Conclusion
Policy and institutional factors play a key role in the development of Financial Markets. Investors
require confidence, protection and information to participate in the market. Firms look for fiscal
incentives, ease of entry and an effective internal regulatory framework. For the securities market
to contribute significantly in the development process, it requires that the market cater for diverse
risk preferences, be liquid, efficient and have minimal volatility. To achieve this, there must be a
sound fiscal and monetary policy, effective legal and regulatory framework, secure and efficient
settlement and custodial system, effective information disclosure system, a diversified investor
base, favourable tax policies, an effective financial system, a sound and prudent debt management
and credible and stable government.
In an economy like Rwanda, the government still has an important role to play in the development
of its financial sector in general and financial markets in particular. Given the broad range of
issues identified in this study, it is clear that for Rwanda to achieve its vision in as far as financial
market is concerned, it requires policy coordination between Debt management and the monetary
policy operations. Because of potentially conflicting objectives of debt management and the
monetary policy (one focusing on the cost/risk trade-off to minimise the borrowing costs to the
government and the other being concerned with price stability), close coordination between these
two policies in Rwanda cannot be understated.
Despite the constraints highlighted in this paper, there are as well sound economic reasons for
developing the financial market in Rwanda. However, the economic benefits will only be
captured if the market is sufficiently liquid. This requires, among other factors, a critical mass of
listed securities, an investor base and trading systems that support speedy execution and efficient
price discovery. Also, regulation needs to go beyond the establishment of regulatory agencies and
the passing of laws and regulations. There has to be enforcement.
98
References
1. Adam Elhiraika (2005) “An integrated Approach to Africa’s Development Constraints”.
www.fondad.org
2. Amarakoon Bandara (2008) “Bond Market Development in Sri Lanka: A way forward”.
UNESCAP.
3. Ana Carvajal and Jennifer Elliott (2007) “Strengths and Weaknesses in Securities Market
Regulation: A Global Analysis”. IMF Working Paper WP/07/259;
4. Bank for International Settlements (1999) “Implications of REPO Markets for Central
Banks”. Basel, March 1999.
5. Bank of Kigali: Annual Report 2008.
6. Bank of Tanzania (2008) “Open Market Operations, Foreign Exchange Developments and
Interest Rate Developments in Tanzania”. Domestic Financial Markets Department, May
2008.
7. Bank of Tanzania (June 2007): The Second Generation Financial Sector Reforms. Main
Report.
8. Bank of Tanzania (June 2007): The Second Generation Financial Sector Reforms.
Background Paper to the Implementation Plan.
9. Bank of Tanzania: Guidelines for Participating in Primary and Secondary Markets for
Treasury Bills and Treasury Bonds.
10. Bank of Uganda (2008) “Five Year Financial Markets Development Plan 2008-2012”.
Financial Markets Development Committee Secretariat.
11. Bank of Uganda: Bank Supervision Report (2008).
12. Brian Kahn (2005) “Original Sin and Bond Market Development in Sub-Saharan Africa”.
The Hague, December 2005. www.fondad.org
13. Capital Market Advisory Council (Rwanda): Annual Report and Financial Statements
(2008).
14. Capital Market Authority (Kenya): Annual Report and Financial Statements 2008.
15. Capital Market Authority (Uganda): Annual Report, June 30th 2008.
16. Capital Markets Authority (Uganda): Annual Report (2008).
17. Central Bank of Kenya: Bank Supervision Report (2008).
99
18. Charles Amo Yartey and Charles Komla Adjasi (2007) “Stock Market Development in
Sub-Saharan Africa: Critical Issues and Challenges”. IMF Working Paper, WP/07/209.
19. Dar es Salaam Stock Exchange (DSE): Hand-Book, March 2008.
20. Dimitri Vittas (1999) “Pension Reform and Capital Market Development: Feasibility and
Impact preconditions”. World Bank.
21. Dimitri Vittas (1999) “Pension Reform and Financial Markets”. Harvard Institute for
International Development, Harvard University.
22. East African Community Secretariat (2009) “Report of the 12th Technical Meeting of the
EAC Monetary Affairs Committee (MAC). Kigali, Rwanda.
23. East African Community Secretariat (2009) “Report on the Status of Harmonisation of
Monetary and Financial Statistics in the EAC”. EAC Secretariat.
24. Efficient Securities Markets Institutional Development Initiative-ESMIDI (2008) “EAC
Regionalisation: Strategy and Plan Report”. CADOGAN FINANCIAL Higher House,
High Street, West Lydford, Somerton TA 11 7DG, United Kingdom.
25. Insurance Regulatory Authority (Kenya): Report for the year ended 31st December 2007.
26. Jacqueline Irving “Regional Integration of Stock Exchanges in Eastern and Southern
Africa: Progress and Prospects”. IMF Working Paper WP/05/122.
27. Janet Adelegan and Bozena Radzewicz (2009) “What Determines Bond Market
Development in Sub-Saharan Africa?” IMF Working Paper: WP/09/213.
28. Jang Hong Bum and E. Tsolmon (2008) “Bond Market Development in Mongolia: A way
forward”.
29. Marco Arnone and George Iden (2003) “Primary Dealers in Government Securities:
Policy Issues and Selected Countries’ Experience”. IMF Working Paper, WP/03/45.
30. Nairobi Stock Exchange: Market Fact File. NSE, BDD (November 2008).
31. NASDAQ OMX “Assistance for Strengthening the Marketplace for Trading Bonds in East
Africa”. Market Model Report, December 2008. Updated May 2009.
32. National Bank of Rwanda (2008) “National Payment System Framework and Strategy”.
Payment Systems Department-Kigali.
33. National Bank of Rwanda (2008) “Report on Bank Supervision 1995-2007”. Banking
Supervision Department-Kigali.
100
34. National Bank of Rwanda (2009) “Monetary Policy in Rwanda: Past and Recent
Developments”. National Bank-Kigali, April 2009.
35. National Bank of Rwanda (2009) Annual Report 2008-Kigali.
36. Paul Murgatroyd, Lames Dry, et al (2007) “Rwanda Financial Sector Development
Program Report”. FIRST Initiative.
37. Peter Quartey (2005) “Financial Sector Development, Savings Mobilisation and Poverty
Reduction in Ghana”. United Nations University, Research Paper n° 2005/71.
38. Ralph Chami, Connel Fullenkamp and Sunil Sharma (2009) “A Framework for Financial
Market Development”. IMF Working Paper, WP/09/156.
39. Republic of Rwanda (2000) “Rwanda Vision 2020”. Ministry of Finance and Economic
Planning-Kigali.
40. Republic of Rwanda (2006) “CSR Investment Policy & Guidelines and Five Year
Investment Plan (2007-2011)”. Social Security Fund of Rwanda-Kigali.
41. Republic of Rwanda (2006) “Organic Law on State finance and Property”. Official
Gazette of the Republic of Rwanda. Law n° 37/2006 of September 12th 2006.
42. Republic of Rwanda (2007) “Economic Development and Poverty Reduction Strategy
2008-2012.” Ministry of Finance and Economic Planning-Kigali.
43. Republic of Rwanda (2008) “Labour Market and Economic Activity Trends in Rwanda”.
National Institute of Statistics of Rwanda-Kigali.
44. Republic of Rwanda (2008) “Law governing the organisation of Insurance Business”.
Official Gazette of the Republic of Rwanda. Law n° 52/2008 of September 10th 2008.
45. Republic of Rwanda (2008) “Policy Guidelines for Management of Government Business
Portfolio”. Ministry of Finance and Economic Planning-Kigali.
46. Republic of Rwanda (2008) “Public Debt Policy and Debt Management Strategy”.
Ministry of Finance and Economic Planning-Kigali.
47. Republic of Rwanda (2008) “Rwanda Development Indicators-2006”. National Institute of
Statistics of Rwanda-Kigali.
48. Republic of Rwanda (2009) “National Social Security Policy”. Ministry of Finance and
Economic Planning-Kigali.
49. Republic of Uganda: The Securities Central Depositories Act, 2009.
50. Retirement Benefit Authority (Kenya): Annual Report and Accounts 2006/2007.

101
51. Rwanda Commercial Bank: Annual Report 2008.
52. Rwanda Housing Bank: Annual Report 2008.
53. S.M. Ali Abbas and Jakob E. Christensen (2007) “The Role of Domestic Debt Markets in
Economic Growth: An Empirical Investigation for Low Income Countries and Emerging
Markets”. IMF Working Paper, WP/07/127.
54. Salvatore Capasso (2006) “Stock Market Development and Economic Growth”. United
Nations University, Research Paper n° 2006/102.
55. Sam Mensah. “Capital Market Development in Africa: Selected Topics”. A training
manual for Policymakers, Regulators and Market Operators.
56. Social Security Fund of Rwanda (2009) “Semester Report 2009”. CSR-Kigali, July 2009
57. Sylviane G. Jeanneney and Kangni Kpodar (2008) “Financial Development and Poverty
Reduction: Can there be a Benefit without a Cost?” IMF Working Paper, WP/08/62;
58. Uganda Securities Exchange “The Bourse: Celebrating 10 years of Uganda Securities
Exchange”.
59. United Kingdom-Debt Management Office (2004) “A Guide to the Roles of the DMO and
Primary Dealers in the UK Government Bond Market”. London, UK Debt Management
Office, December 2004.
60. V. SUNDARARAJAN (2003) “Financial Market Development: Sequencing of Reforms
to Ensure Stability”. The IMF and World Bank. www.brettonwoodsproject.org
61. World Bank (2001) “Developing Government Bond Markets- A Handbook”. The World
Bank and International Monetary Fund.
62. World Bank (2007) “Financial Sector Integration in Two Regions of Sub-Saharan
Africa”. Africa Region, World Bank.