Embed Size (px)
Citation preview

\ DECEMBER 1972 MSC 07384
THE DEVELOPMENT OF A
NON-CRYOGENIC NITROGEN/OXYGEN
SUPPLY SYSTEM
Biotechnology Organization
LOCKHEED MISSILES & SPACE COMPANY
Sunnyvale, California
— » 01 is •**CO «< O 52Ui C/5 a! &••*
t-3 I 1/5-a tn o 5=-
•3. W I3: «; nn — o so
t-1 o •w O c*i -»— » n 'z NJ_i ?r M a;• cr o a--.Ixj O 00'jn C va a;
3£ S3
\~ \rc o
.
Prepared Under Contract NAS9-10405
fli rO H
n ran s> t-1 or,n H< '-0(1 Or o >
Ui
for
NATIONAL AERONAUTICS AND SPACE ADMINISTRATIONManned Spacecraft Center
Houston, Texas
https://ntrs.nasa.gov/search.jsp?R=19730006432 2018-07-08T09:53:49+00:00Z
1 December 1 72 MSC 0738
THE DEVELOPMENT OF A
NON-CRYOGENIC NITROGEN/OXYGEN
SUPPLY SYSTEM
Prepared under Contract NAS9-10U05
by
Biotechnology Organization
LOCKHEED MISSILES & SPACE COMPANY/INC.
Sunnyvale, California
B. M. Greenough
November 2£72
NATIONAL AERONAUTICS AND SPACE ADMINISTBATION
Manned Spacecraft Center
Houston, Texas

MSC 07381*
LIST OF CONTRIBUTORS
Name Area of Contribution
B. M. Greenough Project Leader
R. A. Lamparter System Test
R. B. Maine Prototype Design
P. A. Wagner Heat Exchanger Development
NASA TECHNICAL MONITOR
R. J. GILLEN
CREW SYSTEMS DIVISION
NASA, MANNED SPACECRAFT CENTER
ii

CONTENTS
Section Page
LIST OF CONTRIBUTORS 11
ILLUSTRATIONS v
TABLES vi
SUMMARY vli
1 INTRODUCTION 1
2 RESULTS AND TECHNICAL DISCUSSION 3
2.1 CATALYST ADDITIVES 3
2.1.1 Objectives 3
2.1.2 Test Facility and Procedure 3
2.1.3 Experimental Results and Discussion 4
2.2 CATHODE DEVELOPMENT 11
2.2.1 Objectives 11
2.2.2 Test Facility and Procedure 11
2.2.3 Experimental Results and Discussion 12
2.3 PROTOTYPE HEAT EXCHANGER . l6
2.3.1 Requirements 16
2.3.2 Analysis and Design 18
2.3.3 Manufacture 29
2.3.4 Test Facility and Procedure ; 31
2.3.5 Experiment Results and Discussion 36
2.4 CABIN P02 CONTROL 4l
2.4.1 Objectives 4l
2.4.2 Control Technique Description 42
2.5 SYSTEM TESTING 42
2.5.1 Test Plan and Procedure 42
2.5.2 System Test Summary 46
2.5.3 Test Results and Discussion 52
2.6 PROTOTYPE DESIGN 92
2.6.1 Requirements 92
2.6.2 Analysis 92
2.6.3 Detailed Design 94
2.6.4 Specifications 106
iii
CONTENTS (Cont.)
Section
2.7 RELIABILITY ANALYSIS . 107
3 CONCLUSIONS . 109
k REFERENCES 111
5 LIBRARY CARD ABSTRACT 113
APPENDIX - TEST DATA LOGS A-l
iv
ILLUSTRATIONS
Figure Page
1 ANODE TEST RESULTS id
2 CATHODE TEST DATA 13
3 CATHODE TEST RESULTS 1&
k SCALE-UP OF CATHODE TEST RESULTS 17
5 HEAT TRANSFER MODEL OF HEAT EXCHANGER • 2k
6 OVERALL HEAT EXCHANGER PERFORMANCE VS MECHANICAL 26PARAMETERS
7 HEAT EXCHANGER TEMPERATURE DISTRIBUTION 28
8 PHOTOGRAPH OF HEAT EXCHANGER AND COLD PLATE 32
9 CONTACT HEAT EXCHANGER TEST SCHEMATIC 33
10 PHOTOGRAPH OF TEST SETUP WITH INSULATION 3
11 PHOTOGRAPH OF TEST SETUP WITHOUT INSULATION 35
12 CABIN P02 CONTROL LOGIC DIAGRAM 3
13 UPDATED 02/N2 BREADBOARD SYSTEM SCHEMATIC 5
14 TEST 1 SUMMARY RESULTS k$
15 TEST 2 SUMMARY RESULTS 50
35 TEST 3 SUMMARY RESULTS 51
17 TEST 1 PERFORMANCE PLOT . 55
18 TEST 2 PERFORMANCE PLOT 60
19 TEST 3 PERFORMANCE PLOT 70
20 HYDRAZINE REACTION RATE, TEST k 77
21 ANODIC GAS COMPOSITION, TEST k 80
22 CROSS-PLOT OF HYDRAZINE AND ANODIC GAS DATA, TEST 4 8l
23 DIFFUSION MODEL OF ELECTROLYSIS CELL 86
2k CABIN PO AND ?„«„,., CONTROL CHARACTERISTICS AS A FUNCTION 88OF GAS DEMAND 1O1AL
25 PROTOTYPE UNIT ASSEMBLY 96
2.6 PROTOTYPE UNIT SCHEMATIC . 97.

TABLES
PAGE
EXPERIMENTAL ELECTRODE FORMULATION 5
2 ELECTRODE PREPARATION PROCEDURE 6
3 HEAT EXCHANGER AND COLD PLATE THERMAL PERFORMANCE 19PARAMETERS
k HEAT EXCHANGER AND COLD PLATE PARAMETERS . 20
5 CANDIDATE HEAT EXCHANGER MATERIALS 21
6 COMPARISON OF TEST AND ANALYSIS VALUES OF THERMAL 37PERFORMANCE PARAMETERS
7 SUMMARY OF CALCULATED HEAT EXCHANGER DATA 39
8 SYSTEM TEST REQUIREMENTS 7
9 SYSTEM TEST SUMMARY kQ
10 TEST 1 OPERATING CONDITIONS 53
11 TEST 1 TIME/EVENT LOG 5>
12 TEST 2 TIME/EVENT LOG 66
13 TEST 3 OPERATING COfTDITIONS 68
Ik TEST 3 TIME/EVENT LOG 69
15 CHEMICAL ANALYSIS SUMMARY - TEST k 83
16 GAS ANALYSIS SUMMARY RESULTS 89
17 PROTOTYPE UNIT DESIGN POINT SUMMARY ' 93
18 SYSTEM 4P SUMMARY 95
19 SYSTEM VOLUME SUMMARY . 95
20 PROTOTYPE UNIT DRAWING LIST 98
21 . RESERVOIR VOLUME CONTROL FUNCTIONS SUMMARY
vi

SUMMARY
A development program was conducted concerned with the further
development of the hydrazine/vater electrolysis process with ultimate applica-
tion in a manned spacecraft to provide metabolic oxygen and both oxygen and
nitrogen for cabin leakage makeup. The development of this system capable of
storing nitrogen in the chemical form of hydrazine offers potential advantages
of weight savings and less difficult resupply for long-term missions compared
to gaseous or cryogenic storage.
Phase I of this program was documented In a separate report,
NASA CR 1114912, and was concerned with initial Investigations in electrode
development, fabrication and preliminary testing of a one-man breadboard
Np/Op system, and preliminary design of a modular 12-man Np/Op system. The
present program was an extension of this effort.
Electrode development efforts were continued and directed to
specific Improvements, namely, anode stability achieved with catalyst additives
and Improved processing techniques, and a higher hydrazine conversion efficiency,
achieved by reducing the catalyst loading on the cathodes.
Extensive testing on the one-man breadboard No/°p system was conducted,
providing a more complete characterization of the cabin atmosphere control
aspects and of certain system parametric effects. Cabin oxygen partial pressure
control was improved by incorporating a new control technique.
A detailed design of a prototype modular Np/0p unit was conducted.
This design produced engineering drawings and specifications sufficient to
fabricate/procure the components necessary for an early prototype module
assembly. The contact heat exchanger which is an integral component of this
design vas fabricated and successfully design-verification tested.
vii

Section 1
UPTHOIXJCTION
For extended space-base and space-station manned missions, a nitrogen/
oxygen cabin atmosphere will be utilized. The inert diluent will reduce the fire
hazard of the oxygen and will enhance the physiological habitability of the
environment.
Oxygen consumed metabolically by the crew is recovered from metabolic
wastes in a water/waste management and regenerative life support system and
is recycled to the cabin. Water electrolysis is a process considered for use
in this cycle to recover oxygen from water and provide hydrogen for carbon
dioxide reduction.
Losses in cabin atmosphere due to cabin leakage necessitate storage of
oxygen and nitrogen for leakage makeup on long-duration missions. For a mission
of less than 30 days, it may be practical to carry nitrogen and oxygen onboard
the spacecraft using either cryogenic or high-pressure gaseous storage. For
an extended mission, however, the weight penalty associated with cryogenic or
high-pressure gaseous tankage is excessive.
The development program described herein is concerned with the use of
a hydrazlne/water electrolysis technique to provide both the metabolic oxygen
for crew needs and the oxygen and nitrogen for cabin leakage makeup. With this
system, oxygen and nitrogen are stored chemically as water and bydrazine In
low-pressure (and therefore low-weight) tankage. This system also has the
feature of providing automatic control of both the space cabin total pressure
and oxygen partial pressure.
Riase I of the program consisted of preliminary electrode evaluation,
fabrication, and checkout testing of a one-man breadboard N2/°2 system> and
preliminary design of a modular 12-man spacecraft N_/Op system. This effort
is documented In a separate report, NASA CR 11 912.

The primary objectives of the present phase of the program were to
improve the performance of the electrochemical cells and the laboratory bread-
board Ng/Op sys'tem and to provide a detailed design of components for an electro-
chemical module suitable for use in a flight-prototype, full-scale system.
The specific tasks that were completed in meeting the program objectives
were as follows:
o Experimental anodes with various loadings of different catalyst
additives were evaluated as a means of improving long-term
performance stability* •
o Experimental cathodes with various reduced catalyst loadings were
evaluated as an approach to improving the hydrazine reaction
efficiency.
o A prototype heat exchanger was designed, fabricated, and tested
to verify the design concept generated in a previous phase of2
this work.
o A new approach to controlling hydrazine feed to the breadboard
N /O system was experimentally evaluated as a means of improving
the responsiveness of the control of cabin oxygen partial pressure.
o Tests were conducted using the one-man breadboard N2/°2 8vs'bem to
determine parametric effects, allowable rates and ranges of changes
in control conditions, and performance of zero gravity compatible
components.
o Design drawings and specifications were prepared of flight-prototype
components of a full-scale module In sufficient detail to permit
fabrication/procurement of these components.
The sections that follow in this report are concerned primarily with
the areas of electrode development, heat exchanger fabrication and testing,
and system testing. The engineering drawings of the heat exchanger and the
prototype module detail drawings and specifications have been documented
separately.

Section 2
RESULTS AND TECHNICAL DISCUSSION
2.1 CATALYST ADDITIVES
2.1.1 Objectives
A large number of contributions to the literature have advanced
theories to explain the complex reaction mechanisms of the oxygen electrode,
both anodically and cathodically. No one explanation has gained universal
acceptance; the oxygen electrode remains an enigma. It has been veil docu-•3 i
mented in previous programs ' that commercial black platinum oxygen electrodes
operated anodically in basic electrolyte show a tendency toward performance
degradation when operated for long periods of time.
For ultimate application in a spacecraft, electrical performance
degradation imposes an undesirable power penalty on the electrochemical system.
In previous work at LMSC, over 250,000 cell hours of testing has been conducted
using a commercial electrode material containing a proprietary mixture including
Teflon and black platinum catalyst. In these tests, performance degradation of
the anode (oxygen electrode) could be observed as voltage increase with time at
constant applied current. It was found, with the best electrodes tested, to
characteristically consist of an approximate 10 percent voltage increase in the
first few hundred hours with stabilization to a ramp leading to a total of
approximately 15 percent over a 5,000 hour period,
The purpose of this program task was to Investigate the effects of
electrode preparation and processing techniques and certain catalyst additives
on the electrical performance characteristics of experimental anodes with the
objective of reducing long-term performance degradation.
2.1.2 Test Facility and Procedure
The test facility used for the conduct of the experimental anode tests
consists of Independently powered and controlled cell test stations In the
Bioengineering Laboratory. A detailed description of this facility can be
found in Section 2.1 of NASA CR

pA series of electrodes vith an active area of 18 cm were prepared
using several different catalyst additives as shown In Table 1.
The catalyst additives which were used were rhodium black, ruthenium
black and iridium black. The two extenders were methyl cellulose (M.C.) and a
water soluble polymer, brand name Jaguar (JF3)•
The procedures used to prepare these electrodes are presented in
Table 2. Finished electrodes were visually inspected for mechanical integrity.
Those which passed this inspection were subjected to thermogravimetric analysisp
to determine organic residue. Test cells were operated at 2.JA (150 mA/cm )
ambient temperature and pressure, with 3Q% KDH electrolyte. The test duration
varied from a few hours for those electrodes which failed early to several
hundred hours where they showed promise.
2.1.3 Experimental Results and Discussion
Formulations Processing
The electrode processing procedures shown in Table 2 were partial 1y
developed under Contract NAS 9-118U8. Key elements of the formulation are
described below.
Extender.--A water-soluble polymer extender is added to the catalyst
formulation to occupy space when the catalyst mixture is applied to the sub-
strate. It is subsequently removed in the post-treatment leaching process,
leaving the desired porosity in the active material.
Teflon.- An aqueous dispersion of Teflon is added to the formulation
to act as a binder to permit high loadings of catalyst on the substrate.
Catalyst*- Noble metal blacks are used as the catalyst to provide
high surface area.
Mineral Oil.- The catalyzed substrate is sprayed with a light film
of mineral oil to lubricate the surfaces during calendaring and to prevent
catalyst from adhering to the Mylar backing.
Post-treatment of the electrode material is necessary to remove the
extender, the mineral oil, and organic .residue from the Teflon dispersion. It
has been found that residual extender has a serious detrimental effect on
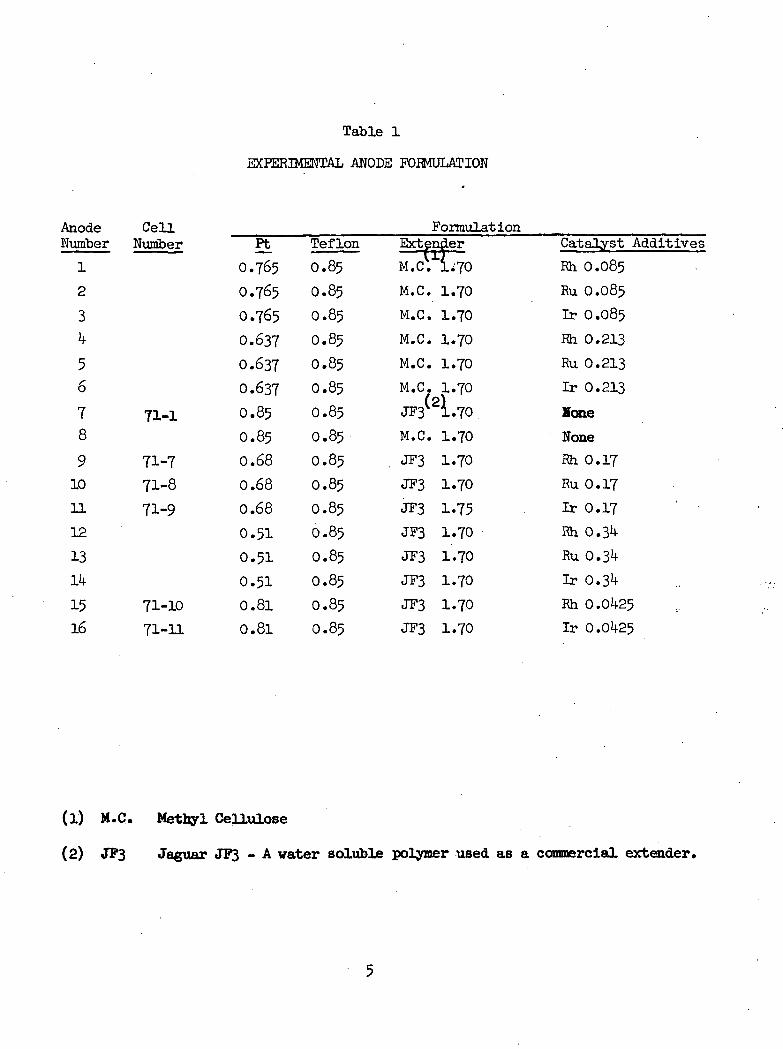
Table 1
EXPERIMENTAL ANODE FORMULATION
AnodeNumber
1
2
34
56
78
9101112
13Ik
1516
CellNumber
0
0
0
0
0
0
71-1 °0
71-7 071-8 0
71-9 000
071-10 071-11 0
FormulationPt
.765
.765
.765
.637
.637
.637
.85
.85
.68
.68
.68
• 51• 51•51.81.81
Teflon
0
0
0
0
0
0
0
0
0
0
0
0
0
0
0
0
.85
.85
.85
.85
.85
.85
.85
.85
.85
.85
.85
.85
.85
.85
.85
.85
Ext(
M.C
M.C
M.C
M.C
M.C
M.C
pndera. i. i. i. i. i
*70•70•70.70•70.70
Catalyst Additives
Rh
Ru
Ir
Rh
Ru
Ir
0
0
.085
.085
0.085
0
0
0
.213
.213
.213JF3Ui.70 Hone
M.C
JF3JF3
JF3JF3JF3JF3
JF3
JF3
. iiiiiiiii
•70.70.70
•75•70.70.70•70.70
None
Rh
Ru
Ir
Rh
Ru
Ir
Rh
Ir
0
0
0
0
0
0
0
0
.17
.17
.17
.3
.34
.34
.0425
.0425
(1) M.C. Methyl Cellulose
(2) J?3 Jaguar JF3 - A vater soluble polymer used as a commercial extender.
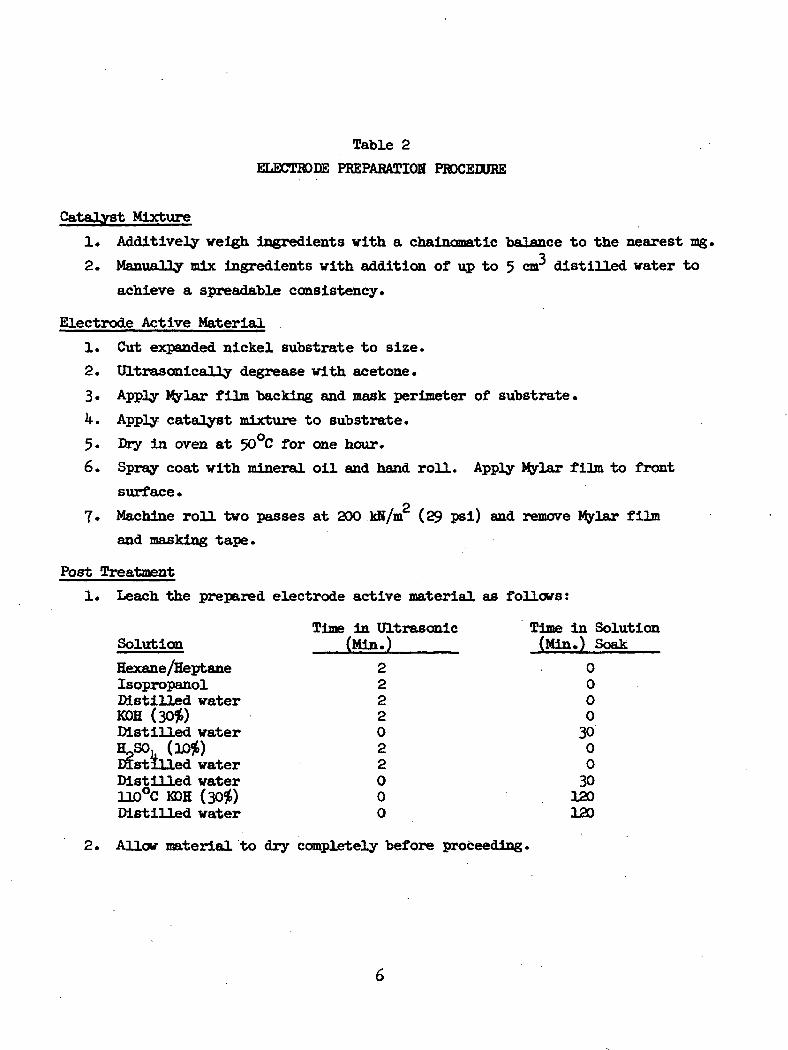
Table 2
ELECTRODE PREPARATION PROCEDURE
Catalyst Mixture
1. Addltively weigh ingredients with a chainomatic balance to the nearest mg,
2. Manually mix ingredients with addition of up to 5 osr distilled water to
achieve a spreadable consistency.
Electrode Active Material
1. Cut expanded nickel substrate to size.
2. Ultrasonically degrease with acetone.
3* APPly Mylar film backing and mask perimeter of substrate.
k. Apply catalyst mixture to substrate.
5» Dry in oven at 50°C for one hour.6. Spray coat with mineral oil and hand roll. Apply Mylar film to front
surface.p
7* Machine roll two passes at 200 kN/m (29 psi) and remove Mylar film
and masking tape.
Post Treatment
1. Leach the prepared electrode active material as follows:
Time in Ultrasonic Time in SolutionSolution (Min.) (Min.) Soak
Hexane/Heptane 2 0Isopropanol 2 0Distilled water 2 0KQH (30#) 2 0Distilled water 0 30H SO. (Wft 2 0Distilled water 2 0Distilled water 0 30HO°C KDH (30%) 0 120Distilled water 0 120
2. Allow material to dry completely before proceeding.

Table 2
ELECTRODE PREPARATION PROCEDURE
(Continued)
Electrode Assembly1. Form depression In electrode rim to accept catalyzed substrate.
Adjust depression fixture to sane thickness as electrode material
substrate•2. Insert electrode material and rim in apotwelding fixture and over-
lap spottreld around periphery. Scribe outside veld line, remove
from fixture and break off excess substrate.
3. Cut and spotweld together spacer and support screens.
k. Spotweld screen assembly to electrode rim.
5. Apply vinyl tape to rim.
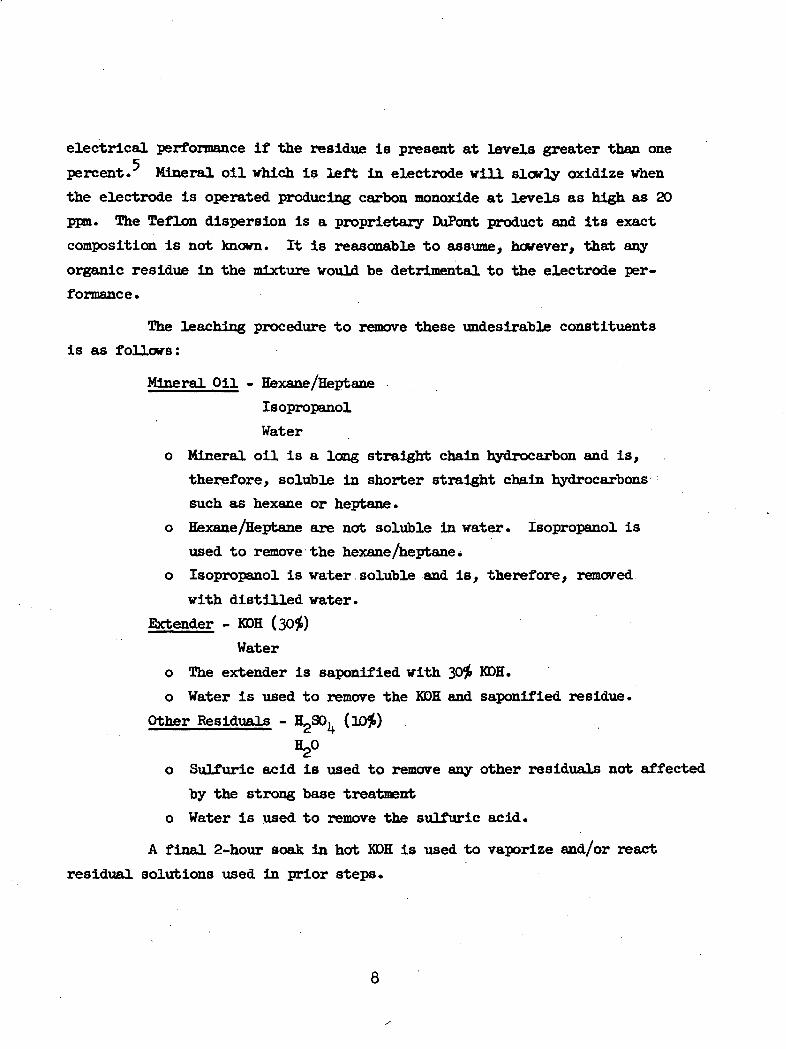
electrical performance if the residue is present at levels greater than one
percent. Mineral oil which is left in electrode will slowly oxidize when
the electrode is operated producing carbon monoxide at levels as high as 20
ppm. The Teflon dispersion is a proprietary DuFont product and its exact
composition is not known. It is reasonable to assume, however, that any
organic residue in the mixture would be detrimental to the electrode per-
formance.
The leaching procedure to remove these undesirable constituents
is as follows:
Mineral Oil - Hexane/Heptane
Isopropanol
Water
o Mineral oil is a long straight chain hydrocarbon and is,
therefore, soluble in shorter straight chain hydrocarbons
such as hexane or heptane.
o Hexane /Heptane are not soluble in water. Isopropanol is
used to remove the hexane /heptane .
o Isopropanol is water soluble and is, therefore, removed
with distilled water.
Extender - KDH (30#)
Water
o The extender is saponified with 30$ KDH.
o Water is used to remove the KDH and saponified residue.
Other Residuals -
"2°o Sulfuric acid is used to remove any other residuals not affected
by the strong base treatment
o Water is used to remove the sulfuric acid.
A final 2-hour soak in hot KDH is used to vaporize and/or react
residual solutions used in prior steps.
8
The first series of experimental anodes vhich were prepared In this
program (Table 1, Anode Nos. 1-6) used methyl cellulose as the extender. It
vas found that these electrodes did not maintain mechanical integrity during
the post-treatment leaching process.
To investigate the problem, two platinum-only electrodes were pre-
pared (Anode Nos. 7 and 8, Table l), one with methyl cellulose and one with
Jaguar F3, a commercial extender. Both were subjected to post-treatment and
only the Jaguar-extended electrode survived the leaching process. All sub-
sequent anodes In the series were successfully prepared with JP3 extender.
Electrodes which passed the mechanical Integrity inspection after
post-treatment were subjected to TGA analysis. All showed one percent or less
residue.
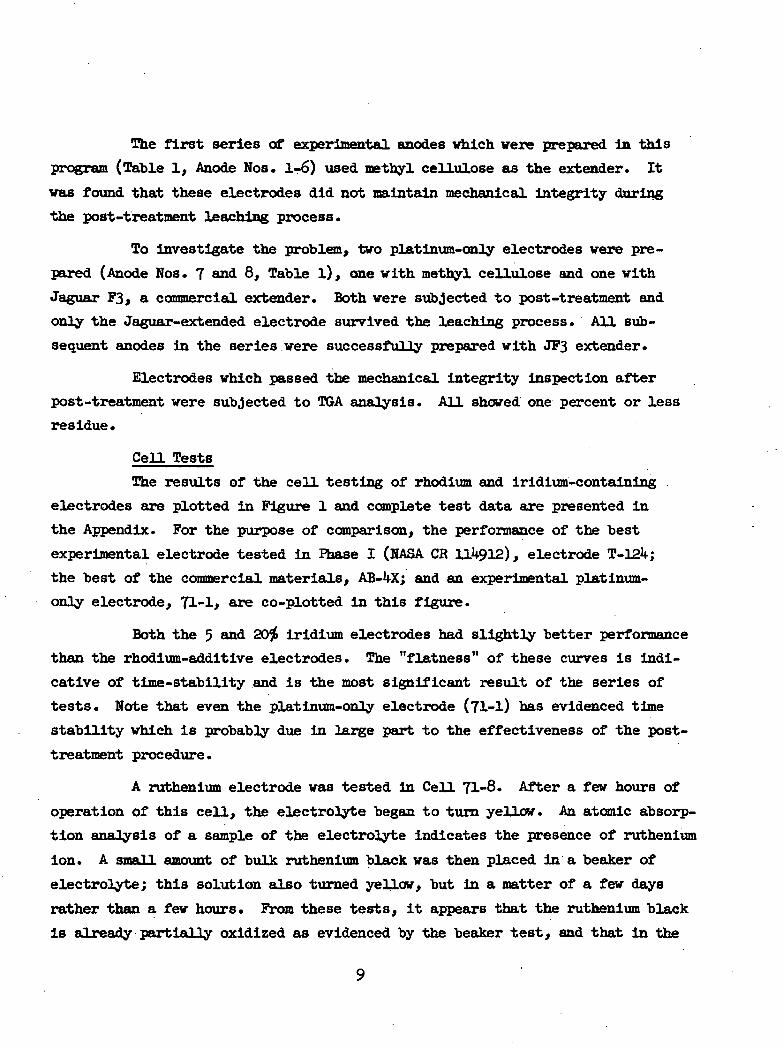
Cell Tests
The results of the cell testing of rhodium and iridium-containing
electrodes are plotted in Figure 1 and complete test data are presented in
the Appendix. For the purpose of comparison, the performance of the best
experimental electrode tested in Phase I (HASA CR 114912), electrode T-124;
the best of the commercial materials, AB- X; and an experimental platinum-
only electrode, ?!-!> are co-plotted in this figure.
Both the 5 and 20% iridium electrodes had slightly better performance
than the rhodium-additive electrodes. The "flatness" of these curves is indi-
cative of time-stability and is the most significant result of the series of
tests. Note that even the platinum-only electrode (71-l) has evidenced time
stability which is probably due in large part to the effectiveness of the post-
treatment procedure.
A ruthenium electrode was tested in Cell 71-8. After a few hours of
operation of this cell, the electrolyte began to turn yellow. An atomic absorp-
tion analysis of a sample of the electrolyte indicates the presence of ruthenium
ion. A small amount of bulk ruthenium black was then placed in a beaker of
electrolyte; this solution also turned yellow, but in a matter of a few days
rather than a few hours. From these tests, it appears that the ruthenium black
is already partially oxidized as evidenced by the beaker test, and that in the

w-p
CO0)K-Pw0)
bO
(IIOA)
IX)

strong oxidizing environment of the operating anode, oxidation proceeds to the
soluble tetroxide state. This material was, therefore, deemed unsatisfactory
as a catalyst additive; no further cell tests were conducted with this type
of anode.
2.2 CATHODE DEVELOPMENT
2.2.1 Objective
It is known that hydrazine undergoes auto-oxidation in the presence
of a suitable catalyst. In the hydrazine/water electrolysis system, hydrazine
is Injected in the circulating electrolyte for the purpose of generating nitro-
gen admixed with the anodic oxygen produced by water electrolysis. Any hydrazine
which reacts at the catalyzed cathodes within the electrolysis cell stack repre-
sents an Inefficiency in the process of generating nitrogen at the anodes.
The objective of this task, then, was to determine experimentally the
optimum catalyst loading of the cathode considering the conflicting parameters
of anodic conversion efficiency and of cell voltage penalty for reduced catalyst
loading of the cathode.
2.2.2 Test Facility and Procedure
The test facility used for the conduct of the experimental cathode tests
consists of Independently powered and controlled cell test stations located in the
Bioengineering Laboratory. A detailed description of this facility can be found
in Section 2.1 of NASA CR 114912.
A series of four electrolysis cells were assembled, each cell containing2a 90 cm cathode with different catalyst loading as follows:
Formulation
Cell Ho. Cathode Ho. ~~
71-2 C-l
71-3 C-2
71-5 C-371-4 C-4
The catalyst formulations were applied to 0.25 mm thick expanded nickel
screen substrates. The extender, Jaguar Polymer F-3 was then leached out in a
sequence of ultrasonically agitated baths containing hexane, isopropyl alcohol,
water, 110°C (230°F) KDH, water, 10# HgSO , and water.
11
Pt.2.51.0
0.5-Or
Teflon
2.51.0
0.5-0-
Extender5.0
3-0
-0-
-0-
p
Each cell was operated for approximately 48 hours at 150 mA/cm
current density and 27 C (80°P) without hydrazlne to determine the cathode
polarization. Then each cell was operated for approximately 48 hours under
the same conditions with an Initial charge of approximately 2 gram moles of
hydrazlne.
Voltage and current data were recorded every two hours during the
day shift. Gas flow rates, anodic and cathodic, were measured with soap
bubble flowmeters every two hours during the day shift, and electrolyte
samples were titrated three times each day during the hydrazine portion
of the tests. Care was taken to keep liquid samples small (less than one
percent of total system volume) to keep sample effects negligible. Gas
samples were analyzed for W periodically.
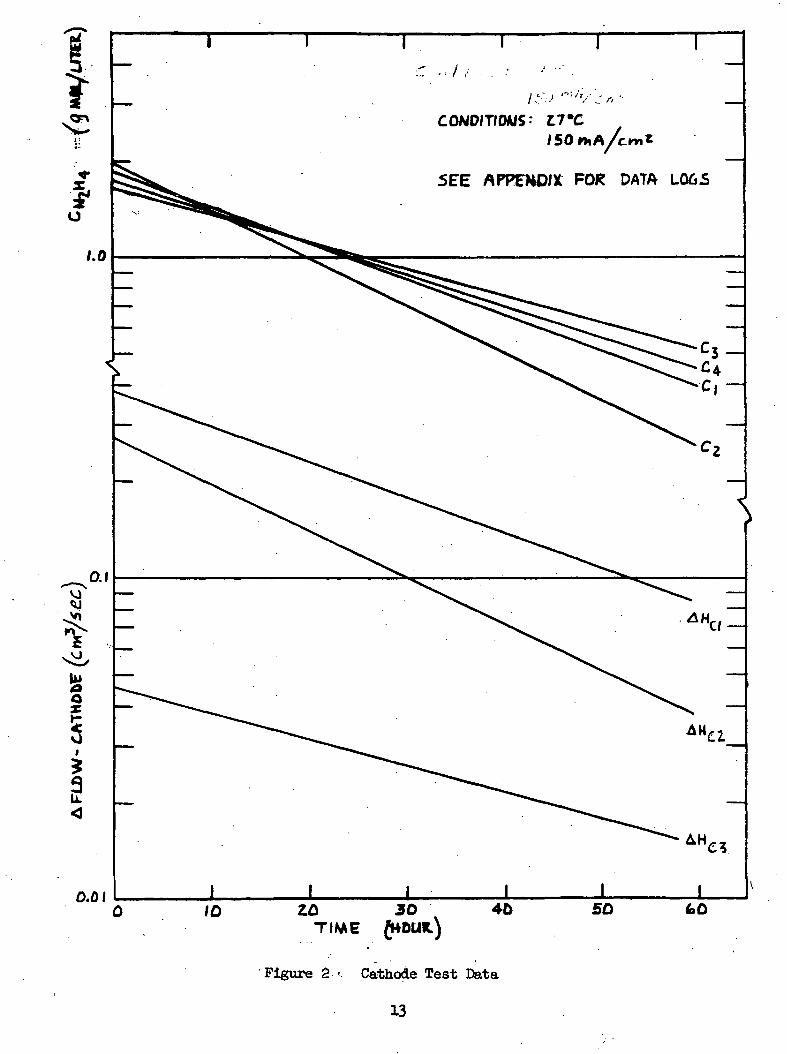
2.2.3 Experimental Results and Discussion
A summary of the experimental data from the cathode evaluation tests
is presented in Figure 2. In this figure, the hydrazine concentration in the
electrolyte and the increase in cathodic gas flow rate due to hydrazine decom-
position are plotted as a function of time. The plots of A He show the increase
in hydrogen flow of the cathodes with hydrazine over the cathode with no hydra-
zine. The increasing voltage performance of the cathodes was the following:
C-l 2.5 Pt 0.179 volts
C-2 1.0 Pt 0.200 volts
C-3 0.5 Pb 0.520 volts
. C-4 bare nickel 0.700 volts
With the above data and the data shown In Figure 2, a cross-plot of
cathode flow versus cathode polarization was made with hydrazine concentration
as a parameter. This plot is shown in Figure 3*
Referring back to Figure 2, the anodic hydrazlne conversion efficiency
(defined as the mole-percent of the total hydrazine added that reacts at the
anode) was determined for each cell using the following procedure. The reaction
rate constant, m, is defined by:In C - In Co
». 1dcAt any time, t, the hydrazlne reaction rate is -^ = C^m = X^.
12
o.\
i r^r . . - / / . ••
CONDITIONS: LTC
SEE APPEHD/X FOR DATA L06S
vj
Y
0
§i
1
0.01 IID 2.0
TIME30 4D
'Figure 2 Cathode Test Data
13
fcO

tiQ
Oh- -P£T WNJ <"rw B
^ «5 "gQ ft
UJ ^
Q g3

Hydrogen gas is generated electrochemically at a rate defined "by:
(E e = 2(0.0096)1 g-mols/hr
Where I = electrolysis current (amperes)
The amount of hydrazine reacting at the cathode at this time, t, is computed
with the equation:
Xc = *TC " e g-mols/hr3
•Where nVj,c » measured cathodic gas flow rate. The quantity,
(Hp) can also be determined by measuring the cathodic gas flow rate, with
and without hydrazine . This quantity then is equivalent to the measured AH
shown in Figure 2. The factor, 3> in the equation arises from the fact that
one mole of hydrazine reacting produces three moles of gas.
The amount of hydrazine reacting at the anode is obtained by
difference:
The reaction efficiency is defined as
T] = \ X 100
*TFor the four cells which were tested, efficiency was computed using the above
procedure with the following results:
Cathode *? %
C-l 60.9
C-2 79-6
C-3 93C- 100
There is some uncertainty in the absolute values of the efficiencies computed
by the above technique, principally due to the possibility of errors in measure-
ment of very small differences in cathodic flow rate. As a check on the
technique, efficiency was computed for two cases using two different methods.
In the first case, the efficiency for C-l was computed using the empirical
equationX = U.77C + 0.0134C(150) (60) (k.Q6 X 10"5)a I J
15

which was determined experimentally with the breadboard N_/0 system (Ref .
NASA CR 114912). Xt was computed in the same manner as in the previous technique.
This computation yielded a value of 7} of 6k. 1% compared to the previously
determined value of 60.9%.
In the second case, efficiency was calculated for C-3 based on gas
chromatographic analysis and total gas flow rate measurement. This method
yielded an efficiency of 92f> compared to the previously determined value of
Having established that the efficiency values determined by the
different techniques are in reasonable agreement, the original values were
used to trade off hydrazine tankage and power and cooling penalty versus
cathode polarization for a full scale 12 -man system. Penalty factors for
power and cooling and tankage for hydrazine storage were taken from IMSC/
A977U98, "Preliminary Design of a Space Station Electrolytic Oxygen-Nitrogen
Generator". !Ehe results are shown in Figure k. It is evident from this figure
that system total equivalent weight (TEW) can be optimized by controlling the
composition of the cathode. While the four data points which were obtained
were not sufficient to determine the exact catalyst loading, it is apparent
that the normal loading should be reduced by 1*0 to 50 percent to achieve
maximum TEW. These results substantiate the prediction of Curve C, Figure
Ck in LMSC/A977498.2
2.3 PROTOTYPE HEAT EXCHANGER
2.3.1 Requirements
The heat exchanger design conceived for the 12-man unit preliminary
design effort (IMSC/A977 98) was to be subjected to analysis, detailed design,
fabrication, and design verification testing in this program task. The heat
exchanger and cold plate assembly were required to simulate, as closely as
possible, the final N /O flight prototype configuration. Thermal performance
was the most Important consideration, although physical configuration had to
be as close as possible to a flight prototype design, especially in the heat
exchanger, which was to be internally coated to prevent gas formation in the
electrolyte loop. The cold plate had only to simulate the flight item In
performance characteristics.
16

1.0
V '•«Q
h-xvauj l.O
5
0.1 0.4
TEW
(\tOL7)
k Scaleup of Cathode Test Results
17

Thermal performance parameters, as listed In Table 3, are those
associated with the N2/°2 Fr^1'tm'tnary design. These values are for a 1.5-man
module, and vere the best available at the time the analysis was performed.
All analysis and design vere based on these values.
2.3.2 Analysis and Design
During the analysis and design phase, the optimum configurations for
both heat exchanger and cold plate vere determined. The analysis and design
tasks vere Integrated because the design detail, necessary to assure produci-
bility and meet the required cost target, significantly impacted the thermal
design. This vas especially true for the heat exchanger, where internal
coating vas necessary, and In the contact Interface between the heat exchanger
and cold plate. During the analysis and design phase, attention vas focused
on material considerations, optimization of the heat exchanger and cold plate
assemblies, interface analysis, overall performance, and detail design.
A summary of the mechanical and predicted thermal parameters for
the chosen heat exchanger and cold plate configuration is presented inTable k.
Material Considerations
Desirable material properties Included high thermal conductivity,
chemical resistance to the coolant fluids, good machinabUity and brazability,
and availability. For this reason, materials commonly used in heat exchangers,and other alloys specifically attractive to this particular design, vere
considered.
Candidate materials and their properties are summarized in Table 5-
Nickel 200 vas selected for both the heat exchanger and cold plate, as it hasthe highest thermal conductivity of the materials which vere completely
compatible with all fluids Involved. Also, it is readily obtainable and fairly
inexpensive* It has the drawback that it is very soft, and therefore is
difficult to machine, but this vas not considered serious enough to preclude
its use. Other materials considered vere aluminum, stainless steel, and
molybdenum.
18
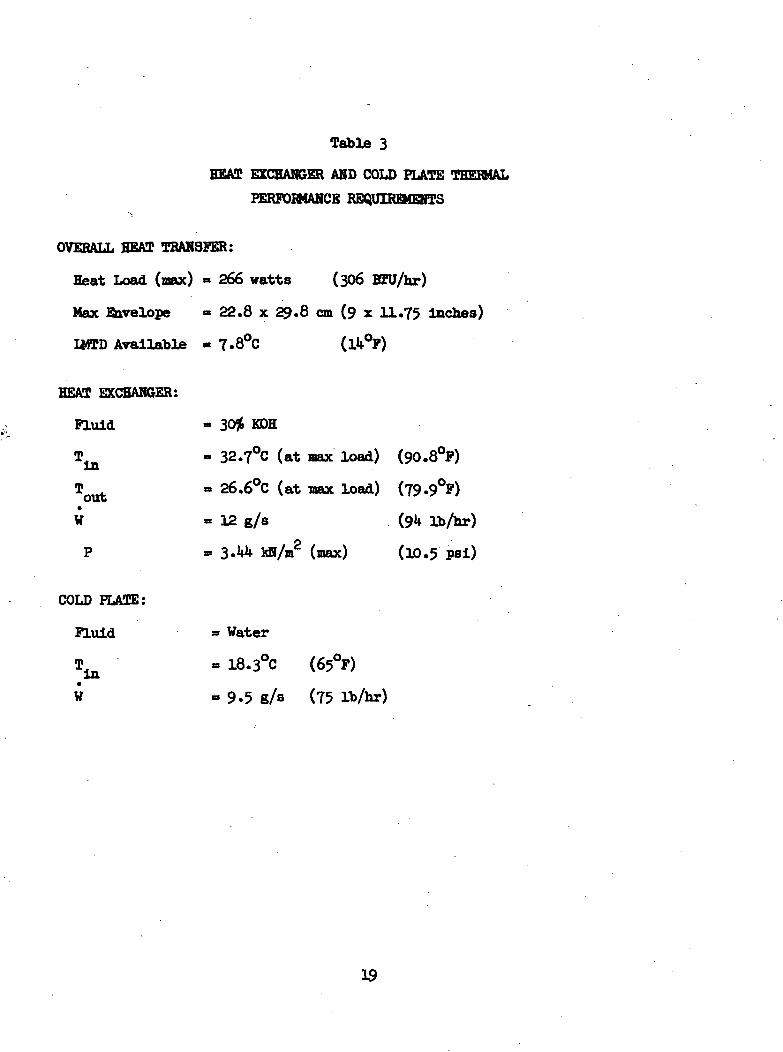
Table 3
BEAT EXCHANGER AND COLD PLATE THERMAL
PERFORMANCE REQUIREMENTS
OVERALL HEAT TRANSFER:
Heat Load (max) » 266 watts (306 HFU/hr)
Max Envelope « 22.8 x 29.8 cm (9 x 11.75 Inches)
ttiTD Available « 7.8°C (l °F)
HEAT EXCHANGER:
Fluid - 30# KDH
T - 32.?°C (at max load) (90.8°F)
T , - 26.6°C (at max load) (79.9°F)oucW « 12 g/s (9k Ib/hr)
P m 3.H MJ/m2 (max) (10.5 psl)
COLD PLATE:
Fl\d.d * Water
Tln " 18-3°C (65°F)
W - 9.5 g/s (75

Table k
HX AND CP PARAMETERS
PREDICTED THERMAL PERFORMANCE PARAMETERS
OVERALL
Q « 266 watt (max)
U overall = 5-9 J/s • °C • m2
Flow arrangement - Counterf low
LMTD required = 7.9°C
Heat Exchanger
Uu = 1U20 J/s °C m2n XFluid - 30$ KDH
W e 12 mkg/s
0.689 kN/m2
Cold PlateUcp - 1760 J/s °C m
2
Fluid » Water•
W = 9.5 mkg/s
Interface
Uj = 1530 J/s °C m2
Area » 0.068 m2
MECHANICAL VARIABLES (Heat Exchanger and Cold Plate)
Material Nickel 200
Horiz. Plate Thickness 0.75 mm
Passage Height 1.5 mmNo. of Layers of Passages 2
No. Vertical Bars/Inch k
Vertical Bar Thickness 1.88 mmBaseplate Thickness 3.12 mm
Baseplate Dimensions 22.8 x 29*8 cm
Braze Alloy 85$ gold, 15 nickel
(906 BTU/hr)
(915 BTU/hr °F ft2)
(250 BTU/hr)
lb/hr)
(0.1 psi)
(31X) BTU/hr)
(75 lb/hr)
(270 BTU/hr °F ft2)
(0.735 ft2)
(0.030 in.)
(0.060 in.)
(0.075 in.)(0.125 in.)
(9 x 11.75 in.)
20

V
ah
ITk 133«•§ *CV1
,*»<§*
0^0
CO
CM
3
9 ,
o ^
3
I
Q <^ONo
o 'CO
en jt4, A•« 45
3
O O\O ^*
9)
a
U
CO
eu 3
ir\
O *— '
01
CO
CO
VO
S3
VOO CO
30)
1H
O
21

Aluminum has the highest thermal conductivity of common materials,
is readily available and workable, and is often used in conventional heat
exchangers. It is compatible with the cold plate coolant fluids and although
it is not compatible vith KDH, it could possibly be used in the heat exchanger
due to the coating required to prevent electrolytic action. It was felt,
however, that a plnhole in the coating could cause rapid deterioration of
the aluminum due to chemical attack. Also, although it appears compatible
with fluids which would be used in the cold plate, Hamilton Standard has
stated that it is not acceptable for SSP. Aluminum was thus considered
inappropriate for both heat exchanger and cold plate use.
Stainless steel is also commonly used in heat exchangers and is com-
pletely compatible with «i\ fluids involved. In addition, it is readily
obtainable and workable. It, however, has the drawback of low thermal con-
ductivity.
Molybdenum has excellent thermal conductivity but is not completely
compatible with KDH, is difficult to obtain, and is expensive.
Composite or laminated materials and special alloys were not considered
practical at this time, but have some merit and should be considered in advanced
program phases.
Kynar was selected for the internal coating because it is resistant
to chemical attack, is non-porous, and can be poured through internal passages.
Teflon coatings were not feasible, as they are porous and also cannot be poured
through internal passages. The application of the coating was controlled by
the vendor in accordance with his experience.
Heat Exchanger and Cold Elate Optimization
Optimization consisted of determining the best possible dimensions
for all elements of the heat exchanger and cold plate, taking into account
thermal, mechanical, and manufacturing criteria. Due to budget limitations,
and to allow an opportunity to evaluate the effect of the Kynar coating on
thermal performance, the cold plate is identical to the heat exchanger except
that it is not Internally coated.
22
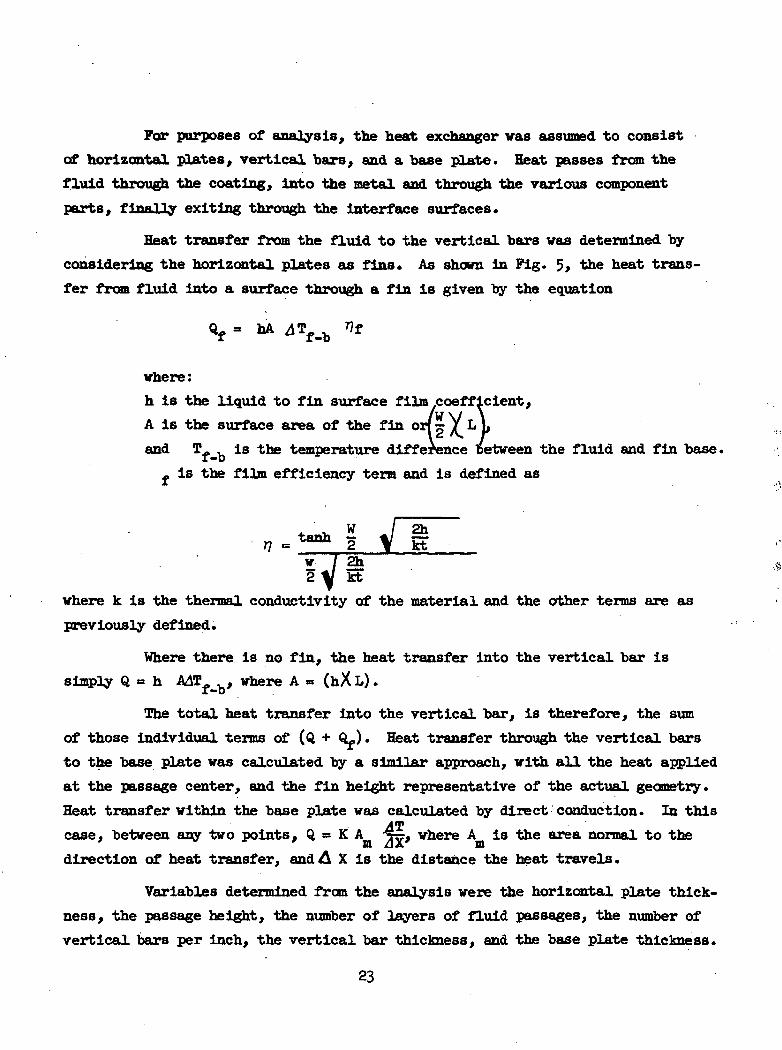
For purposes of analysis, the heat exchanger vas assumed to consist
of horizontal plates, vertical bars, and a base plate. Heat passes from the
fluid through the coating, into the metal and through the various component
parts, finally exiting through the interface surfaces.
Heat transfer from the fluid to the vertical bars vas determined by
considering the horizontal plates as fins. As shown in Fig. 5, the heat trans
fer from fluid into a surface through a fin is given by the equation
Qf = hA
where:
h is the liquid to fin surface film coefficient,i W \l \A is the surface area of the fin orj / L I,
and T« is the temperature difference between the fluid and fin base.
. is the film efficiency term and is defined as
tanh H J 2 % kt
w2
where k is the thermal conductivity of the material and the other terms are as
previously defined.
Where there is no fin, the heat transfer into the vertical bar issimply Q = h A4T , , where A «= (hXL).
The total heat transfer into the vertical bar, is therefore, the sum
of those individual terms of (Q + Q~). Heat transfer through the vertical bars
to the base plate was calculated by a similar approach, with all the heat applied
at the passage center, and the fin height representative of the actual geometry.
Heat transfer within the base plate was calculated by direct conduction. In this
f ., where A is the area normal to the
direction of heat transfer, and A X is the distance the heat travels.
Variables determined from the analysis were the horizontal plate thick-
ness, the passage height, the number of layers of fluid passages, the number of
vertical bars per inch, the vertical bar thickness, and the base plate thickness.
23

\
W
H0)
CO
•8<u
W

Horizontal plates were limited to a minimum thickness of 0.75 cm
(0.3 in) by manufacturing considerations. Ideal thickness would be much thinnerthan this, as the fin efficiency for a 0.75 cm (0.3 In) fin In the selected
configuration is 91%. This would drop to only 93 if the thickness were cut
In half and would affect a significant reduction in unit weight.
The passage height effects the hydraulic diameter and therefore thefilm coefficient. It is desirable to have the height as amnli as possible,
within the constraints of manufacturing considerations and pressure drop. The
1.5 mm (0.060 in) height chosen is based on providing sufficient height for theKynar coating.
The number of layers of passages is a function of the required heattransfer and the available base plate area. As can be seen from Fig. 6, the
minimum number of layers necessary is desirable as additional layers become
less and less efficient. The heat load present in this case required 2layers of passages.
The number of vertical bars per cm should be the maximum possible.Due to the requirement for coating, however, and since the horizontal plates
were limited to 0.75 mm (0.030 In) thickness, 1.57 fins/cm (k fins/in) wasselected as a reasonable compromise.
The vertical bar thickness is a function of the number of fins/cmand the number of layers of passages. Fig. 6 also shows this relationship for
the selected package size. It should be noted that this figure is based on
average fluid temperatures, but that it neglects the non-linear T gradient
created by the reduced heat transfer per layer and constant mass flow per
layer. This effect is significant for large numbers of layers. A 1.9 mm
(0.075 in) vertical bar was selected, as it gave good heat transfer and elimin-
ated any possibility of the non-linear temperature gradient affecting the
exchanger performance.
A base plate thickness of 0.318 (0.125 in) was selected as providing
reasonable «yj*O. heat distribution with a minimum of vertical resistance. Also,
it provides sufficient mechanical strength to prevent warping of the interfacesurface. Slight variations in the base plate thickness significantly affect the
weight of the heat exchanger but do not have too much affect on thermal performance.
25

in
LUCOf->V•p
O
QCLU
CO
rJ
Q d
Q
tiod v
o
u .
1 10 9in °
|oM
|
sf>J
1
Q
!oo
1 1oU1
•H
O
CO
0)O
IMD
0)
26
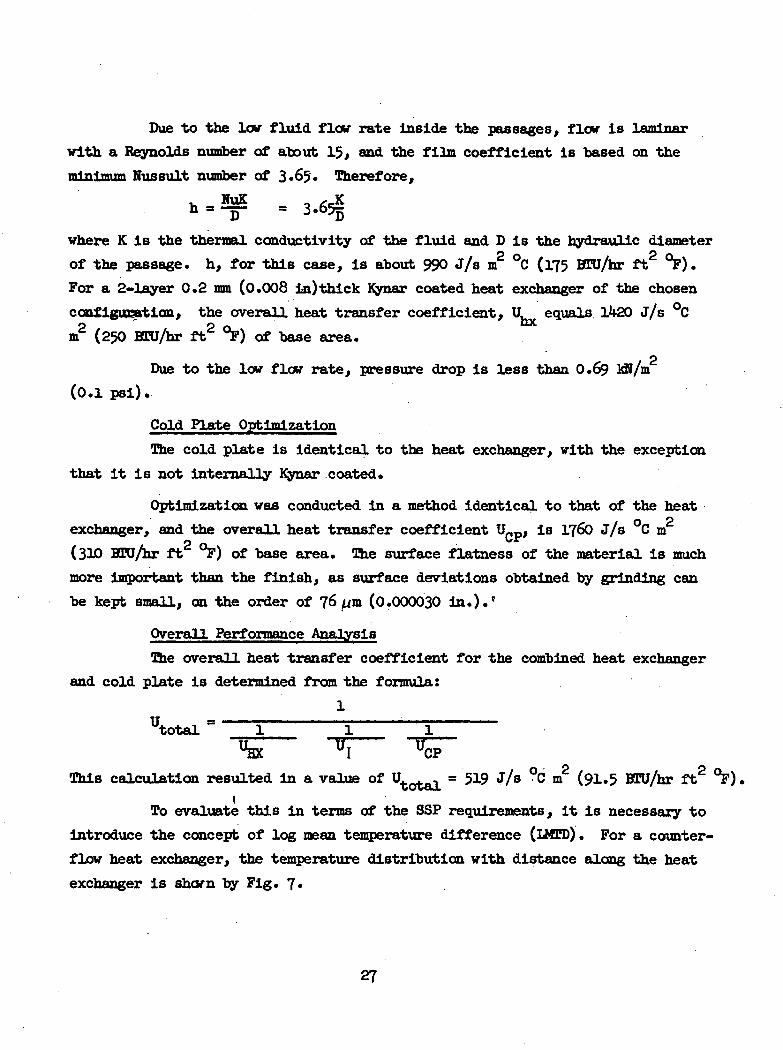
Due to the lov fluid flow rate Inside the passages, flew is laminar
with a Reynolds number of about 15, and the film coefficient Is based on the
Nussult number of 3.65. Therefore,
where K is the thermal conductivity of the fluid and D is the hydraulic diameter
of the passage, h, for this case, is about 990 J/s m2 °C (175 HTO/hr ft °F).
For a 2-layer 0.2 mm (0.008 in) thick Kynar coated heat exchanger of the chosen
configuration, the overall heat transfer coefficient, U, equals 1420 J/s °C
m2 (250 BTU/hr ft2 °F) of base area.p
Due to the lov flow rate, pressure drop is less than 0.69 kfl/m
(0.1 psi).
Cold Plate Optimization
The cold plate is identical to the heat exchanger, with the exception
that it is not internally Kynar coated*
Optimization was conducted in a method identical to that of the heat
exchanger, and the overall heat transfer coefficient U_p, is 1760 J/s °C m
(310 HTO/hr ft °F) of base area. The surface flatness of the material is much
more Important than the finish, as surface deviations obtained by grinding can
be kept small, on the order of 76 ym (0.000030 in.)*'
Overall Performance Analysis
The overall heat transfer coefficient for the combined heat exchanger
and cold plate is determined from the formula:
1Utotal
vl "CP
This calculation resulted In a value of Utafcal = 519 J/s °C m2 (91.5 BTU/hr ft2 °F).
tTo evaluate this in terms of the SSP requirements, it is necessary to
introduce the concept of log mean temperature difference (IMTD). For a counter-
flow heat exchanger, the temperature distribution with distance along the heat
exchanger is shorn by Fig. 7.

I-3Q
UJ

UCED is defined as
ATI -/\T2IMFDATI
Slnce Q = totalSase UCD> thfi IMED required to transfer 266 watts of heat is7.9°C (1U.2TJO. The SSP requirements show that a t.8°C (ll4..0°F) IMUD is avail-able under the worst conditions, and thus the heat exchanger should work properly.
Detail Design
The passage plates are machined from one piece each, and then brazed
to the base plate to reduce costs and facilitate fabrication. The base plate
is Initially thicker than required to keep the part from warping during brazing,
and to provide sufficient material for ma^M^ne operations which are conducted
after brazing.
The large slots at each end of the plate allow fluid inlet and outlet
with simple headers, while still affording access for the Kynar coating which
must be applied after the assembly is brazed* The tapped holes allow attach-
ment of the fluid headers without requiring bolting of the interface, thus
allowing evaluation of thermal performance as a function of interface pressure.
Also, two blind holes are provided In the center of the plate to accept thermo-
couples and thus give an Indication of the temperature close to the interface
surface. Nine through bolt holes are provided to allow uniform clamping overthe entire interface surface.
Headers are plastic for complete compatibility with the fluid and to
eliminate electrolyte problems. A face "0" ring seal assures a leak tight
connection. Design of the headers places the fluid Inlet and outlet on opposite
corners of the plate, thus assuring a uniform distribution of flow within the
passages inside the plates.
2.3.3 Manufacture
During manufacture, the passage plates and base plate detail parts
for both the heat exchangers and cold plate were machined, and then brazed
together. The heat exchanger was internally coated with Kynar and then finish
machined. This last operation consisted of drilling the required holes and
the finishing of the interface surfaces.
29

Machining of the slots In the passage plates was accomplished by
using a thin, large diameter milling cutter. Some difficulty was experienced
as the material did not machine cleanly but tended to be "gummy". This required
high tool pressure and caused varpage of the plates. Also, some projection
of material was experienced on the side opposite the side being machined.
This projection was removed from the passage plate which was to be placed
next to the base plate on each assembly, and this was accomplished by grinding
the entire surface plate.
Brazing was accomplished by using an 85$ gold, 15$ nickel alloy and
furnace brazing the parts together in an evacuated atmosphere, while clamping
pressure was continuously applied.
X-rays taken after brazing showed 100$ braze integrity in the center
of the assembly. Some small localized voids were noted near the edges, however,
These probably were caused by stresses induced In the shearing of the raw stock.
Kynar coating of the interior of the heat exchanger was accomplished
by thinning the Kynar and pouring it through the interior passages. Exterior
areas were masked and the Kynar was sprayed on. Three coats of Kynar were
applied, and each coat was individually cured by heating to about 300°C (550°P).
Total Kynar thickness was about 0.5 to 0.8 //m (0.002 to 0.003 in.).
The final machining operation consisted of drilling all the required
holes, and the finishing of the interface surface. This latter task was
accomplished by grinding. Lapping was tried, but pre-stresses Induced during
grinding were released, making the surface flatness worse rather than better.
On both the heat exchanger and cold plate, the final surface finish was about
0.6 jUm (0.6 microinches) and the flatness was within 200 m (0.008 TIR). This .
flatness was not sinusoidal in nature, but varied gradually from one end of
the plate to the other.
Recommendations for achieving better assemblies In the future include
developing an alternate ml yi.tng procedure which would not warp the passage
plates, and the use of larger raw stock so that the portions affected by
shearing stresses could be removed.
30

2.3-1* Test Facility and ProceduresAfter manufacture, the completed heat exchanger and cold plate
assemblies, as shown In Fig. 8, were subjected to a comprehensive test pro-
gram, with the objective of determination of the actual performance parameters.
The program Included development of a test schematic and selection of test
equipment; development of a test procedure and the actual running of the test
including data taking; and a study of the results and conclusions evident uponreduction of the test data.
Important information to be determined from the test included boththermal performance parameters and mechanical parameters. Thermal performance
parameters are U overall, U j^, U CP, U flow distribution, and effect of
flow velocity. Mechanical parameters are effect of bolting torque, finish
and flatness of both heat exchanger and cold plate surfaces, and the coating
integrity.
Test Schematic & Equipment
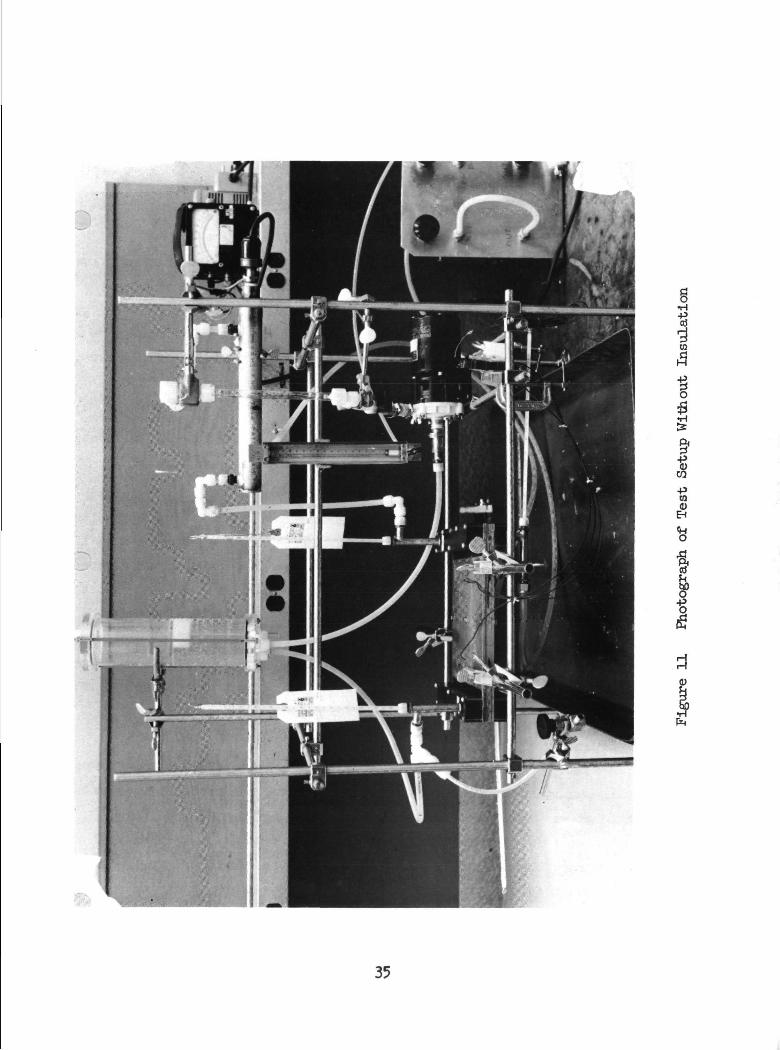
A schematic of the test setup is shown by Fig. 9. Also, Figs. 10
and 11 show the actual test setup, both with and without the thermal insulation.
The setup consisted of a test station and support rack, and the equipment
necessary to separately supply fluid to both the heat exchanger and cold plate.
The heat exchanger fluid loop consisted of a reservoir, a pump, a
heater, thermometers to indicate temperature at both inlet and outlet of theheat exchanger, a flowmeter, and various lines and flow control valves. All
components of this loop were compatible with KDH.
The centrifugal pump was of the magnetically driven variety, while the
heater consisted of an 750 watt, 2.22 cm (0.875 in.) diameter Incoloy sheathed
calrod element inside a 3.8 cm (1-1/2 inch) diameter stainless steel tube.
Heater power input was controlled by a varlac and read on a Weston Model
U32 Wattmeter. This unit had both 0-250 and 0-500 watt scales. Heat ex-changer inlet and outlet temperatures were measured by 7*6 cm (3 inch)
immersion thermometeBSwith 0.11°C (o.2°F) divisions. The flow meter was
31

COV
j
00

u•H-P
•SCO
I13
-Io
0\
33

CQ
A•P
tiCO
ti<D
EH
1j
•iW
5
1
s
IS
35

a Brooks with a 6-15-2 glass tube and a stainless steel ball. Maximum flow-
capacity of this meter is 2 cm3/s (]$ GIB) of HDD and 2.3 cm3/s (22 GPH) of
water. Iron constantan thermocouples were imbedded In the heat exchanger
and were used in conjunction with a Leeds & Northrop bridge to give tempera-
ture close to the Interface.
The cold plate fluid loop consisted of a pressure regulator and flow
control valve attached to the city water supply, a flowmeter, thermometers,
and plumbing* The Watts model U5B pressure regulator was set at about 2kO
fcH/m (35 psi) and was used to prevent city water line pressure fluctuationsfrom affecting the flow rate in the cold plate. The flow meter, thermometers,
and thermocouples were identical to those used in the heat exchanger loop.
Test ProcedureProcedures for each run consisted of adjusting the fluid flow rates
and power input, allowing the system to thermally stabilize, and taking
temperature readings. Recorded data-are shown in the Appendix.
Runs 1 and 2 were preliminary checkout runs using water on both sidesof the system. Runs 3 to 8 were conducted at the nominal design point with KDH
in the heat exchanger, and were intended to establish the effect of interface
bolting, and the overall system performance parameters. Run 9 was Intended to
establish the amount of power added to the system by the circulation pump.
Runs 10 to 14 were to establish statistical data for performance calculations.
Runs Ik to 20 were to investigate the effect of flow rate on performance para-
meters. Runs 21 and 22 were to establish the effect of the Kynar coating, and
had equal water flow rates in both the heat exchanger and cold plate.
2.3.5 Experimental Results and Conclusions
A summary of actual performance parameters compared to values pre-
dicted by the analysis is presented in Table 6. After the completion of test-
ing, an attempt was made to determine all of the significant thermal and
mechanical parameters which had not previously been determined. These in-
cluded the primary thermal performance parameters, the mechanical variables
such as the effect of the interface bolting, and the coating integrity and
the effect of flow rate on thermal performance.

Table 6
COMPARISON OF TEST & ANALYSIS VALUESOF THERMAL PERFORMANCE PARAMETERS
PARAMETER
ANALYSISPREDICTED VALUE.
J/s m2 °C (BTU/hr ft2 °P)
TESTAVERAGE VALUES
J/s m2 °C (BWJ/hr ft2 °F)
overall
Uinterface
UHX
UCP
520
(91.5)
1530(270)
1*120
(250)
1?60
(310)
658
(U6)
1815(320)
2060
2070(365)
37

Thermal Performance Parameters
Performance parameters determined from the test consisted of the
overall, interface, heat exchanger, and cold plate heat transfer coefficients.
The first two, the overall and interface coefficients, can be calculated
directly from the test data, by the following procedure.
First, the heat input to the system is calculated from the relation-
ship Q , = m CL AT where A, C and AT are iespectively the cold plate flowcalc p prate, fluid specific heat, and inlet to outlet temperature difference. This
method is used because the cold plate fluid always was water with a known
specific heat, whereas KOH was usually used in the heat exchanger and its
specific heat is not known exactly.
Then, the log mean temperature difference (IMPD) is calculated and
then overall heat transfer coefficient, oyg-jm > is calculated from
"overall" (Dfff ( A)
where
A is the interface area. Also, the interface heat transfer co-
efficient, UT, is calculated from
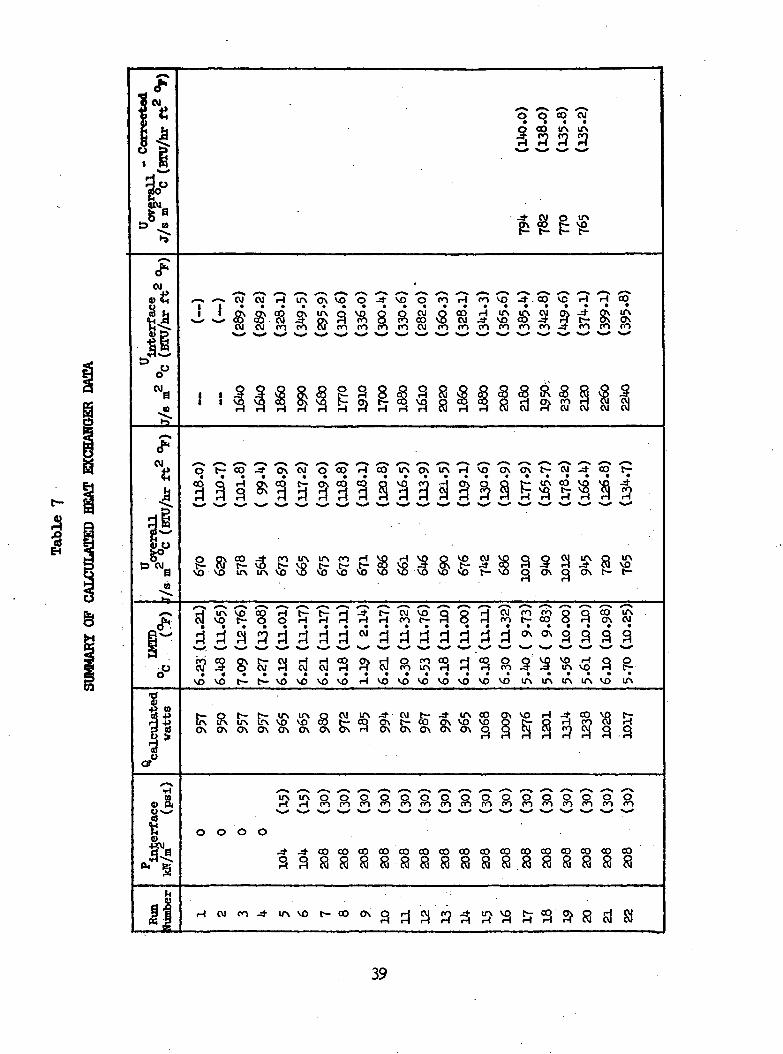
These were calculated for all runs and are summarized in Table 7* Also, In-
cluded is the calculated heat input and IMCD. For design point conditions,
as in runs 5 to 8 and 10 to 14, the average U overall and U interface were
respectively 670 (ll8) and 1825 J/s °C m2 (320 HTO/hr ft2 °F). The valuefor U overall was fairly consistent, as the thermometers used to measure the
fluid temperatures could be read to within 0.056°C (.1°F). The value of U
interface varied more, however, as thermocouples were used to measure tempera-
tures and it was possible to read these only within 0.27 to 0.56 C (0.5 to
1°F). Also, since the thermocouples were imbedded in the base plate, the
recorded value could include some of its resistance in addition to the
Interface resistance, and, in addition, local hot spots due to surfaceirregularities could contribute to the inaccuracy of the readings which were
taken only at two points.
38
CM
W
IB3o°
'*CM
D CV
O O 00 CM
S CO UN UNCO CO CO
f^ f^ rH ^1
CM CM r-l UN ON VO O -* VO O CO H CO vq -* . CO VD H H CO
c O ' . f i ^ - ' n ^ a r n f t f n e r > \ f t t \ s ^ t \ f i C O ^ ^ fCM CM CO
a v O O O C M O C O r H U N U N C M O N - d 1
C O O C O C O V O C M J - V O C O - d - r f t -CO CO CO CO CM CO CO CO CO CO CO -d" CO
O O O Qj>- H o co
r-l r-l r-l r-l
O O O OH CM VD g
3 8 H r-l
RroCM
O-*si
q t ^ c o - * °> ®i c? 0? "~i *? l O c 5 k l C ' r i v ^ c 5 l C 5 > t T ° i " ^ a 2 ^TUN CO3 5 9 3 3 S " 3 3 3 3 3 9
& »•£VO VO UN
UN UN CO H VO H C M V O Q O C V l U N O U Nj t c O H - S r H - d - C v l v Ot - v T S g O N g O N t - t -
si vo r- 3 8 d o X P S 8 3 ^ c 7S d d d ^ ^ 3 3 3 3
ffl 3 §VO VO l -
SI 5J 5JH OCM
C— VO VO VO VO H
C ? > U N H H i H C 0 . 3 - 3 U N V OV O V O V O V O V O V O V O U N U N U N U N V O U N
VO H g
b- O I"- t— UN IfN OUN UN U\ tTN VO VO COON O\ ON ON ON ON ON
CM ^ J- UNCO O N V O H - d - C OON t- COON ON ON S 3 rH
3.3
ro ro ro oo co co ro co co O OCO CO
o o o o-d" -d* co co co co co co co co co co co co co co co3 3 8 8 8 8 8 8 8 8 8 8 . 8 8 8 8 8
r-l CM CO VO t~- CO ON 8 53 81
39
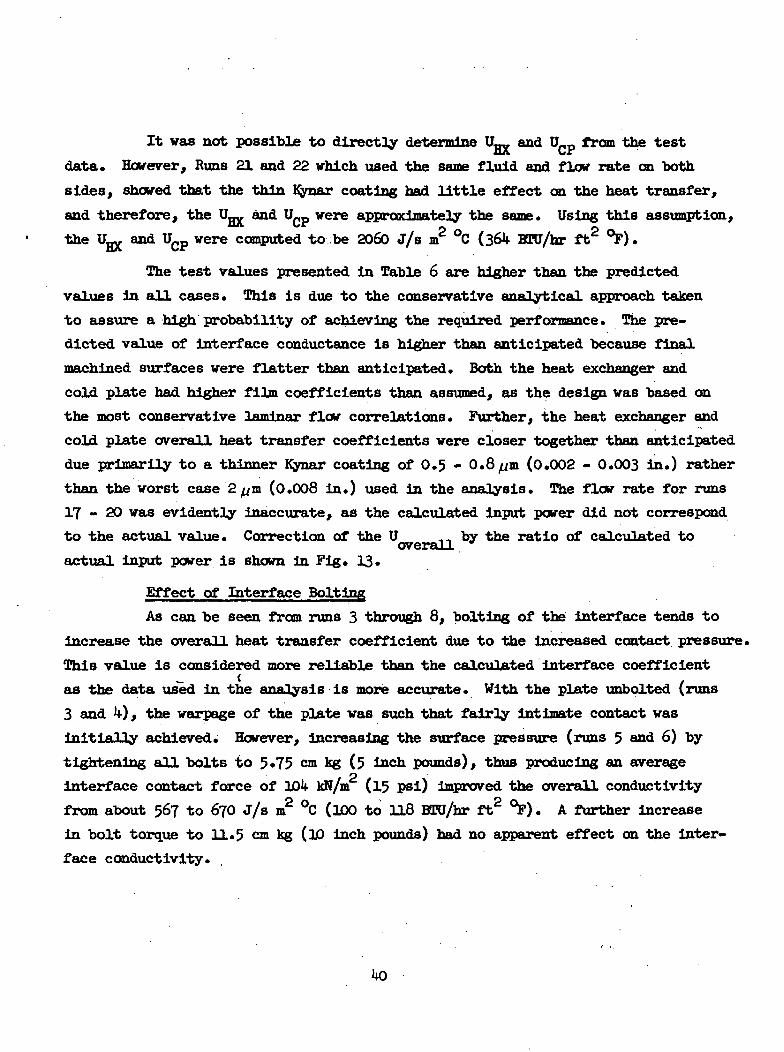
It was not possible to directly determine U.. and Unt> from the testHA. wJrdata. However, Runs 21 and 22 which used the same fluid and flow rate on both
sides, showed that the thin Kynar coating had little effect on the heat transfer,
and therefore, the U and Ugp were approximately the same. Using this assumption,
the Ugjj and Ucp were computed to be 2060 J/s m2 °C (36k BTU/hr ft2 °F).
The test values presented in Table 6 are higher than the predicted
values in all, cases. This is due to the conservative analytical approach taken
to assure a high probability of achieving the required performance. The pre-dicted value of Interface conductance is higher than anticipated because final
machined surfaces were flatter than anticipated. Both the heat exchanger and
cold plate had higher film coefficients than assumed, as the design was based on
the most conservative laminar flow correlations. Further, the heat exchanger andcold plate overall heat transfer coefficients were closer together than anticipated
due primarily to a thinner Kynar coating of 0.5 - 0.8 /m (0.002 - 0.003 in.) rather
than the worst case 2 m (0.008 in.) used in the analysis. The flow rate for runs
17-20 was evidently inaccurate, as the calculated input power did not correspond
to the actual value. Correction of the U ,, by the ratio of calculated tooverallactual input power is shown in Fig. 13.
Effect of Interface BoltingAs can be seen from runs 3 through 8, bolting of the interface tends to
increase the overall heat transfer coefficient due to the increased contact pressure.
This value is considered more reliable than the calculated interface coefficient
as the data used in the analysis is more accurate. With the plate unbolted (runs
3 and *0, the warpage of the plate was such that fairly intimate contact was
initially achieved. However, increasing the surface pressure (runs 5 and 6) by
tightening all bolts to 5.75 cm kg (5 inch pounds), thus producing an averageO • •
interface contact force of 104 kN/m (15 psi) improved the overall conductivity
from about 567 to 670 J/s m2 °C (lOO to 118 BTU/hr ft2 °F). A further increase
in bolt torque to 11*5 cm kg (]£> inch pounds) had no apparent effect on the inter-
face conductivity.

Coat'*ng Integrity
An attempt was made to establish the Integrity of the Kynar coating.
First, a visual examination of all external and part of the internal surfaces
was conducted. Ho breaks in the coating were observed, although it was impossible
to see much in the internal passages* Then a resistance check vas made betweenthe heat exchanger shell and the KDH loop, using a resistance bridge. This showed
a resistance of about 5 ohms, which is lower than desired. It was not determined
however, whether this low resistance was due to many pin holes, or one or morelarger gaps in the coating. Subsequent testing of the heat exchanger was
successful. However, no conclusive Integrity tests are defined as yet.
Effect of Flow Rate on Thermal Performance
An attempt was made in runs 15 to 20 to establish the effect of flowvelocity on thermal performance» Higher flow rates should give higher overall
heat transfer coefficients, and indeed, those of runs 15-20 were 56 to 112
J/s m2 °C (10 to 20 BTU/br ft2 °F) higher than those of runs 2 to 14. Thisvariation may be due to measurement accuracy, however, so an exact correlation
between flow rate and heat transfer coefficient was not made.
2.1* CABIN FOg CONTROL
2.4.1 Objectives
The cabin pOg control technique which was tested in Phase I employed
a fixed hydrazine input rate during the portion of the control cycle where
nitrogen addition to tjhe cabin was called for; when the cabin pO reached anrin-tmmm set point, the hydrazine feed was shut off. The hydrazine feed rate
was set so that the pO_ in the effluent N2/°2 mixture from the electrolysis
module would not be driven below a set minimum. Because of this limitation,
on hydrazine input rate, the cabin pOg was observed to overshoot the control
band during the long period of time (usually several hours) required to Increase
the hydrazine concentration in the electrolyte sufficiently to effect decrease
in p02.
Under steady-state conditions, the control of cabin p02 achieved in
the model system with this technique would be acceptable. A typical cycle of
cabin pO_ at a set control band of 19.3 to 20.0 kB/m (2.8 to 2.9 psia) takes9
approximately 16 hours with an overshoot to approximately 21.4 kN/m (3*1 psia).
However, the control is sluggish and may be a limiting factor in the ability of
the system to respond to sudden changes in demand.

The objective of this program task was to modify the control technique
so that the hydrazine feed rate is increased to allow a fast ramp of the nitrogen
output with two additional set points vhich cycle the hydrazine feed off at mini-
mum effluent pO levels corresponding to the high and lov current modes. This
•type of control was expected to affect a faster decrease of cabin pO- when required
and substantially reduce the overshoot.
2.4.2 Control Technique Description
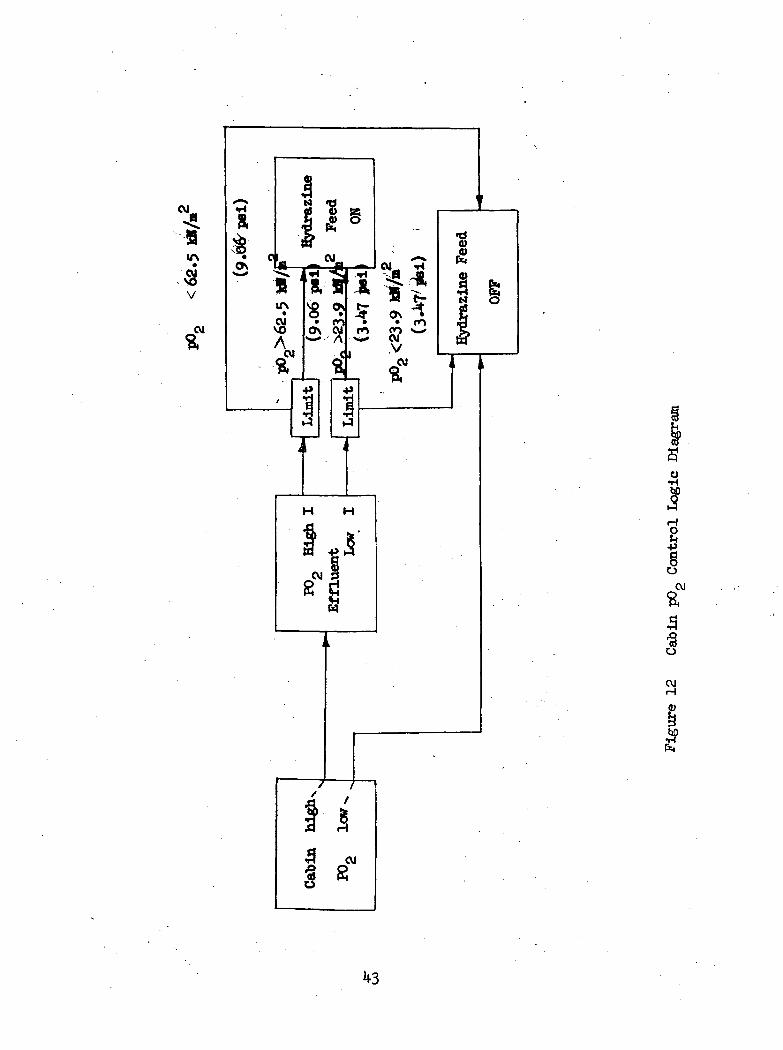
The control logic flow diagram is shown in Figure 12.. In operation, the
control proceeds as follows: An oxygen partial pressure sensor in the cabin simu-
lator loop has an adjustable control band. When the cabin pO reaches the low
limit of the band, hydrazine feed is commanded off and remains off until cabin
pOg returns to the high limit of the band. At this point, a signal is sent to
the sensor monitoring the pO_ in the anodic gas being supplied to the cabin from
the electrolysis cell stack. This block in the logic receives a signal from the
current mode status, either high or low current. For each state, this pCL
sensor has an adjustable low limit. Hydrazine feed is then commanded on or
off, depending on the current mode, pOp and the limit settings. The selection
of the limit settings is dependent upon the current density settings selected
for the system. As an example, in test 2 of the system testing, the N_H, was
shut off at an oxygen partial pressure of 23*9 KN/m (3.47 psia) .for the lowcurrent density setting of 50 mA/cm , and at 62.5 kN/m (9.06 psia) for the high
current density setting of 150 mA/cm . In Figures 17 and 18, the high and low-
cycle switch over can 1>e seen directly on the cabin pOg curve. The point at
which the slope increases is one from low to high current. The change to a
lower slope is from high to low current. The results of the testing of this
pO control technique are presented and discussed in Section 2.5.
2.5 SYSTEM TESTING
2.5.1 Test Plan and Procedure
The system test plan was established to meet the following objectives:
o Checkout testing of the new pOp control circuit logic
o Determination of the maximum hydrazine feed rate compatible with
the controlso Evaluation of the effect of cabin pOg control band on pO cycle time
42
"V
ft• eft
IH -dI 15
S
$ ^^
^ ?_<i
H H
5
Vs
o\ ^• en
cus
•d0)
3
3
H
I0
C\J
•3O

o Optimization of current levels to achieve a more responsive pOg
cycle
o Evaluation of system response to step changes in Ng/Og demand
o Parametric temperature and current evaluation
o Identification of the chemical constituents of the generated
gases
o Demonstration of zero-gravity operational components
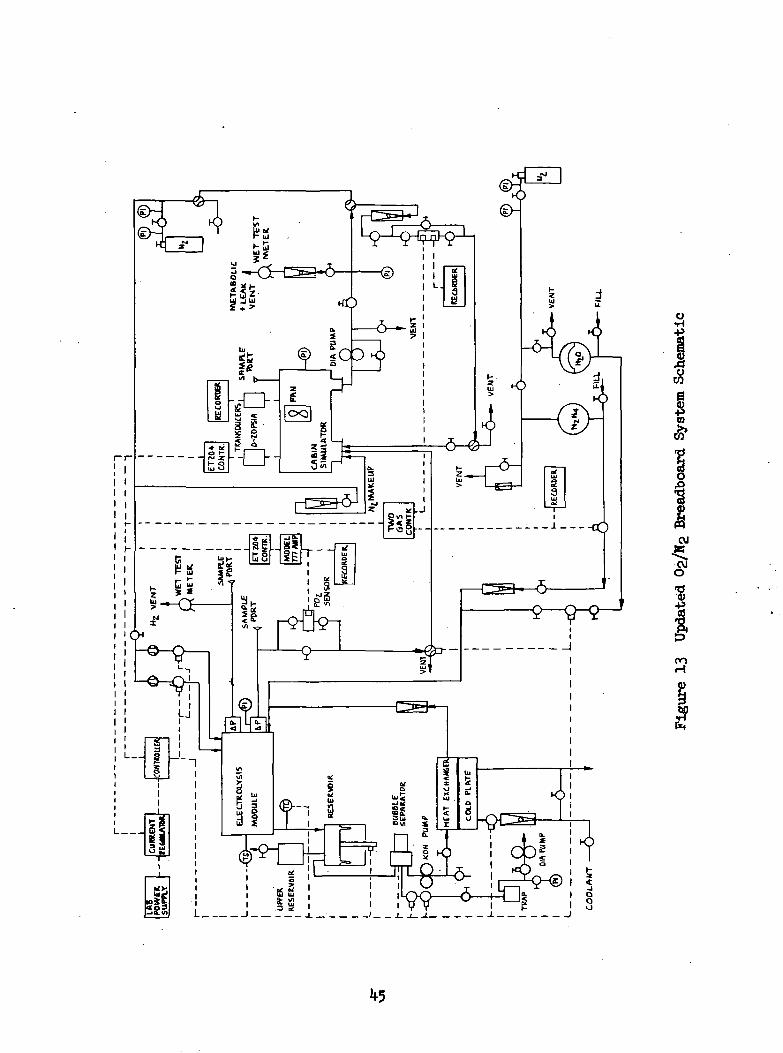
A complete description of the breadboard system and the operating
procedures is given in the Phase I report, HASA CR 114912. Modifications in
the system which were implemented to effect the new p02 control technique, and
to incorporate the zero-gravity bubble separator, are reflected in the updated
schematic shown in Figure 13. Incorporation of the new cabin pO control
technique, in which the hydrazine feed is set high to rapidly ramp the concen-
tration, necessitated the addition of a second reservoir (as a test expediency)
in the electrolyte loop to absorb the volume change due to hydrazine addition.
In a full-scale system, the reservoir would be properly sized to handle this
volume excursion.
To allow incorporation of the prototype dynamic vortex bubble separa-tor device in the system, the reservoir was moved from the inlet to the discharge
side of the electrolysis cell stack. A vacuum pump and regulator were installed
on the vortex bubble separator gas discharge line to maintain th. -._~a3sary gas/
electrolyte differential pressure. In a full scale system, the reservoir
pressure would be high enough to allow the bubble separate- gas to vent directly
at cabin ambient pressure. The vortex separator was inncalled in the system
prior to the start of Test 4.
The plastic sheel-and-tube heat exchanger which was used in the system
in Phase I was replaced with the prototype contact heat exchanger before the
start of testing.
Changes in the system requirements for Phase II of the program were
made at the direction of the HASA technical monitor. These changes required a
re-analysis of the breadboard Ng/Og system operating conditions and operating
ranges. Because of the addition of a maximum metabolic oxygen requirement andthe change from a 12-man to a 6-man full-scale system (leakage allocation for
44

the breadboard is now 1/6 rather than 1/12 of the total cabin leakage), the
existing 17-cell electrolysis stack has, at its optimum current density ofo
150 mA/cm , an output capacity of 78 percent of the "wxlTrom one-man metabolicand leakage load. A summary of the new requirements is given in Table 8.
2.5.2 System Test Summary
A summary of the system testing results is presented in Table 9.
Prior to the start of these tests, a preliminary checkout period vas devoted
to calibration of sensors and flowmeters, setting of sensor control and limit
points, and a 2.5-hour operational test of the electrolysis cell stack.
The objectives of the first system test vere to determine the maxi-
mum hydrazlne feed rate possible with the new cabin pOg control technique and
the new cabin pO_ control characteristics. Summary results shoving cabin total
pressure and pOg control are given in Figure Ik.
In Test 2, the conditions of Test 1 were repeated except that the
cabin p02 control band was reduced in half in an effort to reduce pO_ cycle
tine. Summary results of this test are shown in Figure 15.
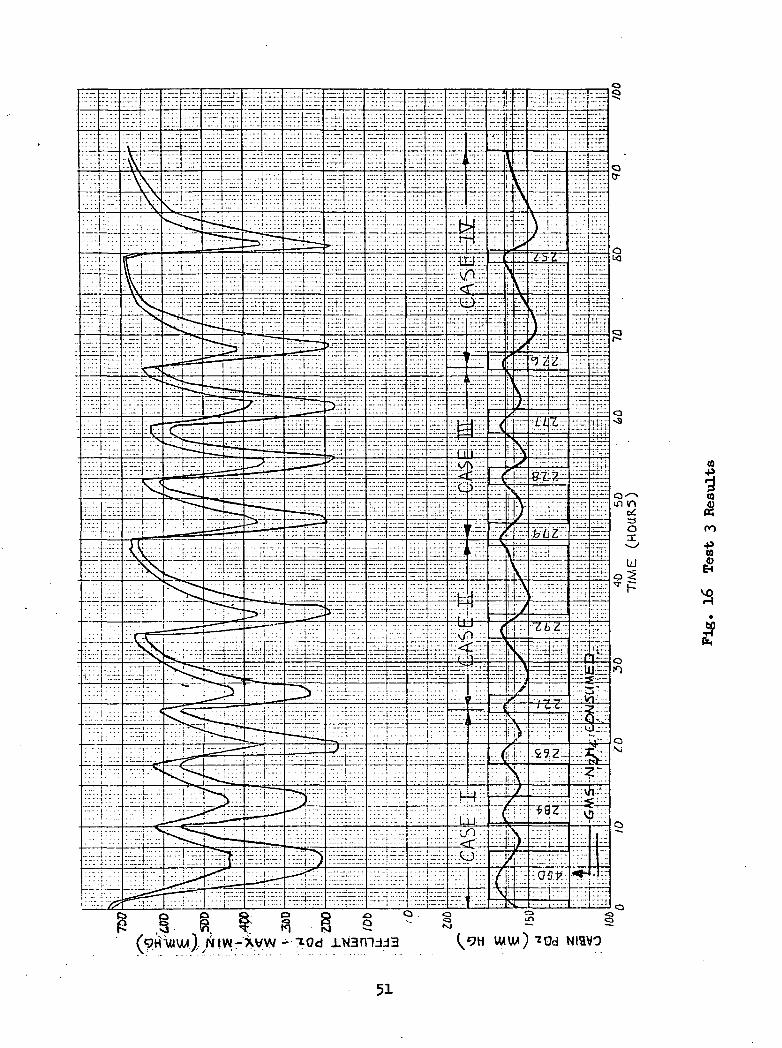
There were two objectives in Test 3; namely, to determine the effect
of increasing the low mode current and to determine the cabin atmosphere control
characteristics under varying metabolic and leakage loads. Results of this test
are shown in Figure 16.
Test 4 was conducted without the cabin simulator, with generated gasesbeing vented €0 ambient. The objectives of the test were to obtain steady-state
parametric data regarding operating temperature and current density, and to make
a comprehensive analysis of the chemical composition of the generated gases.
Detailed test results are discussed in Section 2.5.3.
The last test period, Test 5, was devoted to a long-term test of zero-
gravity closed loop operation. Of primary interest was the performance of the
vortex bubble separator, its ability to operate automatically for long periods
of time, and its effectiveness in preventing electrolyte carryover during
start-stop operation.

u>
en
<M
Condit
ivo Orn o
lf\H
VO
t- co
VO CVJ HH -d- ON• • .H en co
vo oco oCOCVJ
HCO
H en
t—o\vO CVI
H ir\ oo!>• ON -=fH H ON
€ 8 HIA
CVJ
HOir\
H H
00 00 HVO t- O
VO
t 8 -4- CVIITS VO
HO
C— O CVICVI
H COO\ O
irv _* H en en
-* o en l- H ooO O cvj t>- co u\H ir\ H en -4- vo
CVJ
H ir\ cvit- o\ u\H H !>•
5555
t g| Oq Co*O T3 ^
M M M M
l/N
en
cvjencvj
en•
CVJ
CVJ
CVJ
vo
3 9co en
^ ^O •
en•
H
CO
Hu>? S
u\UN
VOen
°* 3
CVI
Hen
m 3^
a•o
CVI
CO0\
•oo
cv
en eno- OJ
tlJ 'w 'o 'O fw *o
en
ICVIVO
*CO
H cn
Ho\•ro
I8si
3£ J- 5Sia!n
o

O\
$
&
t>
1§
» o
*M
1
t— cn
«*
o
8• 60+»
111
O
5^o
4>
*
•P
A.
*„|ftg^O pO^ g
cvi
5».
!3&
3
1
I>O
O H * '** P 3
•* P°° 84^
•ft
Uir.
tt•e
9)
ad)
^J £• « ^® * f l
gd *g* s•rl 4f
M*3 O5 2 f l^4 Co
(1> Ofj fl) fli
1-3^H M 0)
_ o 3*£ •o> « q
u|•p-P
a4)
8
o
<MO\
rH
^
0)
iI•8
o
•H•P

o o-* J-
tonnn)
to
CO
PC,

to
CO
cvj
ti
COiCQ
*
IWVW) ^Od NlflVO
51

2.5*3 Test Results and Discussion
The test results are presented in this section in the form of sunmary
test logs and performance plots. Analyses of the test results are presented in
the last part of the section. Detailed test logs are included in the Appendix.
2.5.3.1 Test Logs and Performance Data
Test 1." The first test was run at the design point conditions, i.e.,
normal, metabolic and leakage loads. The test conditions are presented in
Table ID. The duration of the test vas 68 hours. A summary test log is given
in Table 11.
The hydrazine feed rate vas varied during the first 2k hours of the
test to determine the maximum allowable without driving the effluent pO below213.3 kN/m (1.93 psi). This limit vas arbitrarily set as the safe operating
mlnlimim. From the performance data shown in Figure 17, it can be seen that
the effluent pO vas substantially undershooting the low mode limit of 23*9n <-
kN/m (3.5 psi). This large an effect had not been anticipated, and it re-sulted in limiting of the hydrazine feed rate to 2.33 cm /mln. This effect
is discussed in more detail in Section 2.5*3*2.
For the conditions selected for Test 1, the cabin pO control charac-
teristics vere an average cycle tine of IX).7 hours and an amplitude of approxi-p
mately 2.35 kN/m (0.34 psi). This represents an improvement over the control
characteristics achieved in Phase I vith the original control technique, however,
a direct comparison cannot be made because the leakage loads are different.
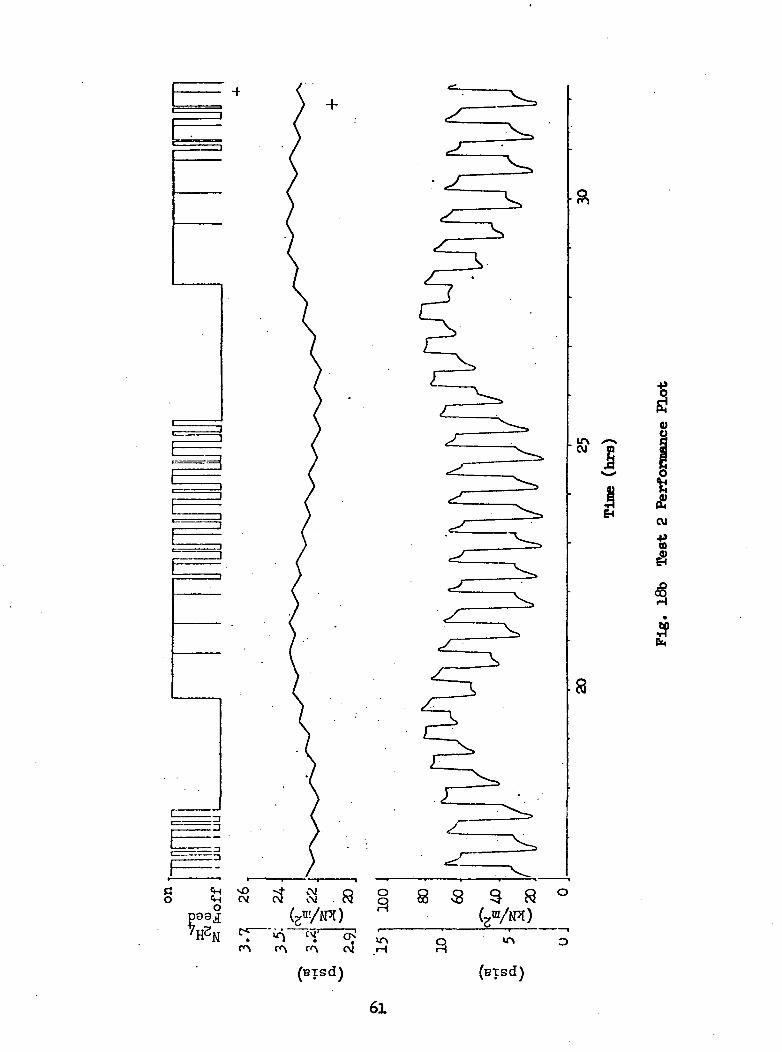
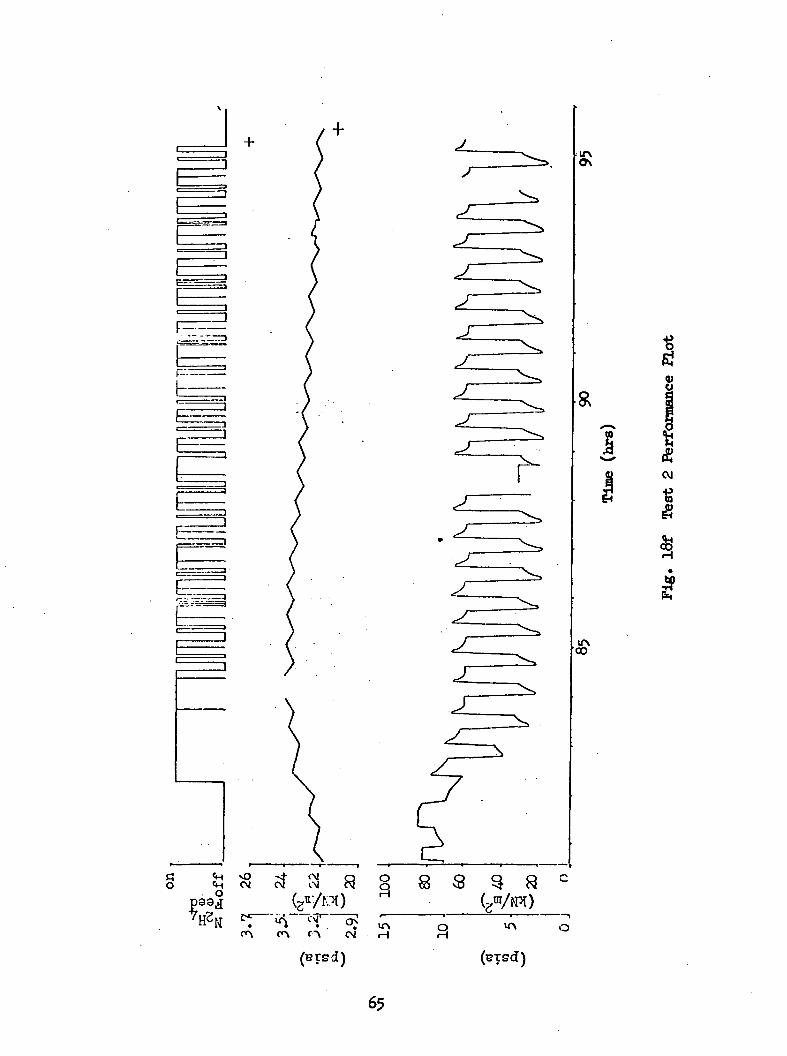
Test 2«- The next test vas conducted at the same conditions as Test 1,except that the cabin p02 control band vas reduced by a factor of two in an
effort to reduce the cabin pO_ cycle time. The test vas run for a total of
96 hours* As shown in the performance plot, Figure 18, the average pOg cycle
time during the first five cycles vas approximately 8.8 hours, as compared to
10.7 hours In Test 1. An anomalous shift In pOg cycle time after the first
five cycles vas observed. As this vas the last cycle of the test, there is
no Indication that it represented a permanent shift in performance. A possible
explanation vould be an Increase in the bleed rate from the tank. However, this
vas not confirmed. A summary test log is given In Table 12.
52

Table ID
TEST 1 OPERATING CONDITIONS
Normal Metabolic and Leakage Loads
Low Current
High Current
N- Makeup
Meta/Leak (Cabin gas)
KDH flow
flow
Effluent Limits:
High
Low
Cabin pO. Control Band
Cabin Pm . i Control BandTotal
50 nA/cm2
150 nA/cm2
3J050 cm3/min
1566 cm3/mln
500 cm3/min
1.81 to 2.90 <an3/min
(.386 Ib/day)
(.597 Ib/day)
62.5 - 65.0 kN/m2 (9.06-9.2 psi)
23.9 kH/m
21.7-23.0 kN/m2
99.3-99.9 kN/m2
psi)
.5 psi)
53

Elapsed Time(Hr.)
Table 11TEST 1 TIME/EVERT LOG
Events/Action Comments
6.0
7-5
20.0
21.0
23.5
2k.Q
29.0
33.5
38.5
43-7
44.5
47-3
55.0
59.0
64.0
64.5
67.6
67.7
Adjusted high mode currents.
Recharged H H, tank; consumption383 g. * *Changed N_H. flowmeter readingfrom 8.0 to 10.0 (scale units).Changed N JI. flowmeter readingfrom UO.O to" 8.0.
Changed N«Bkfrom 8.0 tf-*'
flowmeter reading
Recharged N9H, tank; consump-tion 639 g.Changed high mode pO effluentlimit from 65.2 to 62.5 kN/m(9.45 to 9.05 psi).Recharged N_H, tank; consump-tion 320 g. 4
Low Ptotal set point adjustedto normal".Analyzed electrolyte sample;
at 2.51M.Recharged N«H, tank; consump-tion 430 g. 4
Analyzed electrolyte sample;at 0.94M.
Rechargedtion 377 g«
tank; consump-
Adjusted high mode currents.
Analyzed electrolyte sample;at 2.7M.
Drained NpH, tank; consump-tion 378 g.Deactivated NH. feed.
Analyzed electrolyte sample;at 0.7&M.
54
Currents had been drifting upward.Test equipment characteristic.
Procedure.
To determine effect of highflow rate.Flow reading of 10 too high;effluent p02 undershootingIn low mode.Continuing flow rate Investi-gation.Procedure.
For test evaluation.
Procedure.
Drift in set point had beenobserved.
Procedure.
Procedure.
Procedure.
Procedure.
Currents had been driftingupwards.
Procedure.
Procedure.
Insufficient tine remaining intest to complete another cycle.Procedure.

I
1
d)o
oJ
ao 8
CM
O
a 8 a
(BTSd)
55

E
O
-t-
CVJ
° C
O
CO
0)o
5
(BTSd)

r —'
<H vO«n w
c»\
ir\
o>o
€
o
C\J Q O QCM oj Q «5
Oi H
57

E
o «IH CMoP39.J
CMCM
M8
lf\ir\i «id
CM
(BTSd)

E! <4-l vOO <H CV
Ocvj O
3
C\
u
I!H
12. tr\vo
a
59

E
E
EIZD
O99.1
k
CO
cvi
€
ir\
I 8 a
CM H
(BTSd)
60
Opoaj
cv . c3 o S
„ I1 £
CM
a
(BTSd)
a • « =(BTSd)
61

L~
r_:
EEEr~
Go o
3
01
(BfSd)
62
L
oH
3 £
lf\• co
0}
I£cvi
ti

E
L:
R
CV rH
63
<LJsL
z:
x>^x &
CVJ
(BT9d)

E
£j ^_l vOO <M CM
O
O
3
2:.§
d>o
COcvj
H
•
ON
F-
&
E
Go
«H vO«H CMo
to
u>CO
oa
Oi H
(Btsd) (BTSd)
I0)
fcIcu
esaj
Elapsed Time(Hr.)
Table 12
TEST 2 TIME/EVERT LOG
Events/Action Comments
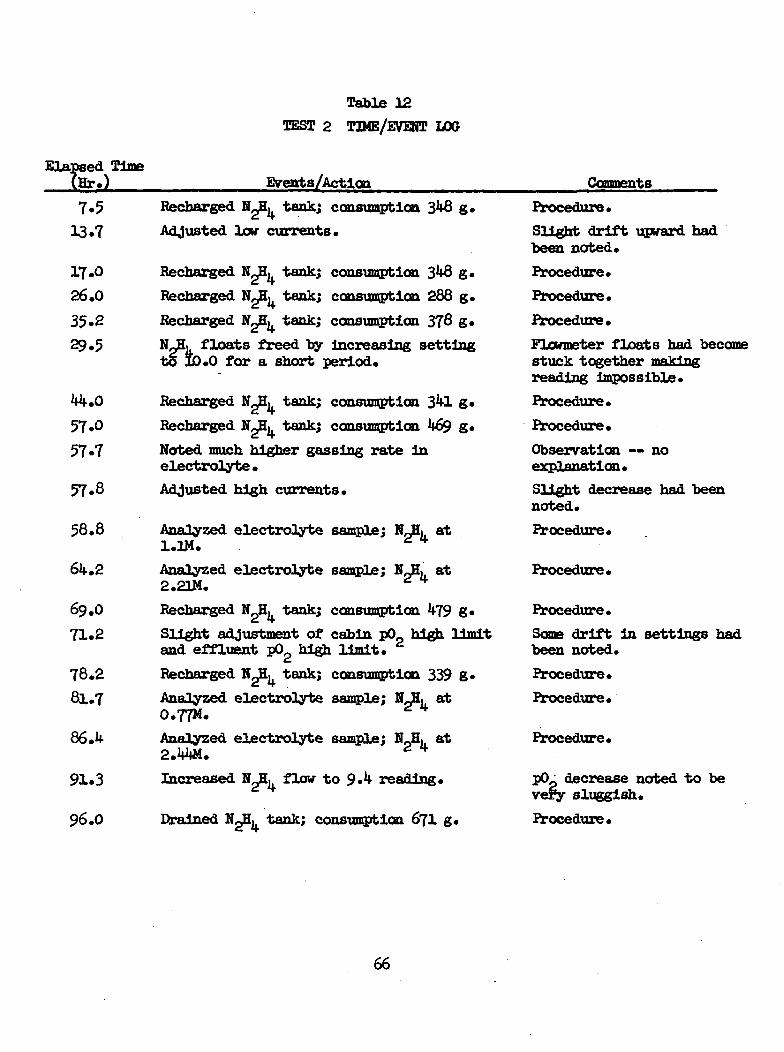
7.5 Recharged N H tank; consumption 348 g.
13.7 Adjusted low currents.
17.0
26.0
35.229.5
44.0
57.0
57.7
57.8
58.8
64.2
69.0
71.2
78.281.7
86.4
91.3
96.0
Recharged N-H, tank; consumption 348 g.
Recharged NgH. tank; consumption 288 g.
Recharged NH tank; consumption 378 g.
floats freed by increasing settingto 1Q.O for a short period.
Recharged N_H, tank; consumption 341 g.
Recharged N H. tank; consumption 469 g«
Noted much higher gassing rate inelectrolyte.
Adjusted high currents.
Analyzed electrolyte sample; HJEk at1.1M. ^4
Analyzed electrolyte sample; NJH. at2.21H. * _
Recharged N E. tank; consumption 479 g*
Slight adjustment of cabin pO high limitand effluent p02 high limit.
Recharged N, tank; consumption 339 g.
Analyzed electrolyte sample; H Ji, at0.77M.Analyzed electrolyte sample; N0H. at2.44M. 2 *
Increased NJi, flow to 9.4 reading.
Drained NH, tank; consumption 671 g.
Procedure.
Slight drift upward hadbeen noted.
Procedure.
Procedure.
Procedure.
Flowmeter floats had becomestuck together makingreading impossible.
Procedure.
Procedure.
Observation — noexplanation.
Slight decrease had beennoted.
Procedure.
Procedure.
Procedure.
Some drift in settings hadbeen noted.
Procedure.
Procedure.
Procedure.
pOp decrease noted to bevery sluggish.
Procedure.
66

Test 3.- This test vas conducted for a period of 92 hours. Changes
in the test conditions from the previous tests are reflected in Table 13. The
lew mode current vas increased from 50 to 70 mA/cm . A corresponding change in
the pOg effluent limit vas also made. The test log is given in Table Ikf and
the performance plot in Figure 19.
For the first three cabin p09 cycles, the normal metabolic and leakage*- n
loads vere used so that the pOg control characteristics at a lev mode of 70 mA/cmcould be compared with Test 2 at 50 mA/cm . As shown in Figure 1£, this increase
in lov mode resulted in a decrease in pO cycle time from 8.8 hours in Test 2to 6.0 hours in Test 3.
Three other cases of metabolic and leakage loads vere run in theremainder of the test vith each change in conditions made as a step function.
Two cabin pO cycles vere completed for each case. The performance plot,
Figure 19* shows that both cabin P. and pO were i31 control throughoutthe test. Cabin ptota-,
w*s completely unaffected by changes in load except
for the expected variation in time in high current mode. Both the amplitudeand cycle time of cabin pO varied vith load, vith the best response being
achieved as expected at the design point normal conditions.
During the normal metabolic and minimum leakage condition, the lovleakage rate results in a slow recovery in pO_. These two cycles show long
recovery times from the turnaround in pOg at 28.5 hours and 38 hours. The
second cycle is somewhat longer than the first. A review of the data shoved
no apparent explanation. Possibly, small variations outside the normal
control band have a large effect on this condition.
Test k.- This test vas conducted for 92 hours in the """-""O mode
without the cabin and metabolic /leakage simulator for the purpose of obtaining
steady-state parametric data regarding operating temperature and current density,
and to make a comprehensive analysis of the chemical composition of the generatedgases. The vortex bubble separator vas installed for this test, and the gas
removed from the electrolyte by this device from the electrolyte by this device
vas also analyzed.
67

Table 13TEST 3 OHSRATING COHDIEICHS
Variable Metabolic and Leakage Loads
Low Current
N0 MakeupMeta/leak (Cabin gas)KDH Flow
p02 Effltient LimitsHighLow-
Cabin pO_ Control Band
70 mA/cm
150 mA/cm2
1050 to 1690 cm3/mln.1566 to 2350 cm3/mln.
o
500 cnr/min.
2.33 to 3.52 cm3/mln.
53.2 kN/m2
26.6 kN/m
21.0 to 22.0 kN/m2
(.386 - .62 Ib/day)
(.597 - .9 3Jb/day)
Cabin PTotal Control Band 99 «3 to 99.9 kN/m'
(7.72 psla)(3.6 psia)
- 3.15 Psia)- 14.5 psia)
68

Table 14Test 3 Time/Events Log
Elapsed Time(hr.) Events/Action Comments
0.2
0.6
1.0
5«9
7.0
15.0
17.6
20.5
24.2
26.1
36.5
42.7
Vf.l
54.7
61.1
64.0
66.2
69.0
90.0
Closed Tnamial N purge valve.
Water feed not working.
Shut down and replaced I.C. chipIn water feed circuit.
Increased N H, flowmeter readingfrom 9.0 to 10.0 scale units.
Recharged N K tank; consumption400 g. d 4
Recharged NJL tank; consumption284 g.
Increased N_H. flowmeter readingto 11.0. ^ *
Recharged NJEL tank; consumption263 g. ^
Changed Meta flowmeter to 13.0;Ng makeup to 10.0.
Recharged NJ1. tank; consumption221 g. * *
Recharged N H. tank; consumption299 g. ^4
System stayed in low mode 70 min.;Normal is 45 minutes.
Changed Meta flowmeter to 17.0;Np makeup to 12.8.
Recharged N_H, tank; consumption279 g. *Recharged NJI, tank; consumption228 g. ^
Recharged N0H,L tank; consumption277 g.Np makeup flowmeter reading toohlgh> 13-5J adjusted to 12.8.
Changed Meta flowmeter to 16.0;N_ makeup unchanged.
Recharged N H. tank; consumption226 g. * *
Drained NpHj, tank; consumption252 g. ^
Noted N2 solenoids leaking.
Failure caused by problem withpower supply prior to test start,
Low pO? limit not being reached.Further increase In N H, flow-possible.
Procedure.
Rrocedure.
Low pOg limit not being reached.
Procedure.
Procedure; step change from normalmetabolic and leakage to normalmetabolic; mln. leakage.
Procedure.
Procedure.
Cause not determined.
Procedure; step change from normalmetabolic, min. leakage to max.metabolic, normal leakage.
Procedure.
Procedure.
Procedure.
Np supply cylinder pressurehad changed*
Procedure; step change from maxmetabolic, normal leakage to maxmetabolic, minimum leakage.
Procedure.
Procedure.
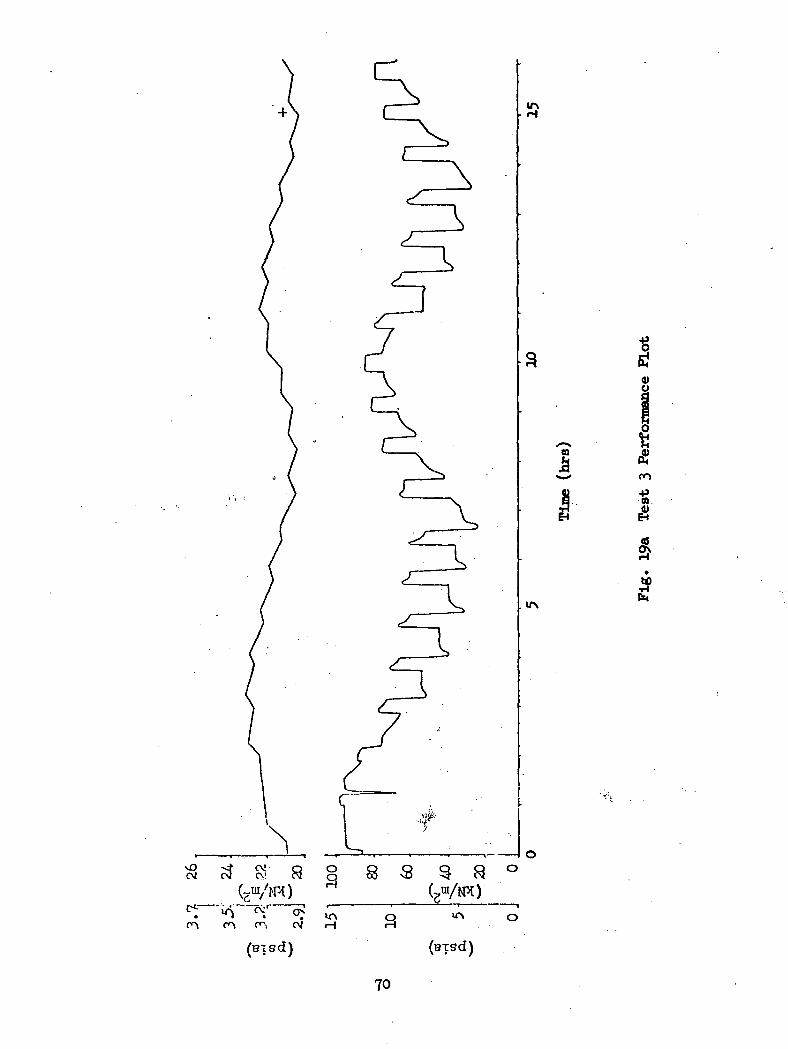
-f
03
(BTSCt)
8 «V . o
(BTSd)
0)
•een
70

\
vQ -<*• CM § 8
CM H
0)o
m
CM
71

^~%
I q
m
*if
(BTSd)
72

0)jltr\ aj^ I
EH
0)t>
1
• °^ ^ O «rv OV^ CM H rH
(ttsd) teisd)
73
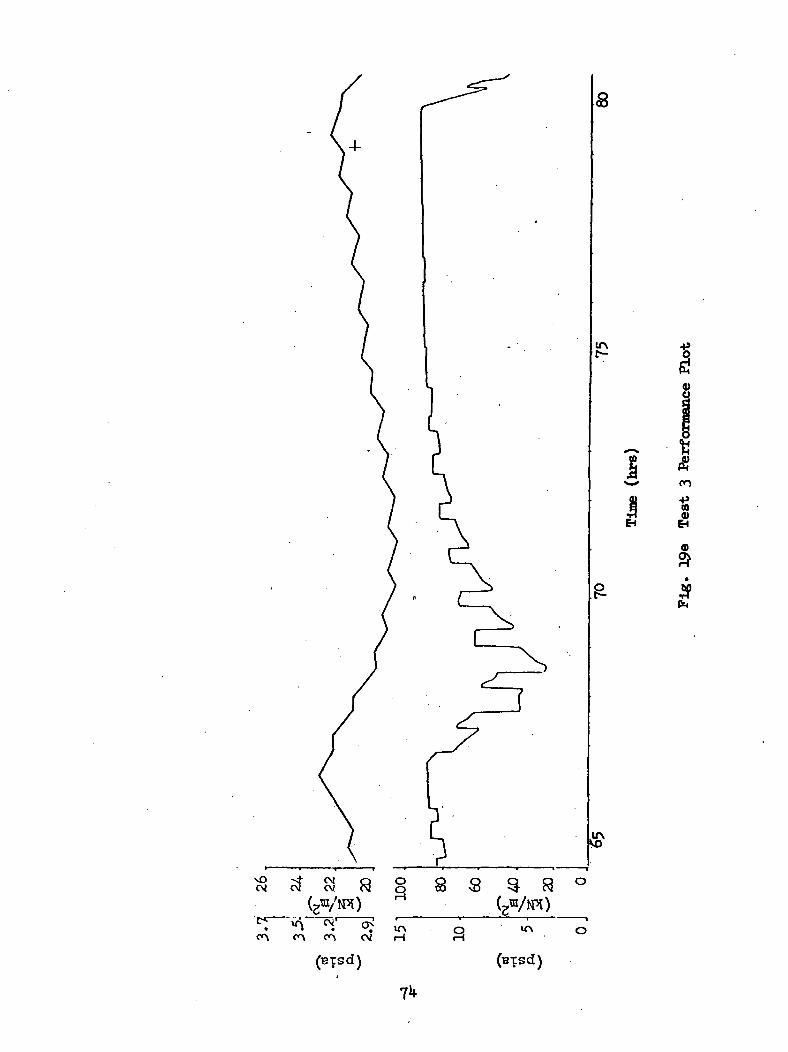
lf\t-
iCO
ti0)
vOcv
CM Q O QCV ?3 Q CO ° cv
CNi H
(BTSd)

vO --t CV QC\i C\I C\J 02
(?v/fM)
oa^
Q § a °•(z*/m)
75

2
1
1
1
1
2
2
1
1
The following matrix of temperatures and current densities vas used
In the testing with some duplicate runs made as Indicated to determine datascatter*
Temperature Current Density (mA/cm )(°C) 50 100 150
2k
29
33
At each set of conditions, an initial charge of hydrazlne vas added to the
electrolyte to bring the hydrazlne to approximately 2-3 molar. Electrolyte
samples were then analyzed at 1-2 hour Intervals, to determine the hydrazine
decay rate* pO in the anodic effluent was continuously monitored with a
stripchart readout. The raw data on the hydrazlne decay rate are shown In
Figure 20 and Indicate the high precision that was typical throughout the
test. These data are an excellent confirmation of the first order reactiondcmechanism of the hydrazlne, i.e., confirming that the reaction rate ls TT =
cm where m is the reaction rate constant.
Similar results were obtained with the p02 monitor on the anodic
effluent gas as shown in the raw data sampling in Figure 21 (plotted as PT-
p02 B pN£). Again, excellent correlation was observed. Cross-plots were
made of CNgH. and pN2 for all the runs and are shown In Figure 22. Thecurrent density effect Indicated in these results appears reasonable; however,
the temperature effect appears anomolous. The raw data showed almost no
scatter (as Indicated In Figures 20 and 2l). and the results were reproducible
In the duplicate runs that were made. In carefully reviewing the test condi-
tions, the only difference which was found between individual runs was the
manner in which hydrazlne was added to the system. In all runs except the
2l«.0C/50 mA/cm2, 24°C/150! mA/cm2, and 33°C/150 mA/cm2, the hydrazlne chargewas added to the upper reservoir and mixed within 20 minutes. In the 2l*°C/
50 mA/cm and 2 °C/150 mA/cm runs, the hydrazine was Introduced into the KDHo 2
Inlet line to the module over a period of 1-2 hours. la the 33 C/150 mA/cmrun, hydrazine was added to the upper reservoir but In Rmn.n Increments over
a period of an hour*

77

-p -Pa] a)
(DO
o
0)•Tf•H
fl o(D -rtO -P
o -^CM g
S go> ord O•Hra x
Oi C\J. O W
II II
O X
S3
II
1 ^M>q
§
.O
—' -H-PC! C30 b•H 4J-P fl01 0)^1 O-p co -os °G -
o
o
io-ta
' CM
o°'.OT>tn
g
-l">
CVJ
CO
iTVOO
O•
H
78

a c3 -3-p -p<d at
C fi(D 0)O Oa n8
CM
8-ptd
CD
C\i <D
* g(D O
T3 tJ O•H -HCO 01 x
C\f
II II IIO x -t-
•b<4. ao
a co9 ^•H +>-P fla) a>ft o-P BC -og °C ^
.SJJ ,OJ
OJ
co
I I I I
O
I I I ( I I I I I
O
ir\
UNVO
O
O•
H
79

3-
Figure 21 Anodic Gas Composition, Test
80

81

If the three runs In which the hydrazlne vas fed over a period of
time are disregarded, a trend is observed which shows increased decomposition
with temperature. This would be anticipated from the increased kinetics of
decomposition with increasing temperature. However, as pNp should vary with
hydrazine concentration and not with history of feed into the system, it is
difficult to rationalize dismissal of this data. In summary, there is not
enough data, consistently taken, to draw any definite conclusions.
Considering next the chemical composition of the generated gases,
comprehensive analysis techniques including gas chromatography9 infrared, and
mass spectrometry, were used to establish the levels of trace contaminants in
the generated gases *»v* also in the bubble separator discharge. A summary of
the results is shown in Table 15. Considering first the hydrogen product gas
stream, high oxygen levels in some samples show correspond ing high argon
levels (indicating room air contamination of these samples) and should bediscounted. Trace amounts of N02 ( < 20 ppm), HH- (20-30 ppm), and N H,
derivatives ( < 20 ppm) were detected.
la the Ng/Og gas stream, N0g ( < 20 ppm), NgO (20-30 ppm), MH_
(30-1»0 ppm) NpH, derivatives (<20 ppm) and CO (9-l£> ppm) were detected.
The source of the CO is residual organic material in the commercial electrodes.
NpO was detected on the mass spectrometer but was not confirmed on the gas
chromatograph.
In this test, the vortex bubble separator was used to separate gas
from the electrolyte. The gas was withdrawn under a slight vacuum which made
sampling difficult. In the samples which showed the least amount of entrained
air, as indicated by the argon levels, the following constituents were found:
02 (20#); N2 (~78#)j N02 (<20 ppm); CO (l ppm); CH (0.8 ppm), and N
derivatives (< 20 ppm). No NH-, or Hg was detected.
These chemical analysis results are further discussed in Section2.5.3.2.
82

I
o
8 •«**.
8& •ft
•ooM
O O Q O I I I QC U C Q c O c Q l l l C Qvn va vn vu vu
a aV» VS
a
V V V V
UN CVJW O
o oV
.l/N COo t-• •o o
o o o o
S O O O I IN CO N I IV V V
I r\ • « I I Ii • O O I I I
I VD en vo• I O O O i
O O O
I iI I
I I
I I
$«•a
H H CO
CO HW en
en u\
^~
Jil ^o qH cj
*«•
sz
CO
O
Pa
oa
I I I I Q P PI I I I H • •
P
*fe
H CO tr\
ff * en
Q CK
COUNa » j
qcu
<
O UN
en enJ I
O CO CAH
H OJ, UN CJ ^ OOJ H H H H OJ H H
uf
H H H OJ
CU
gvol/\
w
UN
CM
8e n e n e n e n e n e n e n e n e n e nen en en en en en en en en en
!*«•* CVIfP O
CO
SO
Oen
cvi
3en
<n
*Im
fjj pj nj pj ff?
7 ? £ i r ! ' £ . ? w w "J f U N J f e n J f H H c n
cvi
en
OJ H
o o• • *»
IId] Q)
a -p -pPi V 0)Pi 13 T3
8
o o-p +>
fn P«) u
s §4 t-5
* 2*
•g«+> -pO V
ft) Q)
I II I
p p
83

Test 5«- This test was conducted for the specific purpose of evalua-
ting the long-term performance capability of the prototype vortex bubble
separator. After 92 hours of successful operation of the device in Test k,
it vas operated for a total of 8ll hours In Test 5. Test 5 data was entirely
observational. A complete log of observations is presented in the Appendix.
The first 175 hours of operating time were logged on a normal day
shift basis. This resulted in 22 start/stop operations and allowed the gas
discharge tube inside the device to stand in contact vith the system electro-
lyte for long periods of time, on nights and weekends. The transparent gas
discharge tube was visually inspected daily for evidence of electrolyte carry-
over. Over the one-month period of on/off operation, one small drop (less than
1 cm) of liquid collected in the gas discharge line. For use in a full-scale
system, the device would need to have a momentary back purge on startup to pre-
vent even such a small amount of liquid carryover.
For the last 636 hours of Test 5, the second reservoir (required foroperation with hydrazine) was removed and the primary reservoir was sealed.
This modification resulted in a completely closed electrolyte loop as would
be required in a full-scale flight system. Operation was continuous with no
interruptions during the final 636 hours of testing. A once-a-day check was
made to assure that the system was operating properly. No problems occurred
with the vortex bubble separator throughout the test. Its performance capa-
bility was demonstrated by a cumulative total of 903 hours of successful
operation.
2.5.3.2 Data Analysis and Discussion
pO^ Effluent - It was determined in Test 1 that a maximum allowable
hydrazine feed rate existed for a given high and low current due to the transienteffects occurring in the p02 of the generated Ng/0 gas mixture when the current
switched between Mgh and low. It can be seen in Figure 17 that a transient
effect was present in switching current in either direction, high to low, or
low to high.

A diffusion model can be used to explain the transient effects. This
model 10 demonstrated graphically In Figure 23. The model assumes two shapes
of the equilibrium hydrazlne concentration gradient across the hydrophilic
matrix separating the anode from the bulk liquid electrolyte in the center of
the cell. The shape of the equilibrium gradient depends on whether the current
mode is high or low as shown in (a) and (b). This assumption appears reasonable
in view of the large difference In the dilution effect of vater production and
hydroxyl ion consumption for the two cases. When the current is suddenly switched
from one mode to the other, the gradient must shift to the new equilibrium condi-
tion. As shown In (c), this non-steady state transient results in net excess
hydrazlne (shown as cross-hatched area) in the case of changing from high to
low current; conversely, this area represents a net deficiency In the case of
changing from low to high current.
A net excess hydrazlne when switching from high to low current would
cause the undershoot of the equilibrium effluent pOg as shown in (d). Likewise,the net deficiency of hydrazlne in switching from low to high current would
cause an overshoot of the equilibrium high mode value.
Transients In the effluent pOp response to step changes In current
were not recognized as such in previous testing In Phase I because the test
conditions did not allow equilibrium to be attained in low current mode. The
identification In this test program of the existence of the low mode transient
is particularly significant. The ability to accurately predict the value of
the undershoot will be essential in the scale-up of the process to a full-scalesystem. It vn,i be necessary to be able to predict the m-t»innim effluent pO
for a given pOp low limit so that cross-over into the region of hydrogen pro-duction does not occur. The model presented above is a very simple one and it
is recognized that a more complete quantification of the complex processes
occurring In the cells will be a necessary step in the continuing development
of the process.
pOg Control Characteristics
It was found that the new pOg control technique, which modulates the
hydrazlne feed at high and low mode pOg effluent limits, Improved the pOg
control by Increasing its responsiveness. The improvement In p02 cycle time
85

50
6AS LIQUID
(a)
d>H'
7 HiO^
(b)
L I Q U I D
-- 9 X
Figure 23 Diffusion Model of Electrolysis Cell
86

vhlch vas achieved by decreasing the control dead band (Tests 1 and 2) indi-
cates that an even more sophisticated control technique, possibly proportional
or rate control, might ultimately be considered for this system.
It vas demonstrated In Tests 2 and 3 that Increasing the low mode
current improved the pO control by reducing the cycle time* If there wereno other constraints or requirements on the system, it is obvious that theoptimum pO? control would occur with constant current operation. A manned
spacecraft, however, can realistically be expected to have a vide range of
metabolic and leakage loads. The HO/OP system must therefore be versatileenough to meet the varying demand by having more than a single current mode.
It appears that a reasonable compromise of the conflicting requirements to
optimize pO2 control yet still control the total pressure of the cabin would
be to set the low mode current as high as possible, i.e., to provide for
metabolic and leakage load, and to set the high mode current at the
lowest possible value, i.e., to provide for maximum metabolic and normal
leakage. The case of maximum leakage would then be handled by turning onan installed spare module. This approach would allow the high and low mode
currents to be set reasonably close together to achieve good p02 control and
would still allow the maximum demand conditions to be met.
The four cases of metabolic and leakage loads which were run in
Test 3 were a good demonstration of the ability of the Np/°2 system torespond to step changes in demand without control upset. The pOp control
characteristics for each case are presented In Figure 2k. These data show
that as expected, the shortest cycle time and smallest amplitude of pOg
occurred at the normal design point conditions. The worst response occurred
at the conditions of Case IV, where there vas a n»-**»'*i"m percentage requirementfor nitrogen. Here, the high HgH feed rate resulted in a large undershoot
of the pO_ control band.
Trace Gas Cont«"»rf"«'*trs
Undesirable trace constituents were found in the gases generated' by
the system in sufficient quantities to require attention. The chemical analysis
results of Test k are summarized in Table 16 and are considered individually
below.
87
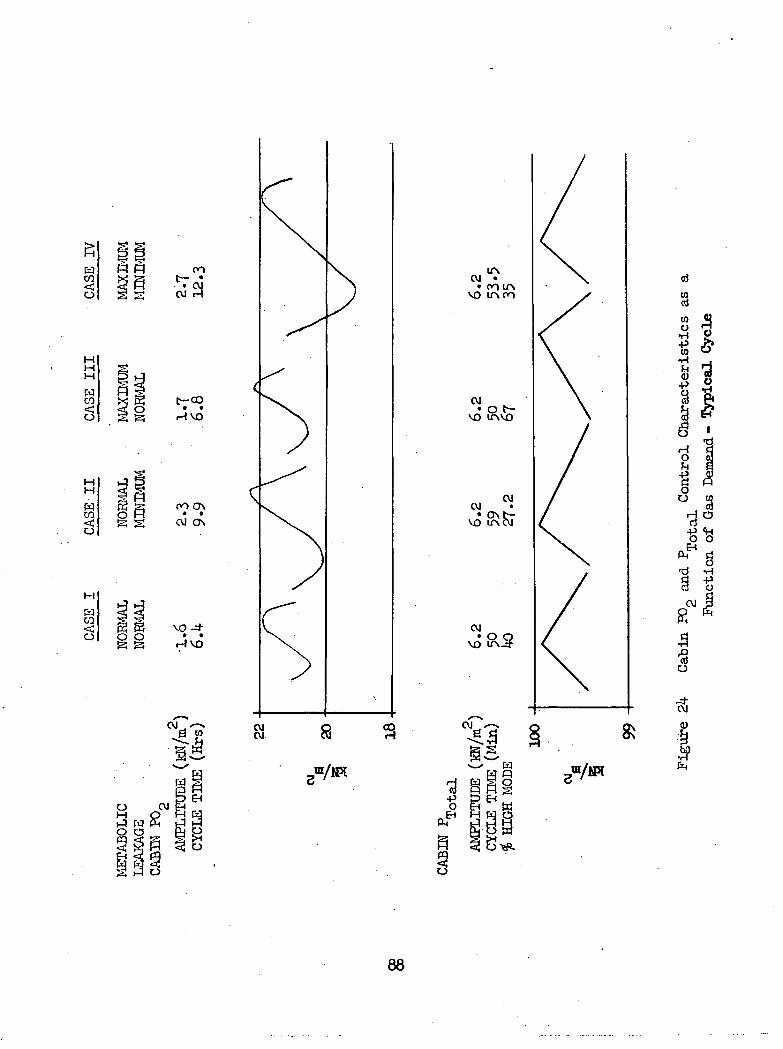
HHH
WCO
HH
CO
M
CO<;O
gg
S Sis
t—OJ
no
C—CO• •
H VO
CVJ OX
r-lVO
cvj•
vo
ir\
OJ
cu• o\
VO ITv
cu
CVJ
\o
o
CVJ

1H CO
C8 COEH H
1CO
3
CO
5
-3- EH
^OJ ^>tt H
P
OO
£..
^ °OJco ^EH5
BEH
O OJ
H S£_)
1
wo
oo
w oI-H H& EH
<! OCO O
(-J)
oOJ
0-*'o
OO
oOO
1
oOJ
OJ
*p'
*oH. 1
ON
OJ^^H
OJ0
0OJ
oOO
1
oOJ
Hi.f- l
h-.
oOJ
p*
p*&
0w
J'
oOJ
p
"
p
.^
OO
o
*
K
W EH OJ~OJj-H <£ O %5
S ^ ." .5 p t ^^ (^^m w co t>-
co — -
ioH
<^:PH
°
rf COP O <
• H O K WO PC O PQ
S oO CO
0 §OJ O
ffi ' WSo
t-3 o E-i<! H fe
O O CO WOJ o <q pq
K pcj pq pq2 Om « co0 0
W P,
§ o1
§ §
O t-3o
2 S OH °
COWps-EHOW
.a3EH
K
S|lB SwP.iO
g o> aoo
II

Carbon monoxide, detected In the Hp/°2 effluenfc and the
separator effluent, vas produced "by the slow oxidation of residual organic
materials In the commercial electrodes used In the cell stack. This vould
not be a problem In a spacecraft system because the experimental electrodes
being developed as part of this program do not produce CO.
Methane, detected at an extremely low level in the bubble separator,
gas, vould not require special control because of the very low level and the
very low gas production rate. It is also very possible, because of the
difficulty of obtaining clean gas samples from a reduced pressure point,
that the analysis vas not correct.
Nitrogen dioxide vas indicated by the analyses to be present at
all three sample locations. The analysis technique used vas not very sensi-
tive for N02; the presence of NO- should be verified in the future by chemi-
luminescence. If, indeed, NOp is being produced by the system, processing
of the N2/02 by vet charcoal or a basic sorbent vould be necessary in a space-craft application.
Nitrous oxide vas detected in the Np/°2 gas ^ mass spectrometeranalysis but vas not confirmed by gas chromatography. Its actual presence
is questionable, but if present, vould require processing vith vet charcoal
in a spacecraft application.
Ammonia vas detected at levels veil above the limits of detectability
in both the Ng/O and the hydrogen gases. Acid charcoal of sorbeads could be
used in a spacecraft application to remove the NH_ from the Ng/Og gas*
Hydrazine derivatives vere detected in «-TT sample locations. The
Np/0? V°u3d require processing by catalytic oxidation to remove this undesirable
constituent.
Based on available information concerning trace contaminant control
in a manned spacecraft , it appears entirely feasible to process the Ng/Og
gas directly in the spacecraft contaminant control system without imposingan appreciable excess load on this system. This approach vould permit
handling of the contaminants at their source (highest concentration) rather
than having to process them after dilution to lover concentration in the
spacecraft cabin atmosphere.

Heither the hydrogen nor the babble separator gas would requiretreatment* The hydrogen vould be used in a COg reduction system vhere thelow levels of contaminants would not be expected to interfere* The gas
production rate in the bubble separator is low enough not to cause a problemif this gas is dumped directly to the cabin*

2.6 PROTOTYPE DESXSJ
2*6.1 Requirements
The purpose of this task was to define the design of a prototype unit
consisting of a replaceable electrolysis module Incorporating the modularity con-
cept of the preliminary design effort previously performed in Phase I of the con-7tract. The results of an analysis effort under a separate oxygen-only program'
form the basis for this task. The detailed component drawings and specifications
for the No/Op system were submitted as a separate item under .this contract. This
section of the final report covers the additional analyses that were conducted to
expand the 0 -only design to an Np/ 2 desi*n an^ briefly describes the functionalcomponents of the N2/02 assembly.
2.6.2 System AnalysisThe Np/0 system is based on the Space Station Prototype (SSP) 0 system
design, with changes only as required to allow the generation of nitrogen and to
account for specific mission variations. The basic differences, therefore, lie in
the areas of a revised system design point, a revised heat exchanger analysis, andan increase in system electrolyte volume and AP due to the new reservoir design
and other minor changes.
2.6.2.1 System Design PointThe system is designed for SSP cabin leakage and metabolic consumption
rates. Each module is designed for operation at a maximum current density of2150 mA/cm and, therefore, k modules with 22 cells per module are required for a
6-man system at the mM-timim values of metabolic and leak rates. At lesser values,
fewer modules are required.
A design point summary of input and output parameters is presented inn
Table 17* Operation is based on the maY-twiTa current density of 150 mA/cm and a
NgH, conversion efficiency of 1QO#. According to Figure C-6, DJSC/A9771498, this
requires a cell voltage of 2.2 volts. Total input power is 1195 watts with a
controller efficiency of 92$ and the total heat rejected is 489 watts. It is
assumed that only heat generated In the cell stack is rejected through the
electrolyte loop, as there is some connective cooling and the cell controller
has a separate heat sink.
92

Table 17
OUKPOE •
00 - (5.10
Ifc/day)
- (7.55- (0.95
HgO - (5,72 Xb/aay)(2*1*6
MAXIMO* POWER BSS2JQK POIHT(1 HOBBLE)
2.32 kg/day
0*98
3*1*30.1*3
2.60 kg/day1*12 leg/day
OPERAI3MG PABAMBIE31S:Cvtrrent DensityCeU Voltage (!Po*al)
Ccaiverslcaa Eff .
POWER BfiPUlJ
Cett Controller (9256 Bff .)PumpOther
150
2.2 volts200$
vatts35 watts
Total
Q REJECTED:
Cell StackCell Controller
Valves, etc*
vatts
Total
90 vatts35 w«tts20 watts
vatts
Equivalent to H^O (if.34 Ib/day) 1.97Ngl^ HgO (3.8k lb/day)l,75
93
2.6.2.2 Revised Heat Exchanger AnalysisSSP requirements for the 0. system specify a KDH Inlet and vater
inlet temperature of 32*6 and l8.3°C (90.8 and 65°P) respectively. Also, the
KDH and vater flow rates are respectively 12 and 9.4 grq/s.
The test heat exchanger had an average of 670 J/s m °C (ll8 BTU/hrft2 °P) (See Section 2.3) and an area of 0.068 m2 (0.737 ft2). Thus, for theassumed electrolyte loop heat rejection of 344 watts, a 7.4°C (l3»4°F) IMTD is
required versus the 5°C (9°F) available for the SSP case. The vater inlettemperature or flov rate must, therefore, be slightly modified to allow propersystem operation. The easiest solution voulxL be to lover the inlet vater
temperature 2.8°C (5°P) and keep the specified low rate.
2.6.2.3 System Electrolyte Volume APDue to the revised reservoir design and other minor changes, accurate
electrolyte volume and-AP analyses vere run. The results of these analyses aresummarized in Tables 18 and 19. The bubble separator pump produces 34.4 kN/m(5 psi)A F at the required flov rate, and therefore, can easily supply the re-quired pressure of 27.9 kN/m (4.05 psi).
2.6.3 Detailed Design
2.6.3.1 General Description of Prototype Unit
As shown in Fig. 25 and schematically in Fig. 26, an Hg/Og electro:iO''sis
module consists of a cell stack, electrolyte reservoir, pump/bubble separator,
electrolyte heat exchanger, base plate assembly, and supporting valves, plumbing,and Instrumentation. The detailed drawings vhich vere procueed for these compo-nents and their specifications are listed in Table 20. All components exceptthe heat exchanger are mounted on one side of the base plate assembly, vhichserves as the primary mounting structure for the unit. The heat exchangerand quick disconnect electrical and plumbing connections are on the oppositeside of the base plate and form the sole interface vith the system cabinet.All input, output, and control functions are through this Interface.

Table 18
SXSZQfAP SUMMARY
Cell stack 7.92 kH/m2 (1.15 psi)HX 1.38 kN/m2 (0.20 psi)Reservoir 0.69 kN/m2 (0.1X) psi)Valves 9.92 kH/m2 (l.l^ psi)Pipe, passages, etc. 7.92 MJ/m2 (1.15 psi)
Total 27.83 kH/m2 (4.05 psi)
Table 19
SXSTB1 VOLUME SUMMARY
Reservoir 23.0 cm3 (1.40 in3)Cell Stack 12J30.0 cm3 (67.00 in3)
P Regulator 2.7 cm3 ( 0.12 in3)Cell Stack Header .
and Tube 0.8 cnr ( 0.05 in )Base Plate 1*9.2 cm3 (3.00 in3)Heat Exchanger 60.7 cm3 ( 3.70 in3)
Ptaigp/Bubble Sep. 88.5 cm3 ( 5.to In3)3-Way Solenoid Valve 1 .7 on3 ( 0.90 in3)Check Valves 2.7 cm3 ( 0.12 in3)
Total 13 2.3 cm3 (82.64 in3)
95

ww
IC\l
<u
96
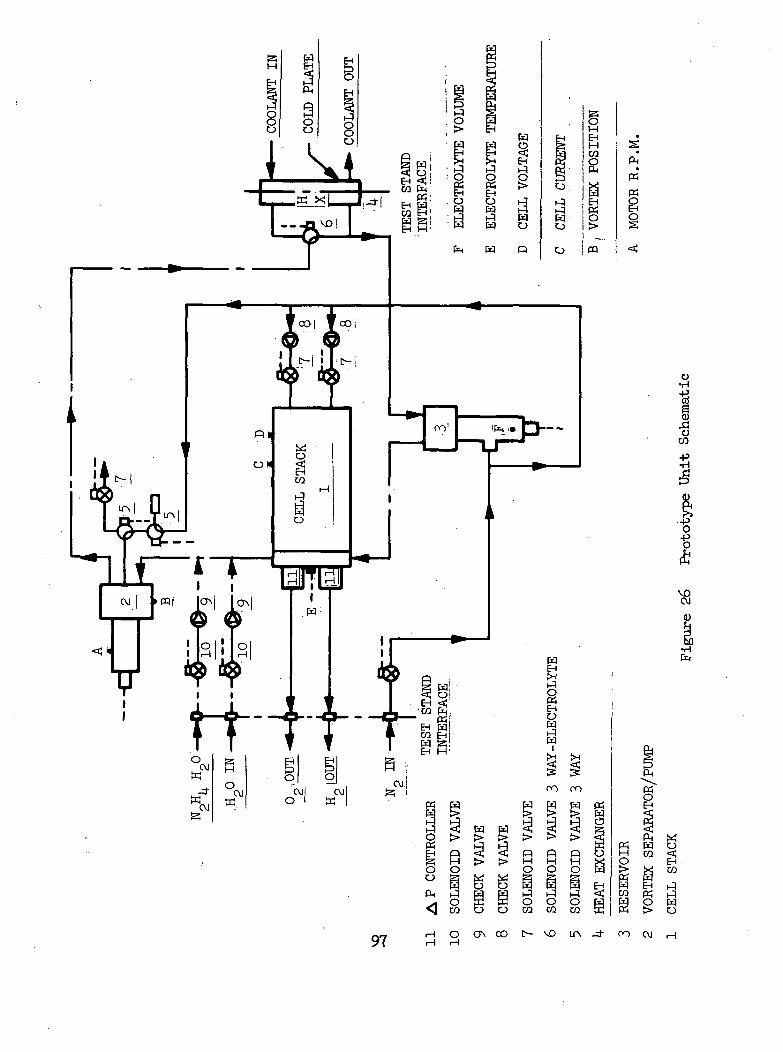
97 H o ON oo c~- vo 00 CM H

Table 20PROTOTYPE UNIT DRAWING LIST
ENGINEERING
BEH 20001
BEH 20006
BEH 20007
BEH 20008
BEH 20009
BEH 20010
BEH 20011
BEH 20012
BEH 20013
BEH 200114-
BEH 20015
BEH 20016
BEH 20017
BEH 20018
BEH 20020
TEST 20021
Schematic - Np/02Generation Moaule
Template - BasePlate Passages
Base Plate Assy.Gas Electrolysis Cell
Spacer - GasElectrolysis Cell
Closure, Bottom, BasePlate, Gas Electrolysis Cell
Spacer, Electrolyte -Electrolysis Cell
Main Body, Base PlateGas Electrolysis Cell
Spacers, Base Plate,Gas Electrolysis Cell
Screen Assembly, Matrix Support-Electrolyte Spacer
Spacer Assy., Electrolyte-Electrolysis Cell
Frame, ElectrodeGas Electrolysis Cell
Screen, Catalyst Support ElectrodeGas Electrolysis Cell
/
Electrode Support ScreenGas Electrolysis Cell
Electrode AssemblyCel1
Reservoir Assy.y°2BaseReservoir
PROCESSSPECIFICATIONS
MS 3361*6LAC-3601
LAC-3601
LAC-3601
MS 3361*6LAC-3601
LAC-3601LAC-0581
LAC-3601

Table 20 (Continued)
DRAWING LIST
(Continued)
ENGINEERING
BEH 20022
BEE 20023
BEH 2002lf
BEH 20025
BEH 20026
BEH 2002?
BEH 20028
BEH 20029
BEH 20030
BEH 20031
CONTROL
2-113
HousingReservoir
Support Assy., TransducerReservoir
Case Assy.Reservoir
Adjuster DetailsReservoir
PistonReservoir
Cap, PistonReservoir
Clamp, TransducerReservoir
Support, PistonReservoir
Spring,Reservoir
Bushing SupportReservoir
Pump/Bubble Separator
PROCESSSPECIFICATIONS
LAC-3601
DS 8988LAC-3853LAC-3601
AND 10050-4IAC-3853LAC-3601
LAC-3601
LAC-3601
LAC-3601
LAC-3601
LAC-3601
LAC-3601
99

Operationally, the unit consists of the electrolyte circuit, thenitrogen circuit, the gas supply, the water feed, and instrumentation.
ELectrplyte Circuit - The electrolyte is completely sealed within
the unit and circulates through all major components. Water and hydrazine
enter at the reservoir, which accommodates changes in electrolyte volume
and also controls the water and hydrazine feed rates. Water and hydrazine
feed modes are separate, and are selected by the control system. During
the water feed mode, as water is consumed, the system water volume decreases
and sensors in the reservoir activate the water feed solenoid valve. When
the volume is restored, the water feed is terminated. In the hydrazine feedmode, the water feed solenoid is deactivated and the reservoir sensor con-
trols hydrazine feed. The water and hydrazine feed systems are introduced
into the reservoir to assure complete mixing with the potassium hydroxide
electrolyte before passing into the cell stack. The location of the reservoir
Immediately upstream of the cell stack is considered optimum, as this location
presents the minimum potential for free gas accumulation and the reservoir
serves to dampen potential electrolyte pressure pulses within the cell stack.
In addition, this location provides for close pressure control close to the
cell stack which is desirable for setting of gas/liquid pressure differences
and the absolute pressure levels.
The electrolyte flows from the reservoir Into the cell stack where
it provides water for the electrolysis process and cooling of the stack. In
the cell stack, the liquid volume is reduced as water is consumed, causing
some gas which entered the system dissolved in the feed water, to come out of
solution. The cell stack is designed to assure that the free gas formed is
separated from the stack by the circulating electrolyte.
The electrolyte containing the free gas then passes into the bubble
separator and into the pump. The bubble separator and pump are combined in a
single housing and are driven by a common motor. This is a new design for theprototype system. The liquid and gas mixture first enters the cylindrical
chamber where a rotating blade creates a vortex. The liquid collects on the
outer wall of the chamber where it is directed to the centrifugal circulating
pump Impeller. The gas separates from the liquid and collects in the center
WO

of the vortex where it is removed by a gas pick up probe. Gas removal is
controlled by a sensor vhich controls the liquid level in the vortex chamber.
The electrolyte leaving the pump is at its highest temperature
having picked up heat in the cell stack and in the pump/bubble separator. The
liquid then passes through a temperature control valve which either selects
a route through the heat exchanger or through a bypass line and back to the
reservoir, as determined by temperature sensors at the cell stack inlet.
The heat exchanger is of nickel construction and is coated with Kynar. The
heat exchanger transfers heat to a cold plate by direct conduction through
a mechanical Interface. Contact is assured by bolting the heat exchanger
and cold plate together. All portions of the circulating electrolyte are
either plastic, Kynar coated, or elastomers to as sure that no bi-polar elec-
trodes are developed that would produce gas in the electrolyte circuit.
Nitrogen Circuit - The pressure level of the electrolysis system
is controlled by the nitrogen pressurization system. Differential pressure
regulators set the nitrogen pressure on the back side of the reservoir bello-o
fram. A spring in the reservoir which is adjusted to a minus 13.8 kN/m (2 psi)
assures that the liquid pressure will always be less than gas pressure when
the module is inactive. This 13.8 kN/m2 (2 psi) differential will allow
adequate gaspressure for nitrogen purge to inert the modules on shutdown. The
absolute pressure of the electrolyte will be 103 kN/m (15 psig) to prevent
possible condensation of water from the effluent oxygen and hydrogen streams
under «TT operating conditions. The nitrogen also serves two other functions.
Daring normal shutdown of the electrolysis system, nitrogen pressurization
solenoid valves at the inlet to the hydrogen and oxygen sides of the module are
open and the hydrogen and oxygen shut-off valves at the outlet are closed. The
nitrogen then feeds slowly into the cell stack to prevent pressure decay as
the hydrogen and oxygen are slowly consumed by fuel cell effects in the absence
of electrolysis power. A pressure decay could result in flooding. A second
nitrogen use is the inerting of the modules during total shutdown and change of
a module. In this case, the nitrogen purge and shut-off valves will both beopen and hydrogen and oxygen will be purged from the stack by flowing nitrogen.
For a predetermined time Interval, the module shut-off valves are then closed
off and the module is inerted.
U01

Gas Supply - During electrolysis operation, oxygen, nitrogen, and
hydrogen are generated In the cell stack. In order to prevent flooding, the
gas pressure In the stack must be greater than the electrolyte pressure. Thus,
differential pressure regulators are provided which back pressure the effluentgases in the module to a level of 2. 9 kN/m (UD in. water) over an electrolyte
pressure reference. Gases passing through the regulators then pass out of the
module through shut-off valves.
Water Feed - When the reservoir volume sensor registers low volume,
a water feed valve is actuated which restores the electrolyte volume. Back
flow of electrolyte is prevented by a check valve In the water feed line.
2.6.3.2 Component Descriptions
Cell Stack - The cell stack design was not modified extensively in
this program effort (Ref. 7). One variation from the basic Og only design was
that the composition of the electrodes was changed to reflect the design per-
form nee improvements Indicated In Sections 2.1 and 2.2 of this report. These
design changes Included the use of the reduced-catalyst cathodes and the iridium-
additive experimental anodes. In addition, a high bubble point hydrophilic
membrane with an in-situ deposited asbestos matrix combination was substituted
for the discrete asbestos sheets used In the previous design to improve the
resistance of the cells to gas breakthrough at high gas/liquid differentialpressures.
Reservoir - The electrolyte reservoir is provided to accommodate small,changes in electrolyte volume due to normal pressure and temperature fluctuations,
to provide mixing of the electrolyte and water during a water feed cycle, to
compensate for changes in the electrolyte volume due to the consumption of wateror hydrazlne in the electrolysis process, and to allow the addition of relatively
large amounts of hydrazine to the electrolyte when Hg generation is desired. In
addition, the reservoir controls both water and hydrazine feed, controls the
system electrolyte pressure, and provides system safety signals.
1X>2
The unit consists of a base and housing which support the ethylene
propylene and dacron bellofram diaphragm, a guided piston and the piston support,
the transducer and transducer support, a spring and spring adjuster assembly,
and the outer case assembly. The bellofram divides the unit into separate
electrolyte and gas chambers, and the electrolyte interface to the base plate
is through face "0" ring seals. All metal components are stainless steel,
vhile seals are ethylene propylene rubber.
The gas side chamber is formed by the outer case assembly and the
housing. It has a maximum operating pressure of 15 psi, and contains the
piston and support assembly, the pressurizing spring and adjuster, and the
transducer assembly. The piston is supported in Delron AF (a mixture of
Teflon and Delron) bushings which assure a low coefficient of friction and
min1.'mm|n wear. The coll spring assures a high load with a win'timim installed
length, and the pressure on the bellofram is easily adjusted by inserting
two rods through the slot in the transducer support assembly and rotating
the adjustment nut relative to the adjustment sleeve. The hollow support
shaft allows the transducer to be placed inside the shaft to minimize
external case dimensions.
The transducer itself is a DC input, DC output differential trans-
former with a built-in carrier oscillator and phase sensitive demodulator.
It provides a DC output proportional to linear displacement, and is extremely
accurate. It assures long life as the only moving part of the assembly is
the transducer core. Electrical feedthroughs are made by a hermetically
sealed connector in the outer case.
During operation, the unit is used to control both water and hydra-
zine feed. Water feed is normally controlled to +13& of total system volume,
while a hydrazlne feed of up to 17*7$ of the nominal system volume can be
accommodated. If, during the water feed mode, system volume exceeds +3$ of
the nominal system volume, high or low electrolyte level safety signals
are initiated. Also, if during the hydrazine feed mode, the hydrazlne feed
limit is exceeded by 2$> of the nominal system volume, a safety signal is
initiated. Volume control functions are summarized In Table 21.
103

Table 21
RESERVOIR VOLUME CONTROL FUNCTIONS SUMMARY
Control positions and nominal percentages of system volume:
o Low electrolyte volume limit - 3$ below nominal system
o Water feed on point - 1$ below nominal system
o Water feed off point - 1$ above nominal system
o HgO feed high electrolyte volume limit - 3$ above nominal system
volume.
o NgH, feed safety limit - 20.7$ above nominal system volumeo High electrolyte volume limit -22.7$ above nominal, system
volume.

An additional function of the reservoir is to provide system electro-
lyte pressure control, both during storage and during system operation. At
the nominal volume point, the reservoir provides a differential pressure ofp
13.8 kN/m (2 psi) between the gas and liquid sides of the system, with the
higher pressure on the gas side. This pressure is allowed to fall as low as
3.I* kN/m (0.5 psi) at the hydrazine feed high limit point. Total system
pressure is controlled by pressurizing one side of the reservoir with nitrogen
gas. During storage, gas sealed in the reservoir maintains the electrolytep O
system pressure at 13.8 kN/m (2 psi). During operation, 117 kN/m (l? psi)
nitrogen is applied to the accumulator, resulting in a nominal system pressure
of 1D3 kN/m2 (15 psi).
Pump/Bubble Separator - The pump/bubble separator*is manufactured
by the Fluid Dynamics Corporation. It combines the functions of electrolyte
pump and gas/liquid separator into one unit driven by one motor. It is,
therefore, used to circulate electrolyte through all fluid components, and
to remove gas bubbles which are formed in the cell stack.
The unit consists of a vortex section and sensing Impeller, a
pump section, and a magnet drive and motor assembly. The unit mounted to
the polysulfone base plate, which in turn mounts to the electrolysis unit
main base plate.
The vortex section consists of a polysulfone impeller mounted on
the central stainless steel shaft. This shaft also passes through the pump
impeller and is attached to the inner magnet drive. A vortex core diameter
sensing wheel is free-floating on the central shaft, and consists of a plastic
paddle wheel with internally imbedded toothed nickel wheel. Adjacent to
this wheel in the housing, is a magnetic proximity detector.
The pump section is between the vortex section and motor, and plastic
impeller, which also is attached to the central shaft. The end of the shaft
is attached to the inner magnet drive assembly.
The outer magnet drive assembly and motor attach to the end of
the pump section. The motor is air cooled and operates on 1 phase, 60 Hz,
115 volt power. The motor case is anodized aluminum and contains space for
control electronics. The motor and outer magnet drive are easily replaceable
105

as a unit, as they are held In place In the housing with a snap ring.
The whole separator unit weighs less than 1.6 kg (3.5 U>) andconsumes 35 watts of power. The case is designed for a m«vtwmn of 2kO kN/m
(35 psi) internal pressure. During operation, the motor drives the centralshaft through the magnet drive assembly. Liquid enters through the base and
passes Into the vortex generator where the spinning vortex wheel creates a
liquid vortex with a cylindrical gas core, thus separating any entrained gas
from the liquid. The size of the gas core is controlled by the vortex sensing
wheel and proximity detector. As the gas core expands, the wheel is less
Immersed In liquid and slows down. This is detected by the sensor and the
associated electronics opens the gas vent valve. As the core shrinks, the
wheel speeds up and the valve is shut. In excess of IX) cnr/hr of gas can beremoved.
Gas free electrolyte then passes from the vortex chamber into the
pump stage where a centrifugal Impeller pumps it through the system. The
pump can deliver 12 cm3/s (12 Gffl) at 2?.6 kN/m2 (4 psid) at 2l4.°C (75°F)»
Heat Exchanger - The prototype heat exchanger, designed and fabri-
cated in a separate phase of this program (see Section 2.3), was design
verification tested and found to be suitable for use in this prototype unit.
Base Plate - The Og-only base design was modified only to the extent
necessary for use in an oxygen-nitrogen unit assembly. It was modified to
accept the prototype heat exchanger discussed above.
Supporting Equipment - Supporting equipment such as valves, plumb-
ing, and most of the Instrumentation were not considered in this effort
because the design was directed to an early prototype assembly utilizing
laboratory support equipment, rather than to a full-flight prototype unit.
2.6.4 Process Specifications
Standard good practice, manufacturing specifications, both LMSCand MIL specs, were identified for those components that would be expected to
be fabricated by the LMSC B&D machine shop. For those components or parts
of components which are still in the' development phase, e.g., electrodes,
106

catalyst materials, and baseplate, process specifications were indicated as
TBD (To Be Determined).
2.7 RELIABILITY ANALYSIS
A formal reliability program vas not required by the contract. There-
fore, other than the reliability inherent in good engineering judgment, there
vas no attempt to Invoke the reliability principles that would be normal, fora flight article.
With regard to the breadboard system, the long-term performancetest, of the vortex bubble separator did provide useful reliability data,
Indicating the need to Incorporate in the design a reliable means of pre-
venting liquid carryover.
In the detailed design of the prototype unit, the reliability2analysis conducted in the preliminary design effort in Phase I was enforced.
In developing the water electrolysis system, it was decided that
the optimum approach was to avoid breaking Into the electrolyte circuit to
perform any maintenance tasks. This approach eliminated the necessity forhandling the electrolyte In zero gravity and could be Implemented with no
significant weight penalty. The maintenance concept that was evolved con-
sisted of providing individual self-contained hydraulic assemblies with no
electrolyte connections. A reliability analysis was then conducted to deter-
mine the optimum size and number of these Individual assemblies.
Preceding page blank
307

PRECEDING PAGE BLANK NOT FILLED
Section 3
CONCLUSIONS
3.1 CATALYST ADDITIVES
Substantial Improvements In the long-term performance stability ofelectrolysis cell anodes was achieved through the use of catalyst additives,
in particular iridium black, and through Improvements in the electrode fabri-
cation and processing techniques. This order of magnitude of performance
improvement would be reflected in a full-scale system design, e.g., the 12-man
preliminary design of Phase I, as a 10 to 20 percent reduction in power require-
ment (a savings of 0.78 to 1.57 KW) and approximately 50 percent reduction incooling requirement (2 KW).
3.2 CATHODE DEVELOPMENT
Reduced catalyst loading of the electrolysis cell cathodes was demon-
strated experimentally to be a feasible means of improving the hydrazine reaction
efficiency in the cells. Even though reduced catalyst loading increased the
cell voltage to a full-scale total equivalent weight (TEW) tradeoff shows a
potential savings of 20 percent in TEW resulting when the conflicting parametersof power and cooling are compared to fixed weight savings in hydrazine storage.
3.3 FROBOTYEE HEAT EXCHANGER
The prototype heat exchanger conceived for the 12-man preliminary
design effort in Phase I of the program was successfully fabricated and tested.
Its performance was demonstrated to be better than the original analysis had
predicted. Analysis of the test results Indicated that this unit would be
acceptable for use in a prototype module assembly.
3.4 SYSTEM TESTING
Over 1000 hours of cumulative operating time were logged on the
one-man breadboard system under various test conditions. The tests that were
conducted have led to a more complete characterization of the hydrazine/water
electrolysis process in the following specific areas:

o A nev cabin pO control technique was successfully demonstrated.
The use of this technique, coupled vlth more optimum control band
and current level settings, resulted In achieving a cabin p02cycle time of 6 hours as compared to approximately 12 hours in
Phase I.
o The ability of the system to respond without control upset to
a wide range of cabin gas demands was demonstrated.
o A closed-loop test of laboratory prototype zero-gravity components,
i.e., a vortex bubble separator and bellofram reservoir, was
successfully conducted.
o A series of parametric tests in which current density and tempera-
ture were varied were carried out. The data indicate that in-
creasing temperature increases the hydrazine decomposition rate.
However, results are not conclusive because of differences in
method of hydrazine feed to the system and the range of tempera-
tures investigated was not sufficiently large to give a clear
. trend.
o A comprehensive analysis of the chemical composition of the
generated gases led to the conclusion that processing of the
generated Bp/Op mixture to remove trace nitrogen compounds will
be necessary in a spacecraft application.
3.5 PROTOTYPE UNIT DESIGBf
Engineering drawings and specifications sufficient to fabricate/
procure the necessary components of a prototype Ng/Op electrolysis module
were completed.
UJO
Section 4
REFERENCES
!• Greenough, B.M., "The Developnent of a Non-Cryogenic Nitrogen/OxygenSupply Technique", NASA CR-114912, May 17, 1971.
2. Greenough, B.M., "Preliminary Design of a Space Station ElectrolyticOxygen-Nitrogen Generator", IMSC/A977498, March 5, 1971.
3. Greenough, B.M., "Design, Development and Fabrication of a WaterElectrolysis System for a 90-Day Manned Test", NASA CR-111911,June 21, 1971.
4. Greenough, B.M., "Status of the U4SC Circulating Electrolyte WaterElectrolysis System", ASME Paper 71-AV-20, SAE/ASME/AIAA LifeSupport and Environmental Control Conference, San Francisco,California, July 12-1 , 1971.
5. NASA Contract NAS9-H848, "Water Electrolysis System Refurbishmentand Testing", .Document MSC 07383.
6. Olcott, T»M., "Development of a Sorter Trace Contaminant ControlSystem including Pre- and Post-Sorbers for a Catalytic Oxidizer",NASA CR-2027, May 1972.
7. "Space Station Electrolytic Oxygen Generator, Preliminary Design",IMSC/A981656, January 1, 1971.
Ill
PRECEDING PAGE BLANK NOT FILMED
LIBRARY CARD ABSTRACT
A development program vas conducted concerned with the use of a
hydrazlne/water electrolysis technique to provide both the metabolic-oxygen
for crew needs and the oxygen and nitrogen for spacecraft cabin leakage make-
up. Anode stability was improved with catalyst additives and improved
processing techniques. The hydrazine conversion efficiency was improved by
using reduced-catalyst loading of the cathodes. Over 1000 hours of testing of
a one-man breadboard Op/ o system provided data for characterization of the
hydrazine/electrolysis process and for improvement in system control. Detailed
design of a prototype modular unit was conducted including fabrication and
design verification testing of the internal heat exchanger, which is a
component of the unit.
Preceding page blank
113

APPENDIX
TEST DATA LOGS
CATALYST ADDITIVE TEST DATA
The following section presents the raw data taken on electrodes in the
testing of various anode compositions. Data are presented for the most
promising electrodes only. Many of the electrodes built up were not
subject to cell testing due to mechanical defects. A discussion of these
data is presented in Section 2.1 of the text.
A-l

WATER ELECTROLYSIS DATA SHEST
/ Cell No. ''' 7
V 'f in t • r ^ I ' I-> I / / Operator 'u'^V^ f/1 t If Sheet / of
' • / ~Cell Description; Size -
^To -J «Anode "' - _ 2 b T / , e^, S^o -J «QL>*r "2xJ 5~
Cathode ^ f - / ^ _ . - /CA
Matrix
Assembly. c/t>>i d Nyd
Electro lyte_ 3 ^0 //
Test Description;
Test Analysis;
Total Operating Time_
Reason for Stopping Teat_
Remarks
A-2

-V
3
5 R}
-J
;v
•v
£
Q
•vi
(M. fNifx
: t.
! 's.
&is
*>
o
m
r-f r
IV)r
3S
r;t—F- --fi
.^:1?^t'^ —41
r.-\
"-C -•o
-o -C
,g;•j\l'-v.
r--i •'*••>n
•a^t-f
A-3
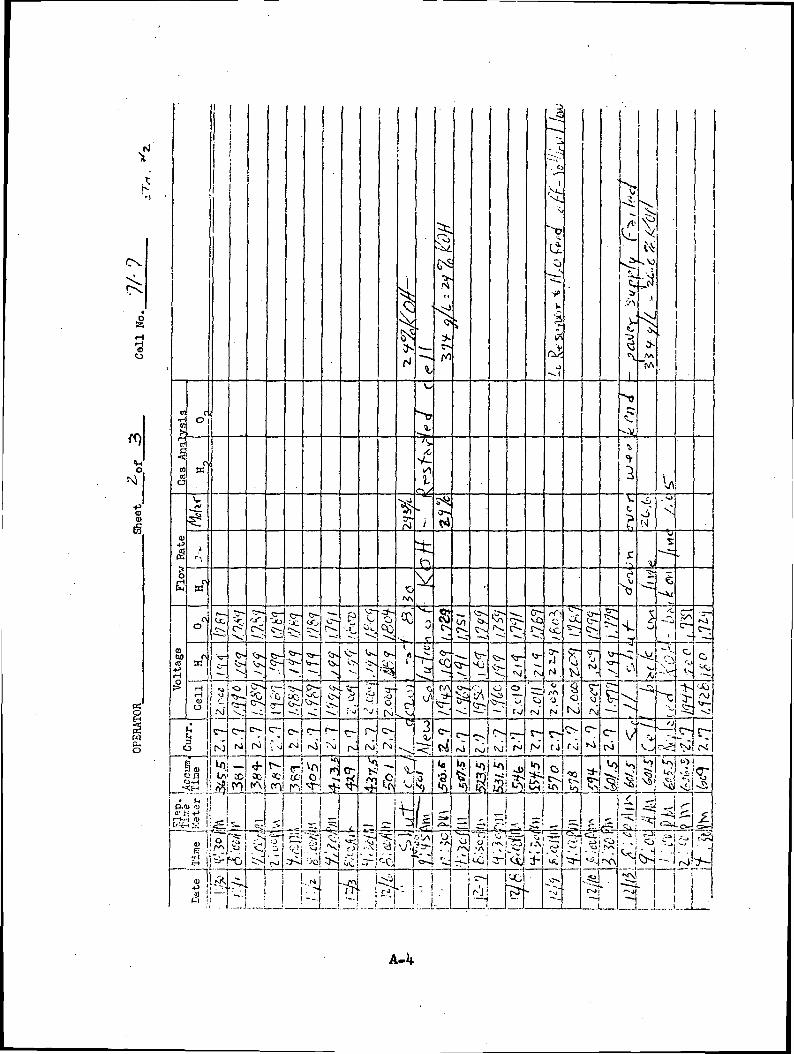
cx
•Hj O
(fl
»| wcojl
--V
\
2ws
t\BC
« <i
fN) M
S !
20'-*;. H< ^
H5^-w-J >
N fvi N
NJ
(N
(V\
T5
M rvi (Ol N.' ^ f J
<r
O.'U rj I.-
rt.S« ' i I _ I
lii-lfiiTJifSrt1^>Q
-s
UN!
iJ^gi-CUgj ^!.CE
! j i r?jfLD_ldL
A-4

J.
*-(O.
|
a,o
ta8
<DDO
ill! II
1 I
vO
C-k*a
v»c*
NO Q
r-tv
«§• •sj-|-^i S O
.'A
r-g^^Li.
A-5

Date
Cell Description;
Anode
WATER ELECTROLYSIS DATA SHEET
Cell No..
jDperator
Cathode_
Matrix
Size
Sheet / of
' '
Electrolyte < O //
Test Description;
Test Analysis;
Total Operating Tijne
O HReason for Stopping Test
Remarks t \ l<\ \ ly£{5 ?- // ff u.) f O \ < ~ C \ t \
*>
f k l U ^
f AVH n> /!V£-f~i-i*i....-
rr ftv\ ? r\ ~t~ in d l t{ t<? f Kofi
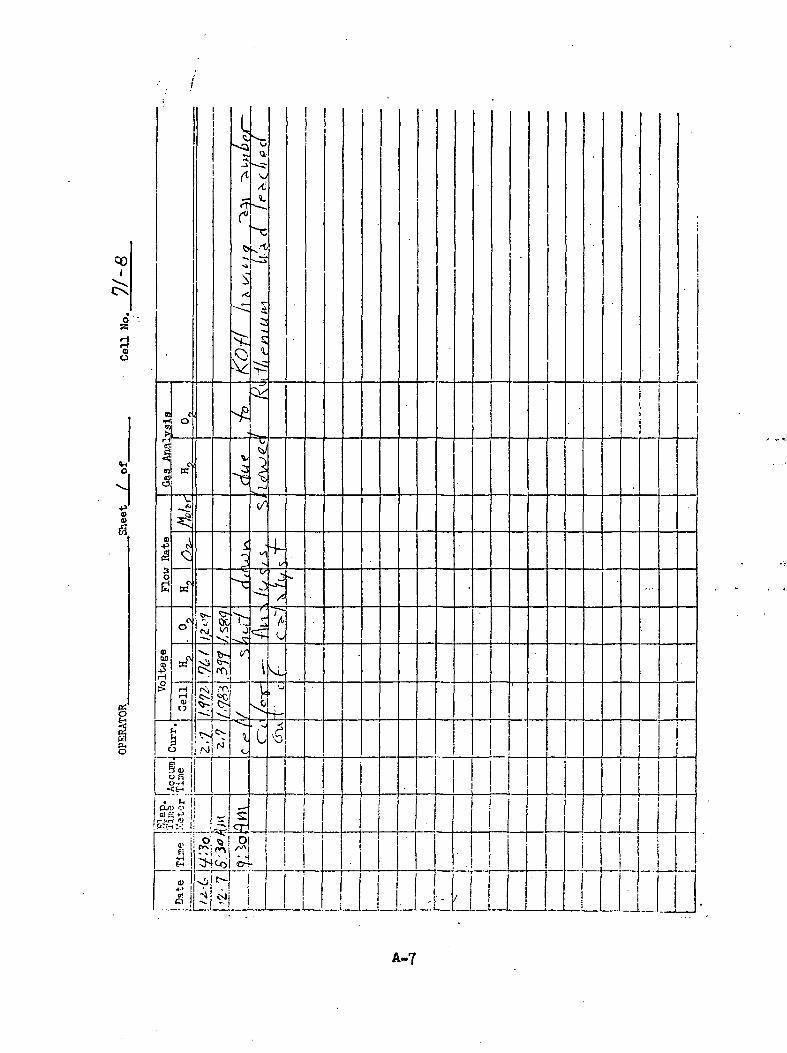
00I
o
I
& 1
•Hi O
?L_
$
&
--^7
vP3
;4-
=£
fe
K, ro,
N N
,1M 1'<BK *»r-i.rt «wen :•:
*i i
I
—,- >?:>; ^ I Ol
O-r-
" l:__?_Lr!j;- Li . !
-_L
A-7

4-6

WATER ELECTROLYSIS DATA SHEET
Cell No. //" 9
Date / *- Operator Sheet / of
Cell Description; Size / f* OH
r>(/l -7s% 7V#an ca7c...Uo^r ^VcPfAnode // ? s -/.. /-r {-/en 1 CZ) Vc- -.U o tx > r ~^> Ve Kr 5 "/0 Z-fe<? / i//n' • / '
Cathode / l ' -L T./' 7- ?;- •=/
Matrix \
Asseiably_ —t~r n f/» /"c/
Electrolyte .~~^><^Cef /*CO H
Test Description;
Test Analysis;
Total Operating Time
Reason for Stopping Test_
Remarks
A-9
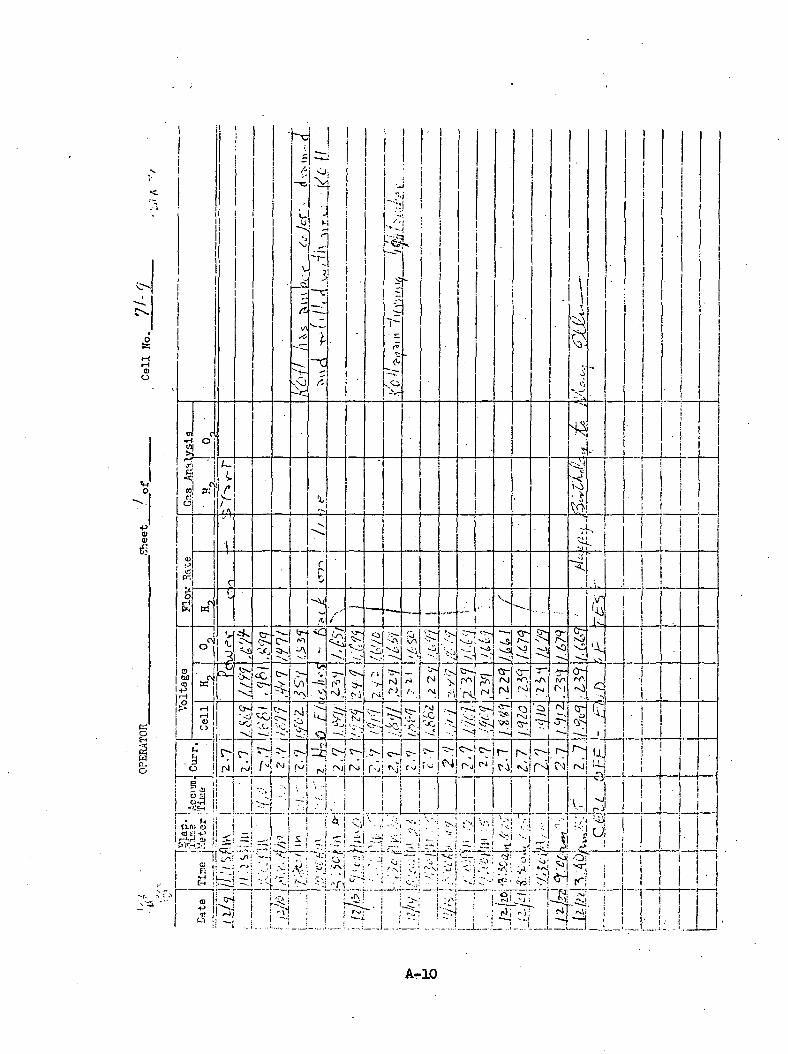
IDO
VlO
•p<u£
wfuO
J3 °i>1 i
I
i /-
«
,5
<Ji i
j;I i
-o
h !|-,_h-J
J !|N|^_g i5 n>
oj i• .'F-i .'
N
cv:
N rs)r >j -11
N rsi TM
i
0,
j-x" '
a •---;• ; -•I £ itd -I >;:
r -o j^ j r j 'r-
rxli
c i :~ . , i ' — ; ^^ ;>i ^ ' ! '^! : ^'i
A-K)

WATER ELECTROLYSIS DATA SHEET
Cell No. '?/- frlO
Date ' -/ L ~~ Operator Sheet / of
Cell Description! Size / & C M
~% <f • ~~* // <*"• <•? /"*/
/ a 11 i\' , Y*1/ C~~/"Cathode ' ' /t.-.-''v ;VM •-? /•? «
Matrix _^ .
Assembly j ' 1 n o *
Electro lyte__
Test Description;
Test Analysis;
Total Operating Time ._
Reason for Stopping Teat_
Remarks__ ,
A-n

XI
o
SwP-.o
I I i i T-U! J-Jii id^h
3 !^i j^^tiS^^^d^^5S.?:!Sci^ i^i^ N^l^ro^^'Lirtii^r^^Vn^^^
__1 L...
A-12

3o
0)O
c*to! w3
^•Hi-H
3
saCVD 0)«J P
t-
a.
v:rJ
••^
T^
IS!
cj AJ
i^
n--<x
M
f
sr-
fv
vj
O- ^Jx
^
ri.
^=3 »-o
CJ

£u
•ao
<MO
ID0)
KO
wf-.o
•Hi O
•*T
o
i —
13" Cs
o riO-H
XO) PJci i; -»-j
'H <u
E-" ';!

Sfv
WATER ELECTROLYSIS DATA SHEET
Cell No. 7/~//
•••^ ••.Mr H ~« '
Cell Description; Size (& C XV
V -> -*7 T // P>Anode / & b /* 'f \ l<?n . *5Z) /c> J^ <, i\ » r . "2.
Date f *•/ - -1 Operator • Sheet I of/ —
Matrix
Aasemblv ,^ f & i t f* 'Vo
Electro lyte_
Test Description;
Test Analysis;
Total Operating Time_
Reason for Stopping Test_
Remarks
A-15

*
cr-
X
/M
Vlo.
I
II!! ^
4Ni
I
C-J
I cr-N fNt N- M (NJ
VN
r-
o
a
I
c
^•=<
Ni /M
Cx.
/Nl
M N IN N
1
.T^j 7^ ^}-H
V^.NJI
tF ~T
5 tf) r-
A-16

•f.
B
BN)
MS•M
'/I
N)
o-
o-
u
^I
V,
ti
r
N N
*:
fJ
^;CO
mt
r-J
O+O.NCv
O V
A;
A-17

HrH<D
o
!>
rr
fx /N
<4 -'" ^ r^ c'j
3mo S (•
I £« o iL' iI a tr-tJ
§
ii ^T LSI.LJ:
A-18

CATHODE DEVELOPMENT DATA
A series of four tests vere run on cathodes having different platinum
loadings as described in Section 2.2 of the text. The test data for these
electrodes is presented in the following pages. The basis for analysis was
taken as a hydrogen flow rate of 1.70 cc/min at a current of 13.5 amps and
no hydrazine. Calculations of increased hydrogen flow considered the
difference between the measured flow at each molarity and the 1.70 cc/min
base.
A-19

WATER ZLEZT^OLiSIS DATA SilUST„ 7 /_ 7Gfill i.o. / ' c—
7 _ q 7 / Z? "-/, / /gate /~ / f Operator jQ > rt O'--»-L -CI. g t^ Sheet ' of_
Cell Description; Size /C-' C/»l
Anode ^
Cathode £. ~ / JL l < s J l-! jZ& &vch. <£ . S. • H* 3 /C^ P*t-
Matrix
As s emblyt /Ic* i g v.
ElectroJjte 3 Yd
Tfist L'3sorlpt.ior;_ ^
//- . •
Test Analysis;
Total. Operating Tine -'
Reason for Stopping Test S^?:/ifv- Q ~> I (f ' T 5^ //T-S u/'i 'T/l
Remarks. ____ "* rf-niy , 'Z hi t t /^r i.W ,"/l~i> /' /;''ot/y-i ~2-.ni f /'c^rjni 6
C ,' // c /:•<-• o TV 1 ^ --; '-'t ' > i n f ft r* ' Y fu 1 tre. <? _ no _I . " / / " '
v_vrc.-c !iy v'<° r/- 51 s /•/' y i?^ "?'< o __ ' _
A-ao
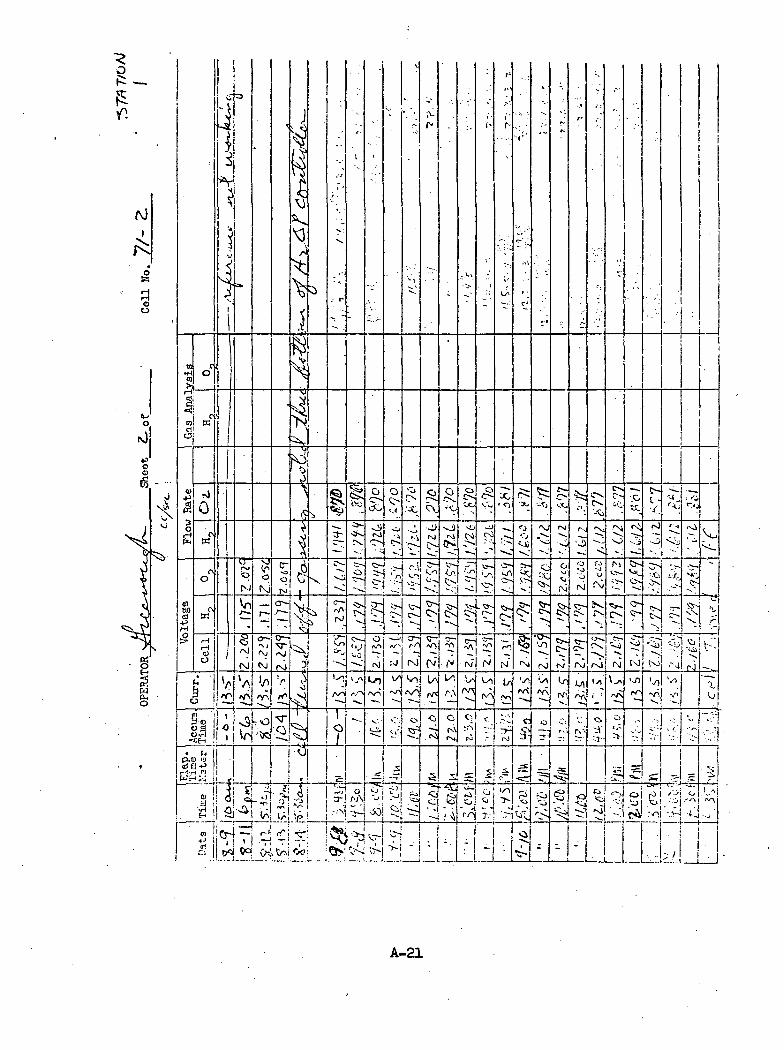
o
£
IDO
-it
3! rfS O
W
413 ~ H-;o
Sta-^^•M O iWHJi 11
_5^
.Ql«
ex
O
•i
UJH;-^ i. j! j i «•!
slli i fli !.5 :i o' K' - ' -~i ^'S ! Sl^l («! ii i«i
v/
H tf~\ d ccl s:;o°; -Xtoi ooi
3-!' ,d^
(X)
U1,
c
-i^r\7J N
? e
5 i5 11 I I
' i • ! -' ! "
.'. i L
N •N)
0
fs)
iSpSt-
r
M
N
JO
0
i --'
;Si ^T
LcJ.
TTJ<^ v-,i O 01 ft
•••Ol -.— i- ~{ w-.
A-21
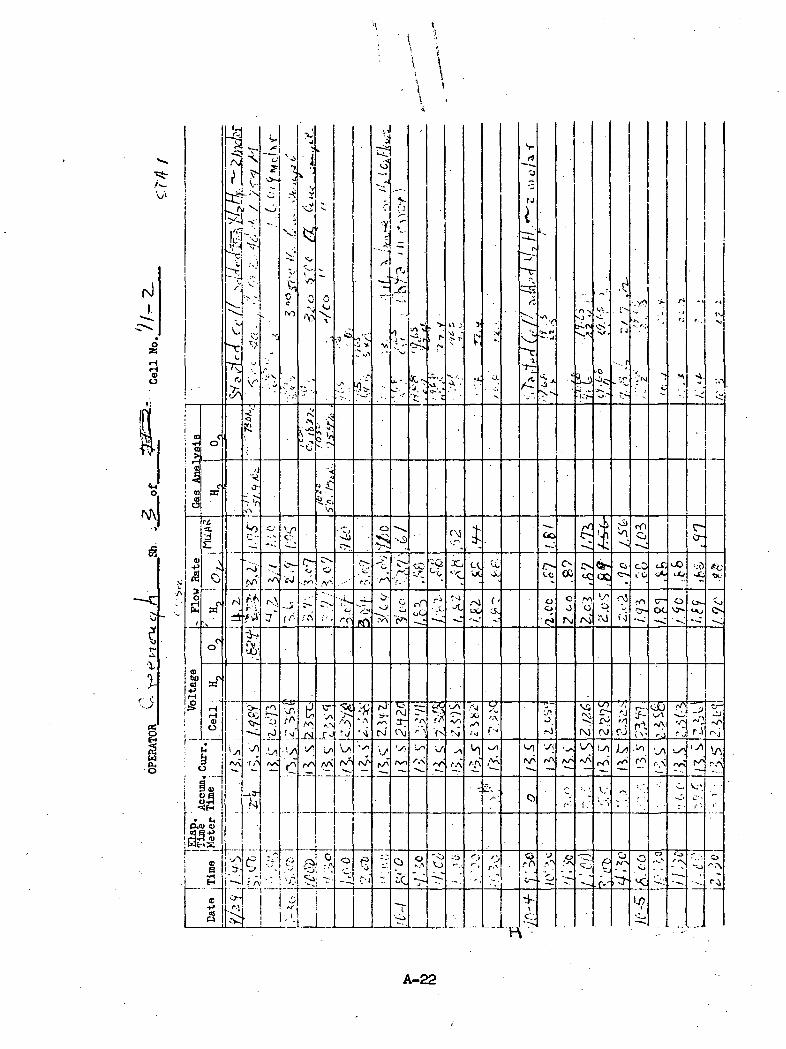
v ;
rJi.
o
i;
5:t;Nici 3
sT
-
•-J
>v
«HO.
f^\
8
I
JO SB
£
J
rft>
rOCj
Xr
cJ V.C < QQ t'O
t,O oO
oc
OJ
r! l-i
-.N'OS^JL^L
_.
r'XCD
'•ci CM "N -lr.i
•s•Si
!
• t,3<<U 0>1^-P
<D
f**4-^
(V r/SVrsr.-S
Civ.-
i-
I
a n jlL.
rA flO
H
A-22

o
01o
A
c
i oo vj
*x\/\
<= - •
55T
\ iv, ^
I 000)
V
..—.4...-4
?'?' -9^,0,,^
_.!._.
A-23

WATER ELECTROLYSIS DATA SHEET'
/ , . Cell Ho._
Date /-; . '••'<-\/7<' Operator /V-'.v Di i k. __ Sheet ^ of' / ~
Cell Description; Size </' (? (.'/]! ^"
Anode
Cathode C - Z- ^ > /•- V' / il! ? \ \ j * \ ( >rf/l ,.• (/c? .
Matrix
Aasembly_ ^ I // <(* f-
Electrolytec^O ;' x -*. / /
3 Yc '< O U.
Test Description;
n <1 / f V ^v r / <^ 5 T^ •? ^ /•; <?' ^^/ <~nn ec. f f// c c/. \/ $ ' <r ?.'/ /; (t c/g W; / />
Test Analysis;
Total Operating Time_
Reason for Stopping Test_
Remarks '
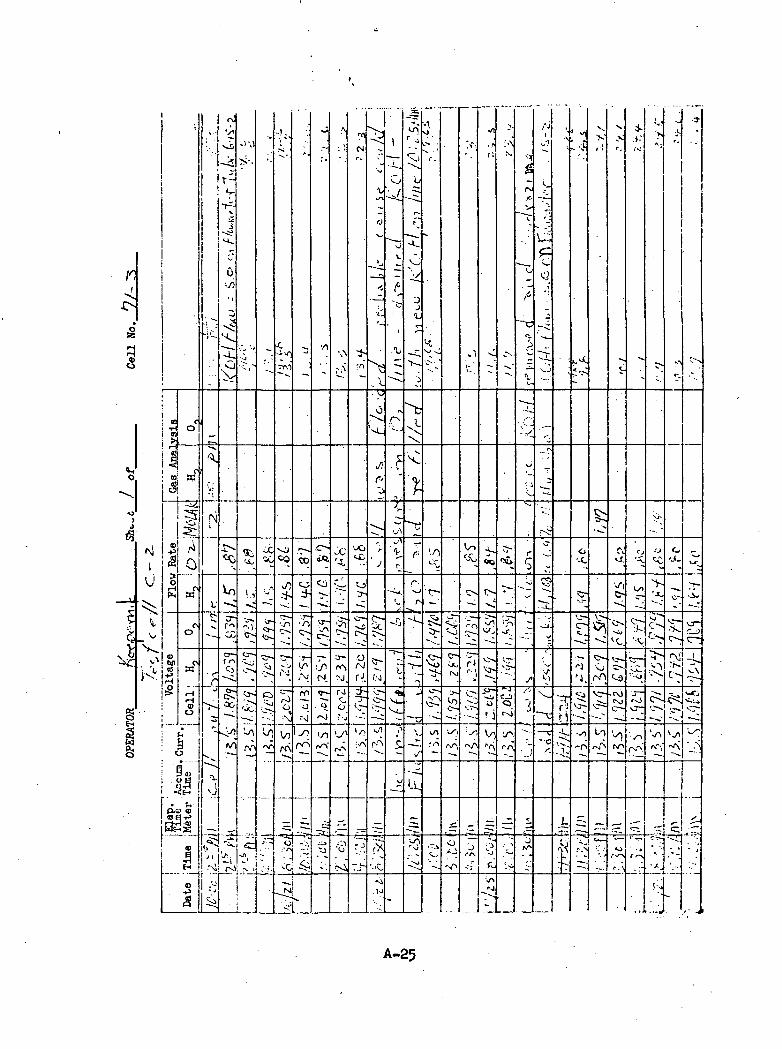
£
i
!t^
CM
S
!S-
£
J !U
N
a: vj
0 CO VI.
VoCi
-*to
Q-•-o
^l& ff\
0
i So); oi! "-H
p.i> a)os-p
H
0>
00c.
I/)
(.0i-
isV)
m_ |.....
,
r??•:q.r
O
^ ^>^4 ,.-
1
a.,J.

^
'-O
• 3 1 *! i,
-*£-«(H["• »•
P.O) 0)
i^g*; WE-«3£
i §
N
"
"A
•ftf
N
r^1 -T3il~tT-^' ® > ' S^i f^\l • •
i . ^
1^. _r— ., . .
.*-
o
-• t--
I
s
A-26

WATER ELECTROLYSIS DATA SHEET
Cell No. 7/- y
Date
Cell Description;
Anode
Operator 4; <: f/Vv I
C. Sheet / of
Size tf 0 C
Cathode_
Matrix
C- V
Assembly_
Electro lyte_ /•/
Test Description;
Teat Analysis;
Total Operating Time
Reason for Stopping Teat
Remarks _
5'fr
H c, J-(. TJ ne* ' '*• /
S f~* ' '—~£, / / /— rCOT i/<* Y s / £vi ^ r f^/ c / rn c t/ \J c c "^ f / j r o e \s & / f'^ fi &.
i '
A-27

t
£>-
^J '
FT!d
V; OJr W
i O!' I
i ">
>
fn
cJl
I
.O
X.
JVJ
I O
! D.U) u' *0 0 -^
i H
(S!
'••J
f i
(N
rsl
a
._4-_rJ+_ll
I
N
M
f-.'V
N
^
O
i K
oo-•>•
•^
•4-
c
\
•x.
K7^• I--o
•A i
C
I '•
A-28

WATER ELECTROLYSIS DATA SHEET .
Cell Mo. '//-S
/ / •'-> •' -7 / ' , U /Date /. / Y I' Operator ;:.; • •.. r mi f- Sheet ' of/ *- "*---
Cell Description; Size V& ^ M
Aiiod e/" -> -c -4 i /~ ~4-l -i
Cathod e V- ^> >— "X /•' (-• ?') Dtr> / / 7 A / (.. TOcyfe'-
Matrix // ^ ^ C^ . ' '•
Assembly_ S f *
Slectrolyte_
Test Description;
iZ •/'' - — ie ~f, c,
'-- c m) r •
Test Analysis;
Total Operating Time_
Reason for Stopping Test_
Remarks
A-29

•PID10
•3
S.
<*. <U
wc^o
A-30
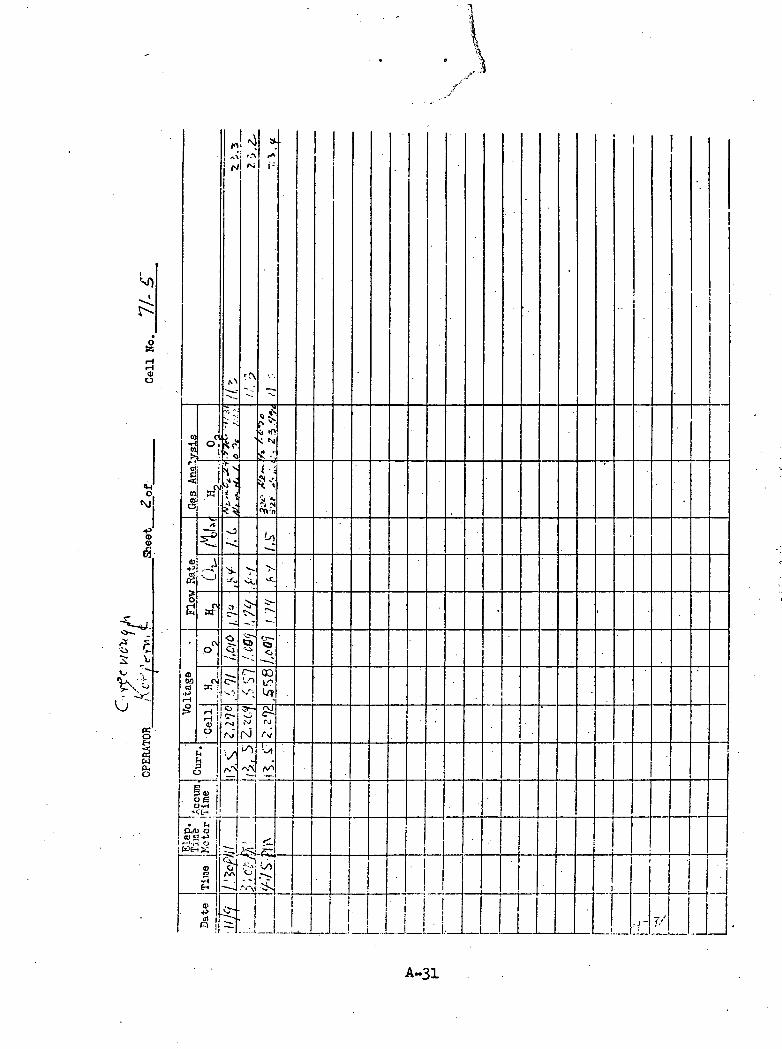
€ cS V
*l<o •
«
&
3
fVJ
i"i
af
(t -OC N
N
% N
on
. (HPMU 0rr
'•A
'-0
__l._JJ
I
f"_! .
A-31

\\\
FEEDING PAGE BLAkc NeT ^MED
SYSTEM TEST DATA
The following section presents the log sheets of the five system tests which
were run in this program* A description appears in Section 2.5 of the text.
A-33


Lu
iLU
VI
LJ
A-35
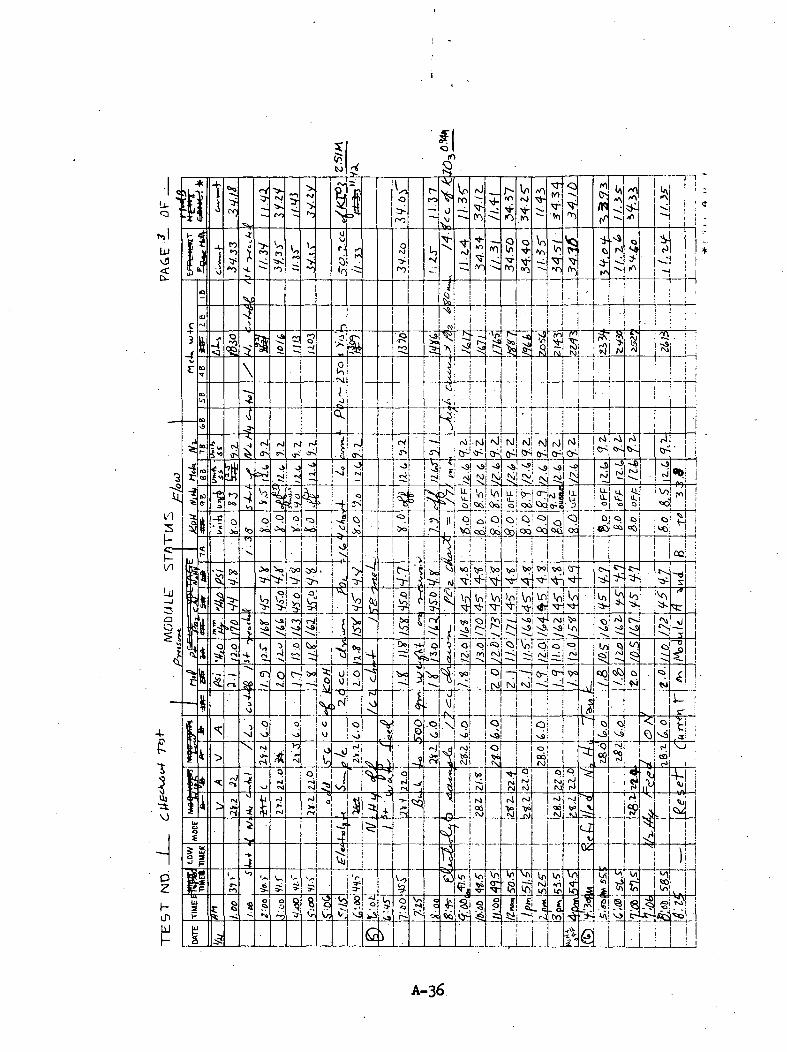
A-36

f
A-37

LLd
)Ljj
I
0nn
M
"0
1
t]S
•4
(0
lA
In
o
T^
o. •OK
M N rJ
-4- {JIf! ffl
c-
IT.4:
LU
O^
\V
Vo O Ott
K bo
IN)
tsjj MuO
N
'-0'
Kin
Nl
C
vi-icd
flL
lZ3!:««ggfc!es|z o<
C
Q
Ld
IItu p
VD U•A
Yi NTa
A-38

m ^
5*
CN
n
xjl
K>
^~*
v
xS|x5
O
"3
•n
"0
r-
Vo
4-
N x3^ O-
M
N
M
fS\ff\
N| «j| '
Ml M N
-3
CO 00
3£o
xtl
U.
<50 jj
cr-l0^' s
rJ ri
o|
o o
SY
ST
EIA
S
TA
TU
S
rsl Q o
«H t>- Ox <ao
^T
«~- Q^
O >r*l ;
cr,r
Vn Vn Vn bP N-A
M xS x^
Q|.rx CSJ
xO x»
xfi Vv
vs
^C)
-2ho
id
•N
Oi oM:MMi ro
« >
dl.
Ld
HY
DN
OU
TP
UT
ME
TtR
\o|Vx»
v> No Vn10
Cx
3>-
A-39

Lu
<->£
v*
(ft
r*(N)
n CO
>^
n
\0
IN) M
vS
rs
NS CN.V^va
cvj (0NT- <Ktj
1
ro (Nl
o-
fj NJ IN.N3 t;
00
\~!K QQ »-^ SL
^
Ifl
<««o
Jo •N)
vC (S 3saIN)
Ni PO
Wto en
UJ
^^0
fr-1^
•Ntl
Vi Vo sol '
IN) is) vS
N1
Vn 'o vn
oQ
CN
i(3
U
5 sw F
Vn Vn V!
l~~ «o
3 CQ 8NO
A-IK>

LLQ
*tLuv3£ Q
I/]
(NJ N M
rO
1f
N
N)
po,
IT,
U
<t Aj
l! !M
l/l^o
—^ 3Q
r^^^
So
(Si
N •vl
Nl
Qo^O
N
\n
I£UJh-vy>
C^
i-
**>.
s-
V,
vi
•»c
o Vn
ft
(V)
xj
«Jvn
•P
Upi t-tjSS
oT2!efilU (-
V) •VnT^
^P.

3"I -r~-
wjis^jl£ r. i <*! I
v. in|f: \ HO I
sV)
N (VI
N;
00
4
1 Oi*J
QCo 4T (A
rHs * ., QcO
Li.l L V) V)5s OS
.
%
/xl o-
'CO
1U.
^
ft \ slre aii^ o2
ro
o
i/lUJ
o- Uj
5 im H
u
f=
I
.8 Pr
T

oMl-U
.\n
iLUh-
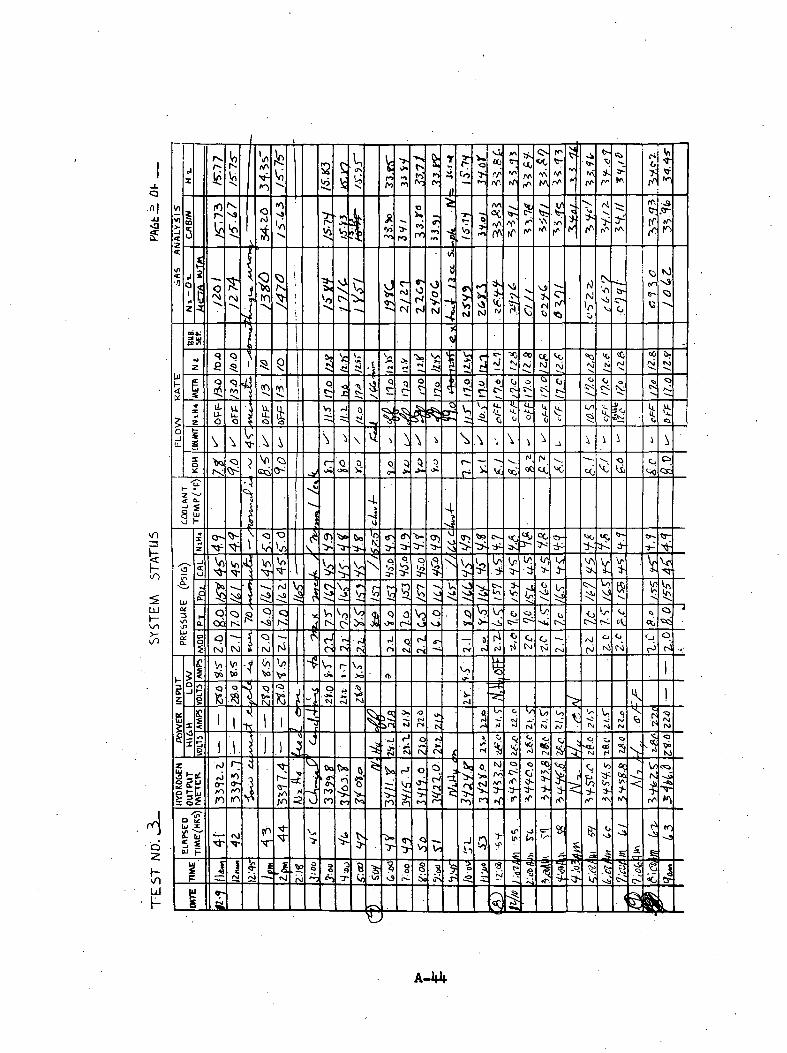
ffa*.
fOrO
J ~» ro
.0-ff'
JlNJ N
VJl
<if<B-
COW!
1
M
ss IVi
\
OK •*, Qc
•4.
LUHWn
3-
3 >sj-^u k Vo
[NJ (N
V? -^?
^
^Oot»
OU
TM
E
l^=Jt
M t-5?^
W)<«a(X
n
Vi
^•i
\nLJ
Vf
• ^r^««

Ts'o
COo,$»
-vO
ffIn
$(
\0 r> L
\n»fb.
N
N;rVn S
o^o^~ ^o- ^
ro
obo;SulCO VI
4 £N>V Q^
in If)
t
\ \ \06 OQ CO (X W> tx
Ocx=| o^loo N;
HO
OLA
NT
TE
MP
^-
1
iUJ
UN O- 0-
Vo
(o fc
t\ KJ
(0
i SJ
Oc
HYDR
OGO
UTP
UT
ME
TE
R
l>2 00
ir (VNa
(
Elf
tPSt
DTI
WE^
HK
OoV, r- DO cxsvX Oo
VIU
tf)
-~3 r~OQ O=| ° ^
.

N
V)
\n•*•>*.
ff]
ff)
cba.coin
ro <Jo
Jj
1C fi
tw
CO
OL
AN
T
TE
MP
^'
LUHx/1
1/1
UJ
i>- o~ «r 51
V)•7-
Vi
LJ3
Ui
O
idv>V
N
3 s£
ROG
PUO
UT
ME
Lfi
PSt
TIW
E
m (V
o o~
r-
CT|
rO
N
1
A-46

SL..
GO ts tsVl
o P
\
LU•h-v/i
vi00
ftN
vS (A iVi c
m
'Ss
^v/1
'«•&•5 I
j8 .SJSCL
•i h^

Vr-
t- •
5 I8 •"
iUJ
>-
cK^^
•<=>£r-
•s *<> c O
s~
^t^
N H 1
(rU
-Ja i:in =
S sw (-Ui
tXJ
A-U8
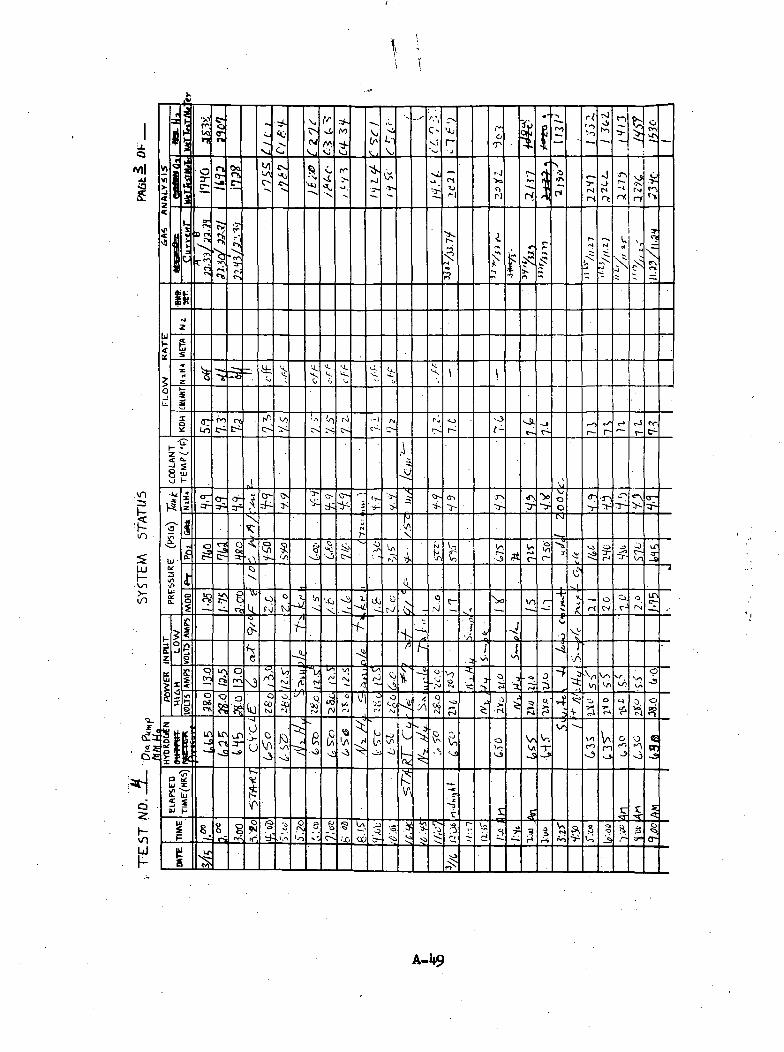
\ i
Q
Ml
f
<vf|/v>
TET rv)-I—r
r-jn
it
Lo C- f-<Y-
cS-
CO
OLA
NT
TE
MP
^'F
)
vn
1Lu
•ijn
ID
y °7 c- <T-3-\
34
s.
1J
-«>
Jl
\3
Skj00
HKwi
P
, V. V
TZ
rt

Ctt
*,
n> n r-y or rj
K;
•=0
N
1: at
tvRok^J.'vi
H^OMk
£•*
§W
Q
t 0.
S Sa tuo t-
^cr
3
fo
0 o•7-
y
7H C-oIn fi
c Vo 4 In
<;
• &%•
iss
(PJa
A-50

I-
-fc
LUI-vo
55
IIC
OO
LAN
T
TE
MP
^'
g; ff-
Or
O
4
vn
A-51
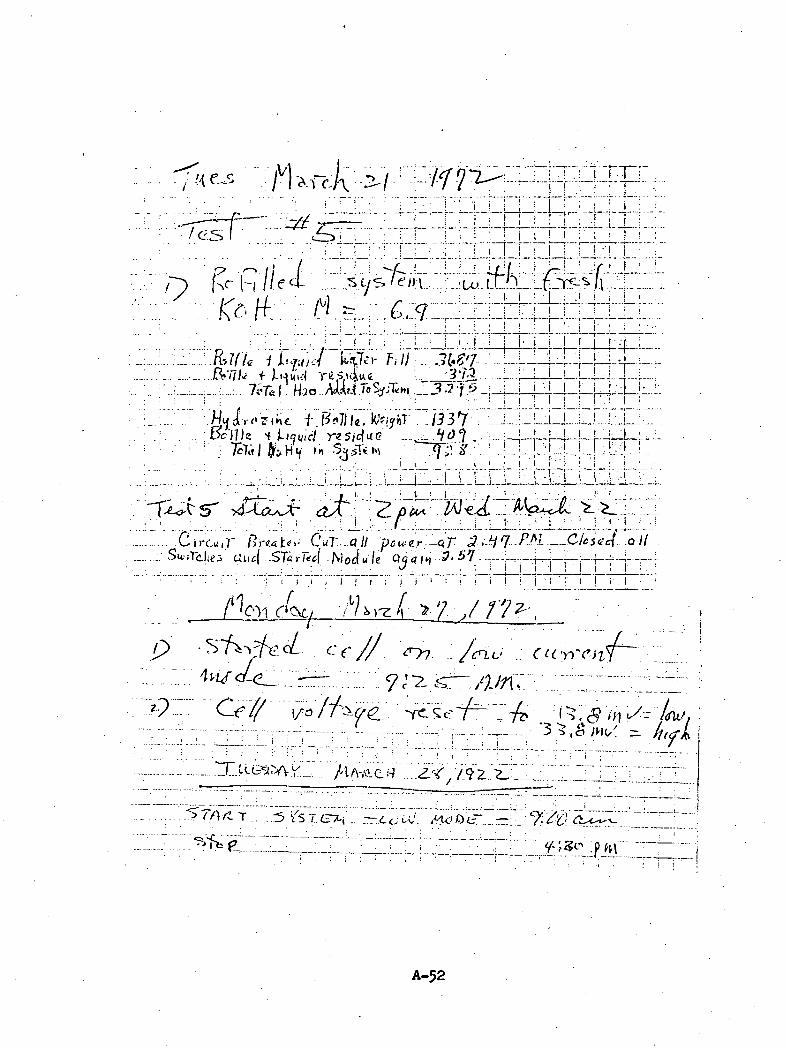
n~7TTTTVT
f
p.
A-52

y sf
I
^^. /A'.
A-53

— vn
7
7
A-54

7;
V /ie-z
p .
./ lJo7 A A pr i / / 7,
i'CV o * <,/"
A-55

/in LL,
Oi/
* • ! , - -
- 0
17, v-^ 7
'
-./ /^ ' / ^ o//>v/-/ ".til- eji<fi£om1 .5 cc-h J,f<,c,'
~ ..Wt-
G
A-56

/c.tH~t-
c
. o.6-./
2- ^ > 7 C :'2- 'jsi-F^i. i^mtr s~<-^ ;t /or . \/ : •...&f*rT ^.^asT>^ /,f2W»rV.
, i:Ip;..~:::rir,::: V^
i:i:.:i:;":.'.'zirrv.' Vc.
n-. "V& s.y £/<? •> v- ^'ft. f )\ -~&JJf J'3 « / • •*« . ' -Yit r>i e d piti (<~- i
wt i y <• </ L o if-fi , (^ O fI < M 5. cy fv hi « <3 if r/-wI X /w ^ C"/C - - -:- -.—L -•._,_,._.- -/..
A-57

r)
V
Onbutb
I:
n
cc -
A-58

.:.. _s.n// " u
r1 .-wi* r <~n ~~ce /A"-
• • • • / • •Z_//?"7?
f.)
V)
fif
ti-SC(T'^iivic*r'-v (?U"VH(P .oP^t'^a
ts
) " > { / ' '
0
0 . '-<,— .u
4
A-59

f € S ^ K
O /c .'
-s 01
A-60

PROTOTYPE HEAT EXCHANGER DEVELOIMENT
The following section presents the raw data taken during testing of the heat
exchanger. A discussion of the results of this test appears in Section 2.3 of
the text.
A-6l

/• r
V,
?.h
III 'J VX- V
'•I -i VO ^. . '< . '» V; >L.-» '.'. * ^ ^ .* '
?'
I J
-
*S 4- S '£!.? -^N£ ?S>-$5 i-S.^-v;^ :^
_- o ^- r-^ -a n_ N ^ ^ ^f-~vyT-"v 'A oj v: o-^ **: • *". . 1A ^—' — c! ^ ^ ^" -r V ttT ^ ^ - <S. «^- -^ <^ <. NV- «". ^ 'r> *-~: '-vv "->•f- r> t>- [^ N ^ f? N. »A .\j 'vi vi <a r^ V5 vj) vi ^ ^ \.i (f, \j, VS)
V>- Q
,<~(x- '0- Q
/ .
\n- ^ ^- >: - ^ «<r^ '^. ^ <J- '+ ^'""A v ^
_/**^ "' ^'^ "^^ '^ j v%i ^^-3
K :\ ca C^f
xi : '••$
^ ^ u tr
• i
-o
l/i'oLI
>is- |r ••' — ^i >. - . • -«* '-I j - . _ -• >^ • *.
t-.rv_i...«.v. r- i^- '-o .r^__Tv. '* j^": ^ ^ ^3 (s.
... J.. r..'
i ^ ; c! "
"*£
A-62


![Freestanding graphene/MnO2 cathodes for Li-ion batteries · the development of high capacity anode electrodes, such as SnO2 [2], Sn-Ni [3], and Si [4], the performance of cathodes](https://img.pdfslide.us/doc/110x75/5f03ad1e7e708231d40a393b/freestanding-graphenemno2-cathodes-for-li-ion-batteries-the-development-of-high.jpg)