Embed Size (px)
Citation preview
The development of a multidimensional scale to evaluate motor
vehicle dynamic qualities
Don Harris*, Jamie Chan-Pensley and Shona McGarry
Human Factors Group
Cranfield University
Cranfield
Bedford MK43 0AL
United Kingdom
* Author for correspondence
Tel: +44 (0)1234 750111 ext. 5196
Fax: +44 (0)1234 750192
E-mail: [email protected]
1
The development of a multidimensional scale to evaluate motor
vehicle dynamic qualities
Abstract
Advances in motor vehicle engineering will allow greater refinement of the dynamic
qualities of passenger cars in the near future. This paper describes the development
and initial validation of a reliable and valid multidimensional scale to assess these
parameters based upon a technique previously developed to evaluate aircraft handling
qualities. The scaling methodology developed emphasizes the interaction between the
vehicle’s dynamic behaviour and the category of vehicle (e.g. sports car, executive
saloon). This three-part study describes the initial extraction and the subsequent
verification of the scale dimensions from an analysis of the opinions of circa 500
drivers, followed by an evaluation of the sensitivity and diagnosticity of the scale to
distinguish between the road behaviour exhibited by vehicle types. The results
suggest that the scale shows both content and construct validity, being able to
distinguish both between broad categories of vehicle and different models of vehicle
within a particular category in a consistent and meaningful manner.
2
1. Introduction
Modern technology has given the automotive engineer many more options from
which to choose when optimizing the ride/handling qualities compromise of the
modern motor vehicle. With the advent of increased computerization in road cars and
suspension systems that are not dependent upon traditional steel springs (e.g. by using
fast acting pneumatic or hydraulic systems) there will be even more ways available to
refine their behaviour. To a limited extent, this is already happening in many ‘top of
the range’ executive and sports cars where drivers are given the option to select one of
a number of pre-defined damper settings reflecting their preference for a sporting or
comfort-oriented ride. More advanced systems becoming available also allow the
driver an element of control over the vehicle’s anti-roll bars, allowing them to decide
upon the degree of roll exhibited by the car when cornering. However, with the
introduction of computer-controlled hydro-pneumatic suspensions with no springs,
the effective spring rates; damping characteristics (both in bump and rebound); the
roll characteristics of the vehicle (including roll centre); and anti-dive and anti-squat
characteristics will all be able to be optimized through software changes.
Furthermore, with the introduction of ‘steer-by-wire’ systems (should changes in the
design and build regulations allow them), other characteristics of the driver-vehicle
interface will also be capable of being altered via simple changes to software settings,
for example steering gain and steering feel. The same will apply to other parameters,
such as throttle response, which may be altered to make a car feel more sporting or
more refined. In short, there is a potential revolution in the none-too distant future
concerning the manner in which the modern road car will ride and handle. Many of
3
the current compromises imposed by current passively-controlled mechanical systems
will no longer apply.
With such flexibility becoming available concerning the dynamic behaviour of future
vehicles, considerably more refined tools will be required to describe and evaluate the
behaviour of these cars. Ideally, these descriptions should also be couched in the
terms used by the end purchasers to describe their perceptions of their vehicle in
everyday use. However, such a metric is not currently available. At present, the
dynamic qualities of road vehicles tend to be evaluated by highly skilled test drivers
using either very simple unidimensional handing qualities scales (e.g. that developed
by the Society of Automotive Engineers 1985); by the qualitative comments of these
experienced test drivers, typically evaluating the ‘on-the-limit’ aspects of the
vehicle’s behaviour; or by the measurement of engineering parameters related to
parameters such as ride and handling. The unidimensional scales utilized have been
pragmatically developed to fulfil in-company requirements rather than having been
developed to produce psychometrically robust measures of ride and handling
qualities. Qualitative comments from experienced test drivers are essential in refining
a vehicle’s behaviour. However, the inability to derive and quantify trends when
using these scales as a result of their lack of diagnosticity, and inter-rater differences
in opinion and assessment technique when using unidimensional scales ultimately
limits their utility (see Field 1995, Harris 2000).
A directly analogous situation was faced by the aerospace industry several years ago
with the advent of ‘fly-by-wire’ (FBW) flight control systems. These FBW systems
allowed the control engineer more and simpler ways by which to refine the handling
4
qualities of aircraft compared to conventional technology mechanical flight control
systems. The rating scale most commonly used at this time was the Cooper-Harper
aircraft handling qualities rating scale (Cooper and Harper 1969). The Cooper-Harper
scale was a simple, unidimensional scale ranging from 1 ‘Excellent, highly desirable’
to 10 ‘major deficiencies: control will be lost…’. A fundamental problem with the
use of this scale though, was that the complexity of the aircraft’s behaviour was not
reflected in the dimensions of the scale (Payne and Harris 2000). In addition, the
Cooper-Harper scale did not describe the interaction between the aircraft’s dynamic
qualities and the nature of the task being undertaken. What may be desirable qualities
in one type of manoeuvre may not be so desirable in another type of manoeuvre (see
Harris et al. 1999, Harris 2000, Harris et al. 2000). Similar criticisms may also be
made of unidimensional scales to describe the handling qualities of motor vehicles.
What may be a desirable characteristic in one type of vehicle (e.g. a more softly
sprung, compliant ride in an executive car) may not be so desirable in another
category of vehicle (e.g. a sports car). Unidimensional scales do not take into account
the interaction between vehicle type, its dynamic road behaviour characteristics and
its intended market segment.
It has also been noted in the aviation industry that when using simple physical
measurements of an aircraft’s behaviour to evaluate handling qualities a misleading
impression may be gained (Harper and Cooper 1986). The engineer makes
judgements about the aircraft’s handling qualities from data derived from only a small
part of the total pilot/vehicle system; individual parameters are analysed largely in
isolation. Only the pilot can observe the complete, complex dynamic behaviour of the
aircraft. Thus, these qualities cannot be defined simply by engineering descriptions of
5
an aircraft’s response to a pilot’s control input. The authors concluded that it is
essential that any description or assessment of handling qualities must include the
pilot’s perceptions of the behaviour of the aircraft. The same applies of road vehicles.
The aim of vehicle performance, ride and handling evaluations is to assess if the
dynamic qualities of the vehicle are suitable for the purpose and the market intended.
To this end a vehicle is mostly evaluated by the subjective judgement of experienced
researchers (Sano 1982).
As alluded to earlier, handling qualities are complex and multidimensional, yet this is
not reflected in the scales to assess them. In the aviation domain, Payne and Harris
(2000) identified five dimensions of aircraft handling that proved to be stable and
could be easily related to the dynamic behaviour of the aircraft. These were
subsequently developed into a multidimensional scale to assess aircraft handling
qualities (the Cranfield Aircraft Handling Qualities Rating Scale – CAHQRS). This
scale, building upon concepts found in the NASA – TLX (National Aeronautics and
Space Administration - Task Load Index) workload scale (Hart and Staveland 1988)
also took into account the interaction between the aircraft’s handling qualities and the
task (Harris et al. 1999, Harris 2000, Harris et al. 2000). In unidimensional scales
(such as the Cooper-Harper scale and the vehicle handling qualities scale proposed by
SAE) any interaction of handling qualities and the task and/or context are
incorporated in the testing procedure rather than being a recorded, evaluated part of
the measurement instrument.
Trials using the CAHQRS showed it to have far greater test-re-test reliability than the
Cooper-Harper scale. Overall, the test re-test correlation for the full scale CAHQRS
6
was 0.95; for individual sub-scales the test re-test reliabilities ranged from 0.54 to
0.98 (Harris et al. 2000). In contrast the test re-test reliability for the Cooper-Harper
scale was in the region on 0.23 (Harris et al. 2000). This finding was in concordance
with the earlier work of Wilson and Riley (1989) and Field (1995) who also observed
that the Cooper-Harper Scale exhibited poor inter-pilot reliability and that often the
ratings provided did not tally with the opinions expressed on the pilots’ comment
cards. Furthermore, the CAHQRS also showed much greater diagnosticity. The
greater reliability of the CAHQRS was attributed to the scale’s format (and hence the
method by which ratings were elicited). By using a simple, unidimensional format,
firstly the Cooper-Harper scale implicitly requires the rater to form mentally a
composite score based on all the individual aspects of the aircraft’s handling. The
rater is then required to weight these components, relative to one another, with regard
to the requirements of the task being flown, before finally settling on a handling
qualities rating. Many implicit judgements and comparisons are required prior to
making the final rating, hence there is a great deal of scope for variability in several
aspects of the process that can contribute to the lack of reliability. The CAHQRS
makes this process explicit. Importance weightings for each of the components of
aircraft handling for a particular manoeuvre are made explicitly prior to performing
the task. The pilot is then required to make evaluations of five well-defined aspects of
the aircraft’s dynamic behaviour, irrespective of how important they are for the
manoeuvre undertaken. Greater reliability is obtained as a result of making more than
a single rating and also through the manner by which the various aspects of an
aircraft’s handling are combined to produce a rating, which is now through a
mechanical and explicit process. In contrast, when using the Cooper-Harper scale the
manner in which the various components of the way the aircraft’s behaviour are
7
combined is via subjective judgement and weighting to produce the final single score
which reflects a composite of several parameters.
Stanton and Young (1999a, 1999b) have criticized the development of many
ergonomics measures and methods for being neither psychometrically robust nor
reliable. Indeed, for many often used scales in Ergonomics, there is little (or no)
reliability or validity data quoted (for example, see the compendium of human
performance measures collated by Gawron 2000). Certainly all unidimensional
measures of handling qualities can be criticised, as there is no evidence that they
posses either construct or content validity. Using the guidelines from other areas in
psychology, for example personality theory or intelligence testing, the psychometric
properties of many measurement scales used in ergonomics fall well below the
acceptable norms for reliability, validity and measurement properties in general (for
example see Anastasi 1990 or Colle and Reid 1997).
For any scale of vehicle dynamic qualities to be useful (i.e. reliable, valid, diagnostic
and sensitive to differences in appropriate vehicle parameters) there is a fundamental
underlying assumption that drivers are sensitive to such aspects. This is, however,
evidence that this is the case. Brindle (1984, 1986), using a subjective rating scale,
demonstrated that drivers were sensitive to the differences between cross-ply and
radial tyres. Furthermore, in a series of ‘on the road’ studies he also showed that
drivers modified their driving behaviour in response to these tyre characteristics.
More recently Walker, Stanton and Young (2001) made similar observations showing
that drivers were sensitive to the dynamic characteristics of different categories of
vehicle.
8
This paper describes the development and initial validation of a multidimensional
scale to assess road vehicle dynamic qualities. The method is based largely on the
used to develop the CAHQRS. The objectives were to produce an instrument that
described the manner in which everyday car drivers assessed the qualities of their
vehicle (i.e. taking a user-centred/customer-focussed approach). As Ike Iaconelli,
Ford’s director of Global Test Operations observed ‘One of the biggest problems that
all manufacturers face is trying to replicate what happens in the real world, with real
drivers. Our test drivers, for example, are skilled drivers who know how to get the
best from a car and they cover more mileage than most. This of course, does not
make them representative of the typical Ford customer…’ (Testing Technology
International, 1998). The scale was required to have good content validity (i.e. its
components must encompass all the pertinent aspects of the domain to be assessed);
good construct reliability (i.e. the underlying constructs should be stable across
samples); and it should have satisfactory indications of construct validity. Campbell
(1960) suggested that an insight into construct validity could be gained via an
assessment of a scale’s convergent and discriminant validity. With regard to this
latter aspect the scale was required to be able to distinguish between vehicle types in a
reliable and consistent manner.
9
2. Overview of methodology
The method to develop the vehicle dynamics qualities rating scale progressed in three
distinct phases. Phase One was concerned with eliciting the basic dimensions of
vehicle ride, feel, performance and handling as described by a large sample of car
drivers. Phase Two essentially replicated Phase One in a further independent sample
to ensure that the descriptions previously elicited were stable (i.e. the dimensions had
construct validity). Phase Three transformed dimensions elicited into a rating scale to
assess the dynamic qualities of road vehicles and evaluated the scale’s sensitivity and
discriminant validity (i.e. its ability to discriminate between categories and types of
vehicle in a meaningful manner).
10
3. Phase one
3.1 Initial elicitation of dimensions
Approximately 400 adjectives to describe the dynamic qualities of passenger cars
were collected from road tests published in the popular motoring press (e.g. Autocar).
From these adjectives, the 52 most frequently used were identified and then paired
with a word of diametrically opposite meaning to form a series of bi-polar adjective
pairs. When constructing these bi-polar pairs it was always ensured that not only
were the words antonyms of each other but also that there was one desirable and one
undesirable pole. These bi-polar adjective pairs were then presented to 50
participants. These were recruited on an ad hoc basis but to be eligible they had to be
in possession of a full UK driving licence. The participants were asked to evaluate
the meaningfulness of these bi-polar adjective pairs to describe the performance, feel,
ride and handling qualities of a motor vehicle.
Initial qualitative analysis indicated that respondents had some difficulty in separating
haptic feedback (such as steering ‘feel’) from the actual performance, handling and
ride qualities of their vehicle. As it was desired to produce a customer-centred
description of a vehicle’s dynamic qualities and the aim was to produce a scale with
high content validity it was decided to retain these items. For any scale with
psychometric properties to have content validity, the items in it must evaluate all
major aspects of the domain to be assessed which requires a systematic assessment of
that domain at the outset of the scale’s development (Anastasi 1990).

11
After the initial parsing of the adjectives to identify the most applicable descriptions
of vehicle road behaviour, the remaining 33 pairs were made into a short self-
completion questionnaire. The order that the adjectival pairs were presented on the
instrument was randomized. Each item used a 1-5, tick-box rating scale to indicate, in
the opinion of the person completing the questionnaire, which adjective pole they
agreed with most and to what degree. In approximately half of the cases the desirable
pole was presented first and vice versa. Brief demographic details of the respondent
(age, sex and number of years that they had held a full driving licence) and details of
their motor vehicle(s) were also collected.
These questionnaires were distributed to UK motorists personally by one of the
researchers in the car parks at a large UK sporting event. They were given a pack
containing a covering letter about the aims and objectives of the study; instructions
for completing the questionnaire and a FREEPOST envelope for its return. The
respondents were asked them to assess the ride and handling qualities of the vehicle
that they used most frequently. In total 300 questionnaires were distributed.
3.2 Analysis of responses
Two hundred and twenty-three completed survey instruments were returned,
representing a 78% response rate. Of these 181 (81.2%) were from male drivers and
42 (18.8%) from females. The age range of respondents was from 17 to 65 years
(with a mean of 35.8 and standard deviation of 10.8 years) and the mean number of
years of driving experience was 17.3 with a standard deviation of 10.5. Five distinct
categories of vehicle were represented in the sample as a whole, including 25.0%
12
small cars (<4.00m); 44.4% medium cars (4.01 – 5.00m); 22.2% large, executive cars
(>5.01m); 2.8% off-road (four-wheel drive) vehicles, and the remaining 5.6% were
classified as either sporting coupes or roadsters.
Prior to analysis the data were transformed (as appropriate) so that in all cases a high
score represented a desirable dynamic quality of the vehicle. The data were then
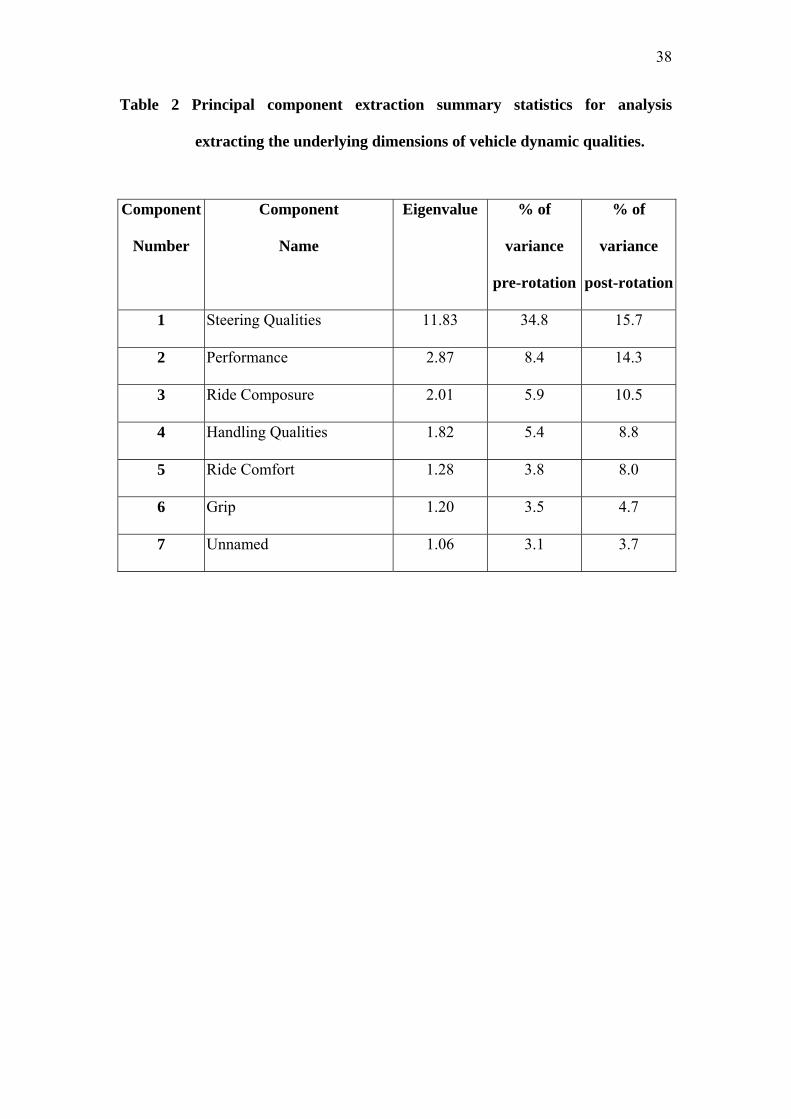
subject to principal components analysis (PCA) using SPSS (version 9.00). From the
PCA seven components were extracted accounting for 65% of the total variance in the
sample. Kaiser’s criterion (components with an Eigenvalue in excess of unity) was
used to determine the maximum number of components extracted. These components
were subject to a Varimax rotation to produce a ‘cleaner’, more interpretable solution.
For an item to be deemed to load onto one of the extracted components it was
required to have a loading in excess of 0.45 (significant p<0.01 – see Hair et al.
1998). Items loading onto two (or more) components were excluded from the final
solution.
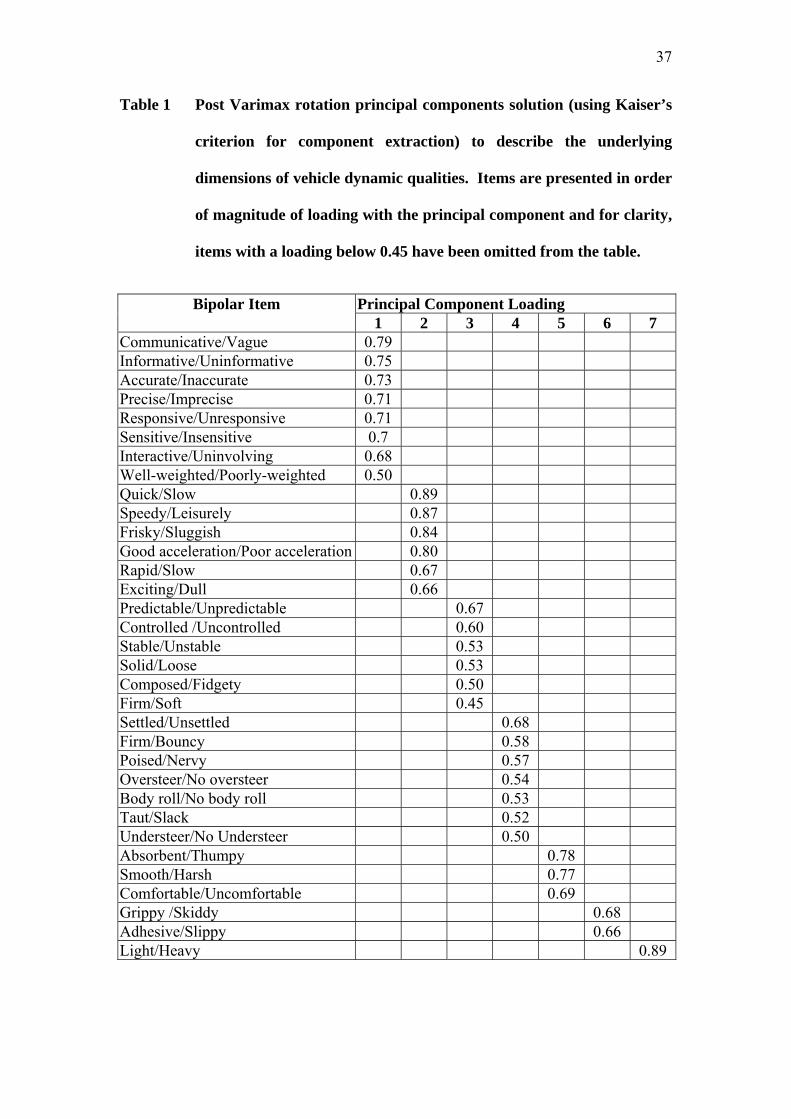
The final, post rotation principal components solution is described in table 1 along
with its associated summary statistics in table 2. As can be seen, the principal
components extracted largely distinct and recognizable descriptions of the ride,
handling and steering qualities of motor vehicles.
INSERT TABLES 1 AND 2 ABOUT HERE
The components extracted were then subject to an examination of their internal
consistency (reliability). Component 1 (‘Steering Qualities’) had a Cronbach’s alpha
13
of 0.91. Component 2 (‘Performance’) initially also had an alpha value of 0.91,
however two items (‘Rapid/Slow’ and ‘Exciting/Dull’) actually were detrimental to
the overall internal consistency of this component. Once these were removed, the
alpha value was elevated to 0.95. Removal of these items also resulted in a more
coherent and parsimonious dimension, in terms of its constituent components.
Analysis of the internal consistency of ‘Ride Composure’ (component 3) resulted in a
Cronbach’s alpha of 0.80 and component 4 (‘Handling Qualities’) had a
corresponding value of 0.78. The final two dimensions (component 5 ‘Ride Comfort’
and component 6 ‘Grip’) had Cronbach’s alpha values of 0.77 and 0.83, respectively.
All the values for Cronbach’s produced were well over the minimum acceptable level
of 0.7 for scale internal reliability as suggested by Cronbach (1951) and Robinson et
al. (1991). As final component extracted in the initial analysis was composed of only
a single item, this dimension was not used in the following verification stage, as
single item components are inherently unreliable.
14
4. Phase two
4.1 Verification of dimensions
The objective of the second phase was to cross-validate the latent structure underlying
vehicle dynamic qualities elicited in the PCA in Phase One in an independent sample
to assess its stability, reliability (internal consistency) and construct validity. Only if
these factors were satisfactory would the items elicited in Phase One be suitable for
forming the basis of a psychometrically robust, multidimensional vehicle dynamic
qualities rating scale.
All the items describing each of the six dimensions that remained after the analysis of
the components internal consistency (see table 1) were formed into a second
questionnaire using an identical response format to that described previously. The
same demographic and vehicle data as before were also collected.
This second, self-completion questionnaire was distributed to 1,000 drivers, however
in this case the categories of vehicle identified in the previous results section were
specifically targeted to ensure that the cross validation sample was of a similar
composition to the previous sample. Questionnaires were distributed to drivers in
public car parks to aid in this respect.
As before, completed survey instruments were returned to the researchers using the
FREEPOST envelope included in the questionnaire distribution pack.
15
4.2 Analysis of responses
Of the 1,000 questionnaires distributed, 224 (22.4%) questionnaires were returned in
time for analysis, comprised of 146 (65.2%) from male drivers and 78 (34.8%) from
female drivers. The age range of respondents was from 18 to 68 years (with a mean
of 41.7 years). The final sample of vehicles was composed of 22.3% small cars;
37.5% medium cars; 27.7% large cars and 12.5% sporting coupes and roadsters.
Prior to analysis, the data were treated in exactly the same manner as that described at
the beginning of the previous results section. The data were then subject to a
confirmatory factor analysis (CFA) using AMOS 4.1. A maximum likelihood method
was selected for factor extraction. The hypothesized factor structure against which
the data in Phase Two were compared was that derived in the PCA in Phase One.
An initial CFA was only a moderately good fit to the hypothesized structure of road
vehicle dynamic qualities elicited in Phase One (χ2 minimum = 753.68; df = 362;
p<0.001: adjusted χ2 = 2.08: GFI – ‘goodness of fit index’ = 0.81: AGFI –‘adjusted
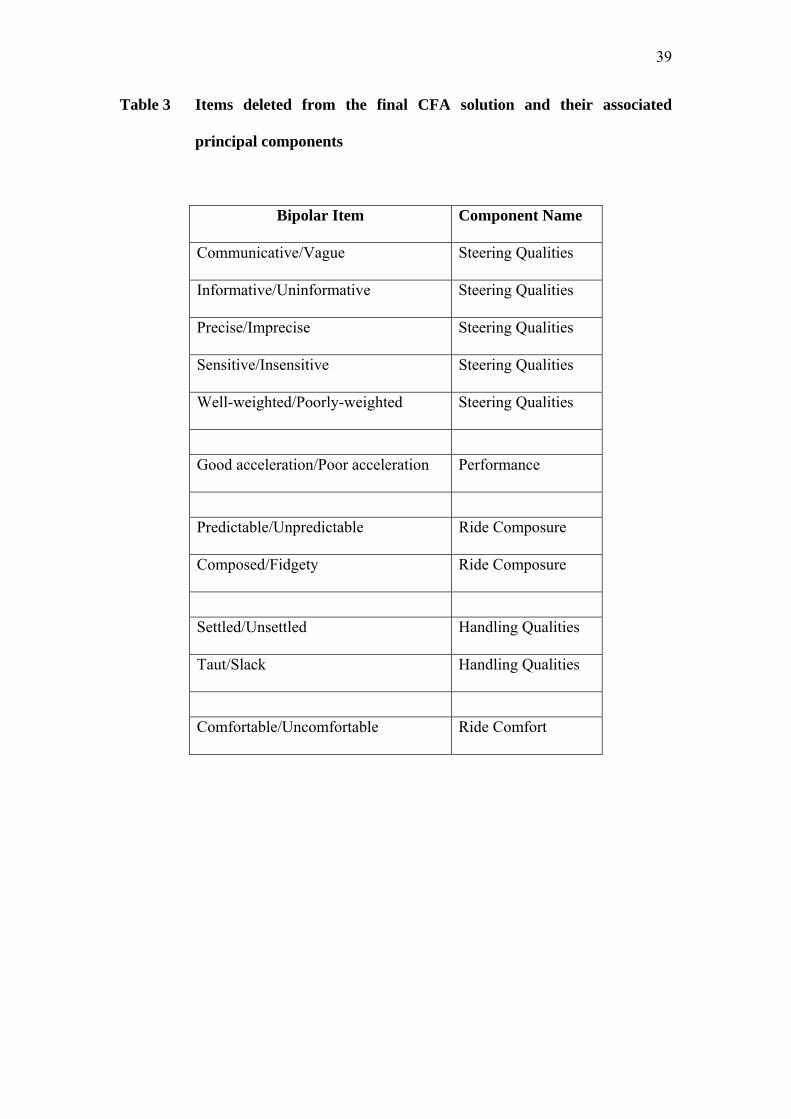
goodness of fit index = 0.77). However, the deletion of several items (listed in table
3) on the basis of the computed modification indices (the likely reduction in the
overall χ2 goodness-of-fit value) produced a slightly modified model of indicator
variables loading onto latent factors which produced a model with an extremely good
fit to the hypothesized latent structure of vehicle behaviour (χ2 minimum = 150.97;
df=120; p<0.03: adjusted χ2 = 1.26: GFI – ‘goodness of fit index’ = 0.93: AGFI –
‘adjusted goodness of fit index = 0.90). All these values are well in excess of those
suggested by Hair et al. (1998) as being indicative of an acceptable CFA solution. It
16
is likely that in the initial extraction of components (described in Phase One and in
tables 1 and 2) certain variables loading onto a component were included as a result of
capitalizing on chance associations within the data set rather than as a result of
reflecting the true underlying dimensions of vehicle dynamic qualities. As a result,
these variables are highly likely to be eliminated in the cross-validation phase. It is
also noticeable that the majority of variables deleted were from the larger components
in the initial PCA. This may suggest that these components were what Cronbach
(1951) has termed a ‘bloated specific’ (i.e. a highly specific description of a very
narrow underlying construct). This was not reflected in the second administration of
the scale which used a slightly smaller sub-set of items (see discussion in section 3.2 –
Analysis of responses). The final model also served to increase the parsimony of the
solution and enhance the interpretability of the factors produced. The final factor
structure from the CFA is described in figure 1 and the inter-correlations between the
latent variables are contained in table 4.
INSERT TABLE 3 AND FIGURE 1 ABOUT HERE
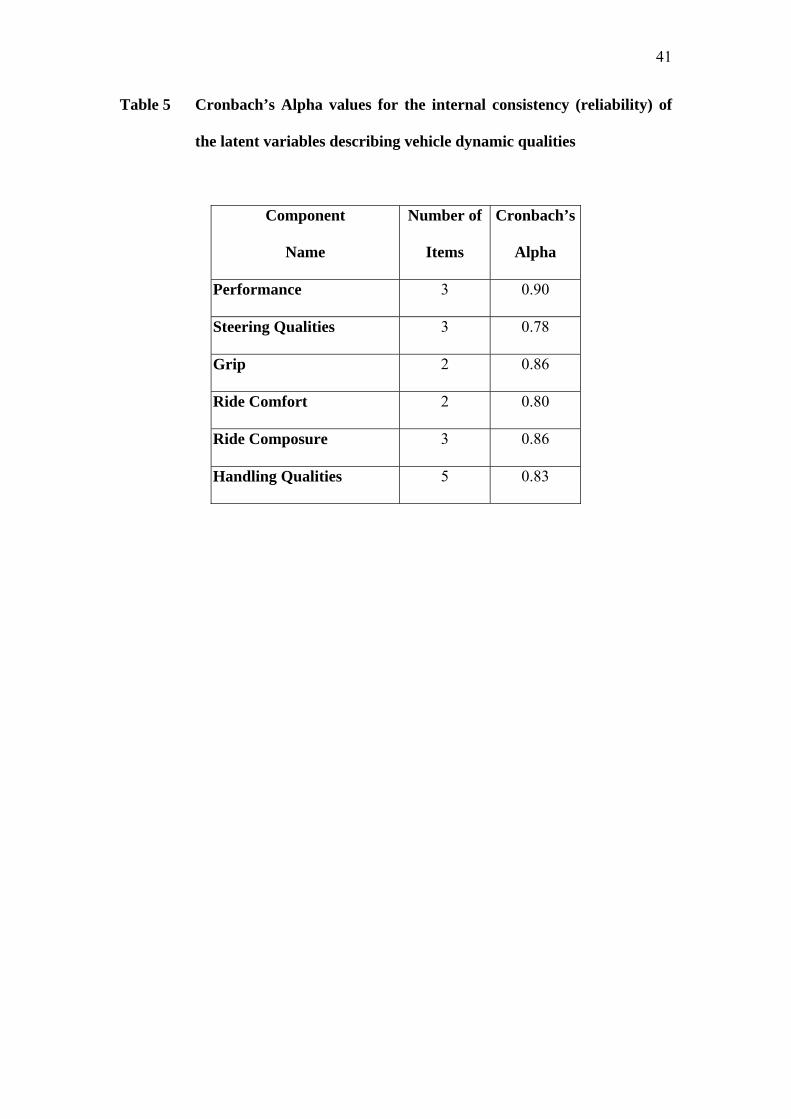
As it was proposed to use the items from each of the latent variables in the CFA to
form the basis of a scale for constructing a multidimensional vehicle dynamic
qualities rating scale, the internal consistency of these factors was again assessed to
ensure that the items were all good indicators of the same underlying construct. The
results of this analysis using Cronbachs’ Alpha can be found in table 5. Once again it
can be seen that all the values for Cronbach’s Alpha were well over the minimum
acceptable level suggested by Cronbach (1951) and Robinson et al. (1991) of 0.70 for
internal consistency.
17
INSERT TABLES 4 AND 5 ABOUT HERE
4.3 Discussion of results
The results from the CFA performed on the data from the independent, cross-
validation sample suggest that the dimensions of vehicle dynamic qualities elicited are
stable, replicable and thus have construct validity. The manner by which the items
were originally selected for inclusion in the study in Phase One should also ensure
their content validity. The Cronbachs’ Alpha statistics computed for each dimension
would also suggest that the dimensions are internally consistent (reliable).
Although the cross-validation of dimensions in the CFA has resulted in some high
inter-correlations amongst the factors, this is to be expected as structural equation
modelling makes no attempt to produce orthogonal factors (cf. the Varimax rotation
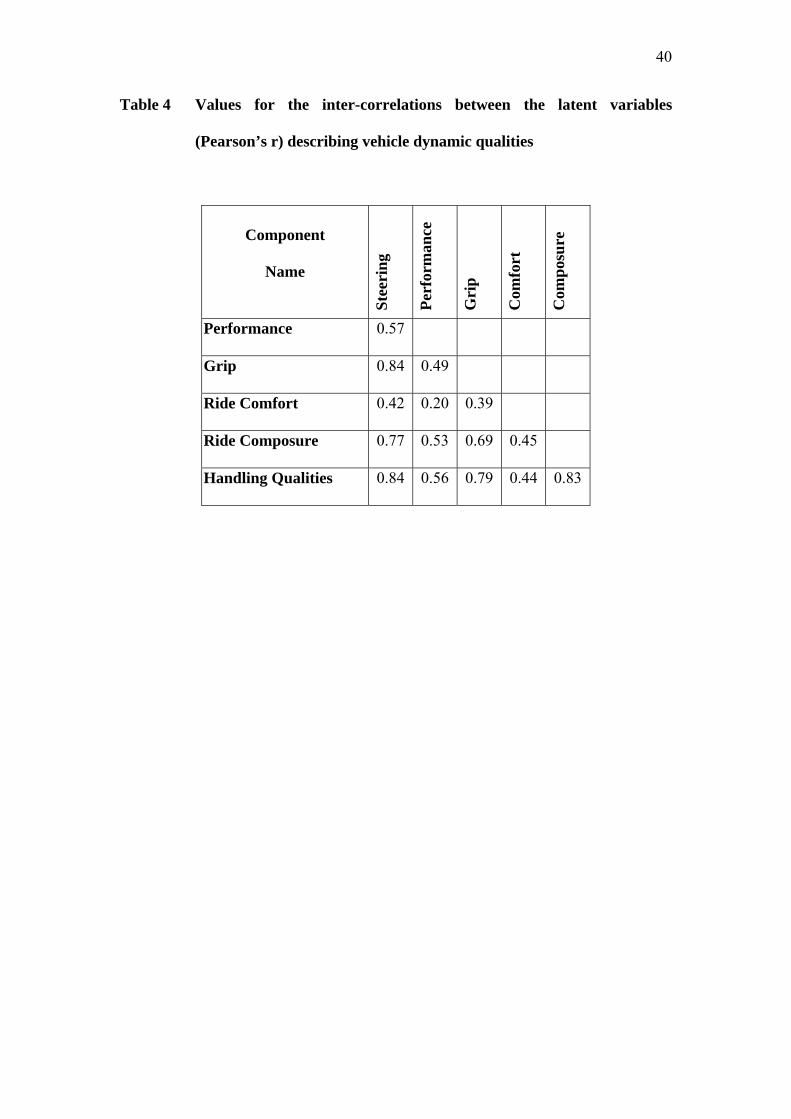
used in Phase One). Inspection of the inter-correlations between the dimensions,
however, does suggest that drivers can distinguish between various aspects of their
vehicles dynamic behaviour and make separate evaluations of them. For example, the
majority of the correlations involving the dimensions of Ride Comfort and
Performance are all relatively small (see table 4). However, the correlations between
Steering Qualities and both Grip and Handling Qualities are high, suggesting that
drivers regard these dimensions as being highly inter-related in everyday driving.
On the basis of these results a multidimensional road vehicle dynamic qualities rating
scale was constructed using similar concepts to those found in the NASA-TLX mental

18
workload scale (Hart and Staveland 1988) and the CAHQRS multidimensional
aircraft handling qualities rating scale (Harris et al. 2000).
19
5. Phase three
5.1 Scale construction and data collection
There were two basic components to the construction of the rating scale, the scale
evaluating each component of vehicle dynamic behaviour for its adequacy and a
further component that rated the importance of each of these aspects with respect to
the role/category of the vehicle (q.v. the weighting index of the NASA-TLX or the
criticality index of the CAHQRS).
The rating aspect of the scale was constructed simply from a mean of the ratings on
all the components making up each sub-scale (as derived from the final CFA) once
the items had been transformed to ensure that a high rating represented a desirable
ride or handling quality (exactly as the data were treated in Phases One and Two).
The ratings aspect of the scale was presented in the exactly same manner as
previously described.
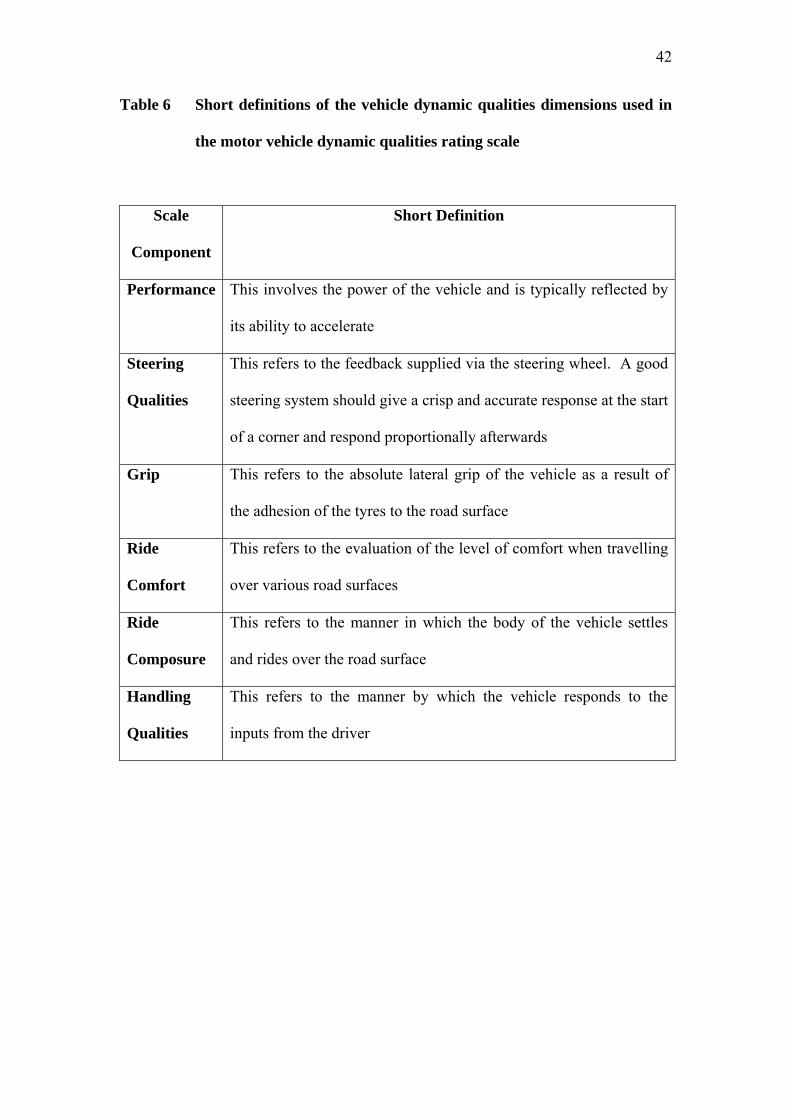
After completing the rating scales respondents were also required to rank the
importance of each dimension of the vehicle’s dynamic qualities with respect to the
category of the vehicle being rated. The importance scale was comprised of a ranking
from one (most important) to six (least important). Short definitions of the vehicle
dynamic qualities dimensions can be found in table 6.
INSERT TABLE 6 ABOUT HERE
20
To test the sensitivity and predictive validity of the scale it was administered to
drivers of 49 ‘superminis’ (e.g. Ford Fiesta and Peugot 206); 48 small hatchbacks
(e.g. Ford Focus and Volkswagen Golf); 33 medium-sized cars (e.g. Ford Mondeo
and Vauxhall/Opel Vectra); 61 small executive cars (e.g. Audi A4 and Mercedes-
Benz C-Class) and 22 small, sporting coupes (e.g. Ford Puma and Renault Megané
Coupe). To target the drivers of the specific vehicle types required for the study,
drivers were approached directly in the car parks of a major UK shopping centre as
they were returning to their vehicles. Within each of these sub-samples it was
ensured that there was a reasonably large sample of al least two models, including the
class-leading vehicle (as defined in Autocar magazine) at the time of the study.
5.2 Treatment of data and scale scoring
For the sake of consistency and to aid interpretation, the scale score data were
reversed so that a low score represented a desirable dynamic characteristic (i.e. scores
were presented in the same fashion a the Cooper-Harper scale and other scales using
this format, such as the Bedford Scale by Roscoe 1984 and the Haworth-Newman
Display Readability Scale, see Newman and Greeley 2001). The ranking data
reflecting the importance of each of the dimensions for a particular category of
vehicle was left unchanged.
Sub-scale scores reflecting a vehicle’s dynamic qualities were calculated from the
product of the mean scale value. For use in a diagnostic context, these scale scores
were then multiplied by their associated importance ranking. Both the NASA-TLX
workload scale and the CAHQRS use this approach. By taking this approach the
21
sensitivity of the scale is enhanced (compared to a unidimensional scale) by ‘gearing’
the scale ratings by their relative importance to the category of vehicle. When making
comparisons of vehicles within a category, though, this is not necessary, as described
in the following section.
5.3 Results of validation exercise
5.3.1 Ranking of importance of the dimensions of vehicle dynamic qualities by
category of vehicle
One of the basic premises of the scale under development is that different aspects of a
vehicle’s dynamic qualities will be of differing levels of importance with respect to
the vehicles category (e.g. sports car or executive car).
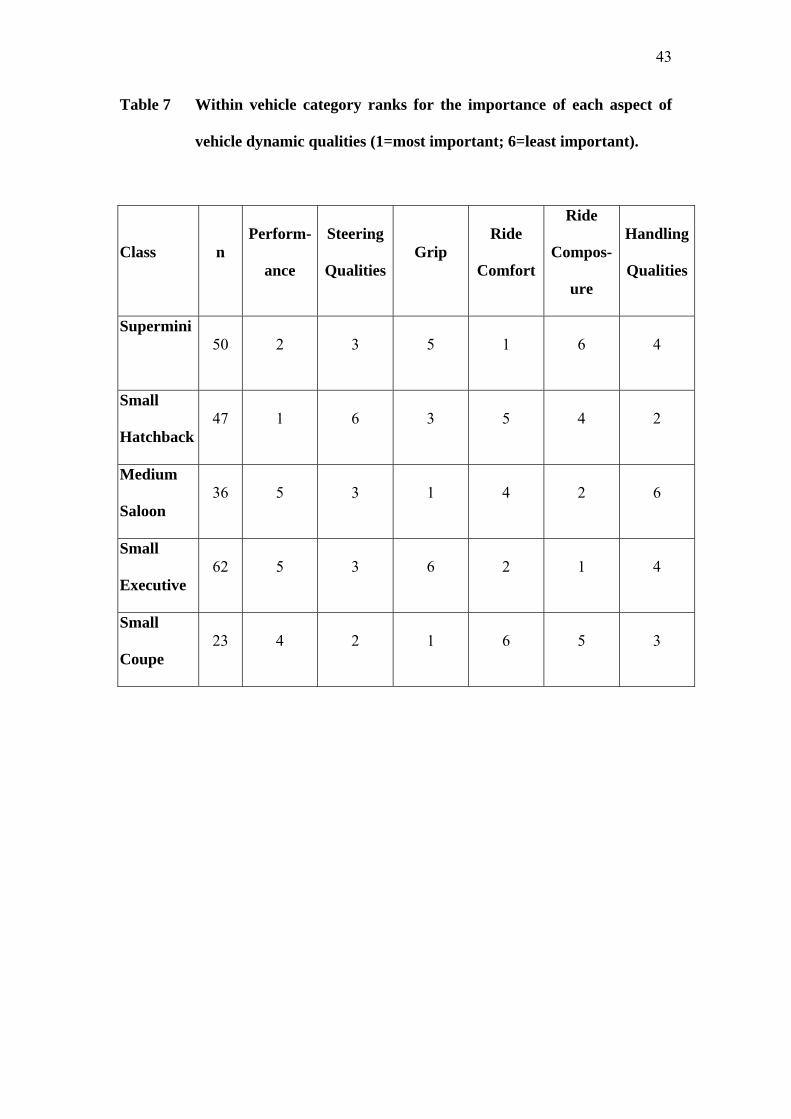
The rankings of the importance of each aspect of a vehicle’s dynamic behaviour
suggest that the relative importance of each aspect is different with respect to the
category of the vehicle. For all categories of vehicle, with the exception of medium
sized saloon cars, a within vehicle category analysis of the ranks awarded (Friedman’s
analysis of ranks) shows significant differences with respect to the category of
dynamic behaviour assessed (supermini; χ2=24.64, df=5, p<0.001: small hatchback;
χ2=46.87, df=5, p<0.001: medium-sized car; χ2=1.57, df=5, p>0.05: small executive
car; χ2=22.97, df=5, p<0.001: and small coupes; χ2=13.53, df=5, p<0.02).
A brief analysis of the rankings in table 7 suggests that (not surprisingly) drivers of
small, sporting coupes regarded handling, steering and grip as being more important
22
than ride quality. Conversely, drivers of executive cars emphasised ride composure
and comfort over performance and handling qualities. The pattern of results from
drivers of the smaller two categories of vehicle showed a far less clear pattern of
rankings, although in both cases performance was placed at a premium. The pattern
of rankings for medium sized vehicles should be interpreted with caution, as there was
very little difference in the mean ranks of the categories, suggesting no clear
preference (overall) in the dynamic qualities of these vehicles. This may reflect the
multi-purpose character of these cars.
INSERT TABLE 7 ABOUT HERE
5.3.2 Sub-scale validity and sensitivity
For the individual sub-scales to be valid they must be able to discriminate
meaningfully between vehicles. To be useful, the scales must also be sensitive.
Scales that discriminate only between the dynamic qualities of very disparate
categories of vehicle (for example off-road vehicles and sports cars) are of very
limited utility.
To test the sensitivity of the sub-scales, the ratings of dynamic behaviour of one or
more models within each category was compared to the class-leading vehicle. For the
sake of brevity only two such analyses are reported and discussed here. As the
objective in this case was to test the sensitivity of the sub-scales within a group, sub-
scale scores were not multiplied by the corresponding importance ranking. These
23
latter aspects reflect the importance of that component of dynamic behaviour within a
class of vehicle, not between types of vehicle.
While it is moderately straightforward to demonstrate the sensitivity of the scales in
this manner, it is far more difficult to demonstrate their criterion validity as there is no
readily measurable parameter to compare the scale results against. As a result, in an
attempt to demonstrate criterion validity, the results were compared to comments
taken from widely-published vehicle road tests.
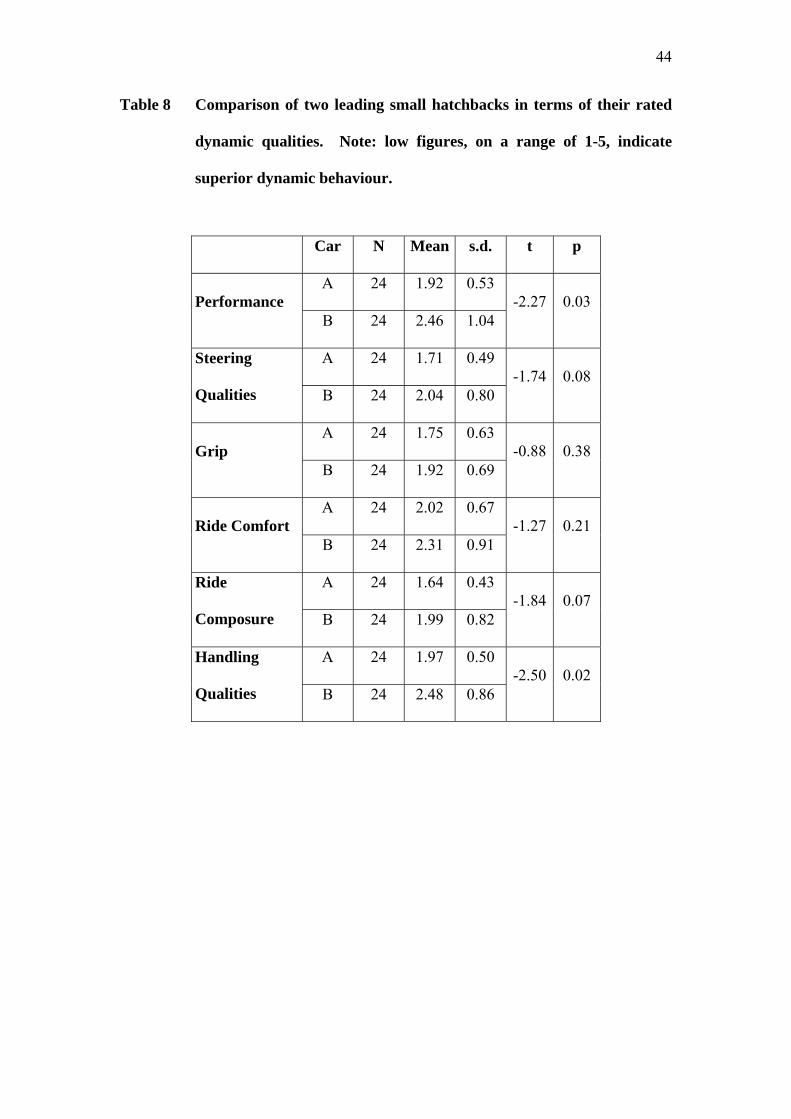
In a comparison of small hatchbacks, the class-leading vehicle (car A) was compared
against the best selling similar vehicle in Europe (car B). These results are shown in
table 8.
INSERT TABLE 8 ABOUT HERE
The results in table 8 show that the class leading vehicle was superior to its
comparison vehicle in all respects, significantly so in terms of the performance and
handling qualities dimensions of dynamic behaviour. The results for the steering
qualities and ride composure dimensions are also verging on significance. This would
suggest that these sub-scales are sensitive enough to differentiate between these two
vehicles. However, the scales must differentiate between the cars in a meaningful
way if they are to be valid. Of car A, What Car? magazine stated:-
24
‘…it’s still hard to take in just how far ahead of the game What Car?’s small
hatchback of the year has taken the driving pleasure you can expect from this
class of car.’
‘You notice straight away how stable and composed [car A] feels and how
every steering wheel movement produces an accurate response from the front
wheels’.
‘Cornering is crisp and accurate… it rides badly pock-marked B-roads firmly
and it’s never harsh and refinement is terrific.’ (What Car? online reviews,
2001).
While it should be noted that these comments are taken from a motoring magazine,
they do suggest that the ratings on the sub-scale dimensions of steering qualities, ride
composure and handling qualities appropriately reflect the dynamic behaviour of the
vehicle in question. There is further evidence in this respect when the corresponding
reviews of car B are considered.
‘The [car B] has had some of its thunder stolen by [car A] in the past year’
‘We have no complaints about the [car B’s] overall competence but it won’t
delight a driver in the same way as the [car A] which stamps its authority over
[car B] on the road’
25
‘The [car B] has a little too much body roll and a lack of steering feel through
bends … It can’t boast a composed ride either.’
‘… copes with undulations and crests well but feels fidgety over potholes.’
(What Car? online reviews, 2001).
These further comments would indicate that in terms of the relative sub-scale scores
awarded by respondents, the scales are sensitive enough to differentiate between the
two vehicles in terms of their dynamic responses and also do so in a meaningful, valid
manner.
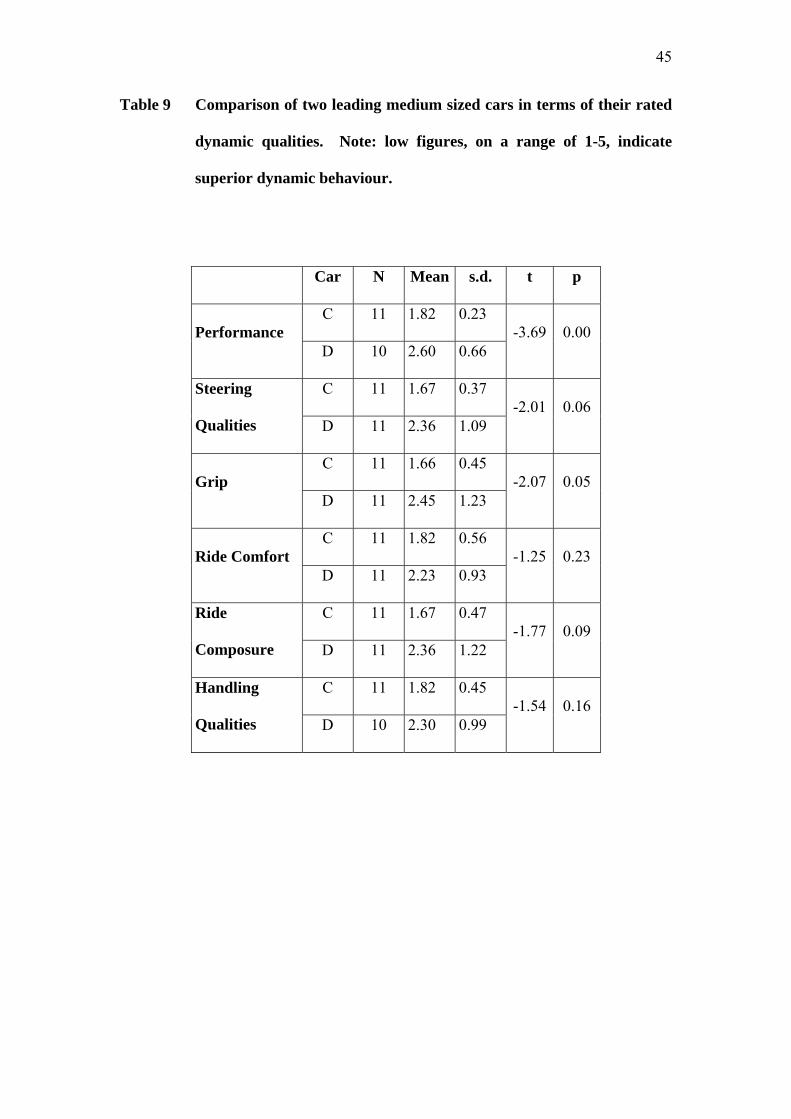
In a comparison of medium sized cars, the class-leading vehicle (car C) was compared
against the its leading competitor in the UK fleet and medium-sized car market (car
D). These results can be seen in table 9.
INSERT TABLE 9 ABOUT HERE
Table 9 shows that car C was rated as being superior in the areas of performance,
steering qualities grip and there was also a strong suggestion that it was also better
than car D in terms of its ride composure. Road test comments about car C support
the results in table 9.
‘Wonderfully crisp steering feel with a strong, self-centring action.’ Autocar
(1996).
26
‘The [car C] has been a keen handler from day one and the facelift a couple of
years ago only served to sharpen its responses. This ability to supply driver
enjoyment on demand may be at the expense of ultimate ride comfort, but you
have to drive over some very rutted road to pick up on this.’ (What Car?
online reviews, 2001).
Reviews of car D supported the results of the sub-scale comparisons with car C,
providing further for the validity of the sub-scales. For example:
‘Comfort over distance is the [Car D’s] strength, not B-road entertainment.
However, it’s relatively pleasing to punt along, thanks to smooth engines and
a comfortable ride. But the [car D] is not as entertaining as a [car C or list of
other competitors]. (Autotrader online road test reviews, 2002)
‘Happiest and most refined on motorway; less so on twisty roads where
handling and ride lack poise and polish…’ (Parker’s online car reviews,
2002)
‘Not a car to drive for the pleasure of it…’ (Parker’s online car reviews,
2002)
One of the more interesting points to note is that the ratings were collected from
member’s of the general public about their current cars. In many cases (although it is
impossible to determine how many) this is likely to be a judgement of the dynamic
qualities of their vehicle in isolation, whereas many of the comments made by the
27
motoring press are comparative comments from road testers who have had the benefit
of driving all the cars compared in the previous two analyses. However, despite the
respondents probably not having the benefit of comparison, the scales still
discriminate between the models in the manner expected, again suggesting further
evidence of validity.
5.3.3 Multidimensional presentation of scale results
In the present application, low scores and low rankings are more desirable or more
important. As was also the case with the NASA-TLX and the CAHQRS, it was also
possible to compute an overall scale score for the ride/handling qualities of the
vehicle through the weighted summation of the individual sub-scale scores, although
it is argued that this is of limited utility as the power of the scale resides in the
interpretation of its component sub-scales.
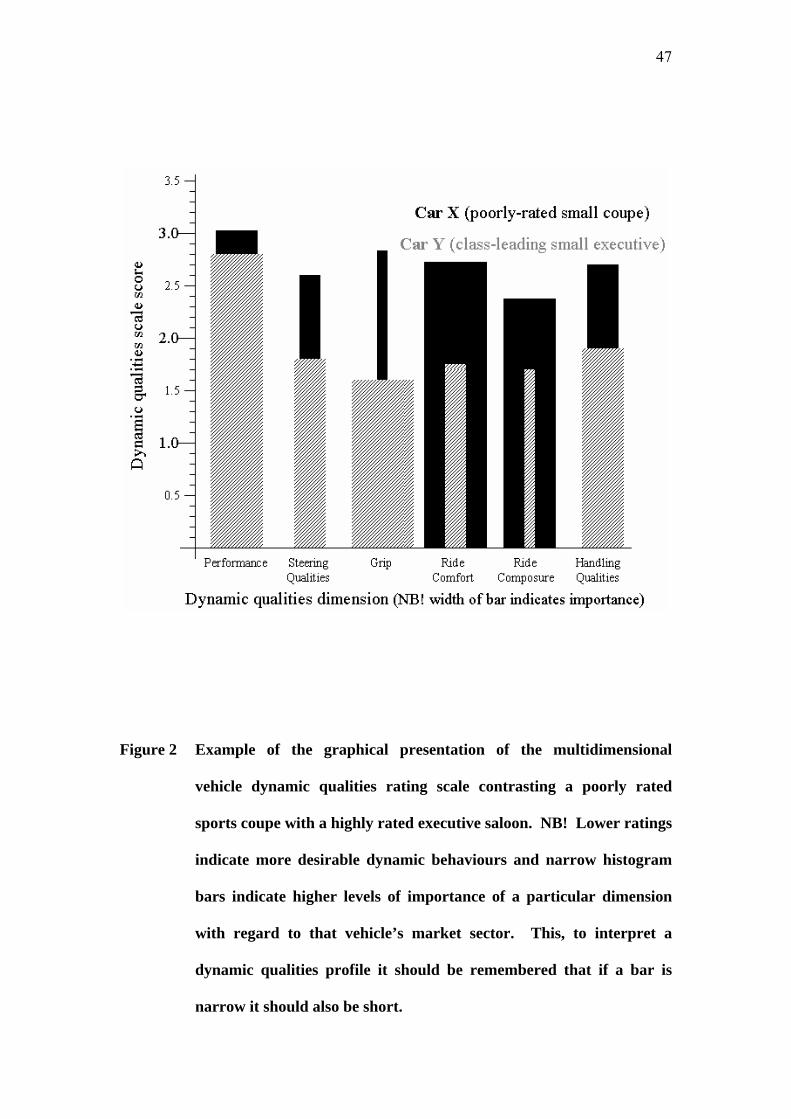
Perhaps the greatest power of multidimensional scales lies in the graphical
presentation of scores. When presenting data in this manner, in accordance with the
practice employed by both the NASA-TLX and the CAHQRS, scale ratings of vehicle
dynamic qualities were plotted (individually) on the y-axis and the importance
rankings on the x-axis. Short histogram bars are desirable, and narrow bars indicate
higher levels of importance. This approach was chosen as it emphasizes the
interaction between the compromises made between the various dynamic qualities and
the category of the vehicle. An example of this method of depicting the results is
given in figure 2, where a poorly rated sports coupe (car X) is contrasted with a highly
rated executive saloon (car Y). It can be seen from the width of the bars in the
28
graphical representation that the dimensions of ride comfort and ride composure are
regarded as being the most important be drivers of executive saloons, whereas drivers
of sporting coupes place greater emphasis on grip, steering and handling qualities.
The drivers of the class-leading car Y rated all aspects of their vehicle’s dynamic
properties superior to those of the old, poorly regarded small, sporting coupe, as
indicated by the shorter histogram bars. Comments from the road tests concerning the
dynamic behaviour of car X include:
‘…it lacks the sophistication to really be pushed on. The steering is a bit too
light at speed, and the roadholding's not secure enough under pressure. It's
perfectly adequate for most, undemanding, drivers, but serious sports fans will
be frustrated and disappointed.’ (Autotrader online road test reviews, 2002)
‘Besides being cramped, the [car X] also serves a bumpy, noisy ride.’
(Autotrader online road test reviews, 2002)
INSERT FIGURE 2 ABOUT HERE
These comments would seem to endorse the ratings awarded by its drivers. In
contrast, the comments for car Y tend to be more complimentary, yet also reflect its
different role and the ratings awarded by its drivers:
‘… good ride and remarkable smoothness at cruising speeds.’ (What Car?
online reviews, 2001).
29
‘High marks here - the [car Y] is a very relaxed and secure motorway cruiser,
and has better ride quality than most in the class.’ (Autotrader online road
test reviews, 2002)
‘Performance - Not a strong point…’ (Autotrader online road test reviews,
2002)

30
6. Discussion
The scale developed to assess motor vehicle dynamic qualities was based upon
scaling principles initially used in the NASA-TLX multidimensional workload scale
(Hart and Staveland 1988) and the Cooper-Harper aircraft handling qualities scale
(Cooper and Harper 1969), which where subsequently developed in the CAHQRS
(see Harris et al. 2000). Using the same approach as in the later case, a scale has been
developed which allows everyday drivers to assess meaningfully the dynamic
behaviour of their vehicles. The aims were to produce a scale that had good content
validity; good construct reliability and which was sensitive to differences between the
dynamic behaviour of different vehicles. Through the manner in which the scale was
initially developed the content validity should be assured. The replicability of the
underlying factor structure (figure 1) is also indicative of good construct validity (see
Anastasi 1990).
The establishment of criterion reliability for abstract concepts such as the assessment
of the dynamic qualities of a motor vehicle is much harder to establish (q.v. the
handling qualities of an aircraft – see Harris et al. 2000). The broad agreement of the
scale ratings with the opinions of professional motor-magazine road testers does
suggest that the scale aids in producing valid ratings of the dynamic behaviour of
motor vehicles (see tables 8 and 9 and figure 2).
The use of a NASA-TLX type of scale format once again shows the importance of
being able to rate and display the interactive nature of scale ratings with context.
Previously, in the case of the CAHQRS, this interaction was between aircraft handling
31
qualities and the nature of the manoeuvre being flown. In the present case the
interaction is between the category of motor vehicle and its dynamic behaviour. The
differences in the rankings of importance of the various aspects of a vehicle’s
dynamic behaviour indicate that the drivers of the five different categories of vehicle
included in this study did not all want the same things of their vehicles (see table 7).
This underlines the importance of taking the assessment approach suggested herein.
Simple ratings of dynamic qualities on each of the sub-scales are not enough. To
draw conclusions simply from these assessments would overlook the complex
interaction with the category of the vehicle and hence the relative importance of each
aspect of its behaviour.
It is again interesting to note that the everyday driver is sensitive to differences in the
dynamic behaviour of road vehicles, which supports the earlier observations of
Brindle (1984, 1986) and Walker et al. (2001). It is not just test drivers that are
sensitive to these aspects, which further strengthens the call to involve everyday
drivers in the development of motor vehicles on-the-road dynamic qualities. There is
much more scope for a user-centred approach in this area than may be initially
thought.
Further development of the scale is planned in a series of trials in an engineering
simulator and in a set of test-track trials. These trials will further evaluate the
criterion validity of the scale and also assess its test-re-test reliability and sensitivity.
However, the initial results would seem to suggest that there is a sound basis on which
to continue further scale development and assessment, thereby avoiding the criticism

32
of other measures in ergonomics that they do not conform to even the most basic
standards for psychometric measurement.
33
7. References
ANASTASI, A. 1990. Psychological Testing, 6th Edition, (New York: MacMillan).
AUTOCAR 1996. Road Test 4129, 4 December, 58-59.
AUTOTRADER 2002. Online road test reviews.
http://ces.autotrader.co.uk/ces/search.jsp. Accessed 11 March 2005.
BRINDLE, L.R. 1984. The influence of tyre characteristics on driver opinion and
risk-taking, PhD thesis, College of Aeronautics, Cranfield University, Cranfield,
U.K.
BRINDLE, L.R. 1986. Aspects of subjective/objective correlation regarding vehicle
tyres. In, Proceedings of the Tenth International Technical Conference on
Experimental Safety Vehicles, Oxford, England, July 1-4, 1985 (Washington DC:
US Department of Transportation, National Highway Traffic Safety
Administration). Report number DOT HS 806 916, February 1986.
CAMPBELL, D.T. 1960. Recommendations for APA test standards regarding
construct, trait and discriminant validity, American Psychologist, 15, 546-533.
COLLE, H.A. and REID, G.B. 1997. A framework for mental workload research and
applications using formal measurement theory, International Journal of Cognitive
Ergonomics, 1, 303-313.
COOPER, G.E. and HARPER, R.P. 1969. The use of pilot rating in the evaluation of
aircraft handling qualities. (Moffett Field, CA; NASA Ames Research Center).
Report number NASA TN-D-5153.
CRONBACH, L.J. 1951. Coefficient alpha and the structure of psychometric tests,
Psychometrika, 31, 93-96.
34
FIELD, E.J. 1995. Flying qualities of transport aircraft: precognitive or
compensatory? PhD thesis, College of Aeronautics, Cranfield University,
Cranfield, U.K.
GAWRON, V.J. 2000. Human Performance Measures Handbook, (Mahwah, NJ:
Lawrence Erlbaum Associates).
HAIR, J.F., ANDERSON, R.E., TATHAM, R.L. and BLACK, W.C. 1998.
Multivariate Data Analysis, 5th Edition, (Upper Saddle River, NJ: Prentice Hall).
HARPER, R.P. and COOPER, G.E. 1986. Handing qualities and pilot evaluation,
Journal of Guidance, Control and Dynamics, 9, 515-530.
HARRIS, D. 2000. The measurement of pilot opinion when assessing aircraft
handling qualities, Measurement and Control, 33, 239-243.
HARRIS, D., GAUTREY, J., PAYNE, K. and BAILEY, R. 2000. The Cranfield
Aircraft Handling Qualities Rating Scale: a multidimensional approach to the
assessment of aircraft handling qualities, The Aeronautical Journal, 104, 191-198.
HARRIS, D., PAYNE, K. and GAUTREY, J. 1999. A multidimensional scale to
assess aircraft handling qualities. In, D. Harris (ed.) Engineering Psychology and
Cognitive Ergonomics Volume Three, (Aldershot: Ashgate), 277-285.
HART, S.G. and STAVELAND, L.E. 1988. Development of the NASA task load
index TLX: Results of empirical and theoretical research. In, P.A. Hancock and N.
Meshkati (eds.) Human Mental Workload, (Amsterdam: North-Holland), 139-183.
NEWMAN, R.L. and GREELEY, K.W. 2001. Cockpit Displays: Test and
Evaluation, (Aldershot: Ashgate).
PAYNE, K. and HARRIS, D. 2000. The development of a multi-dimensional aircraft
handling qualities rating scale, International Journal of Aviation Psychology, 10,
343-362.
35
PARKER’S 2002. Online car reviews. http://www.parkers.co.uk/choosing/.
Accessed 11 March 2005..
ROBINSON, J.P., SHAVER, P.R. and WRIGHTSMAN, L.S. 1991. Criteria for scale
selection and evaluation. In, J.P. Robinson, P.R. Shaver and L.S. Wrightsman,
L.S. (eds.) Measures of Personality and Social Psychological Attitudes, (San
Diego, CA: Academic Press), 1-15.
ROSCOE, A.H. 1984. Assessing pilot workload in flight. Flight test techniques. In,
Proceedings of NATO Advisory Group for Aerospace Research and Development
AGARD, (Neuilly-sur-Seine: AGARD). Report number AGARD-CP-373.
SANO, S. 1982. Evaluation of motor vehicle handling, International Journal of
Vehicle Design, 3, 171-189.
SOCIETY OF AUTOMOTIVE ENGINEERS 1985. Subjective Rating Scale for
Vehicle Handling, (Warrendale, PA: Author). Surface Vehicle Recommended
Practice J1441, Issued 1985-06
STANTON, N.A. and YOUNG, M.S. 1999a. Utility analysis in cognitive
ergonomics. In, D. Harris (ed.) Engineering Psychology and Cognitive
Ergonomics Volume Four, (Aldershot: Ashgate), 411-418.
STANTON, N.A. AND YOUNG, M.S. 1999b. A Guide to Methodology in
Ergonomics, (London: Taylor and Francis).
TESTING TECHNOLOGY INTERNATIONAL 1998. Defining the Vehicle
Development Process. Vol. 1 (May 1998).
WALKER, G.H, STANTON, N.A. and YOUNG, M.S. 2001. An on-road
investigation of vehicle feedback and its role in driver cognition: implications for
cognitive ergonomics, International Journal of Cognitive Ergonomics, 5, 421-444.
36
WHAT CAR? 2001. Road Test Library.
http://www.whatcar.com/default.asp?a=roadtest. Accessed 11 March 2005.
WILSON, D.J. and RILEY, D.R. 1989. Cooper-Harper rating variability. Paper
presented at AIAA Atmospheric Flight Mechanics Conference, (Boston, MA:
American Institute of Aeronautics and Astronautics). Paper number A1AA-89
3358.
37
Table 1 Post Varimax rotation principal components solution (using Kaiser’s
criterion for component extraction) to describe the underlying
dimensions of vehicle dynamic qualities. Items are presented in order
of magnitude of loading with the principal component and for clarity,
items with a loading below 0.45 have been omitted from the table.
Principal Component Loading Bipolar Item
1 2 3 4 5 6 7 Communicative/Vague 0.79 Informative/Uninformative 0.75 Accurate/Inaccurate 0.73 Precise/Imprecise 0.71 Responsive/Unresponsive 0.71 Sensitive/Insensitive 0.7 Interactive/Uninvolving 0.68 Well-weighted/Poorly-weighted 0.50 Quick/Slow 0.89 Speedy/Leisurely 0.87 Frisky/Sluggish 0.84 Good acceleration/Poor acceleration 0.80 Rapid/Slow 0.67 Exciting/Dull 0.66 Predictable/Unpredictable 0.67 Controlled /Uncontrolled 0.60 Stable/Unstable 0.53 Solid/Loose 0.53 Composed/Fidgety 0.50 Firm/Soft 0.45 Settled/Unsettled 0.68 Firm/Bouncy 0.58 Poised/Nervy 0.57 Oversteer/No oversteer 0.54 Body roll/No body roll 0.53 Taut/Slack 0.52 Understeer/No Understeer 0.50 Absorbent/Thumpy 0.78 Smooth/Harsh 0.77 Comfortable/Uncomfortable 0.69 Grippy /Skiddy 0.68 Adhesive/Slippy 0.66 Light/Heavy 0.89
38
Table 2 Principal component extraction summary statistics for analysis
extracting the underlying dimensions of vehicle dynamic qualities.
Component
Number
Component
Name
Eigenvalue % of
variance
pre-rotation
% of
variance
post-rotation
1 Steering Qualities 11.83 34.8 15.7
2 Performance 2.87 8.4 14.3
3 Ride Composure 2.01 5.9 10.5
4 Handling Qualities 1.82 5.4 8.8
5 Ride Comfort 1.28 3.8 8.0
6 Grip 1.20 3.5 4.7
7 Unnamed 1.06 3.1 3.7
39
Table 3 Items deleted from the final CFA solution and their associated
principal components
Bipolar Item Component Name
Communicative/Vague Steering Qualities
Informative/Uninformative Steering Qualities
Precise/Imprecise Steering Qualities
Sensitive/Insensitive Steering Qualities
Well-weighted/Poorly-weighted Steering Qualities
Good acceleration/Poor acceleration Performance
Predictable/Unpredictable Ride Composure
Composed/Fidgety Ride Composure
Settled/Unsettled Handling Qualities
Taut/Slack Handling Qualities
Comfortable/Uncomfortable Ride Comfort
40
Table 4 Values for the inter-correlations between the latent variables
(Pearson’s r) describing vehicle dynamic qualities
Component
Name
Stee
ring
Perf
orm
ance
Gri
p
Com
fort
Com
posu
re
Performance 0.57
Grip 0.84 0.49
Ride Comfort 0.42 0.20 0.39
Ride Composure 0.77 0.53 0.69 0.45
Handling Qualities 0.84 0.56 0.79 0.44 0.83
41
Table 5 Cronbach’s Alpha values for the internal consistency (reliability) of
the latent variables describing vehicle dynamic qualities
Component
Name
Number of
Items
Cronbach’s
Alpha
Performance 3 0.90
Steering Qualities 3 0.78
Grip 2 0.86
Ride Comfort 2 0.80
Ride Composure 3 0.86
Handling Qualities 5 0.83
42
Table 6 Short definitions of the vehicle dynamic qualities dimensions used in
the motor vehicle dynamic qualities rating scale
Scale
Component
Short Definition
Performance This involves the power of the vehicle and is typically reflected by
its ability to accelerate
Steering
Qualities
This refers to the feedback supplied via the steering wheel. A good
steering system should give a crisp and accurate response at the start
of a corner and respond proportionally afterwards
Grip This refers to the absolute lateral grip of the vehicle as a result of
the adhesion of the tyres to the road surface
Ride
Comfort
This refers to the evaluation of the level of comfort when travelling
over various road surfaces
Ride
Composure
This refers to the manner in which the body of the vehicle settles
and rides over the road surface
Handling
Qualities
This refers to the manner by which the vehicle responds to the
inputs from the driver
43
Table 7 Within vehicle category ranks for the importance of each aspect of
vehicle dynamic qualities (1=most important; 6=least important).
Class n Perform-
ance
Steering
QualitiesGrip
Ride
Comfort
Ride
Compos-
ure
Handling
Qualities
Supermini
50 2 3 5 1 6 4
Small
Hatchback 47 1 6 3 5 4 2
Medium
Saloon 36 5 3 1 4 2 6
Small
Executive 62 5 3 6 2 1 4
Small
Coupe 23 4 2 1 6 5 3
44
Table 8 Comparison of two leading small hatchbacks in terms of their rated
dynamic qualities. Note: low figures, on a range of 1-5, indicate
superior dynamic behaviour.
Car N Mean s.d. t p
A 24 1.92 0.53 Performance
B 24 2.46 1.04 -2.27 0.03
A 24 1.71 0.49 Steering
Qualities B 24 2.04 0.80 -1.74 0.08
A 24 1.75 0.63 Grip
B 24 1.92 0.69 -0.88 0.38
A 24 2.02 0.67 Ride Comfort
B 24 2.31 0.91 -1.27 0.21
A 24 1.64 0.43 Ride
Composure B 24 1.99 0.82 -1.84 0.07
A 24 1.97 0.50 Handling
Qualities B 24 2.48 0.86 -2.50 0.02
45
Table 9 Comparison of two leading medium sized cars in terms of their rated
dynamic qualities. Note: low figures, on a range of 1-5, indicate
superior dynamic behaviour.
Car N Mean s.d. t p
C 11 1.82 0.23 Performance
D 10 2.60 0.66 -3.69 0.00
C 11 1.67 0.37 Steering
Qualities D 11 2.36 1.09 -2.01 0.06
C 11 1.66 0.45 Grip
D 11 2.45 1.23 -2.07 0.05
C 11 1.82 0.56 Ride Comfort
D 11 2.23 0.93 -1.25 0.23
C 11 1.67 0.47 Ride
Composure D 11 2.36 1.22 -1.77 0.09
C 11 1.82 0.45 Handling
Qualities D 10 2.30 0.99 -1.54 0.16

46
Figure 1 Final CFA factor structure to describe vehicle dynamic qualities. The
numbers above the straight arrows represent the standardised
regression weights between the latent variable and the indicator
variables. Values for the inter-correlations between the latent
variables can be found in table 4.
47
Figure 2 Example of the graphical presentation of the multidimensional
vehicle dynamic qualities rating scale contrasting a poorly rated
sports coupe with a highly rated executive saloon. NB! Lower ratings
indicate more desirable dynamic behaviours and narrow histogram
bars indicate higher levels of importance of a particular dimension
with regard to that vehicle’s market sector. This, to interpret a
dynamic qualities profile it should be remembered that if a bar is
narrow it should also be short.
![10-1 Lesson 10 Objectives Chapter 4 [1,2,3,6]: Multidimensional discrete ordinates Chapter 4 [1,2,3,6]: Multidimensional discrete ordinates Multidimensional](https://img.pdfslide.us/doc/110x75/5697bff81a28abf838cbf777/10-1-lesson-10-objectives-chapter-4-1236-multidimensional-discrete-ordinates.jpg)