Embed Size (px)
Citation preview
BearWorks BearWorks
MSU Graduate Theses
Spring 2021
The Development and Validation of Implicit Measures of Job The Development and Validation of Implicit Measures of Job
Satisfaction for Students Satisfaction for Students
Xin Wei Ong Missouri State University, [email protected]
As with any intellectual project, the content and views expressed in this thesis may be
considered objectionable by some readers. However, this student-scholar’s work has been
judged to have academic value by the student’s thesis committee members trained in the
discipline. The content and views expressed in this thesis are those of the student-scholar and
are not endorsed by Missouri State University, its Graduate College, or its employees.
Follow this and additional works at: https://bearworks.missouristate.edu/theses
Part of the Industrial and Organizational Psychology Commons
Recommended Citation Recommended Citation Ong, Xin Wei, "The Development and Validation of Implicit Measures of Job Satisfaction for Students" (2021). MSU Graduate Theses. 3603. https://bearworks.missouristate.edu/theses/3603
This article or document was made available through BearWorks, the institutional repository of Missouri State University. The work contained in it may be protected by copyright and require permission of the copyright holder for reuse or redistribution. For more information, please contact [email protected].
THE DEVELOPMENT AND VALIDATION OF IMPLICIT MEASURES OF JOB
SATISFACTION FOR STUDENTS
A Master’s Thesis
Presented to
The Graduate College of
Missouri State University
TEMPLATE
In Partial Fulfillment
Of the Requirements for the Degree
Master of Science, Industrial-Organizational Psychology
By
Xin Wei Ong
May 2021

ii
Copyright 2021 by Xin Wei Ong
iii
THE DEVELOPMENT AND VALIDATION OF IMPLICIT MEASURES OF JOB
SATISFACTION FOR STUDENTS
Industrial-Organizational Psychology
Missouri State University, May 2021
Master of Science
Xin Wei Ong
ABSTRACT
Job satisfaction is one of the most researched topics in industrial-organizational psychology and explicit (self-report) measures are the most common assessment method. However, self-report measures are contaminated by inaccurate self-knowledge and impression management artifacts, which may weaken the predictive validity of the measures. The Implicit Association Test (IAT) might address these limitations because the procedure is based on reaction times in classification tasks. This research developed personalized implicit measures of job satisfaction using IATs and investigated their construct validity in a college sample. The construct validity of the measures was investigated with a multitrait-multimethod design. Results indicated problems with some psychometric properties for some measures, while confirmatory factor analyses provided some evidence supporting the IATs’ convergent and discriminant validity. KEYWORDS: job satisfaction, supervisor, coworkers, work, college, implicit measures, Implicit Association Test, Single-Target Implicit Association Test, Personalized Implicit Association Test, confirmatory factor analysis
iv
THE DEVELOPMENT AND VALIDATION OF IMPLICIT MEASURES OF JOB
SATISFACTION FOR STUDENTS
By
Xin Wei Ong
A Master’s Thesis Submitted to the Graduate College
Of Missouri State University In Partial Fulfillment of the Requirements
For the Degree of Master of Science, Industrial-Organizational Psychology
May 2021 Approved:
Donald L. Fischer, Ph.D., Thesis Committee Chair
Carol F. Shoptaugh, Ph.D., Committee Member
Michelle E. Visio, Ph.D., Committee Member
Julie Masterson, Ph.D., Dean of the Graduate College
In the interest of academic freedom and the principle of free speech, approval of this thesis indicates the format is acceptable and meets the academic criteria for the discipline as determined by the faculty that constitute the thesis committee. The content and views expressed in this thesis are those of the student-scholar and are not endorsed by Missouri State University, its Graduate College, or its employees.
v
ACKNOWLEDGEMENTS
This thesis project would not have been possible without the support and encouragement
of numerous individuals. I would like to express my sincere appreciation to my thesis advisor,
Dr. Donald Fischer, for all your patience, advice, expertise, endless support, and mentorship
since the first day of the program as your research assistant. You are an outstanding mentor,
advisor, and supervisor; I would not have come this far without your support and mentorship
throughout this journey. Besides that, I would like to thank my thesis committee members, Drs.
Carol Shoptaugh and Michelle Visio, for your encouragement, constructive feedback, advice,
and time to improve the quality of this thesis. Thanks to my I-O professors, Drs. Thomas Kane,
Jeffrey Foster, and Wayne Mitchell for your support and guidance over the past two years.
To my family, friendship family (Genne & Dick Sherman), friends, and fiancé, thank you
for all your unconditional love and support throughout this journey of pursuing my dreams.
To my fellow MSU I-O colleagues, thank you for all your support, patience, help, and
laughs along this journey. I will never forget the precious time and great moments we spent
together. I am grateful to get to know you all and establish these life-long friendships.
To my research team (Max Lischwe, Haein Won, Lindsey Carpentier, Thomas Ryan,
Kurtis Payne, Lauren Krieg, Kailey Meyer, Brooke Watson, Alana Wilcox, Benjamin Osvath,
Joseph Wansing, Tim Amadore, Trevor O’Sullivan, Kayla Taylor, and Colten Pike), thank you
all for your time and contributions in this project.
Lastly, thank you to Dr. Laurel Kimura and my beloved Linfield Psychology professors
(Drs. Kay Livesay, Jennifer Linder, and Tanya Tompkins) for introducing and encouraging me to
pursue the M.S. Industrial-Organizational Psychology program at Missouri State University.
vi
TABLE OF CONTENTS
Introduction Page 1 Importance of Job Satisfaction Page 2
Measurement of Job Satisfaction Page 2 Implicit Measures – The Traditional Implicit Association Test Page 3 The Single – Target Implicit Association Test Page 6
The Personalized Implicit Association Test Page 6
Implicit Job Satisfaction Page 7 Hypothesis Page 10
Methods Page 12
Sample Page 12 Explicit Measures Page 12 Implicit Measures Page 13 Procedure Page 14
Results Page 17 Sample Page 17 Hypothesis Testing Page 18
Discussion Page 29
References Page 32
Appendices Page 36 Appendix A: Human Subjects IRB Approval Page 36 Appendix B: Job Satisfaction Survey Page 37 Appendix C: Overall Job Satisfaction (OJS) Scale Page 38 Appendix D: Explicit Attitude Measures Towards Christianity Page 39 Appendix E: Informed Consent Statement Page 40
vii
LIST OF TABLES
Table 1. Schematic Overview of the Traditional Implicit Association Test
Page 11
Table 2. Schematic Overview of the Single-Target Implicit Association Test
Page 11
Table 3. Category Labels and Stimulus Word for Single-Target IAT – The Work Itself
Page 15
Table 4. Category Labels and Stimulus Word for Single-Target IAT - Supervision
Page 15
Table 5. Category Labels and Stimulus Word for Single-Target IAT - Coworkers
Page 16
Table 6. Category Labels and Stimulus Word for Single-Target IAT - Attitudes towards Christianity
Page 16
Table 7. Descriptive Statistics for Study Variables Page 22 Table 8. Zero-Order Correlations of Study Variables Page 23 Table 9. Summary of Goodness-of-Fit Statistics for CFA Models
Page 24 Table 10. Differential Goodness-of-Fit Statistics for Nested Model Comparisons
Page 24
Table 11. Trait and Method Loadings for CFA Model 1 Page 25
viii
LIST OF FIGURES
Figure 1. CFA Model 1. Two Freely Correlated Method Factors and Two Freely Correlated Trait Factors
Page 26
Figure 2. CFA: Model 2: Two Freely Correlated Method Factors and No Trait Factors
Page 26
Figure 3. CFA Model 3: Two Freely Correlated Method Factors and Two Perfectly Correlated Trait Factors
Page 27
Figure 4. CFA Model 4: Two Uncorrelated Methods Factors and Two Freely Correlated Trait Factors
Page 27
Figure 5. CFA Model 5: Perfectly Correlated Method Factors and Two Freely Correlated Trait Factors
Page 28
1
INTRODUCTION
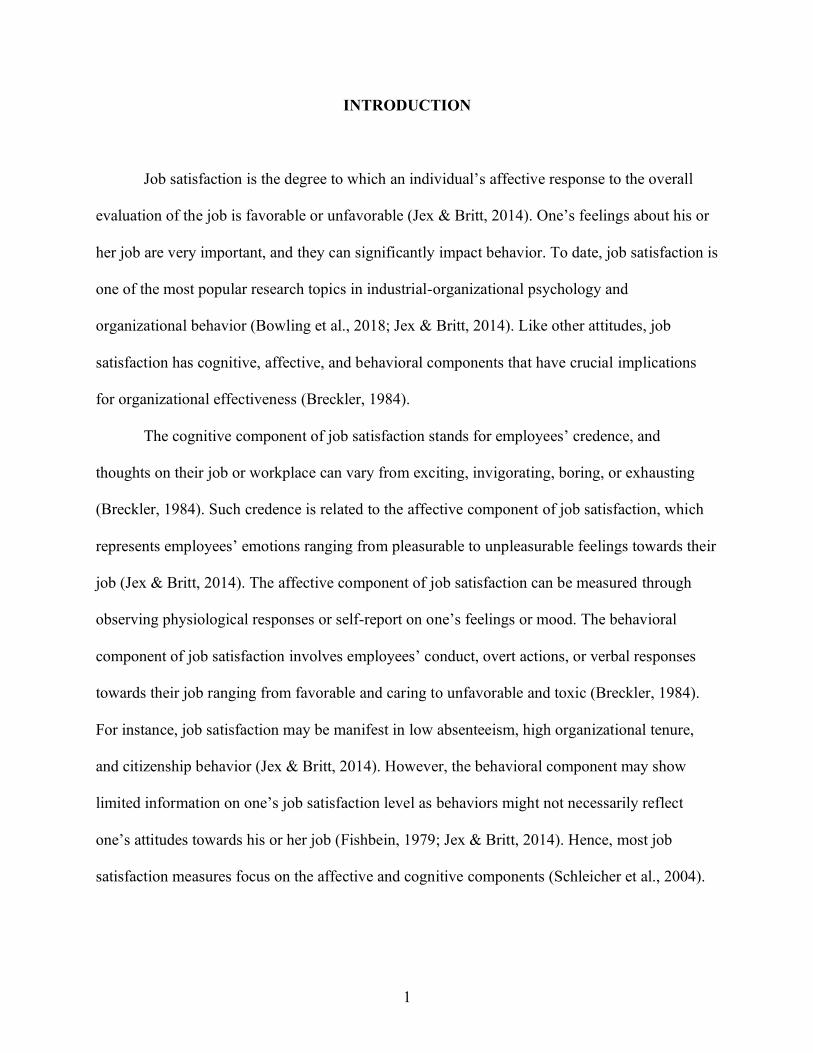
Job satisfaction is the degree to which an individual’s affective response to the overall
evaluation of the job is favorable or unfavorable (Jex & Britt, 2014). One’s feelings about his or
her job are very important, and they can significantly impact behavior. To date, job satisfaction is
one of the most popular research topics in industrial-organizational psychology and
organizational behavior (Bowling et al., 2018; Jex & Britt, 2014). Like other attitudes, job
satisfaction has cognitive, affective, and behavioral components that have crucial implications
for organizational effectiveness (Breckler, 1984).
The cognitive component of job satisfaction stands for employees’ credence, and
thoughts on their job or workplace can vary from exciting, invigorating, boring, or exhausting
(Breckler, 1984). Such credence is related to the affective component of job satisfaction, which
represents employees’ emotions ranging from pleasurable to unpleasurable feelings towards their
job (Jex & Britt, 2014). The affective component of job satisfaction can be measured through
observing physiological responses or self-report on one’s feelings or mood. The behavioral
component of job satisfaction involves employees’ conduct, overt actions, or verbal responses
towards their job ranging from favorable and caring to unfavorable and toxic (Breckler, 1984).
For instance, job satisfaction may be manifest in low absenteeism, high organizational tenure,
and citizenship behavior (Jex & Britt, 2014). However, the behavioral component may show
limited information on one’s job satisfaction level as behaviors might not necessarily reflect
one’s attitudes towards his or her job (Fishbein, 1979; Jex & Britt, 2014). Hence, most job
satisfaction measures focus on the affective and cognitive components (Schleicher et al., 2004).
2
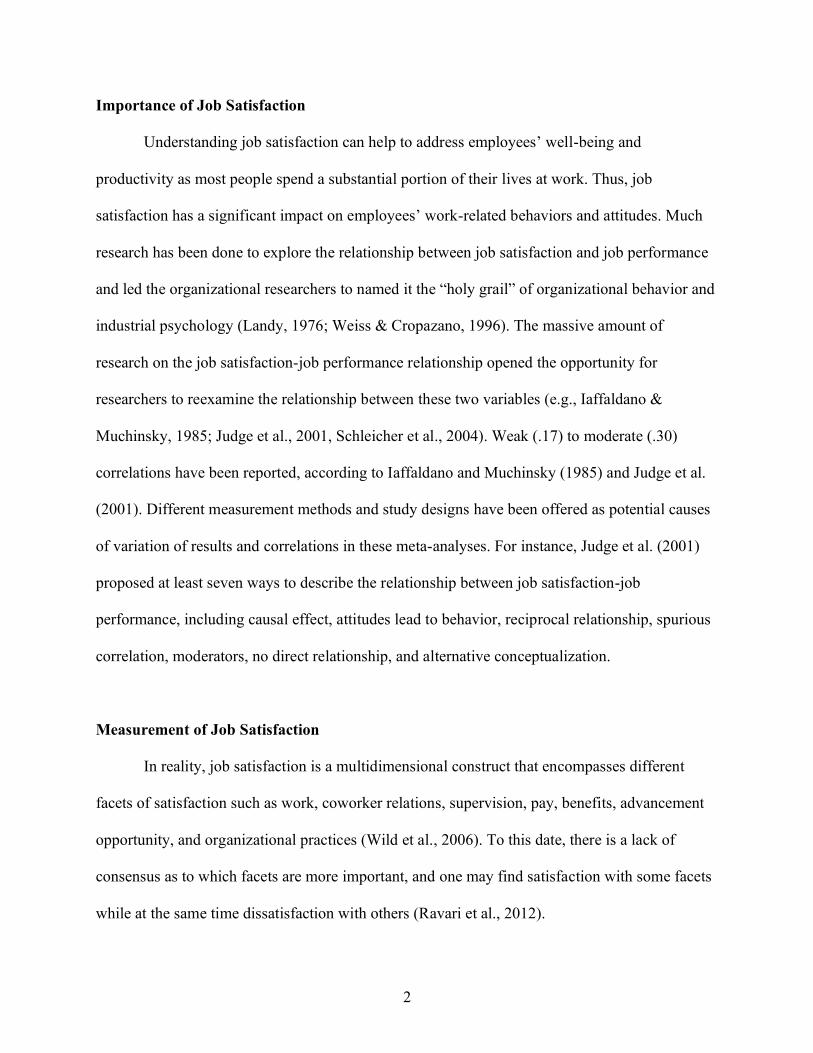
Importance of Job Satisfaction
Understanding job satisfaction can help to address employees’ well-being and
productivity as most people spend a substantial portion of their lives at work. Thus, job
satisfaction has a significant impact on employees’ work-related behaviors and attitudes. Much
research has been done to explore the relationship between job satisfaction and job performance
and led the organizational researchers to named it the “holy grail” of organizational behavior and
industrial psychology (Landy, 1976; Weiss & Cropazano, 1996). The massive amount of
research on the job satisfaction-job performance relationship opened the opportunity for
researchers to reexamine the relationship between these two variables (e.g., Iaffaldano &
Muchinsky, 1985; Judge et al., 2001, Schleicher et al., 2004). Weak (.17) to moderate (.30)
correlations have been reported, according to Iaffaldano and Muchinsky (1985) and Judge et al.
(2001). Different measurement methods and study designs have been offered as potential causes
of variation of results and correlations in these meta-analyses. For instance, Judge et al. (2001)
proposed at least seven ways to describe the relationship between job satisfaction-job
performance, including causal effect, attitudes lead to behavior, reciprocal relationship, spurious
correlation, moderators, no direct relationship, and alternative conceptualization.
Measurement of Job Satisfaction
In reality, job satisfaction is a multidimensional construct that encompasses different
facets of satisfaction such as work, coworker relations, supervision, pay, benefits, advancement
opportunity, and organizational practices (Wild et al., 2006). To this date, there is a lack of
consensus as to which facets are more important, and one may find satisfaction with some facets
while at the same time dissatisfaction with others (Ravari et al., 2012).
3
Due to the popularity of job satisfaction research, psychologists have developed reliable
and valid instruments to measure job satisfaction. The most common way to measure job
satisfaction is through explicit measures such as self-reports, where a person consciously thinks
about how he or she wants to describe himself or herself through completing questionnaires
(Wilson & Dunn, 2004). The continuous research in job satisfaction has helped the researchers
gather evidence and test-retest reliability over several decades to support the construct validity of
the measures of different job satisfaction facets (Jex & Britt, 2004). For example, the Job
Satisfaction Survey (JSS) developed by Spector (1985) contains 36 items with Likert response
scales measuring nine facets of job satisfaction – pay, promotion, supervision, fringe benefits,
contingent rewards, operating procedures, coworkers, nature of work, and communication.
The use of explicit measures has benefited the researchers in assessing job satisfaction as
explicit measures are cheap, easy to access, administer, score, and interpret. However, these
explicit measures allow a person to think carefully before responding to questions. As a result,
scores can suffer from impression management – deceptive efforts to be seen in a more favorable
way (Learly & Kowalski, 1990). Besides that, Rosenberg (1969) proposed that evaluation
apprehension may be present in the explicit measures and cause respondents to change their
responses. For instance, if an individual is responding to a turnover intention survey in his or her
workplace, he or she may provide a more positive rating than what he or she thinks so that it is
viewed positively by the management.
Implicit Measures – The Traditional Implicit Association Test
To control for contamination from impression management efforts, implicit measures
may be used to assess attitudes related to job satisfaction. Greenwald and Banaji (1995) argued
4
that implicit attitude is “introspectively unidentified (or inaccurately identified) traces of past
experience that mediate favorable or unfavorable feelings, thought or action toward a social
object” (p.5). Greenwald et al. (1998) created the Implicit Association Test (IAT) to assess
implicit attitudes of racial preference and stereotypes using reaction times on classification tasks
to measure the strength of association between “target-concept” (category label) and an “attribute
dimension” (attribute label).
Participants are presented with stimuli (words) in the middle of a computer screen, and
they are required to sort them into alternative categories and attributes by pressing specific letters
on the keyboard. Category and attribute labels are displayed in the upper left and upper right
corners of the screen, while a stimulus word is presented in the middle of the screen. Participants
press the “E” key if the stimulus word belongs to one of the upper left categories—attribute pair
and press the “I” key if the stimulus word belongs to the upper right category—attribute pair (see
Table 1). If the participants sort the stimulus word to the wrong category, error feedback (the red
letter “X”) will appear; participants have to resort the stimulus word to the correct category as
soon as possible. The participants must sort the words as fast as possible with minimal mistakes
as sorting time is used to calculate the strength of the association between the category and
attribute pair. As the sorting time decreases (sort correctly with fewer mistakes), the strength of
the association between the category and attribute increases. As the sorting time increases (sort
incorrectly with more errors), the strength of the association between the category and attribute
decreases (Lane et al., 2007).
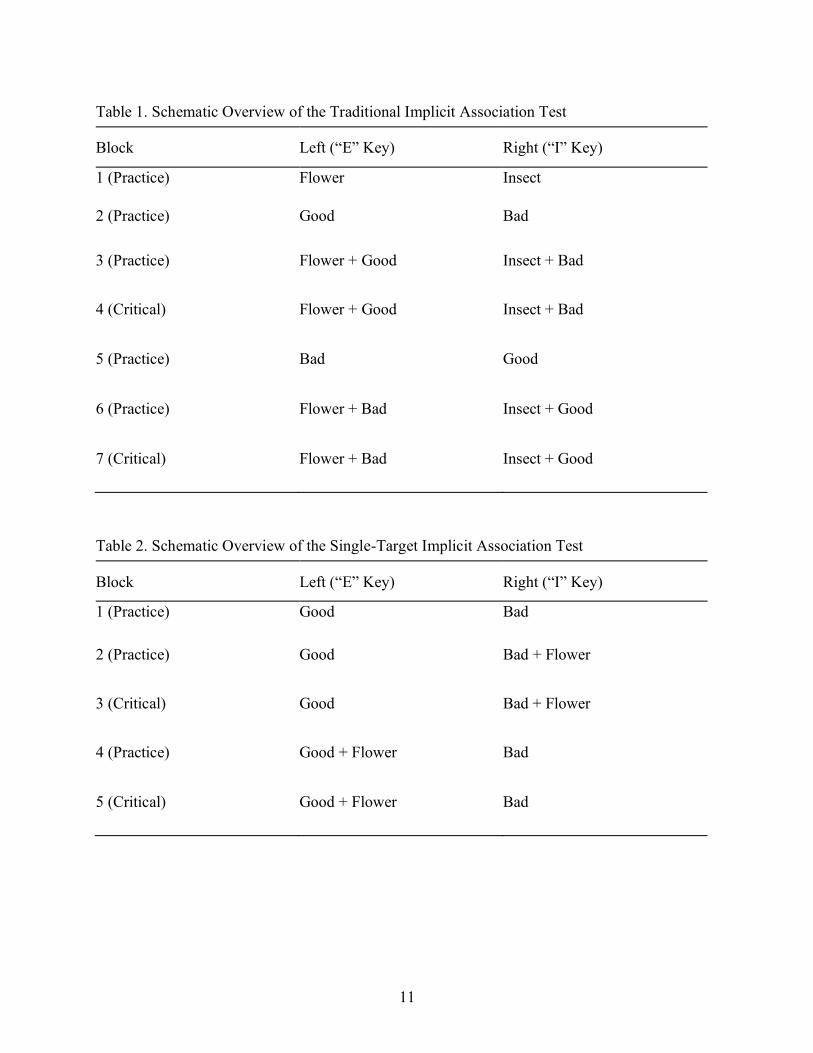
For example, Greenwald et al. (1998) describe an IAT to assess attitudes toward flowers
and insects using an evaluative attribute (categories of good and bad). Participants classified
stimulus words as flowers (e.g., tulip, rose, etc.) by pressing the “E” key or as insects (e.g., ant,
5
bee, etc.) by pressing the “I” key) as fast as possible in the first block of 20 trials. In the second
block of 20 trials, words were classified as good (e.g., wonderful, beautiful, etc.) or bad (e.g.,
awful, nasty, etc.) by pressing the “E” key or “I” key. A category and attribute are paired in the
third block of 20 trials (flower + good and insect + bad). This is called a “compatible” block
because the category and attribute are paired in the hypothesized manner. The fourth block uses
the same sorting procedure as the third block except that the fourth block includes 40 trials.
Attribute categories shift sides in block five with “bad” on the left and good on the right, and
subjects practice classifying only attribute stimuli for 20 trials. The sixth and seventh blocks use
the same sorting procedures as the third and fourth blocks with the reversed pairing of the
category and attribute (flower + bad and insect + good). These are called “incompatible” blocks
because the category and attribute are paired in a non-hypothesized manner. The IAT score is
based on the difference in mean response latencies between the compatible and incompatible
blocks. As the mean response latency increases, the strength of association between the category
and attribute of the particular pair decreases as compared to the other pair (Lane et al., 2007).
Greenwald et al. (2002) and Lane et al. (2007) provide evidence that the IAT is less
susceptible to contamination related to impression management and inaccurate self-knowledge
artifacts. Specifically, Greenwald et al. (1998) proposed that the IATs “may reveal attitudes and
other automatic associations even for participants who prefer not to express those attitudes” (p.
1464). For instance, an individual might not show negative feelings towards coworkers because
he or she does not want to be isolated by his or her coworkers in the workplace. Besides that, an
individual’s self-awareness might not truly represent how he or she will act and respond in
relevant situations. For instance, an individual may explicitly state he or she does not have a
prejudicial bias against minorities but show prejudicial behavior during interaction with others.
6
The Single – Target Implicit Association Test
Other than the traditional IAT, which employs bipolar target and attribute categories,
another version of IAT, the single-target IAT (ST-IAT), was developed by Wigboldus et al.
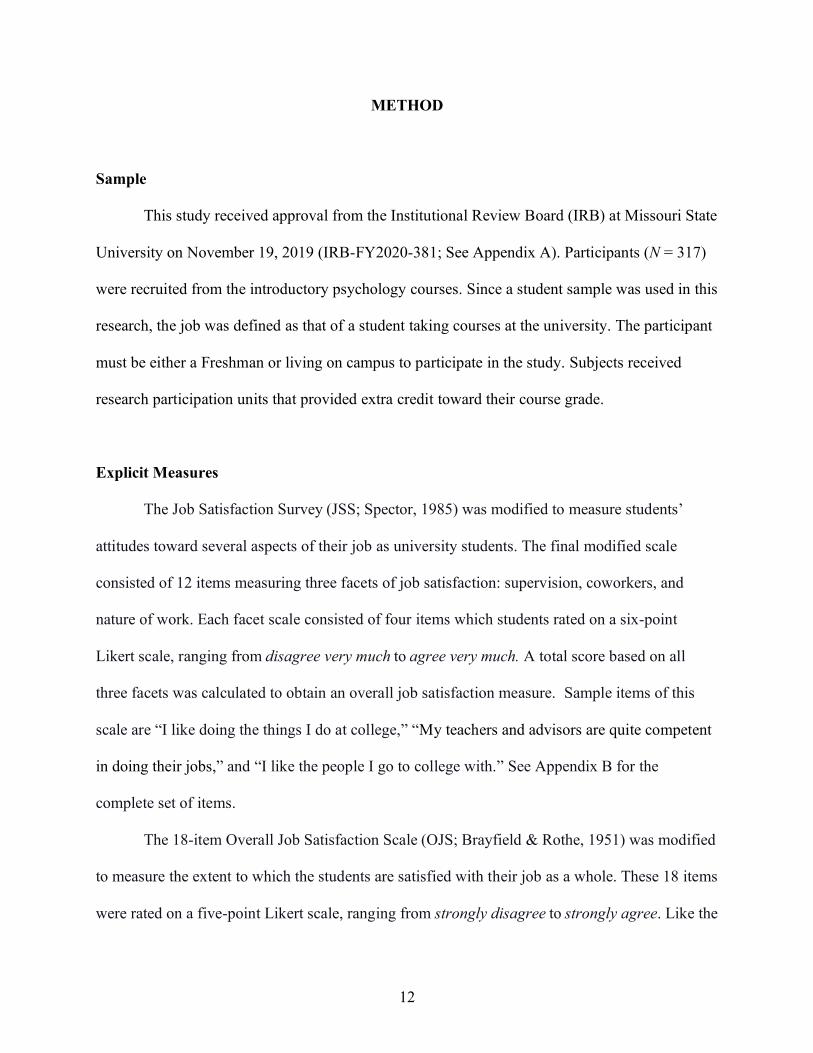
(2004) in an attempt to measure single concepts more successfully. The ST-IAT used a
procedure similar to the traditional IAT with the exception that the ST-IAT only has one target
category. Since the ST-IAT only measures one category, only five blocks are needed instead of
seven by eliminating the first block and the fifth block of the traditional IAT (see Table 2). For
example, an ST-IAT can be used to measure implicit attitudes towards flowers (one category)
with two attribute labels (good and bad). The first block requires participants to sort stimulus
words to attribute labels of good (upper left corner) and bad (upper right corner) instead of the
category. The critical block added flower category to either the upper left or right corner
depending on the block order on top of the attribute words.
The Personalized Implicit Association Test
Olson and Fazio (2004) proposed an alternative form of IAT to decrease the
contamination of the “extrapersonal associations,” which refers to “associations that are available
in memory but irrelevant to the perceived likelihood of personally experiencing a positive or
negative outcome on interaction with the attitude object” (p. 653). The authors argued that three
features from the traditional IAT might lead to extrapersonal associations. Firstly, the category
labels (e.g., “pleasant” and “unpleasant”) could have normative implication in which the
stimulus word (e.g., wonderful, crash) presented on the screen is automatically categorized to the
category of “pleasant” or “unpleasant,” and it does not necessarily represent the attitudes of the
respondents. Secondly, the stimulus words for the “pleasant” and “unpleasant” attribute
7
categories are typically normative positive or negative, which is either like or dislike by
everyone universally. Lastly, the traditional IAT will show a red letter “X” error feedback if the
participants sorted the stimulus word incorrectly, which illustrates the correct response
normatively. Hence, the presence of such normative information might influence one’s attitudes
on the performance of the sorting tasks (Olson & Fazio, 2004).
Olson and Fazio (2004) developed a “personalized” IAT by making modifications to the
traditional IAT to reduce the influence of normative information. They changed the attribute
labels of “pleasant” and “unpleasant” to “I like” and “I don’t like.” Additionally, they removed
the red letter “X” error feedback in the personalized IAT as the modified version is measuring
one’s preference on the stimulus word rather than sorting it to the normative right category. Their
efforts of personalizing the IAT improved the correlations with the explicit measures of the same
construct (Boyd, 2017).
Implicit Job Satisfaction
Sumner and Haines (2004) measured implicit job satisfaction by assessing the strength
between the category (my job/not my job) and valence (pleasant/unpleasant). Specifically,
participants classified the stimuli to the category of “my job” and “not my job” paired with
“pleasant” and “unpleasant.” The final averaged response latency indicates the participants’ level
of job satisfaction with stimulus words related to their job and not related to their job. The results
of their implicit job satisfaction measure yielded significant moderate correlations (r = .38, r =
.36) with the Job Descriptive Index (JDI)’s Work subscale (α = .90) and the short form of
Minnesota Satisfaction Questionnaire (MSQ; α = .89), respectively. Although JDI’s Work
subscale is correlated with their implicit job satisfaction measure, they found nonsignificant
8
correlations between implicit job satisfaction measure and JDI subscales of Pay, Promotions,
Coworker, and Supervisor, suggesting that implicit and explicit measures may have different
measurement characteristics (Haines & Sumner, 2006). The authors added that they are only able
to interpret the findings based on the JDI’s Work subscale as participants classified words to the
category that represents or does not represent their job. Since the classification of words was
different for each participant (e.g., lawyer vs. accounting vs. custodial work), the individual and
job differences were present, making these confounds difficult to rule out (Boyd, 2017).
Boyd (2010) used the Single Target IAT (ST-IAT) to assess implicit job satisfaction with
other explicit job satisfaction measures and other work-related attitudes and behaviors among
participants in the customer service field. Boyd (2010) found significant small correlations of
implicit job satisfaction measures with explicit measures of MSQ (r =.15) and OJS (r = .16),
suggesting construct validity among these measures. Additionally, Boyd (2010) also found the
relationship between the ST-IAT job satisfaction measure with other explicit affective
commitment measures, job involvement, lateness frequency, and turnover intention. However,
no relationship was found between the ST-IAT job satisfaction measure with organizational
citizenship behaviors, counterproductive work behaviors, or other lateness and absenteeism
measures.
Boyd (2017) extended her 2010 study by proposing a personalized implicit job
satisfaction measure of the ST-IAT (P-IAT) to improve the accuracy of the implicit job
satisfaction measure, increase the correlations with explicit measures targeting on work-related
attitudes and behaviors, and increase understanding of job satisfaction conduct in two separate
studies.
9
In Study 1, Boyd (2017) used the multitrait-multimethod design (MTMM; Campbell &
Fiske, 1959) to assess the implicit (ST-IAT and P-IAT) and explicit measures of the same
construct to find construct validity evidence. Specifically, the same construct should be related
and differentiated, such that the similar constructs should illustrate a stronger relationship than
different constructs to show convergent and discriminant validity. The explicit and implicit
measures of job satisfaction were used to examine convergent validity, and attitudes towards
Christianity (Wigboldus et al., 2004) were used to examine discriminant validity as these two
constructs should not overlap with each other. In Study 2, Boyd (2017) examined the convergent
and discriminant validity of P-IAT with both explicit and implicit measures of work-related
attitudes and behaviors, including organizational commitment, job involvement, organizational
citizenship behavior, counterproductive work behavior, absenteeism, lateness, turnover intention,
and other perspective items.
Surprisingly, Boyd (2017) did not find any significant relationships between P-IAT with
explicit job satisfaction measures in both studies. A significant and stronger relationship with
better convergent validity was found between the ST-IAT with all explicit job satisfaction
measures compared to the previous research (i.e., Boyd, 2010). Boyd (2017) found weak
convergent and discriminant validity for ST-IAT and P-IAT job satisfaction measures for Study
1 (r = .18) and Study 2 (r = .21). Additionally, the ST-IAT was significantly correlated with job
involvement and counterproductive work behaviors. Higher correlations between the ST-IAT,
organizational citizenship behaviors, and counterproductive work behaviors were found when
participants gave ratings from other’s perspectives than their own perspectives.
The current study sought to replicate and extend the work of Boyd (2017), who
developed and validated personalized implicit measures of job satisfaction with a sample of
10
subjects who held jobs in customer service. This study examines the psychometric properties of
student-focused measures of satisfaction and their relationships with theoretically related
measures. However, since the current study was conducted in a university environment, only
three of the facets of job satisfaction that Boyd examined – the nature of work (the work itself),
supervisor relations (supervision), and coworker relations (coworkers). Three personalized IATs
were constructed using Boyd’s five-block format and procedure. In addition, three single-target
IATs were developed that followed the standard (non-personalized) five-block procedure. In
accord with Boyd’s multitrait-multimethod design (MTMM; Campbell & Fiske, 1959), explicit
measures of job satisfaction and measures of an unrelated construct involving Christianity were
included in order to assess the construct validity of the implicit measures. The hierarchical
confirmatory factor analysis (CFA) of nested latent trait models described by Widaman (1985)
was used to test hypotheses regarding convergent and discriminant validity.
Hypothesis
It is hypothesized that the implicit measures of job satisfaction (the Work Itself,
Coworkers, and Supervision) will be related to the explicit measures (convergent validity) and
unrelated to the explicit and implicit attitudes towards Christianity measures (discriminant
validity). Several MTMM models will be tested to justify these hypotheses. Similar to Boyd
(2017), when examining these measures using the MTMM design, each measure is hypothesized
to load on a latent trait factor and a latent method factor, creating a total of four latent factors:
implicit and explicit method factors, with job satisfaction and attitudes towards Christianity trait
factors.
11
Table 1. Schematic Overview of the Traditional Implicit Association Test
Block Left (“E” Key) Right (“I” Key)
1 (Practice) Flower Insect
2 (Practice) Good Bad
3 (Practice) Flower + Good Insect + Bad
4 (Critical) Flower + Good Insect + Bad
5 (Practice) Bad Good
6 (Practice) Flower + Bad Insect + Good
7 (Critical) Flower + Bad Insect + Good
Table 2. Schematic Overview of the Single-Target Implicit Association Test
Block Left (“E” Key) Right (“I” Key)
1 (Practice) Good Bad
2 (Practice) Good Bad + Flower
3 (Critical) Good Bad + Flower
4 (Practice) Good + Flower Bad
5 (Critical) Good + Flower Bad
12
METHOD
Sample
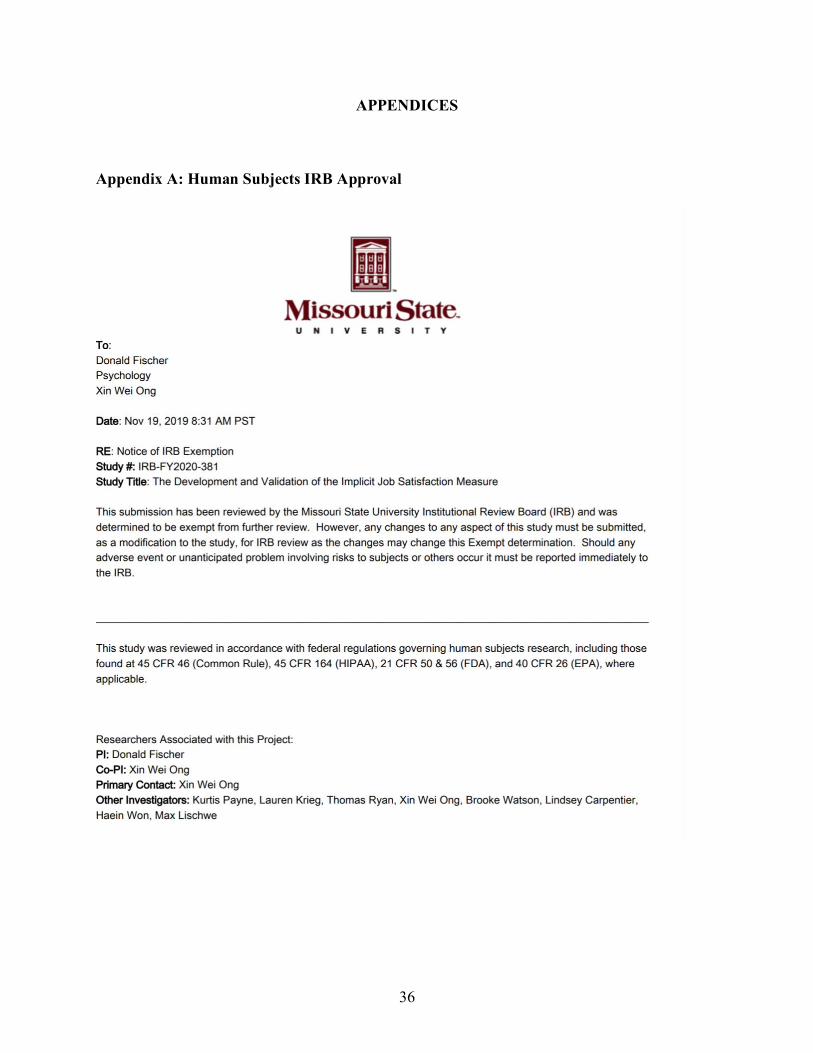
This study received approval from the Institutional Review Board (IRB) at Missouri State
University on November 19, 2019 (IRB-FY2020-381; See Appendix A). Participants (N = 317)
were recruited from the introductory psychology courses. Since a student sample was used in this
research, the job was defined as that of a student taking courses at the university. The participant
must be either a Freshman or living on campus to participate in the study. Subjects received
research participation units that provided extra credit toward their course grade.
Explicit Measures
The Job Satisfaction Survey (JSS; Spector, 1985) was modified to measure students’
attitudes toward several aspects of their job as university students. The final modified scale
consisted of 12 items measuring three facets of job satisfaction: supervision, coworkers, and
nature of work. Each facet scale consisted of four items which students rated on a six-point
Likert scale, ranging from disagree very much to agree very much. A total score based on all
three facets was calculated to obtain an overall job satisfaction measure. Sample items of this
scale are “I like doing the things I do at college,” “My teachers and advisors are quite competent
in doing their jobs,” and “I like the people I go to college with.” See Appendix B for the
complete set of items.
The 18-item Overall Job Satisfaction Scale (OJS; Brayfield & Rothe, 1951) was modified
to measure the extent to which the students are satisfied with their job as a whole. These 18 items
were rated on a five-point Likert scale, ranging from strongly disagree to strongly agree. Like the
13
JSS, a total score of all items was calculated to obtain an overall job satisfaction score from this
scale. Sample items of this scale are “Most days I am enthusiastic about my college work” and “I
definitely dislike my college (reverse-scored).” See Appendix C for the complete set of items for
this scale.
Consistent with Boyd (2017), an explicit measure of one’s attitude toward Christianity
developed by Wigboldus et al. (2004) was included to serve as the discriminant validity measure
for this study. In accord with Boyd and Wigboldus, it was hypothesized that one’s attitude
toward Christianity should be unrelated to their job satisfaction. This measure consisted of three
items with responses on Likert scales. The first two items were rated on a seven-point Likert
scale, ranging from totally disagree to totally agree with items like “I am positive about
Christianity.” The third item was rated on a nine-point Likert scale, ranging from extremely
negatively (-4) to extremely positively (4) on “How positively or negatively do you evaluate the
Christian religion?” Appendix D contains the items for this scale.
Finally, demographic questions involving gender, age, English as the primary language,
race/ethnicity, and years of college experience were also included.
Implicit Measures
Three single target job satisfaction IATs (ST-IAT) were created, one for each job
satisfaction facet, following the guidelines provided by Lane et al. (2007) and Wigboldus et al.
(2004) using Inquisit software program by Millisecond Software. The schematic representation
of the five-block single-target IAT is displayed in Table 2 above. Three personalized job
satisfaction IATs (P-IAT) were developed to assess job satisfaction facets following Boyd’s
(2017) guidelines. These personalized IATs employed the same five-block single-target IAT
14
procedure displayed in Table 2 above. However, the attribute labels of “Good” and “Bad” were
changed to “I like” and “I don’t like.” The error feedback message was eliminated because the
subjects were sorting the items based on their perceptions of whether they liked the items.
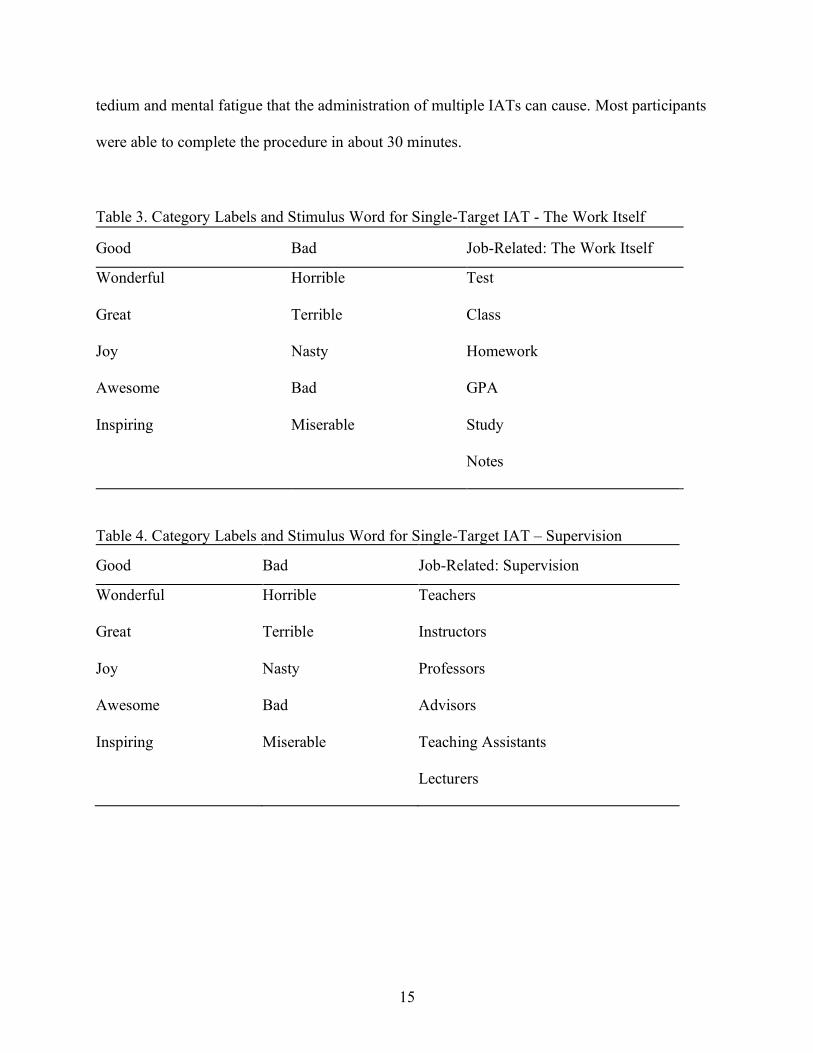
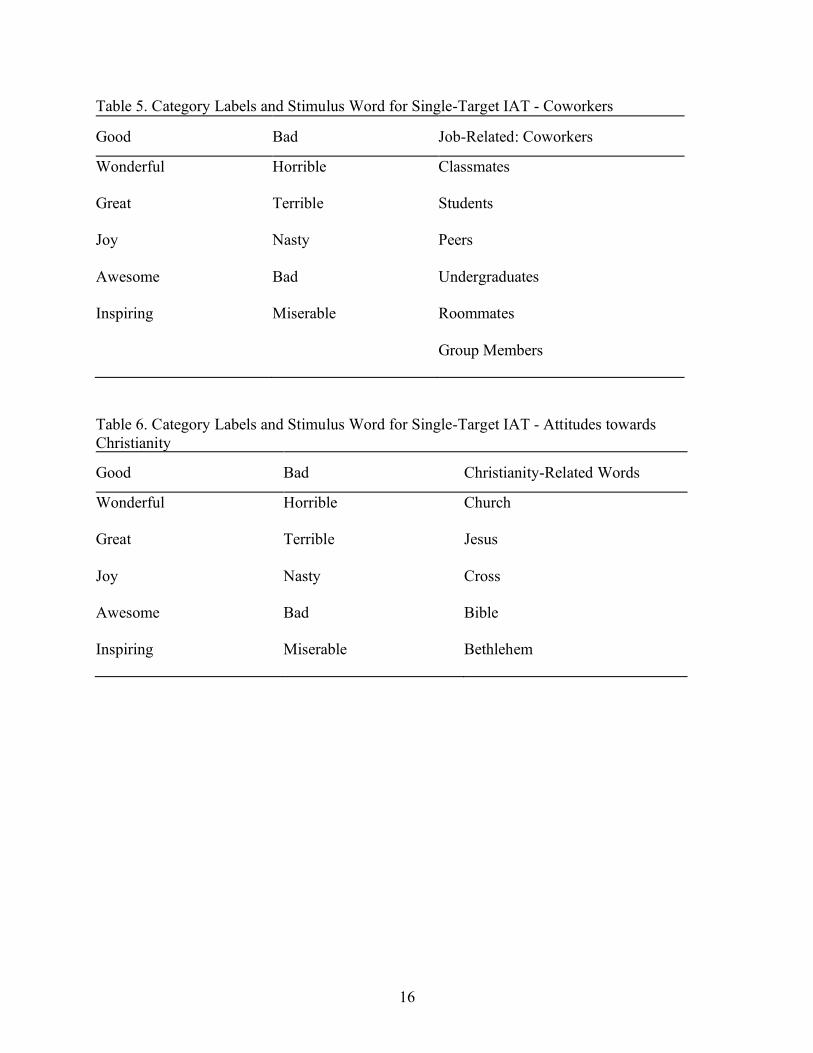
The D-scoring method described by Greenwald et al. (2003) was used to calculate all
IAT effects of the implicit job satisfaction measures. Classification error rates, the variance of D-
scores, and internal consistency coefficients for alternative stimuli and category labels were
explored through a series of pilot tests before the final set was selected. The category labels and
stimuli are displayed in Tables 3 – 6.
Procedure
All measures were administered to subjects in a university computer lab. Once the
participants arrived in the computer lab, a research assistant granted research credits to the
participants and verbally brief participants with the informed consent statement presented on the
screen (see Appendix E for this statement). Subjects were told, “the purpose of this study is to
develop implicit measures of how we perceive and evaluate the nature of work, supervision, and
coworkers in the context of our “jobs” as students ... when responding to all items, we want you
to be thinking about your experiences as a student at Missouri State University.”
The order in which measures were administered was constant across subjects: the
demographic items, the three personalized IATs, the modified JSS facet scales, the single-target
IAT for the work itself, the modified OJS satisfaction scale, the single-target IAT for
supervision, the single-target IAT for coworkers, the explicit Christianity scale, and the
Christianity IAT. Explicit measures were interspersed with IATs in an effort to combat the
15
tedium and mental fatigue that the administration of multiple IATs can cause. Most participants
were able to complete the procedure in about 30 minutes.
Table 3. Category Labels and Stimulus Word for Single-Target IAT - The Work Itself
Good Bad Job-Related: The Work Itself
Wonderful Horrible Test
Great Terrible Class
Joy Nasty Homework
Awesome Bad GPA
Inspiring Miserable Study
Notes
Table 4. Category Labels and Stimulus Word for Single-Target IAT – Supervision
Good Bad Job-Related: Supervision
Wonderful Horrible Teachers
Great Terrible Instructors
Joy Nasty Professors
Awesome Bad Advisors
Inspiring Miserable Teaching Assistants
Lecturers
16
Table 5. Category Labels and Stimulus Word for Single-Target IAT - Coworkers
Good Bad Job-Related: Coworkers
Wonderful Horrible Classmates
Great Terrible Students
Joy Nasty Peers
Awesome Bad Undergraduates
Inspiring Miserable Roommates
Group Members
Table 6. Category Labels and Stimulus Word for Single-Target IAT - Attitudes towards Christianity
Good Bad Christianity-Related Words
Wonderful Horrible Church
Great Terrible Jesus
Joy Nasty Cross
Awesome Bad Bible
Inspiring Miserable Bethlehem
17
RESULTS
Sample
Data were cleaned by removing excessive missing values and incomplete data on one or
more IAT responses. Additionally, IATs responses with high error rates were removed as well,
leaving the IATs with the following correct percentages: 80% correct for ST-IATs The Work
Itself and Supervision, 79% correct for ST-IAT Coworkers, and 77.5% correct for ST-IAT
Attitudes towards Christianity. No error rates were calculated for P-IATs as the participants
categorize stimulus words based on their preferences instead of sorting the stimulus words into
the correct categories. A total of 49 cases were eliminated, leaving the final sample of 268
participants. Of the remaining subjects, 70.3% (N = 189) identified themselves as female, and
29.4% (N = 79) of them identified themselves as males. Participants’ ages ranged from 18 to 47
years old (Mage= 19), with 96% of them under 21 years old. The demographic composition of the
sample was: 81% White/ Caucasian, 5.6% multiple ethnicities, 5.2% Black/African American,
4.5% Asian/Pacific Islander, 3.4% Hispanic/Latino, and .4% Native Hawaiian/Other Pacific
Islander. Most of the samples (90.7%) were freshmen with an average 1.14 years of college
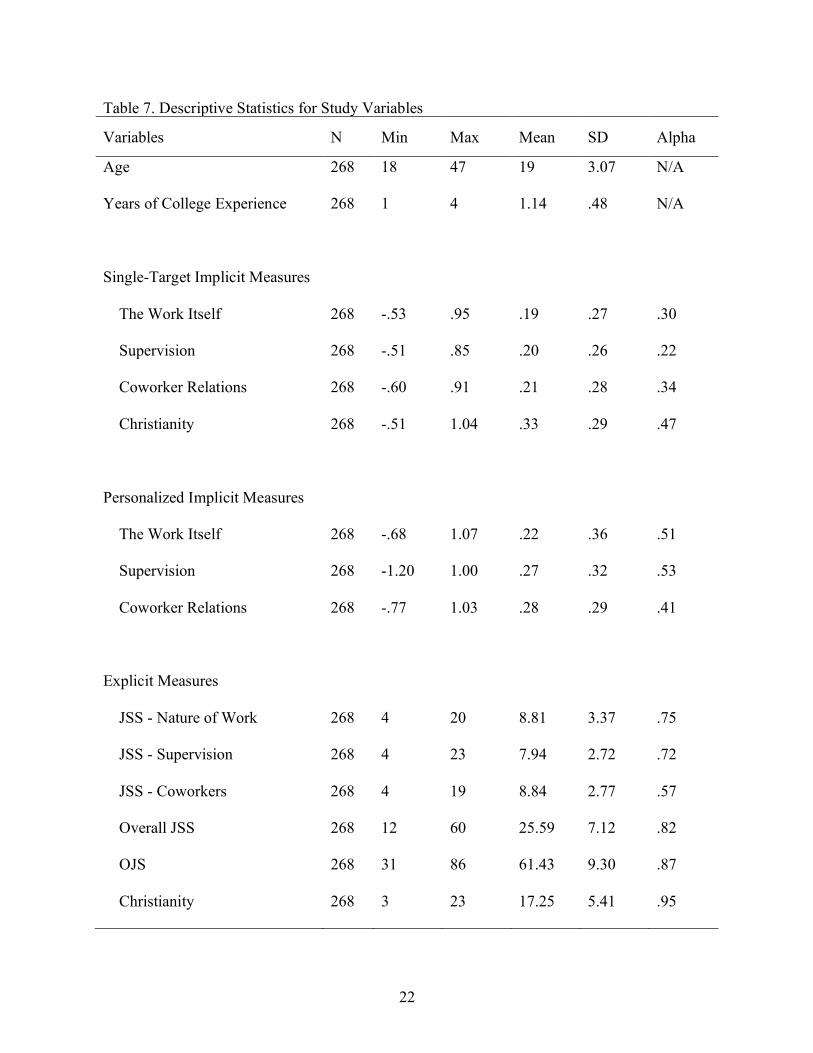
experience. Descriptive statistics for study variables are displayed in Table 7.
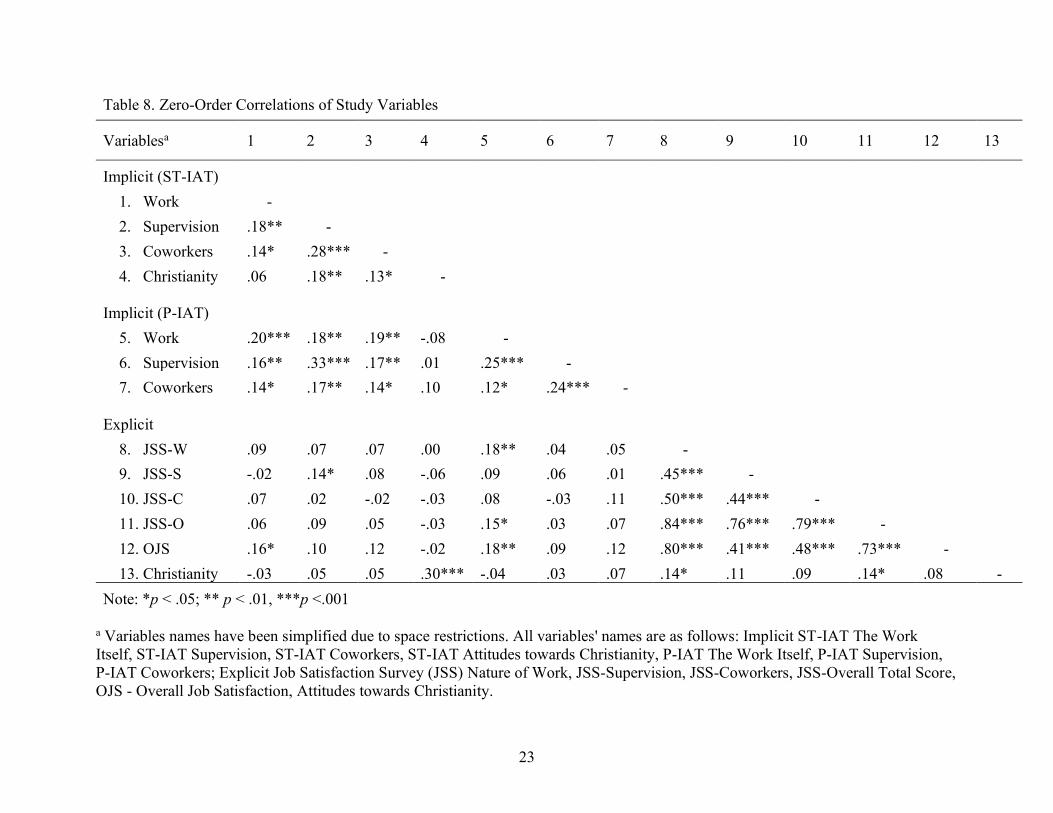
By examining the zero-order correlation, we found a weaker relationship between the
implicit and explicit measures of the construct variables than expected. For instance, there is no
significant relationship between the correlation of ST-IAT The Work Itself and JSS Work’s
subscale (r = .09) and the correlation between P-IAT The Work Itself and JSS Work’s subscale
was weak (r = .18, p <.01). The zero-order correlation results showed that most correlations
between implicit and explicit measures were small and nonsignificant according to Cohen’s
18
(1992) standards of Pearson’s r (.10 for “small,” .30 for “moderate,” and .50 for “strong” effect
sizes). Of the 78 pairs of correlations, only 35 pairs were significant. All implicit measures
illustrated poor reliabilities and failed to meet Nunnally’s (1978) recommendations of .70. These
issues will be further addressed in the discussion section. Notably, most explicit measures
illustrated good reliability and met Nunnally’s (1978) recommendations except for the Job
Satisfaction Survey subscale of coworkers. See Table 8 for Zero-Order Correlations of Study
Variable.
Hypothesis Testing
Confirmatory Factor Analysis (CFA) model comparisons were used to examine the
convergent and discriminant validity evidence through the goodness-of-fit statistics for five
different models. According to Schumacker and Lomax (2010), it is better to have a smaller chi-
square value that is close to the degrees of freedom and not significant. According to Bentler’s
(1990) recommendation, the CFI values of each model should be greater than .90 to consider as a
“good fit” model. Byrne (2010) recommended the Root Mean Square Error of Approximation
(RMSEA) value to be less than .08 for a good fitting model. Model 1 is the least restrictive
model where both method and trait factors are freely correlated. Then, the more restrictive
models (Models 2 – 5) are compared with Model 1.
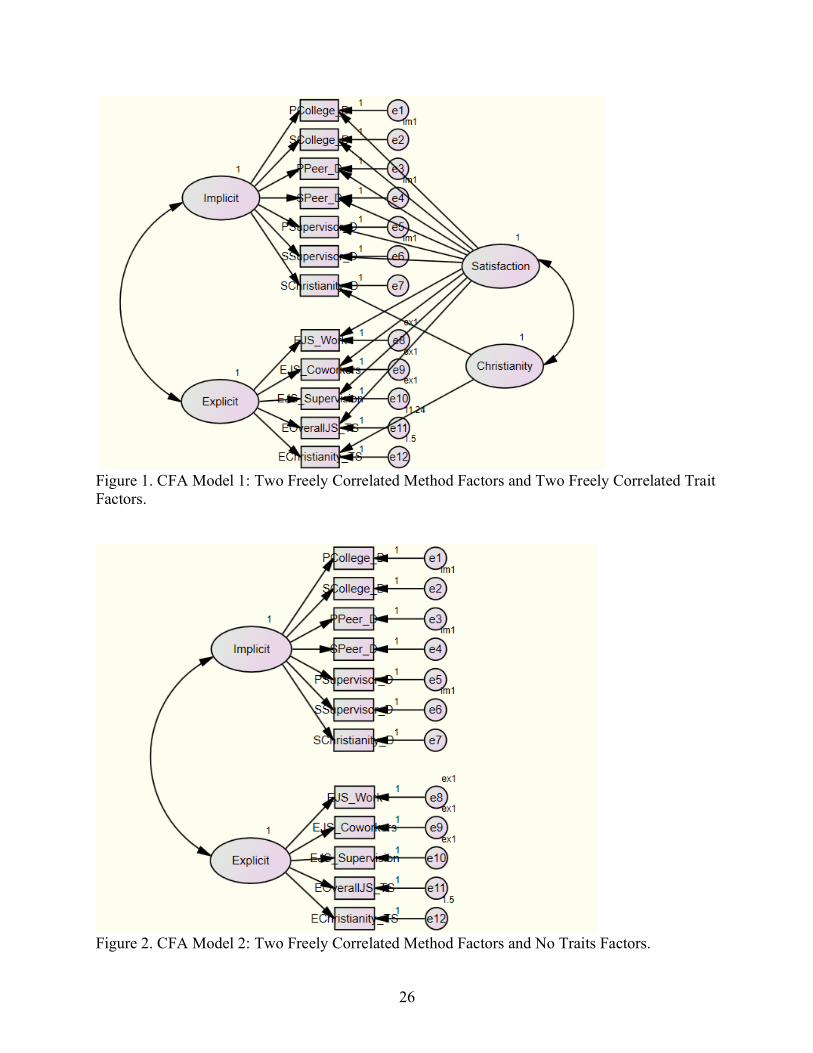
Figure 1 illustrated the least restrictive model (Model 1) for this study. As mentioned
above, Model 1 has two freely correlated method factors (e.g., implicit and explicit) and two
freely correlated trait factors (e.g., satisfaction and attitudes towards Christianity). Model 2
consists of two freely correlated method factors and no trait factors (see Figure 2). Model 2 is
more restrictive than Model 1 because the trait factors were excluded in the comparison. Model 3
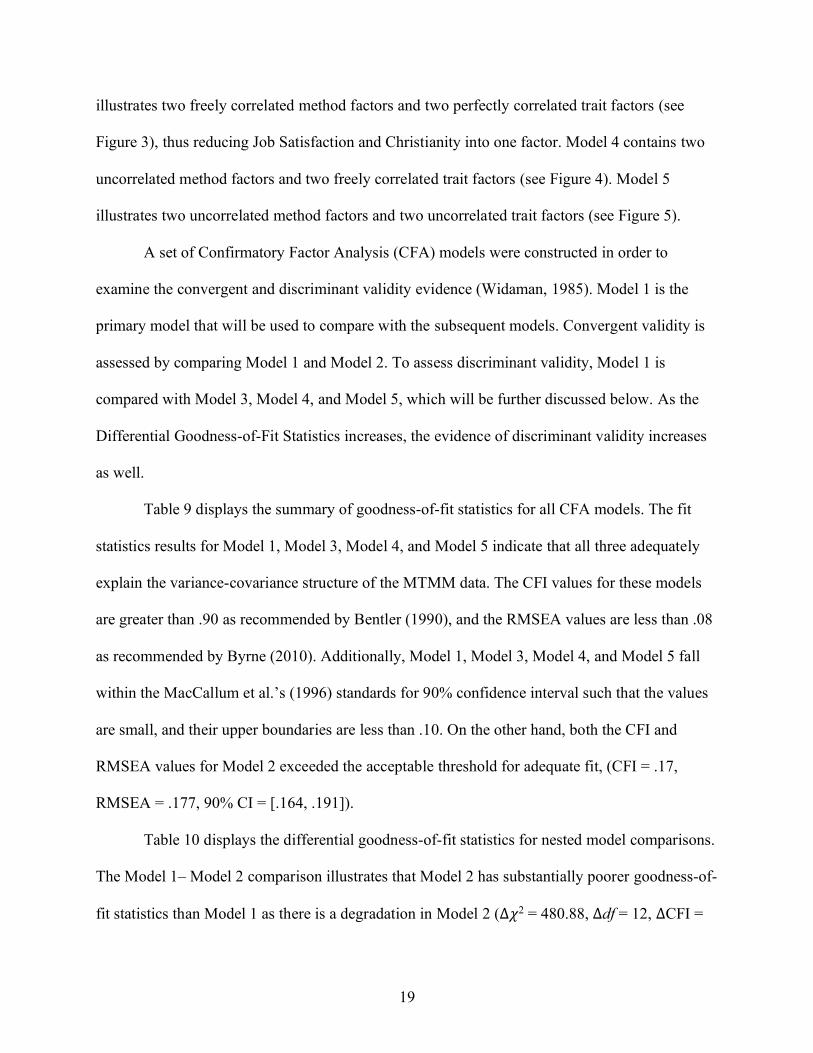
19
illustrates two freely correlated method factors and two perfectly correlated trait factors (see
Figure 3), thus reducing Job Satisfaction and Christianity into one factor. Model 4 contains two
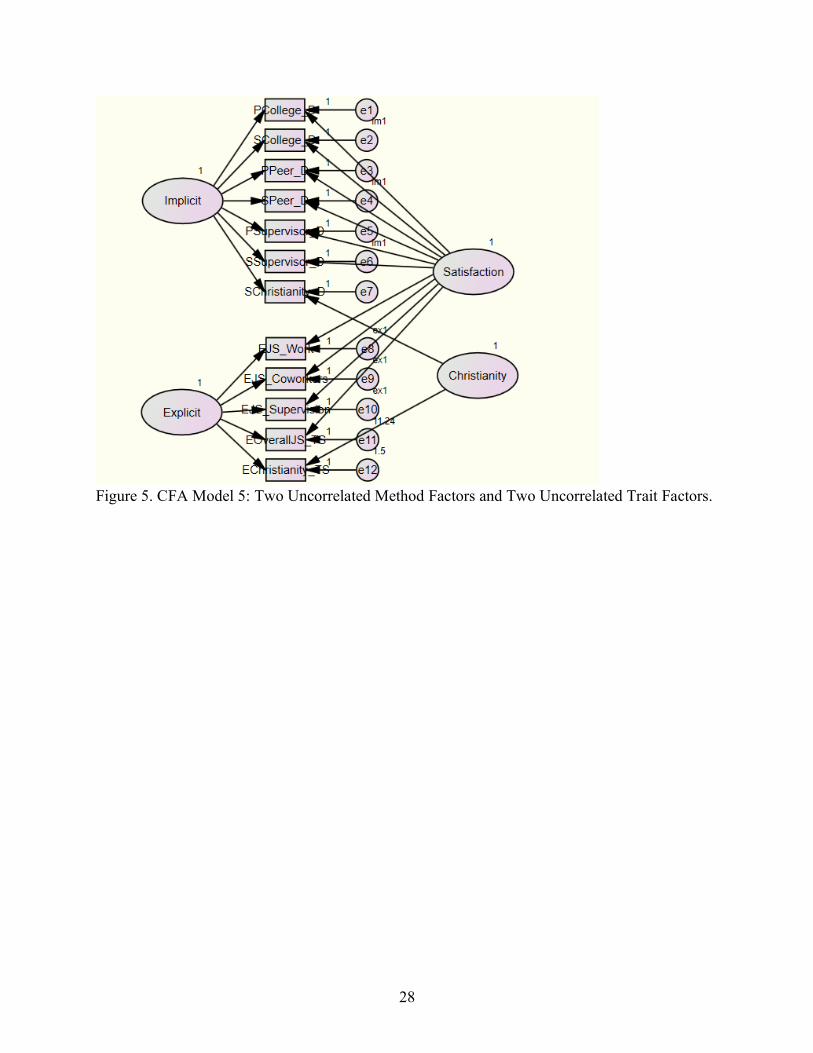
uncorrelated method factors and two freely correlated trait factors (see Figure 4). Model 5
illustrates two uncorrelated method factors and two uncorrelated trait factors (see Figure 5).
A set of Confirmatory Factor Analysis (CFA) models were constructed in order to
examine the convergent and discriminant validity evidence (Widaman, 1985). Model 1 is the
primary model that will be used to compare with the subsequent models. Convergent validity is
assessed by comparing Model 1 and Model 2. To assess discriminant validity, Model 1 is
compared with Model 3, Model 4, and Model 5, which will be further discussed below. As the
Differential Goodness-of-Fit Statistics increases, the evidence of discriminant validity increases
as well.
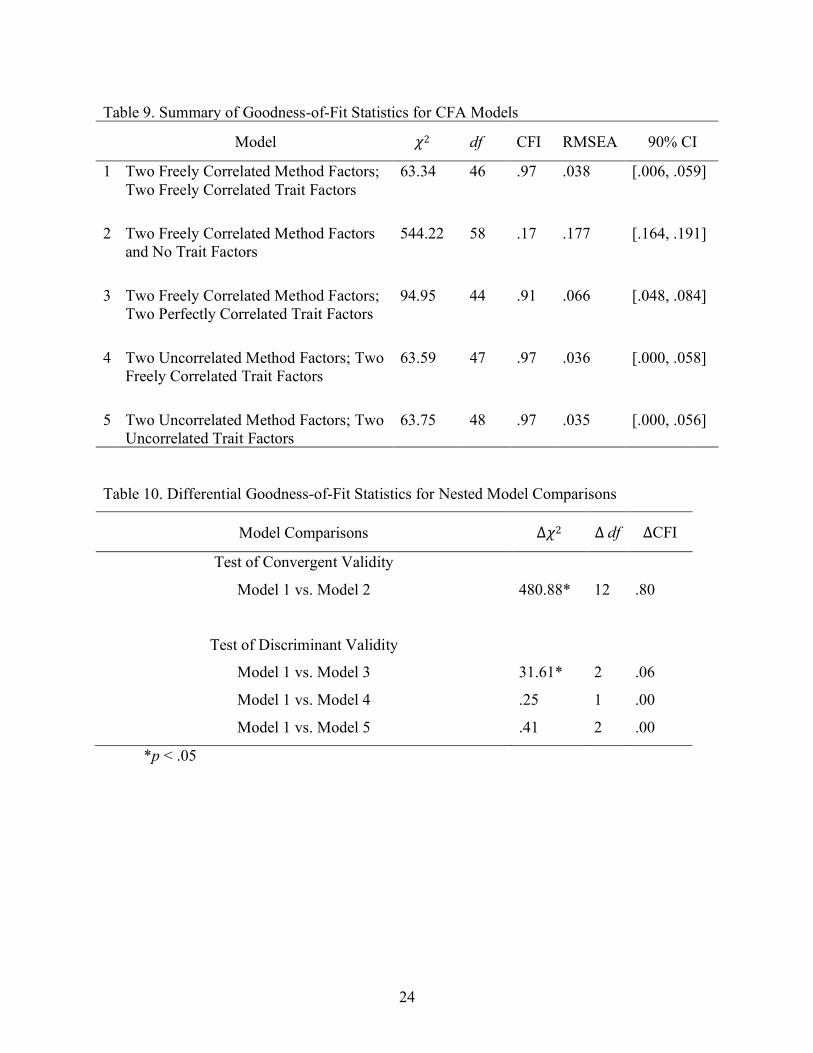
Table 9 displays the summary of goodness-of-fit statistics for all CFA models. The fit
statistics results for Model 1, Model 3, Model 4, and Model 5 indicate that all three adequately
explain the variance-covariance structure of the MTMM data. The CFI values for these models
are greater than .90 as recommended by Bentler (1990), and the RMSEA values are less than .08
as recommended by Byrne (2010). Additionally, Model 1, Model 3, Model 4, and Model 5 fall
within the MacCallum et al.’s (1996) standards for 90% confidence interval such that the values
are small, and their upper boundaries are less than .10. On the other hand, both the CFI and
RMSEA values for Model 2 exceeded the acceptable threshold for adequate fit, (CFI = .17,
RMSEA = .177, 90% CI = [.164, .191]).
Table 10 displays the differential goodness-of-fit statistics for nested model comparisons.
The Model 1– Model 2 comparison illustrates that Model 2 has substantially poorer goodness-of-
fit statistics than Model 1 as there is a degradation in Model 2 (∆𝜒2 = 480.88, ∆df = 12, ∆CFI =
20
.80). This represents convergent validity evidence for the trait factors such that the method
factors cannot describe the relationships between study variables by themselves. Specifically, the
CFI (.97) and RMSEA (.038) values for Model 1 show a better fitting model than CFI (.17) and
RMSEA (.177) values for Model 2. The results for Model 1 fall within the threshold
recommended by Bentler (1990) and Bryne (2010), whereas the fit statistics results for Model 2
falls outside the recommended threshold.
To assess discriminant validity, Model 1 is compared with three different models, which
are Model 1 – Model 3, Model 1 – Model 4, and Model 1 – Model 5. The Model 1 – Model 3
comparison illustrates evidence for discriminant validity as the differences in goodness-of-fit
statistics between Model 1 – Model 3 were significant. However, although the Chi-Square test
for differences between the models was statistically significant ((∆𝜒2 = 480.88, p <.05), the
model fit statistics for Model 3 (CFI = .91, RMSEA = .066, 90% CI = [.048, .084]) fell well
within the established guidelines for determining a good fit, which raises the prospect that Model
1 may over-fit the data. This prospect will be further examined in the next section. The Model 1
– Model 4 comparison uses the same logic as the Model 1 – Model 3 comparison in reverse, in
that Model 4 requires the method factors to be uncorrelated. The lack of any degradation in the
fit statistics (∆𝜒2 = .25, ∆df = 1, ∆CFI = .00) indicates that there is no common method variance
across the two sets of explicit and implicit measures. The lack of any degradation in the fit
statistics for the Model 1 – Model 5 comparison (∆𝜒2 = .41, ∆df = 2, ∆CFI = .00) illustrates more
evidence of discriminant validity since Model 5 requires both method and trait factors to be
uncorrelated with each other.
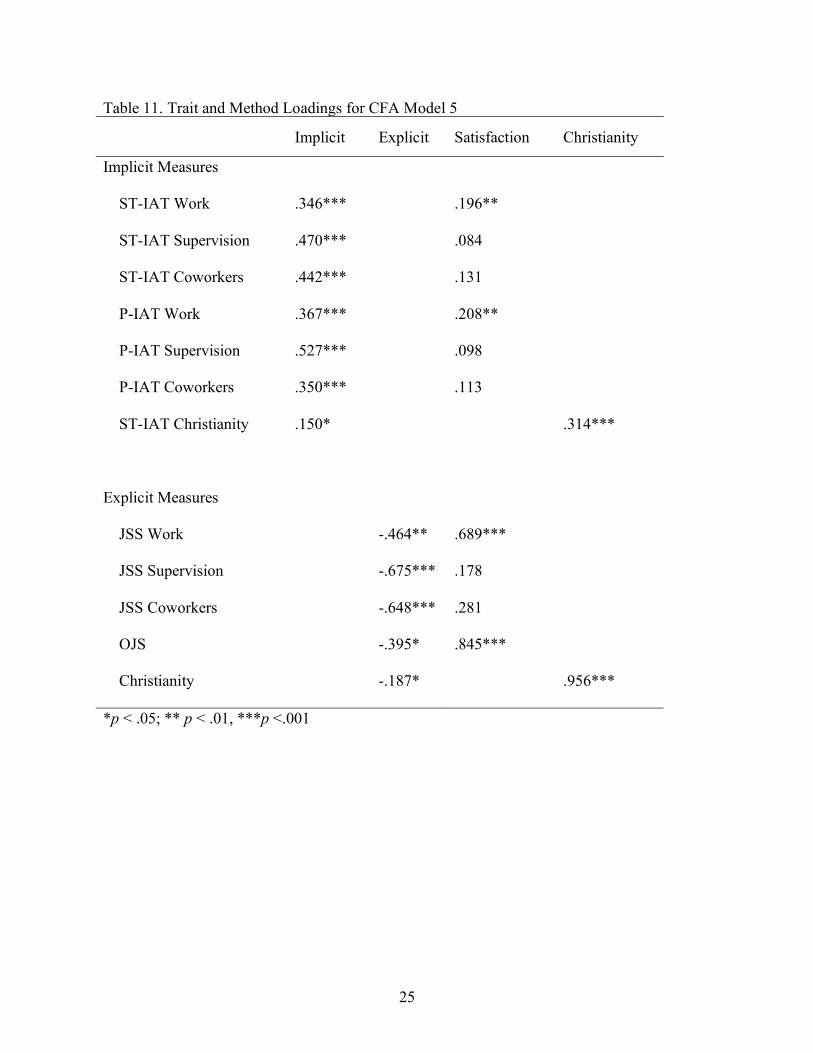
The factor loadings containing all study variables for Model 5 are displayed in Table 11.
These results indicate that three-fourths of the indicator variables had significant loadings on the
21
hypothesized factors (18 out of 24 loadings were significant), which provides moderate support
for the construct validity of the measures. However, only two out of six implicit measures loaded
on the trait satisfaction factor significantly.
22
Table 7. Descriptive Statistics for Study Variables
Variables N Min Max Mean SD Alpha
Age 268 18 47 19 3.07 N/A
Years of College Experience 268 1 4 1.14 .48 N/A
Single-Target Implicit Measures
The Work Itself 268 -.53 .95 .19 .27 .30
Supervision 268 -.51 .85 .20 .26 .22
Coworker Relations 268 -.60 .91 .21 .28 .34
Christianity 268 -.51 1.04 .33 .29 .47
Personalized Implicit Measures
The Work Itself 268 -.68 1.07 .22 .36 .51
Supervision 268 -1.20 1.00 .27 .32 .53
Coworker Relations 268 -.77 1.03 .28 .29 .41
Explicit Measures
JSS - Nature of Work 268 4 20 8.81 3.37 .75
JSS - Supervision 268 4 23 7.94 2.72 .72
JSS - Coworkers 268 4 19 8.84 2.77 .57
Overall JSS 268 12 60 25.59 7.12 .82
OJS 268 31 86 61.43 9.30 .87
Christianity 268 3 23 17.25 5.41 .95
23
Table 8. Zero-Order Correlations of Study Variables
Variablesa 1 2 3 4 5 6 7 8 9 10 11 12 13
Implicit (ST-IAT) 1. Work - 2. Supervision .18** - 3. Coworkers .14* .28*** - 4. Christianity .06 .18** .13* - Implicit (P-IAT) 5. Work .20*** .18** .19** -.08 - 6. Supervision .16** .33*** .17** .01 .25*** - 7. Coworkers .14* .17** .14* .10 .12* .24*** - Explicit 8. JSS-W .09 .07 .07 .00 .18** .04 .05 - 9. JSS-S -.02 .14* .08 -.06 .09 .06 .01 .45*** - 10. JSS-C .07 .02 -.02 -.03 .08 -.03 .11 .50*** .44*** - 11. JSS-O .06 .09 .05 -.03 .15* .03 .07 .84*** .76*** .79*** - 12. OJS .16* .10 .12 -.02 .18** .09 .12 .80*** .41*** .48*** .73*** - 13. Christianity -.03 .05 .05 .30*** -.04 .03 .07 .14* .11 .09 .14* .08 - Note: *p < .05; ** p < .01, ***p <.001
a Variables names have been simplified due to space restrictions. All variables' names are as follows: Implicit ST-IAT The Work Itself, ST-IAT Supervision, ST-IAT Coworkers, ST-IAT Attitudes towards Christianity, P-IAT The Work Itself, P-IAT Supervision, P-IAT Coworkers; Explicit Job Satisfaction Survey (JSS) Nature of Work, JSS-Supervision, JSS-Coworkers, JSS-Overall Total Score, OJS - Overall Job Satisfaction, Attitudes towards Christianity.
24
Table 9. Summary of Goodness-of-Fit Statistics for CFA Models
Model 𝜒2 df CFI RMSEA 90% CI
1 Two Freely Correlated Method Factors; Two Freely Correlated Trait Factors
63.34 46 .97 .038 [.006, .059]
2 Two Freely Correlated Method Factors
and No Trait Factors 544.22 58 .17 .177 [.164, .191]
3 Two Freely Correlated Method Factors;
Two Perfectly Correlated Trait Factors 94.95 44 .91 .066 [.048, .084]
4 Two Uncorrelated Method Factors; Two
Freely Correlated Trait Factors 63.59 47 .97 .036 [.000, .058]
5 Two Uncorrelated Method Factors; Two
Uncorrelated Trait Factors 63.75 48 .97 .035 [.000, .056]
Table 10. Differential Goodness-of-Fit Statistics for Nested Model Comparisons
Model Comparisons ∆𝜒2 ∆ df ∆CFI
Test of Convergent Validity
Model 1 vs. Model 2 480.88* 12 .80
Test of Discriminant Validity
Model 1 vs. Model 3 31.61* 2 .06
Model 1 vs. Model 4 .25 1 .00
Model 1 vs. Model 5 .41 2 .00
*p < .05
25
Table 11. Trait and Method Loadings for CFA Model 5
Implicit Explicit Satisfaction Christianity
Implicit Measures
ST-IAT Work .346*** .196**
ST-IAT Supervision .470*** .084
ST-IAT Coworkers .442*** .131
P-IAT Work .367*** .208**
P-IAT Supervision .527*** .098
P-IAT Coworkers .350*** .113
ST-IAT Christianity .150* .314***
Explicit Measures
JSS Work -.464** .689***
JSS Supervision -.675*** .178
JSS Coworkers -.648*** .281
OJS -.395* .845***
Christianity -.187* .956***
*p < .05; ** p < .01, ***p <.001
26
Figure 1. CFA Model 1: Two Freely Correlated Method Factors and Two Freely Correlated Trait Factors.
Figure 2. CFA Model 2: Two Freely Correlated Method Factors and No Traits Factors.

27
Figure 3. CFA Model 3: Two Freely Correlated Method Factors and Two Perfectly Correlated Trait Factors.
Figure 4. CFA Model 4: Two Uncorrelated Method Factors and Two Freely Correlated Trait Factors.
28
Figure 5. CFA Model 5: Two Uncorrelated Method Factors and Two Uncorrelated Trait Factors.
29
DISCUSSION
This study sought to extend and replicate the work of Boyd (2017) within the framework
of college students in their learning work roles. More specifically, the purpose of this study was
to develop and validate job satisfaction measures that can be used to assess students’ college
experience and attitudes accurately. According to the model fit statistics, Model 5 (the
hypothesized model) fits the data too well – four factors are more than the number required to
explain the similarities and differences captured in the variance-covariance matrix.
To assess the convergent and discriminant validity of the implicit and explicit measures,
more restrictive models were added and compared with Model 1. The nested model comparisons
indicated that there was a degradation in the fit statistics when there were no latent trait factors
and only method factors (Model 2). In other words, the relationships among variables cannot be
explained by the method variance alone. Although a model containing two method factors and
one trait factor was a poorer fit than a model containing two trait factors, the fit statistics (CFI
and RMSEA) for the single trait model fell well within the generally accepted limits for a good
fit (CFI > .90 and RMSEA < .08). Taken with results of comparisons with models that force both
the method factors and the trait factors to be uncorrelated, this suggests that a model with two
uncorrelated method factors and two perfectly correlated trait factors (one trait factor; Model 3)
may be the best fit for these data. These results differ from those of Boyd (2017), who found
support for a four-factor model. One possible explanation for this finding may be that the
implicit measure of attitudes towards Christianity was essentially uncorrelated with any of the
job satisfaction measures. Additionally, the JSS Work’s subscale and JSS Overall Score are the
only job satisfaction measures that were correlated with the attitudes towards Christianity
30
explicit measure. Lastly, the moderate correlation between the explicit and implicit measures of
attitudes towards Christianity could be easily explained by the common method factor.
A similar suggestion may explain why the implicit measures did not load on the
satisfaction factor. In other words, the implicit measures were essentially uncorrelated with the
explicit measures, and the correlation among the implicit measures was well explained by the
implicit method factor. However, these results, too, differ from those of Boyd (2017) and the
reason for this remains unexplained.
Although pilot tests of the single target and personalized satisfaction IATs suggested they
had adequate psychometric properties, the data for the main sample indicated otherwise. In
particular, the internal consistency coefficients for all implicit measures fell outside Nunnally’s
(1978) recommendation for being “adequate” (.70). This means that the relationships between
the implicit and explicit measures were severely attenuated by measurement error. Indeed, only
five of the 25 correlations in the monotrait-heteromethod rectangle of the MTMM correlation
matrix achieved significance. While most of the correlations in the monotrait-monomethod
triangle for the implicit satisfaction measures achieved significance, these tended to be in
Cohen’s (1992) range for “smaller” effect size (i.e., in the neighborhood of .10 to .30). These
facts help explain the lack of evidence supporting the construct validity of the implicit measures
in the factor loading matrix for the hypothesized model: relationships were severely attenuated
due to unreliability in the implicit measures. Hence, future research should address improving
the psychometric properties of the implicit measures. Additionally, future research should focus
more on finding the relationship between the personalized IAT and single-target IAT to develop
personalized implicit measures that can measure job satisfaction more accurately. The present
study suffered on these fronts.
31
Due to the nature of the sample used in the study, some aspects measured might not be
relevant to the students (e.g., roommates). Although the sample was recruited from the
introductory to psychology courses, only 90.8% of them were freshmen. Additionally, students
are taking multiple courses with multiple instructors during a semester, indicating that they have
several supervisors. Future studies should specify the sample’s requirements (i.e., freshmen only,
thinking about the supervisor as their introductory to psychology course’s instructor) so that the
implicit measures are relevant to the targeted participants and study requirements.
The final caveat of this study regards the overfitting of models. According to Byrne
(2010), the overfitting model “involves the specification of additional parameters in the model
after having determined a criterion that reflects a minimally adequate fit” (p.91). Concerns are
raised by Bentler (1990), Byrne (2010), and MacCallum et al. (1996) when the goodness-of-fit
statistics exceed recommended “good fit” threshold (CFI > .95, RMSEA <.04). The goodness-of-
fit statistics for Model 1, Model 4, and Model 5 are within this range, and hence, the data are
overfitted by the factors in these models. This overfitting could be caused by including additional
parameters that are (a) reflecting non-replicable weak effects, (b) causing standard errors to
inflate significantly, and (c) influence the primary parameters in the model, although the
substantive meaningfulness of these parameters is somewhat ambiguous (Bryne, 2010; Wheaton,
1987). After considering (a) the statistical significance and feasibility of all parameter estimates
and (b) the goodness-of-fit statistics of these models (CFI > .95, RMSEA <.04), I conclude that
my hypothesized model fits the data too well as four factors are more than what is needed to
explain the similarities and differences captured in the variance-covariance matrix.

32
REFERENCES
Bentler, P. M. (1990). Comparative fit indexes in structural models. Psychological Bulletin, 107(2), 238–246. https://doi.org/10.1037/0033-2909.107.2.238
Bowling, N. A., Wagner, S. H., & Beehr, T. A. (2018). The Facet Satisfaction Scale: An
effective affective measure of job satisfaction facets. Journal of Business and Psychology, 33(3), 383–403. https://doi.org/10.1007/s10869-017-9499-4
Boyd, B. (2010). An implicit measure of job satisfaction. [Unpublished master’s thesis]. Baruch
College, City University of New York. Boyd, B. (2017). Personalizing an implicit measure of job satisfaction (Publication No.
1987) [Doctoral dissertation, City University of New York]. CUNY Academic Works. https://academicworks.cuny.edu/gc_etds/1987
Brayfield, A. H., & Rothe, H. F. (1951). An index of job satisfaction. Journal of
Applied Psychology, 35(5), 307–311. https://psycnet.apa.org/record/1952-04202-001 Breckler, S. J. (1984). Empirical validation of affect, behavior, and cognition as
distinct components of attitude. Journal of Personality and Social Psychology, 47(6), 1191–1205. https://doi.org/10.1037/0022-3514.47.6.1191
Byrne, B. M. (2010). Structural Equation Modeling with AMOS, Second Edition. Routledge. Campbell, D. T. & Fiske, D. W. (1959). Convergent and discriminant validation by
the multitrait-multimethod matrix. Psychological Bulletin, 56, 81-105. https://doi.org/10.1037/h0046016
Cohen, J. (1992). A power primer. Psychological Bulletin, 112(1), 155-
159. https://doi.org/10.1037/0033-2909.112.1.155 Fishbein, M. (1979). A theory of reasoned action: Some applications and implications. Nebraska
Symposium on Motivation, 27, 65–116.
33
Greenwald, A. G. & Banaji, M. R. (1995). Implicit social cognition: Attitudes, self-esteem, and stereotypes. Psychological Review, 102(1), 4-27. https://doi.org/10.1037/0033-295X.102.1.4
Greenwald, A.G., Banaji, M.R., Rudman, L.A., Farnham, S.D., Nosek, B.A., & Mellot,
D.S. (2002). A unified theory of implicit attitudes, stereotypes, self-esteem, and self-concept. Psychological Review, 109(1), 3-25. https://doi.org/10.1037/0033-295X.109.1.3
Greenwald, A. G., McGhee, D. E., & Schwartz, J. L. K. (1998). Measuring
individual differences in implicit cognition: The implicit association test. Journal of Personality and Social Psychology, 74, 1464-1480.
Greenwald, A. G., Nosek, B. A., & Banaji, M. R. (2003). Understanding and using the
Implicit Association Test: I. An improved scoring algorithm. Journal of Personality and Social Psychology, 85(2), 197-216. https://doi.org/10.1037/0022-3514.85.2.197
Haines, E. L., & Sumner, K. E. (2006). Implicit Measurement of Attitudes, Stereotypes, and
Self-Concepts in Organizations: Teaching Old Dogmas New Tricks. Organizational Research Methods, 9(4), 536–553. https://doi.org/10.1177/1094428106286540
Iaffaldano, M. T., & Muchinsky, P. M. (1985). Job satisfaction and job performance: A meta-
analysis. Psychological Bulletin, 97(2), 251–273. https://doi.org/10.1037/0033-2909.97.2.251
Jex, S. M., & Britt, T. W. (2014). Organizational Psychology: A Scientist-
Practitioner Approach, 3rd Edition. John Wiley & Sons. Judge, T. A., Thoresen, C. J., Bono, J. E., & Patton, G. K. (2001). The job satisfaction–job
performance relationship: A qualitative and quantitative review. Psychological Bulletin, 127(3), 376–407. https://doi.org/10.1037/0033-2909.127.3.376
Landy, F. J. (1976). Job satisfaction: The meaning of work. In Jeffrey, W. E., Maddi, S. R., &
Ekstrand, B. R. (Eds.), Psychology of Work Behavior (3rd ed.) (pp. 375-418). The Dorsey Press.
34
Lane, K. A., Banaji, M. R., Nosek, B. A., & Greenwald, A. G. (2007). Understanding and using the Implicit Association Test: IV. What we know (so far) (pp 59 – 102). In B. Wittenbrink & N. S. Schwarz (Eds.). Implicit measures of attitudes: Procedures and controversies. Guilford Press.
Leary, M. R., & Kowalski, R. M. (1990). Impression management: A literature review and two-
component model. Psychological Bulletin, 107(1), 34-47. https://doi.org/10.1037/0033-2909.107.1.34
MacCallum, R. C., Browne, M. W., & Sugawara, H. M. (1996). Power analysis and
determination of sample size for covariance structure modeling. Psychological methods, 1(2), 130-149. https://doi.org/10.1037/1082-989X.1.2.130
Nosek, B., Greenwald, A., & Banaji, M. (2005). Understanding and using the
Implicit Association Test: II. Method variables and construct validity. Personality and Social Psychology Bulletin,31(2), 166 - 180. https://doi.org/10.1177/0146167204271418
Nunnally, J. C., & Bernstein, I. H. (1978). Psychometric theory. McGraw-Hill. Olson, M. A., & Fazio, R. H. (2004). Reducing the Influence of Extrapersonal Associations on
the Implicit Association Test: Personalizing the IAT. Journal of Personality and Social Psychology, 86(5), 653–667. https://doi.org/10.1037/0022-3514.86.5.653
Ravari, A., Mirzaei, T., Kazemi, M., & Jamalizadeh, A. (2012). Job satisfaction as
a multidimensional concept: A systematic review study. Journal of Occupational Health and Epidemology, 1(2),95-102. https://doi.org/10.18869/acadpub.johe.1.2.95
Rosenberg, M. J. (1969). The conditions and consequences of evaluation apprehension. In R.
Rosenthal & R. L. Rosnow (Eds.), Artifact and behavioral research (pp. 279-349). Academic Press.
Schleicher, D. J., Watt, J. D., & Greguras, G. J. (2004). Reexamining the Job
Satisfaction Performance Relationship: The Complexity of Attitudes. Journal of Applied Psychology, 89(1), 165–177. https://doi.org/10.1037/0021-9010.89.1.165
Schumacker, R. E., & Lomax, R. G. (2010). A beginner’s guide to structural equation modeling,
3rd ed. Routledge/Taylor & Francis Group.
35
Spector, P. E. (1985). Measurement of human service staff satisfaction: Development of the Job Satisfaction Survey. American Journal of Community Psychology, 13, 693-713. https://doi.org/10.1007/BF00929796
Sumner, K. & Haines, E. L. (2004, April). Implicit measurement in I-O psychology: Empirical
realities and theoretical possibilities. Symposium, Society for Industrial Organizational Psychology, Chicago.
Weiss, H. M., & Cropanzano, R. (1996). Affective Events Theory: A theoretical discussion of
the structure, causes and consequences of affective experiences at work. In B. M. Staw & L. L. Cummings (Eds.), Research in organizational behavior: An annual series of analytical essays and critical reviews, Vol. 18. (pp. 1–74). Elsevier Science/JAI Press.
Wheaton, B. (1987). Assessment of fit in overidentified models with latent variables.
Sociological Methods & Research, 16(1), 118–154. https://doi.org/10.1177/0049124187016001005
Widaman, K. F. (1985). Hierarchically nested covariance structure models for multi-trait
multi method data. Applied Psychological Measurement, 9, 1-26. https://doi.org/10.1177/014662168500900101
Wigboldus, D. H. J., Holland, R. W., & van Knippenberg, A. (2004). Single target
implicit associations. Unpublished manuscript. Wild, P., Parsons, V., & Dietz, E. (2006). Nurse practitioner’s characteristics and
job satisfaction. Journal of the American Academy of Nurse Practitioners, 18(11), 544–549. https://doi.org/10.1111/j.1745-7599.2006.00173.x
Wilson, T. D.& Dunn, E.W. (2004). Self-knowledge: Its limits, value, and potential for
improvement. Annual Review of Psychology, 55, 493-518. https://doi.org/10.1146/annurev.psych.55.090902.141954
36
APPENDICES
Appendix A: Human Subjects IRB Approval
37
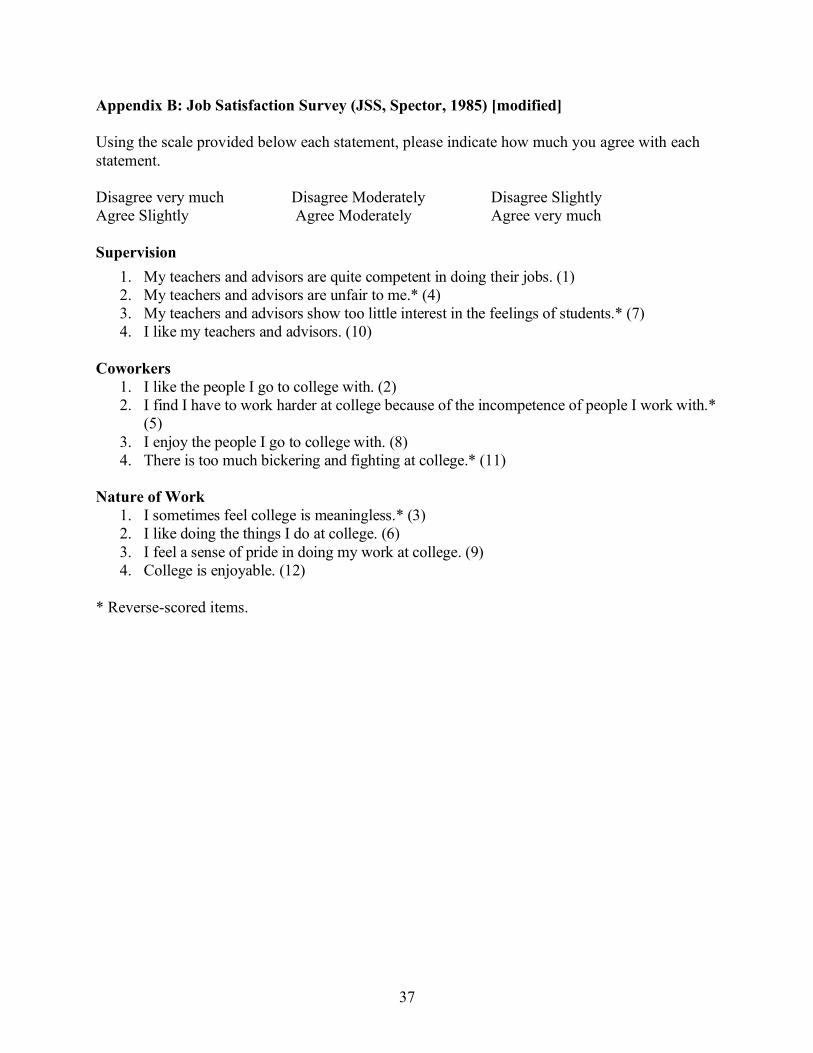
Appendix B: Job Satisfaction Survey (JSS, Spector, 1985) [modified] Using the scale provided below each statement, please indicate how much you agree with each statement. Disagree very much Disagree Moderately Disagree Slightly Agree Slightly Agree Moderately Agree very much Supervision
1. My teachers and advisors are quite competent in doing their jobs. (1) 2. My teachers and advisors are unfair to me.* (4) 3. My teachers and advisors show too little interest in the feelings of students.* (7) 4. I like my teachers and advisors. (10)
Coworkers
1. I like the people I go to college with. (2) 2. I find I have to work harder at college because of the incompetence of people I work with.*
(5) 3. I enjoy the people I go to college with. (8) 4. There is too much bickering and fighting at college.* (11)
Nature of Work
1. I sometimes feel college is meaningless.* (3) 2. I like doing the things I do at college. (6) 3. I feel a sense of pride in doing my work at college. (9) 4. College is enjoyable. (12)
* Reverse-scored items.
38
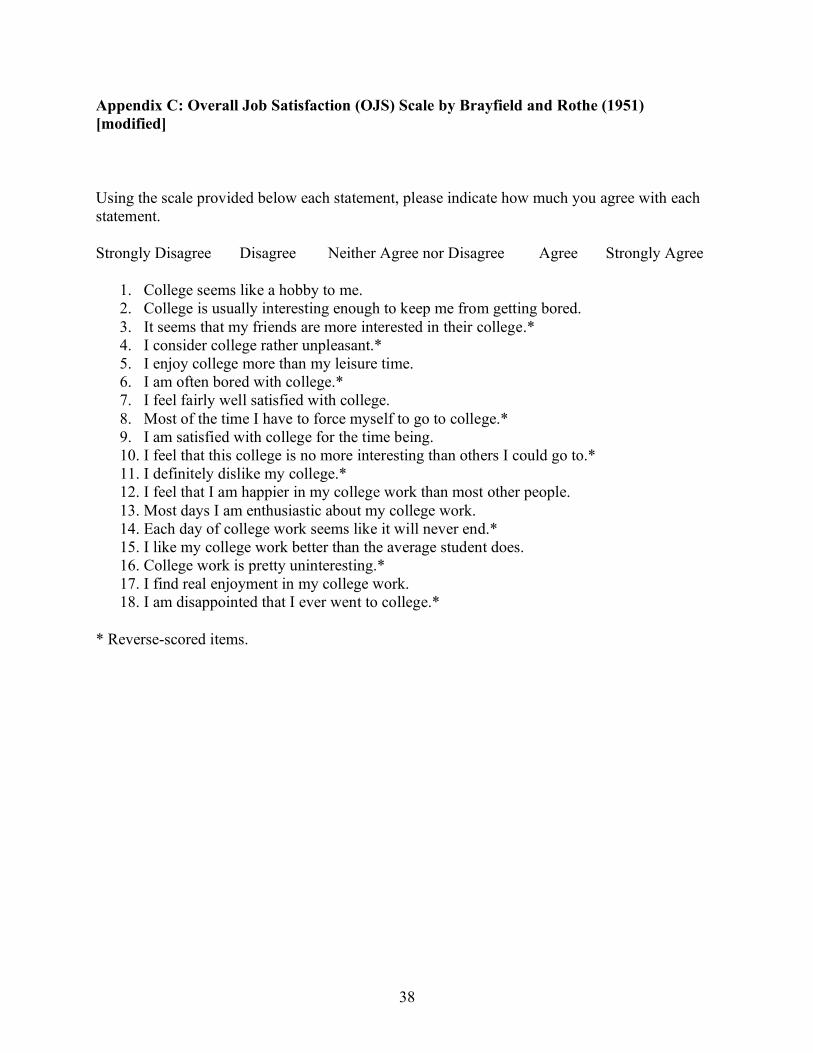
Appendix C: Overall Job Satisfaction (OJS) Scale by Brayfield and Rothe (1951) [modified]
Using the scale provided below each statement, please indicate how much you agree with each statement.
Strongly Disagree Disagree Neither Agree nor Disagree Agree Strongly Agree
1. College seems like a hobby to me. 2. College is usually interesting enough to keep me from getting bored. 3. It seems that my friends are more interested in their college.* 4. I consider college rather unpleasant.* 5. I enjoy college more than my leisure time. 6. I am often bored with college.* 7. I feel fairly well satisfied with college. 8. Most of the time I have to force myself to go to college.* 9. I am satisfied with college for the time being. 10. I feel that this college is no more interesting than others I could go to.* 11. I definitely dislike my college.* 12. I feel that I am happier in my college work than most other people. 13. Most days I am enthusiastic about my college work. 14. Each day of college work seems like it will never end.* 15. I like my college work better than the average student does. 16. College work is pretty uninteresting.* 17. I find real enjoyment in my college work. 18. I am disappointed that I ever went to college.*
* Reverse-scored items.
39
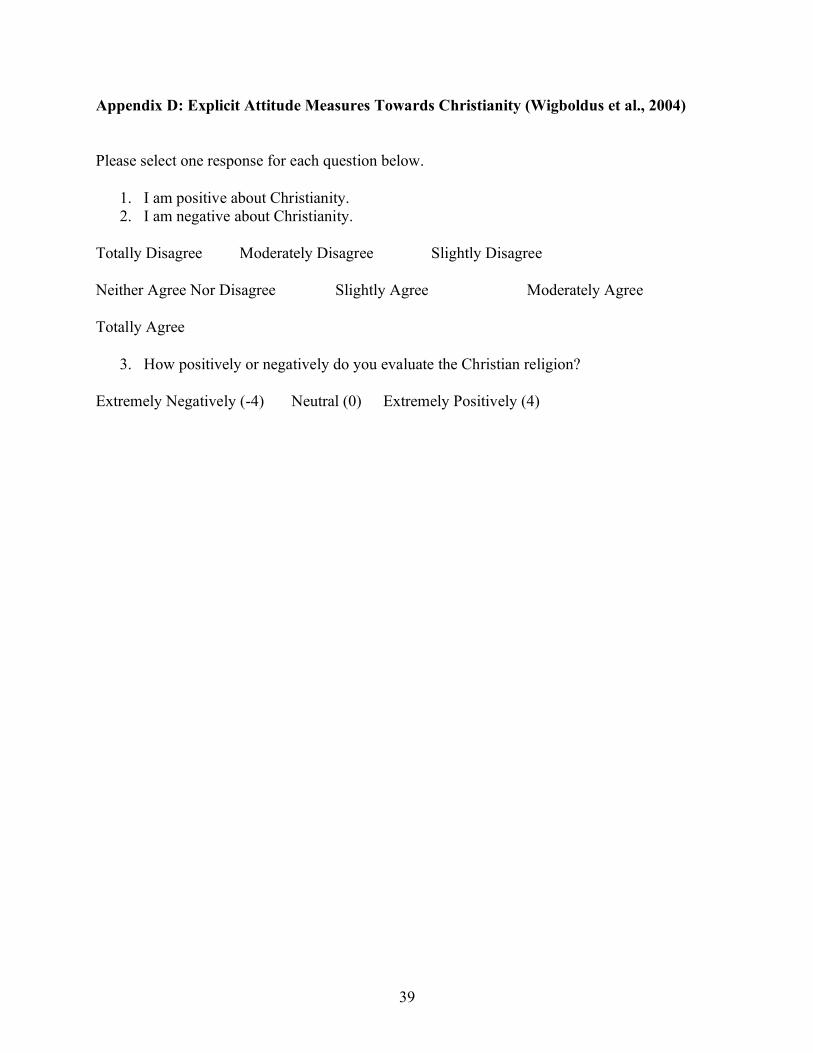
Appendix D: Explicit Attitude Measures Towards Christianity (Wigboldus et al., 2004)
Please select one response for each question below.
1. I am positive about Christianity. 2. I am negative about Christianity.
Totally Disagree Moderately Disagree Slightly Disagree
Neither Agree Nor Disagree Slightly Agree Moderately Agree
Totally Agree
3. How positively or negatively do you evaluate the Christian religion?
Extremely Negatively (-4) Neutral (0) Extremely Positively (4)
40
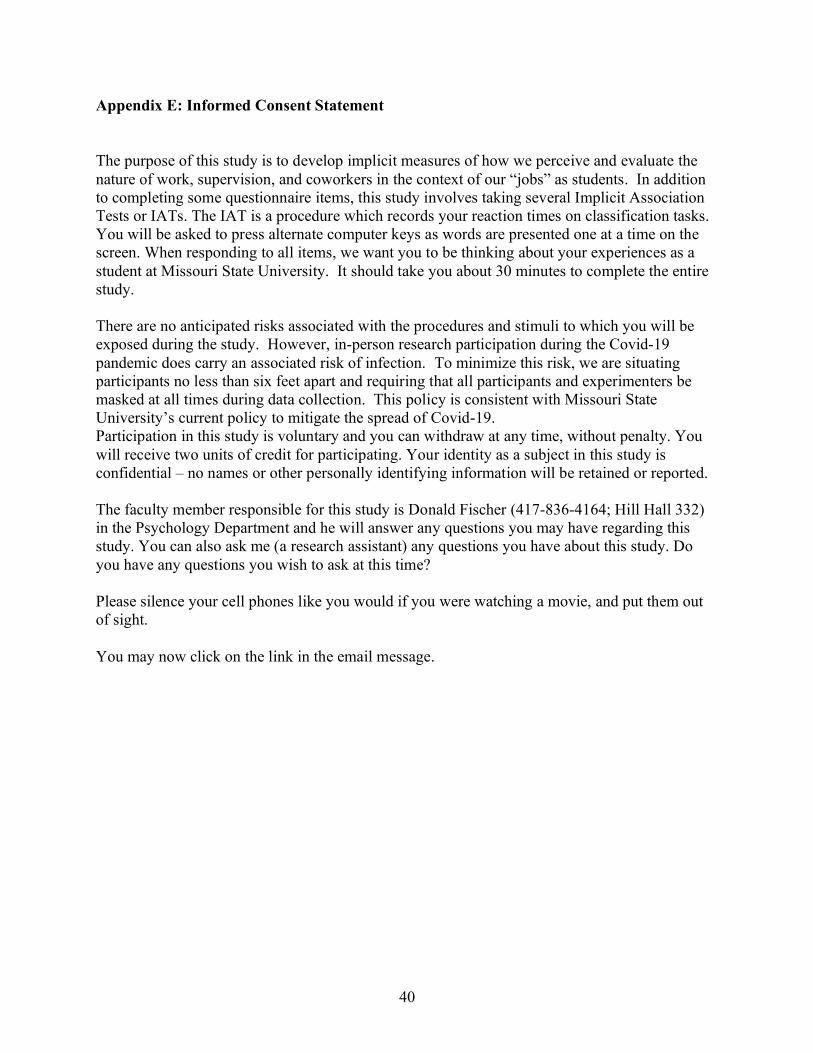
Appendix E: Informed Consent Statement
The purpose of this study is to develop implicit measures of how we perceive and evaluate the nature of work, supervision, and coworkers in the context of our “jobs” as students. In addition to completing some questionnaire items, this study involves taking several Implicit Association Tests or IATs. The IAT is a procedure which records your reaction times on classification tasks. You will be asked to press alternate computer keys as words are presented one at a time on the screen. When responding to all items, we want you to be thinking about your experiences as a student at Missouri State University. It should take you about 30 minutes to complete the entire study. There are no anticipated risks associated with the procedures and stimuli to which you will be exposed during the study. However, in-person research participation during the Covid-19 pandemic does carry an associated risk of infection. To minimize this risk, we are situating participants no less than six feet apart and requiring that all participants and experimenters be masked at all times during data collection. This policy is consistent with Missouri State University’s current policy to mitigate the spread of Covid-19. Participation in this study is voluntary and you can withdraw at any time, without penalty. You will receive two units of credit for participating. Your identity as a subject in this study is confidential – no names or other personally identifying information will be retained or reported. The faculty member responsible for this study is Donald Fischer (417-836-4164; Hill Hall 332) in the Psychology Department and he will answer any questions you may have regarding this study. You can also ask me (a research assistant) any questions you have about this study. Do you have any questions you wish to ask at this time? Please silence your cell phones like you would if you were watching a movie, and put them out of sight. You may now click on the link in the email message.