Embed Size (px)
Citation preview
Purdue UniversityPurdue e-Pubs
Open Access Dissertations Theses and Dissertations
12-2016
The development and evaluation of a lean six sigmaadvanced manufacturing methodologies course foraeronautical engineering technology curriculumJohn Michael DavisPurdue University
Follow this and additional works at: https://docs.lib.purdue.edu/open_access_dissertations
Part of the Curriculum and Instruction Commons
This document has been made available through Purdue e-Pubs, a service of the Purdue University Libraries. Please contact [email protected] foradditional information.
Recommended CitationDavis, John Michael, "The development and evaluation of a lean six sigma advanced manufacturing methodologies course foraeronautical engineering technology curriculum" (2016). Open Access Dissertations. 920.https://docs.lib.purdue.edu/open_access_dissertations/920
Graduate School Form30 Updated

THE DEVELOPMENT AND EVALUATION OF A LEAN SIX SIGMA ADVANCED
MANUFACTURING METHODOLOGIES COURSE FOR AERONAUTICAL
ENGINEERING TECHNOLOGY CURRICULUM
A Dissertation
Submitted to the Faculty
of
Purdue University
by
John Michael Davis
In Partial Fulfillment of the
Requirements for the Degree
of
Doctor of Philosophy
December 2016
Purdue University
West Lafayette, Indiana
ii
ACKNOWLEDGEMENTS
Thanks to the good Lord for giving me the strength and ability to complete this
project one day at a time. To my amazing wife Heather, thank you for your personal
support, undeniable patience, and for being by my side for this extraordinary journey.
Thank you to my family, friends, and colleagues who supported me through the last three
years and provided me the strength to persevere. Special thanks to my committee
members for their guidance and leadership in conducting this study that has helped me to
develop my research knowledge and skills.
iii
TABLE OF CONTENTS
Page
LIST OF TABLES ...............................................................................................................v
LIST OF FIGURES ........................................................................................................... vi
ABSTRACT ...................................................................................................................... vii
CHAPTER 1: INTRODUCTION ......................................................................................1
Nature of the Problem ....................................................................................................1
Statement of the Problem ...............................................................................................4
Purpose and Objectives of the Study ..............................................................................4
Research Questions .........................................................................................................6
Significance of the Study ...............................................................................................6
Delimitations of the Study .............................................................................................9
Assumptions of the Study .............................................................................................9
Definition of Terms ........................................................................................................9
CHAPTER 2: REVIEW OF THE LITERATURE ...........................................................12
Definition and Origins of Lean Six Sigma ...................................................................12
Integration and Application of Lean Six Sigma Manufacturing Methodologies ..........15
Economic Impact Related to Lean Six Sigma .............................................................25
Summary .......................................................................................................................32
iv
Page
CHAPTER 3: METHODOLOGY ....................................................................................34
Rationale .......................................................................................................................34
Theoretical Framework .................................................................................................35
Population and Sample .................................................................................................38
Instrumentation .............................................................................................................39
Data Collection .............................................................................................................44
Data Analysis ................................................................................................................45
CHAPTER 4: FINDINGS ................................................................................................47
CHAPTER 5: CONCLUSIONS, IMPLICATIONS, AND RECOMMENDATIONS .....60
Conclusions ..................................................................................................................61
Implications..................................................................................................................64
Recommendations ........................................................................................................66
REFERENCES ..................................................................................................................70
APPENDICES
Appendix A: Lean Six Sigma Pre-test/Post-test .........................................................77
Appendix B: Lean Six Sigma Course Evaluation Survey ..........................................86
Appendix C: Letter to Student ....................................................................................90
Appendix D: Purdue University Participant Consent Form .......................................91
Appendix E: Lean Six Sigma Summarized Course Topics ........................................93
VITA ..................................................................................................................................96
v
LIST OF TABLES
Table Page
Table 1: Student Demographics Part A ....................................................................... 42
Table 2: Survey Questions Part B ............................................................................... 43
Table 3: Pre-test/Post-test Descriptive Statistics Paired Samples t-test ..................... 48
Table 4: Pre-test/Post-test Descriptive Statistics by Grade Level ............................... 51
Table 5: Pre-test/Post-test Estimated Marginal Means by Grade Level ..................... 52
Table 6: Pre-test/Post-test Descriptive Statistics by Race/Ethnicity .......................... 53
Table 7: Pre-test/Post-test Estimated Marginal Means by Race/Ethnicity ................. 54
Table 8: Internal Consistency Reliability Estimate for the Survey ............................. 55
Table 9: Survey Response Frequencies ...................................................................... 57
vi
LIST OF FIGURES
Figure Page
Figure 1: Six Sigma Levels vs. Cost of Poor Quality ..................................................14
Figure 2: Six Sigma Success Factors Model ...............................................................16
Figure 3: Benefits of Lean Layout ...............................................................................19
Figure 4: Six Sigma Performance Measures Model ....................................................22
Figure 5: DMAIC Improvement Process Model .........................................................23
Figure 6: Six Sigma Reduction of Variation Model ....................................................26
Figure 7: Six Sigma Layout Model ..............................................................................28
Figure 8: Maximizing Shareholder Value Chart ..........................................................31
Figure 9: Six Sigma Goal Model .................................................................................33
vii
ABSTRACT
Davis, John M. Ph.D., Purdue University, December 2016. The Development and Evaluation of A Lean Six Sigma Advanced Manufacturing Methodologies Course for Aeronautical Engineering Technology Curriculum. Major Professor: James P. Greenan.
Successful completion of the Lean Six Sigma advanced manufacturing
methodologies practicum course provides undergraduate Aeronautical Engineering
Technology (AET) students with the experience and knowledge appropriate to perform
successfully in an advanced manufacturing environment. Therefore, the purpose of this
study was to determine (a) Did the knowledge level of AET students increase following
exposure to Lean Six Sigma and completion of the advanced manufacturing
methodologies course? and
following participation in the Lean Six Sigma advanced manufacturing course? The
expected outcomes of the course included:
1. AET students will have the competencies to utilize required advanced
manufacturing processes to operate a manufacturing facility.
2. AET students will have the ability to utilize advanced process quality planning
methods to implement a quality program in a manufacturing facility.
3. AET students will have the knowledge and experience required to effectively
implement supply chain management techniques and logistic programs in a
manufacturing facility.
viii
4. An effective continuous improvement process will be utilized and promoted
throughout the curriculum.
Currently, students are using the lab space in the School of Aviation and
Transportation Technology (SATT) to perform practical hands-on projects related to their
aviation major. This study required undergraduate AET students to receive instruction in
logistics, quality, and manufacturing terms and descriptions. Students utilized the
information learned and basic lean manufacturing and continuous improvement
philosophies to complete course projects. The course projects included a focus on
powerplant laboratory into a more typical aerospace
manufacturing cell layout, enabling students to explore ways of operating an advanced
manufacturing facility. Students in the advanced aviation manufacturing course
developed and implemented manufacturing simulations. This study focused on
developing a world-class course utilizing an operating laboratory facility to prepare
future aviation manufacturing professionals with industry leading skill sets. This study
was used to gather data for the development and evaluation of a Lean Six Sigma
advanced manufacturing course with future goals of scaffolding with other SATT courses
to provide a minor for the AET curriculum in advanced aviation manufacturing. The
findings of the study indicated that student knowledge levels of Lean Six Sigma
methodologies increased significantly after receiving instruction. Additional findings of
the study revealed that students felt the course met their expectations. However, due to
several limitations of this study, further research is recommended in focused areas to
provide students the tools to compete in the aviation and advanced manufacturing world.
1
CHAPTER 1: INTRODUCTION
Nature of the Problem
The Bachelor of Science in Aeronautical Engineering Technology (AET) program
in the School of Aviation and Transportation Technology (SATT) at Purdue University is
an ABET-ETAC (formerly Accreditation Board for Engineering and Technology and the
Engineering Technology Accreditation Commission) accredited curriculum. It is the
responsibility of the AET program to demonstrate that the ABET-ETAC accreditation
criteria are met. For this reason, this study is a valuable asset, immediately usable within
the AET plan of study. As this effort matured, it benefitted AET students by directly
involving them in helping create an updated laboratory learning environment, while
researching both existing and new manufacturing technologies through immersive
learning projects (Gay, 1987).
The ABET-ETAC accreditation planning process must include three of the eight
criteria required for accreditation. The first section is ABET-ETAC Criterion 2:
Program Educational Objectives. This program must provide program educational
objectives that are consistent with the mission of the institution, the needs of the
the accreditation criteria (ABET-ETAC, 2016).
There must be a documented, systematically used, and effectively implemented process
involving program constituencies for the periodic review of the program s educational
objectives that ensure
-ETAC, 2016).
2
The second section is ABET-ETAC Criterion 3: Student Outcomes. The
program must have documented evidence of student outcomes that indicate graduates
have achieved the program educational objectives. There must be a documented and
effective process for the periodic review and revision of the student outcomes (ABET-
ETAC, 2016). Student outcomes that must be met by the AET degree program were
derived from the ABET-ETAC criteria and include:
Ability to select and apply the knowledge, techniques, skills, and modern tools
of the discipline to broadly-defined engineering technology activities.
Ability to select and apply knowledge of mathematics, science, engineering,
and technology to engineering technology problems that require the
application of principles and applied procedures or methodologies.
Ability to conduct standard tests and measurements; to conduct, analyze, and
interpret experiments.
Ability to apply project-based learning techniques to improve processes, and
communicate a commitment to quality, timeliness, and continuous
improvement. All the objectives listed are crucial in the manufacturing world.
The third section comprising assessment planning is ABET-ETAC Criterion 4:
Continuous Improvement. This program must regularly use appropriate, documented
processes for assessing and evaluating the extent to which the student outcomes are being
successfully attained. The results of these evaluations must be systematically utilized as
input supporting the continuous improvement of the overall program (ABET-ETAC,
2016).
3
The program must demonstrate that the technical, scientific, and managerial areas
of expertise developed by graduates are appropriate to the professional orientation and
goals of the program. The outcomes for the Bachelor of Science in AET program
stipulate that graduates have the technical expertise in engineering materials, statics,
strength of materials, applied aerodynamics, applied propulsion, and either electrical
power or electronics. Graduates should also possess the expertise in a minimum of three
subject areas. The subject areas are manufacturing processes, vehicle design and
modification, engineering materials, electromechanical devices and controls, industrial
operations, and systems engineering including the appreciation of the engineering design
cycle and the system life cycle relating to the manufacture and maintenance of
aeronautical/aerospace vehicles and their components (ABET-ETAC, 2016). Lastly,
AET graduates must have expertise in applied physics.
The use of advanced manufacturing methodologies is not well documented in
undergraduate programs (ABET-ETAC, 2016). The absence of documentation or
implementation of Lean Six Sigma manufacturing techniques into the undergraduate
Aeronautical Engineering Technology education experience raises three questions. What
would be the validity and reliability of a Pre-test/Post-test instrument used for the
assessment of student knowledge levels? Would the knowledge level of AET students
increase after successful completion of a Lean Six Sigma advanced manufacturing
methodologies course?
after participating in the Lean Six Sigma advanced manufacturing course?
This study, therefore, examined the plan of study requirements and performed a
needs analysis for the baccalaureate Aeronautical Engineering Technology program.
There was a need to assess the appropriateness of adding a Lean Six Sigma
4
manufacturing course to the curriculum. Accordingly, this study attempted to prepare a
curriculum to better equip SATT graduates for careers in 21st-century aviation.
Statement of the Problem
With the utilization of ABET-ETAC criteria objectives to expand the AET
programs, the School of Aviation and Transportation Technology seeks to prepare
graduates to enter more diverse and challenging career paths throughout the global
aviation arena. Additionally, the School of Aviation and
Industry Advisory Board has expressed concern about the extent of exposure to leading
industry practices to which the student population in Aeronautical Engineering
Technology is exposed. The major problem of this study, therefore, was to assess the
existing curriculum and formulate recommendations for the stakeholders concerning the
preparation of AET students to successfully meet the challenges of a modern, dynamic
aerospace advanced manufacturing environment. The stakeholders for this study
included the School administration, faculty, and most importantly, students in the SATT.
Purpose and Objectives of the Study
The purpose of this study was to develop and evaluate Lean Six Sigma advanced
manufacturing methodologies for the Bachelor of Science in AET curriculum, utilizing a
course tailored specifically towards training and education of future aviation
manufacturing professionals. Using aerospace practices and equipment as a centerpiece,
the course and learning space were designed for fit and collaboration with other
manufacturing curricula as well. Multiple global sourcing supply chains and
collaboration with diverse professional technical groups from varying disciplines are the
5
standard in the current advanced manufacturing environment across many technology
industries. Accordingly, this course was designed to accommodate not only aviation
students, but students from other manufacturing disciplines as well. The ultimate
outcome was to develop an Aeronautical Engineering Technology course that could
provide students the opportunity to learn and apply advanced manufacturing techniques
(specialized as well as collaborative) relevant to the aviation industry. This activity
enables the completion of the student learning experience with a practical application of
manufacturing technologies. Students could eventually have the opportunity to take this
course as a minor concentration in advanced manufacturing. Upon successful completion
of the advanced aviation manufacturing course, students would be expected to possess
the necessary knowledge and experiences to function effectively in an advanced
manufacturing environment.
The objectives established for this study, therefore, included:
1. AET students will develop the competencies required to effectively utilize
advanced manufacturing processes to successfully operate a manufacturing
facility.
2. AET students will acquire the knowledge and skills required to effectively utilize
advanced process quality planning methods to successfully implement a quality
program in a manufacturing facility.
3. AET students will increase their knowledge and experiences to successfully
implement supply chain management techniques and logistic programs in a
manufacturing facility.
4. AET students will promote and implement a continuous improvement process that
will be successfully utilized throughout the curriculum.
6
Research Questions
To develop and evaluate the Lean Six Sigma advanced manufacturing
methodologies course in the Bachelor of Science in AET undergraduate curriculum, the
following research questions were posited for this study:
1. Did the knowledge level of AET students increase following exposure to Lean Six
Sigma and completion of the advanced manufacturing methodologies course?
2. Did the course meet the AET students expectations following participation in the
Lean Six Sigma advanced manufacturing course?
Significance of the Study
By utilizing the ABET-ETAC criteria objectives to expand the AET program, the
School of Aviation and Transportation Technology seeks to better prepare graduates with
knowledge, problem-solving ability, and project-based learning (hands-on) skills to enter
careers in the design, installation, manufacturing, testing, evaluation, technical sales, or
maintenance of aeronautical/aerospace systems. The level and scope of career
preparation depend on the program plan of study and the AET-specific program
orientation. Since this program is a baccalaureate degree program, graduates typically
have strengths in the analysis, applied design, development, implementation, or oversight
of more advanced aeronautical/aerospace systems and processes (ABET-ETAC, 2016).
ABET-ETAC PEOs Program Educational Objectives (PEO) were utilized and
were used as a minimum
in this study to develop the course material:
7
PEO 1- Effectively apply technical knowledge, problem-solving techniques, and
hands-on skills in traditional and emerging areas of aerospace design,
manufacturing, operations, or support.
PEO 2- Be active and effective participants in ongoing professional development,
professional growth, and increasing professional responsibility.
PEO 3- Effectively communicate ideas to technical and non-technical people.
PEO 4- Work effectively in industrial teams.
PEO 5- Work within the accepted standards of professional integrity and conduct.
Student Outcomes (SO) were also required as part of the development process and
included the following (ABET-ETAC, 2016):
Demonstrate the appropriate mastery of aerospace processes and technology to
apply problem-solving tools and techniques and hands-on skills for the design,
manufacturing, operations, and support of aerospace vehicles or vehicle systems.
Apply and adapt the appropriate mathematics, science, engineering, and
technology in problem definition and problem solutions.
Demonstrate an ability to evaluate and identify problems, perform testing and
measurement to understand problems, and to interpret the results of testing and
evaluation to successfully recognize and develop appropriate solutions and
outcomes.
Demonstrate an understanding of the aerospace vehicle as a system, and its role as
a part of a greater system, and to develop creative solutions which positively
impact related system components.
8
Demonstrate the ability to collaborate effectively in a teaming environment, and
utilize the tools necessary to communicate, collaborate, mentor, and appropriately
lead in a team environment.
Apply appropriate technical and decision-making tools to successfully identify,
analyze, and solve problems.
Demonstrate effective written, oral, and presentation skills appropriate for
leadership and cross-functional communication.
Demonstrate the skills to learn independently, and to understand the necessity for
continued learning.
Demonstrate an ability to understand professional, ethical, and social
responsibilities.
Demonstrate an understanding for the importance of diversity and knowledge of
contemporary professional, societal, and global issues.
Demonstrate a commitment to quality, timeliness, and continuous improvement
needed to perform to an aerospace quality standard.
The Program Educational Objectives (PEO) are educational objectives that describe
what students/graduates are expected to attain within a few years after graduation from
the program. The objectives are based on the needs of the program constituencies. The
Student Outcomes (SO) describe what students are expected to know and be able to
demonstrate by the time of graduation. The outcomes relate to the skills, knowledge, and
behaviors that students acquire as they progress through a program.
9
Delimitations of the Study
The study had two major delimitations. First, participant selection was limited to
enrolled Aeronautical Engineering Technology students. Selection was based on only a
two-year period, for development and evaluation of the Lean Six Sigma advanced
manufacturing objectives for the course. The second delimitation was the ability to
incorporate project-based learning objectives into the Lean Six Sigma advanced
manufacturing course as required to enhance the course.
procedures were selected and implemented around these delimitations.
Assumptions of the Study
The focus of this study was to provide a project-based learning experience for
Aeronautical Engineering Technology students. It was assumed that providing education
in Lean Six Sigma manufacturing methodologies, undergraduate students would be able
to demonstrate those key Lean Six Sigma skills desired by industry and, therefore, be
better prepared to successfully enter the workforce. This study also assumed that
respondents would be able to recall and apply detailed information from the Lean Six
Sigma course materials. Finally, it was assumed that the respondents would be candid
and truthful when responding to the survey items.
Definition of Terms
5S: An organized workplace consisting of a setting where tools, work
instructions, and processes are orderly and consistently in the same place all the time. As
described and detailed by Ramesh, Prasad, and Srinivas (2008), the Toyota Production
System and lean implementation begin with 5S concepts as the foundation. Each S
10
(Sort, Straighten, Shine, Standardize, and Sustain) is a separate entity unto itself and
should be implemented in steps with input from the workforce to ensure that 5S efforts
are sustained.
Lean Six Sigma Manufacturing: A manufacturing paradigm using all tenets of
the Toyota Production System and empowering employees; while constantly looking to
improve throughput, efficiencies, and visual management. These improvements can
also be seen as cost-effective measures. Brown, Collins, and McCombs (2006) described
Lean manufacturing as the desired methodology in manufacturing since there is a
constant effort to attain zero waste in the system.
DMAIC Process: A lean and quality Six Sigma tool that was defined by Brown,
Collins, and McCombs (2006). The DMAIC Process allows a company to use a
scientific approach when implementing a lean manufacturing system. The steps--
Define, Measure, Analyze, Improve, and Control each have specific criteria that must be
met before a project or implementation phase can move forward. The ultimate goal is to
arrive at the control stage so that an improvement is then actually a part of everyday
business for a company. Each step in the process is accompanied by small Kaizen events
to ensure employee involvement.
Kaizen (Continuous Improvement): Kaizen, as defined by Brandt (2007), is the
process of achieving small improvements to processes and the work environment through
hourly worker and management interaction and discussion. Kaizen events are routinely
performed to both initiate change (brainstorm), and to update the stakeholders as to a
Kaizen events can be seen in baseball terms as
hitting a series of singles to score a run instead of trying to hit a home run all the time.
11
The focus is on small incremental improvements that involve all levels of an organization
and being able to sustain each step in the lean journey.
Kan Ban: A primary philosophy of lean manufacturing is to produce only what
the customer requires in the timeframe and quantity that is necessary. As illustrated by
Ohno (1988), Kan Ban and Kan Ban systems are designed to attain a lean and cost-
efficient state of material flow from the point of raw materials to finished goods and
shipping to the customer. Kan Ban systems can be electronic, visual, or use cards as the
means of status indication. The key ingredient to the Kan Ban system is that a signal is
sent to a downstream process to make or send more products, or stop production or
shipping due to the status of the system (empty or full). Because of the importance of
maintaining appropriate process and cost controls, Kan Ban is often considered the most
important part of all lean implementation planning and projects (Ohno, 1988).
12
CHAPTER 2: REVIEW OF THE LITERATURE
The literature review discussed and summarized information on the origins of
Lean Six Sigma and Lean Six Sigma methodologies. It was important to demonstrate
how these tools have been employed to increase productivity efficiencies and bottom line
profit improvements. The review also encompassed Lean Six Sigma methodologies for
development and evaluation of curriculum. Exploration of opportunities to implement
Lean Six Sigma tools into the Aeronautical Engineering Technology undergraduate
curriculum was also included. It is believed that by offering Lean Six Sigma advanced
manufacturing methodologies to AET students would better prepare them to enter the
advanced aviation manufacturing workplace (Johnson & Dubikovsky, 2008).
Definition and Origins of Lean Six Sigma
The quest to achieve Six Sigma had its beginning at the Motorola Corporation in
ew era
within Motorola and led to the discovery of the important association between higher
quality and lower development costs in manufacturing products (McFadden, 1993).
At a time when most American companies believed that quality costs money,
Motorola realized that if implemented correctly, improving quality would reduce costs.
They thought that high-quality products should cost less to produce, not more. They
reasoned that the highest-quality producer should be the lowest-cost producer. At the
13
time, Motorola was spending 5 to 10 percent of annual revenues, and in some cases as
much as 20 percent of revenues, correcting poor quality. That translated into $800 to
$900 million each year, money that, with higher-quality processes, could be returned
-quality products should cost less
to produce has since been proven over and over again to be true (Pande, Neuman, &
Cavanagh, 2001).
A quantum leap in manufacturing technology occurred at Motorola when it
applied Six Sigma to the development of its Bandit pager a name the company selected
because those persons
find from products already on the market. Within 18 months, and for a price tag of less
produced in its automated factory in Boynton Beach, Florida, within 72 minutes from the
time an order was placed by computer from any Motorola sales office. Pagers could be
ordered with various options and could be custom-built for individual customers (see
Figure 1).
Sigma architects had accomplished what most companies assumed was impossible. By
1993, Motorola was operating at nearly Six Sigma in many of its manufacturing
operations. Within a short time, Six Sigma began to spread extensively to other
industries and beyond manufacturing alone (Bandrowski & Madison, 2003c).
An organization that actively strives to build themes and practices of Six Sigma
into its daily management activities, and shows significant improvements in process
performance and customer satisfaction is considered to be a Six Sigma Organization
14
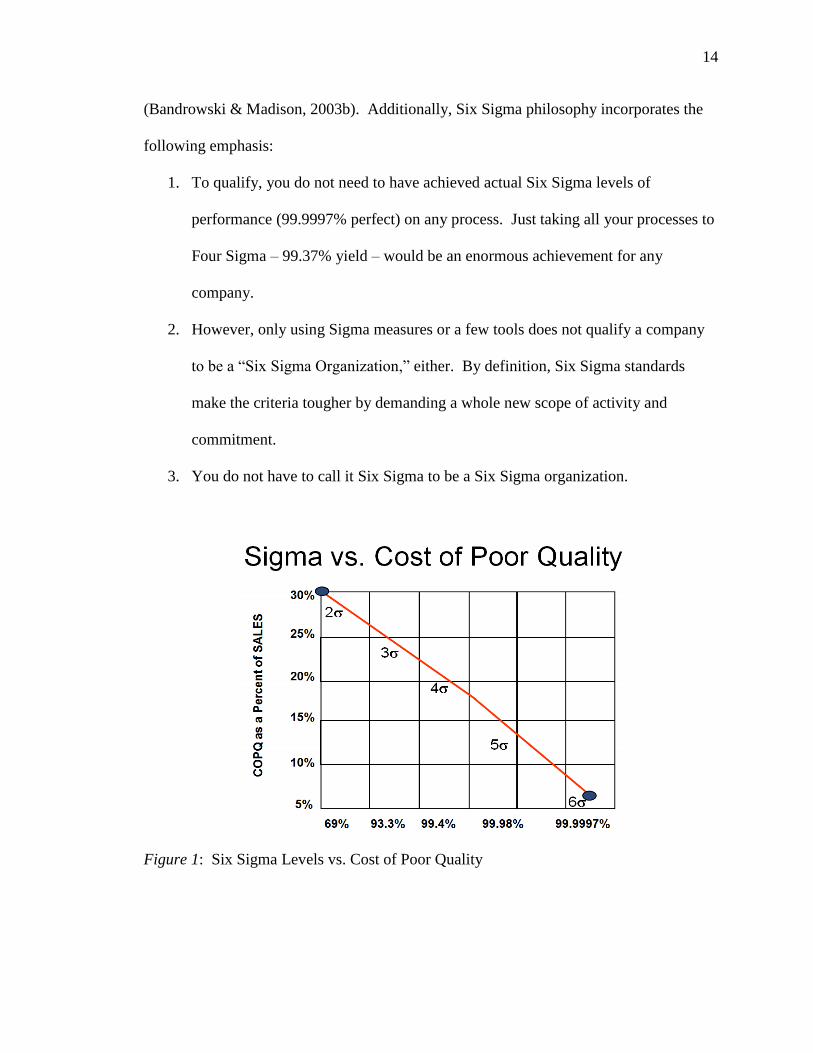
(Bandrowski & Madison, 2003b). Additionally, Six Sigma philosophy incorporates the
following emphasis:
1. To qualify, you do not need to have achieved actual Six Sigma levels of
performance (99.9997% perfect) on any process. Just taking all your processes to
Four Sigma 99.37% yield would be an enormous achievement for any
company.
2. However, only using Sigma measures or a few tools does not qualify a company
t either. By definition, Six Sigma standards
make the criteria tougher by demanding a whole new scope of activity and
commitment.
3. You do not have to call it Six Sigma to be a Six Sigma organization.
Figure 1: Six Sigma Levels vs. Cost of Poor Quality
15
Integration and Application of Lean Six Sigma Manufacturing Methodologies
In a study by Kaushik, Khanduja, Mittal, and Jaglan (2012), implications of
applying Six Sigma methodology within small and medium enterprises (SMEs) were
reviewed. The study was designed to yield valuable information to academics,
consultants, researchers, and practitioners of Six Sigma methodologies. It provided
documented evidence of a Six Sigma implementation project in a bicycle chain
manufacturing unit which was a representative of a small- and medium-sized industry.
representing standard deviation or the
amount of variation within a given process (McAdam & Lafferty, 2004). According to
Harry and Schroeder (2000), Six Sigma can be a powerful tool as a business strategy that
enables companies to use simple and powerful statistical methods to achieve and sustain
operational excellence. It is a business strategy that allows companies to drastically
improve performance by designing and monitoring everyday activities in ways that will
minimize waste of resources while increasing customer satisfaction (Snee, 2010).
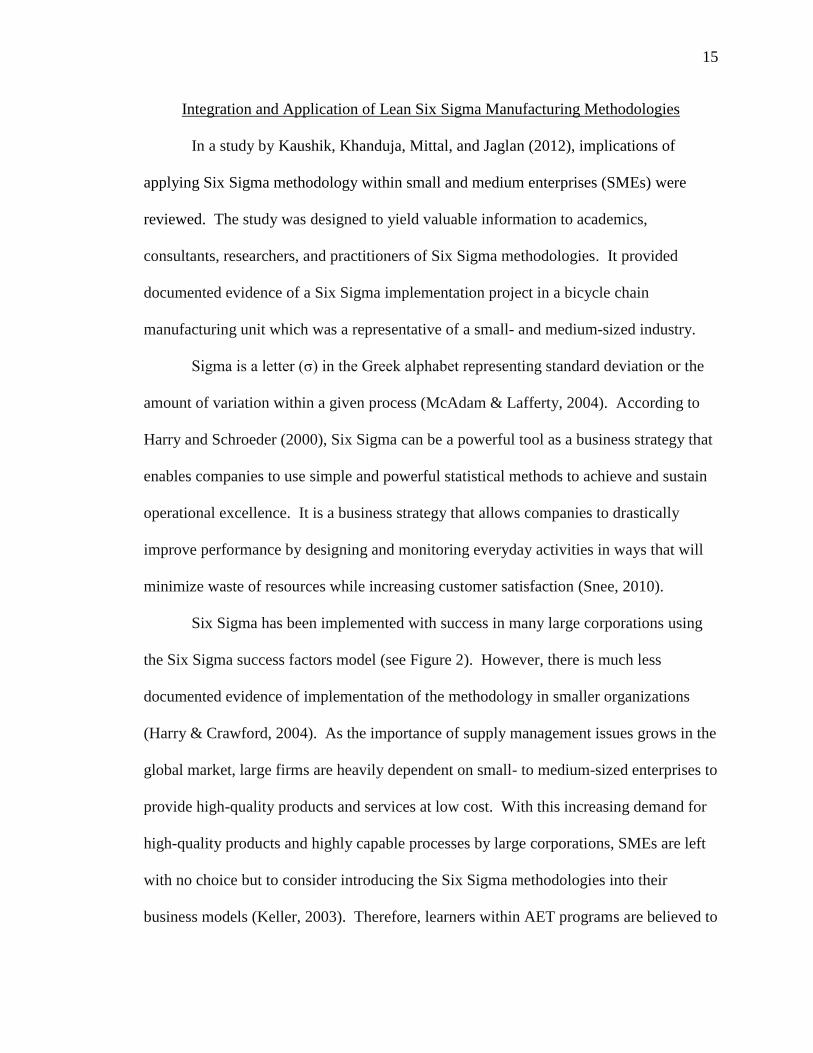
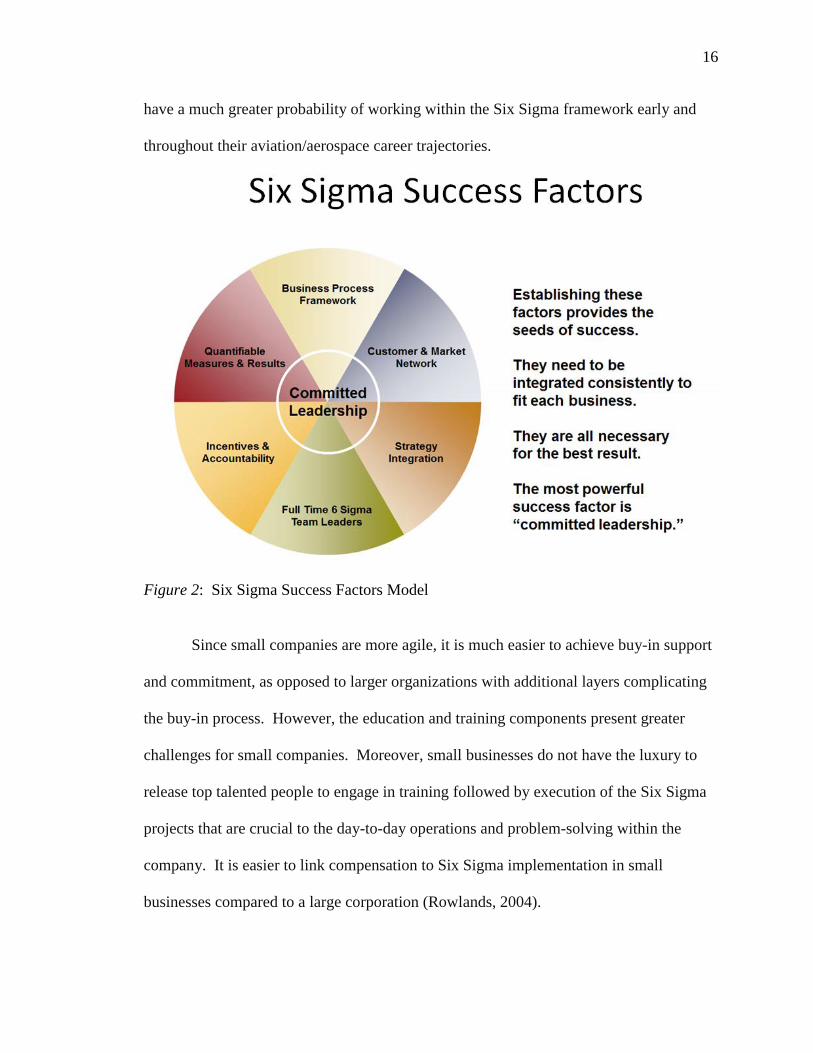
Six Sigma has been implemented with success in many large corporations using
the Six Sigma success factors model (see Figure 2). However, there is much less
documented evidence of implementation of the methodology in smaller organizations
(Harry & Crawford, 2004). As the importance of supply management issues grows in the
global market, large firms are heavily dependent on small- to medium-sized enterprises to
provide high-quality products and services at low cost. With this increasing demand for
high-quality products and highly capable processes by large corporations, SMEs are left
with no choice but to consider introducing the Six Sigma methodologies into their
business models (Keller, 2003). Therefore, learners within AET programs are believed to
16
have a much greater probability of working within the Six Sigma framework early and
throughout their aviation/aerospace career trajectories.
Figure 2: Six Sigma Success Factors Model
Since small companies are more agile, it is much easier to achieve buy-in support
and commitment, as opposed to larger organizations with additional layers complicating
the buy-in process. However, the education and training components present greater
challenges for small companies. Moreover, small businesses do not have the luxury to
release top talented people to engage in training followed by execution of the Six Sigma
projects that are crucial to the day-to-day operations and problem-solving within the
company. It is easier to link compensation to Six Sigma implementation in small
businesses compared to a large corporation (Rowlands, 2004).
17
In a study conducted by Wessel and Burcher (2004), specific requirements for Six
Sigma implementation were laid out for a sampling of SMEs in Germany. The study
examined how Six Sigma had to be modified to be applicable and valuable in an SME
environment. It was the first study to be conducted on a Six Sigma survey of SMEs.
Burton (2004) proposed alternative Six Sigma deployment models that would
allow Small- or Medium- sized Enterprises (SME) to implement Six Sigma at a pace that
would enable them to understand the methodologies and achieve benefits, without
significant resource commitment and overhead structure of the traditional Six Sigma. As
a result, SMEs are sometimes able to achieve faster and more effective benefits than their
larger customers (Fiore, 2005). Additionally, Burton recommended an eight-step
methodology for successful deployment of Six Sigma within SMEs. The eight steps to
implementation include: (1) develop a Six Sigma strategy and overarching infrastructure,
(2) complete an implementation plan, (3) team formation and education plan must begin
concurrently, (4) company executives complete the Champion education to learn the Six
Sigma process, methodology and tools, (5) selected individuals complete Green Belt
certification, (6) other team members complete Yellow Belt certification, (7) later in the
lifecycle, individuals are transitioned to the next level of Six Sigma achievement, and (8)
in all cases, certification is accomplished by achievement, not attendance.
The key to success is once an owner of the business (in smaller firms) is
convinced of the Six Sigma advantages and visualizes the benefits, it is much easier to
implement the methodologies (Adams, Gupta, & Wilson, 2003). The initial focus of
SMEs can be to reduce quality costs or waste in the system. Effort and investment, as
well as results in smaller companies, are more visible within a short time. The study was
conducted by an SME unit that manufactured bicycles in Haryana, India. The primary
18
product of the manufacturing unit was the bicycle chain and the components required to
create a bicycle chain (Adams, Gupta, & Wilson, 2003). For this problem, the Six Sigma
DMAIC (Define, Measure, Analyze, Improve, and Control) methodology was utilized to
examine the issue encountered during the manufacture of bicycle chain. During this
study, there was an extremely high incidence of failure in raw materials used to
manufacture the bicycle chain. By successfully implementing the DMAIC methodology,
the SME was able to achieve an improvement from the existing sigma quality level of
much-improved (see Figure 3). For example, if
the SMEs quality level was 2 , 69% of products and/or services would meet customer
requirements with 308,538 defects per million opportunities. With a quality performance
, 99.4% of the products and/or services would meet customer requirements and
there would be 6,210 defects per million opportunities. As the quality performance level
reaches 6 the products and/or services would meet customer
requirements with just 3.4 failures per million opportunities, which is as close to flaw-
free as a business can be.
Examples of 3 Sigma Levels: 54,000 incorrect drug prescriptions per year, 5
crash landings per day at the busiest airports, and 54,000 lost pieces of mail per
hour.
Examples of 6 Sigma Levels: 1 incorrect prescription in 25 years, 1 crash landing
in 10 years, and 35 lost pieces of mail per year.
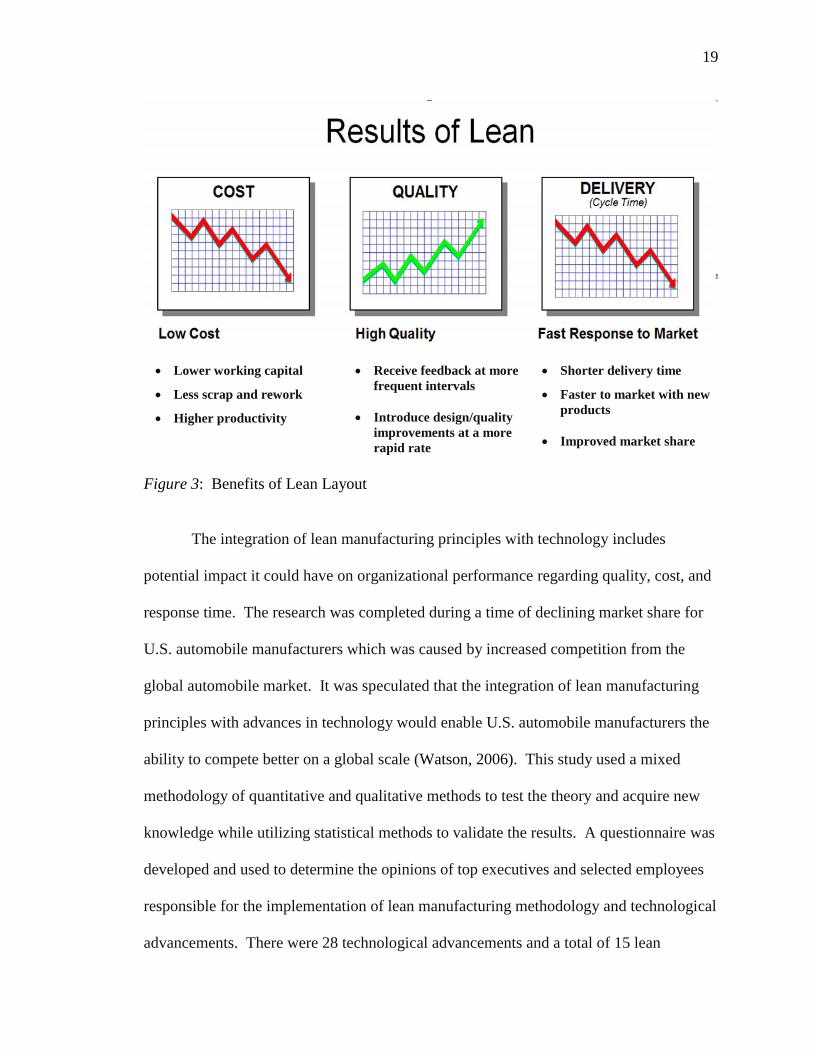
19
Lower working capital
Less scrap and rework
Higher productivity
Receive feedback at more frequent intervals
Introduce design/quality improvements at a more rapid rate
Shorter delivery time
Faster to market with new products
Improved market share
Figure 3: Benefits of Lean Layout
The integration of lean manufacturing principles with technology includes
potential impact it could have on organizational performance regarding quality, cost, and
response time. The research was completed during a time of declining market share for
U.S. automobile manufacturers which was caused by increased competition from the
global automobile market. It was speculated that the integration of lean manufacturing
principles with advances in technology would enable U.S. automobile manufacturers the
ability to compete better on a global scale (Watson, 2006). This study used a mixed
methodology of quantitative and qualitative methods to test the theory and acquire new
knowledge while utilizing statistical methods to validate the results. A questionnaire was
developed and used to determine the opinions of top executives and selected employees
responsible for the implementation of lean manufacturing methodology and technological
advancements. There were 28 technological advancements and a total of 15 lean
20
manufacturing principles/initiatives identified as being utilized in the domestic
automobile industry (Watson, 2006).
Lean manufacturing has historically been used by many organizations to compete
on a global basis, and it is considered evolutionary in the process of continuous
improvement in manufacturing concepts (Ohno, 1988; Womack & Jones, 1996;
Womack, Jones, & Roos, 1990). The processes in which products were manufactured
have included craft, mass production, and lean manufacturing. Craft led to mass
production, and mass production led to lean manufacturing. Lean manufacturing has
revolutionized the way products are produced today. Commonly known as the Toyota
Production System (TPS), lean manufacturing emerged out of necessity as a means for
Japanese automobile manufacturers to compete, beginning with the Toyota Motor
Company (Gunter, 1987; Ohno, 1988; Watson, 2006).
Henry Ford was credited with the invention of mass production, changing the way
products were, and continue to be, produced in many industries. These were paramount
in advancing manufacturing concepts that led to world dominance in automobile
manufacturing for domestic automobile manufacturers. In 1955, Ford, GM, and
Chrysler accounted for 95% of all sales (Womack, Jones, & Roos, 1990; Watson, 2006).
Henry Ford and Taiichi Ohno were pioneers in the improvement of manufacturing
methods; Ohno is credited with the invention of the Toyota Production System. When
comparing mass production against the lean manufacturing model, mass production
requires more manufacturing space, more investment in tooling, and more development
time. It results in more defects, higher costs, lower quality, and longer responses or lead
times that result in reduced organizational performance (Hogg, 1993). Lean
manufacturing and technological advances have provided organizations with a more
21
efficient means to compete. These organizat What is the
impact of lean manufacturing principles integrated with technology on organizational
performance in the way of quality, cost, and response time (Hogg, 1993; Watson,
2006). Several studies have been conducted on lean manufacturing principles and
technology (Gagnon, 2004; Karlin, 2004; Mothersell, 2000; Olsen, 2004; Rasch, 1998;
Shah, 2002; Starns, 1995). However, none of the studies have focused on the impact of
the integration of lean manufacturing principles with technology on organizational
performance.
A study conducted by Platzer and Harrison (2011) found that domestically owned
automobile manufacturers worked diligently to compete with foreign-owned automobile
manufacturers, yet their market share had shown a decrease over the years. The timing of
the research was crucial to aid U.S automobile manufacturing proficiency. Several
practitioners firmly believed in the importance of technology through enhancing
manufacturing performance (Mathaisel & Comm, 2000).
With the increase in market share and improved performance of Asian automobile
manufacturers, the determination was made that the subject warranted closer research. It
seemed practical that benefits could be achieved by examining the relationship of the
level of lean manufacturing principles integrated with technology and its effects on
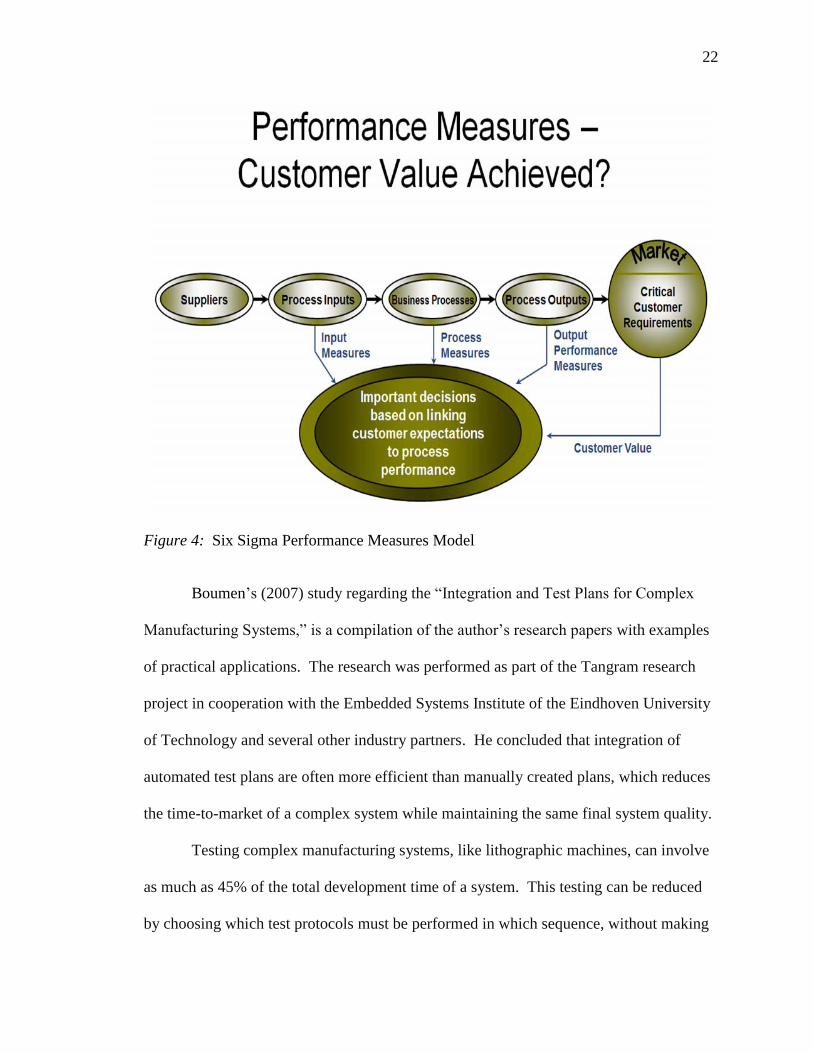
organizational performance (see Figure 4). The principles of lean manufacturing
integrated with technology and the impact of quality, cost, and response time on
organizational performance were compared. The study was conducted during a rather
turbulent time in the U.S automobile market; therefore, the response rate was considered
moderately low (Kumar, Antony, & Cho, 2009).
22
Figure 4: Six Sigma Performance Measures Model
Boumen (2007) study regarding the
with examples
of practical applications. The research was performed as part of the Tangram research
project in cooperation with the Embedded Systems Institute of the Eindhoven University
of Technology and several other industry partners. He concluded that integration of
automated test plans are often more efficient than manually created plans, which reduces
the time-to-market of a complex system while maintaining the same final system quality.
Testing complex manufacturing systems, like lithographic machines, can involve
as much as 45% of the total development time of a system. This testing can be reduced
by choosing which test protocols must be performed in which sequence, without making
23
investments in test cases or the system. By utilizing the test sequencing method
developed by Boumen (2007), it is possible to make decisions that allow for a time, cost,
and quality optimal test sequence to be constructed.
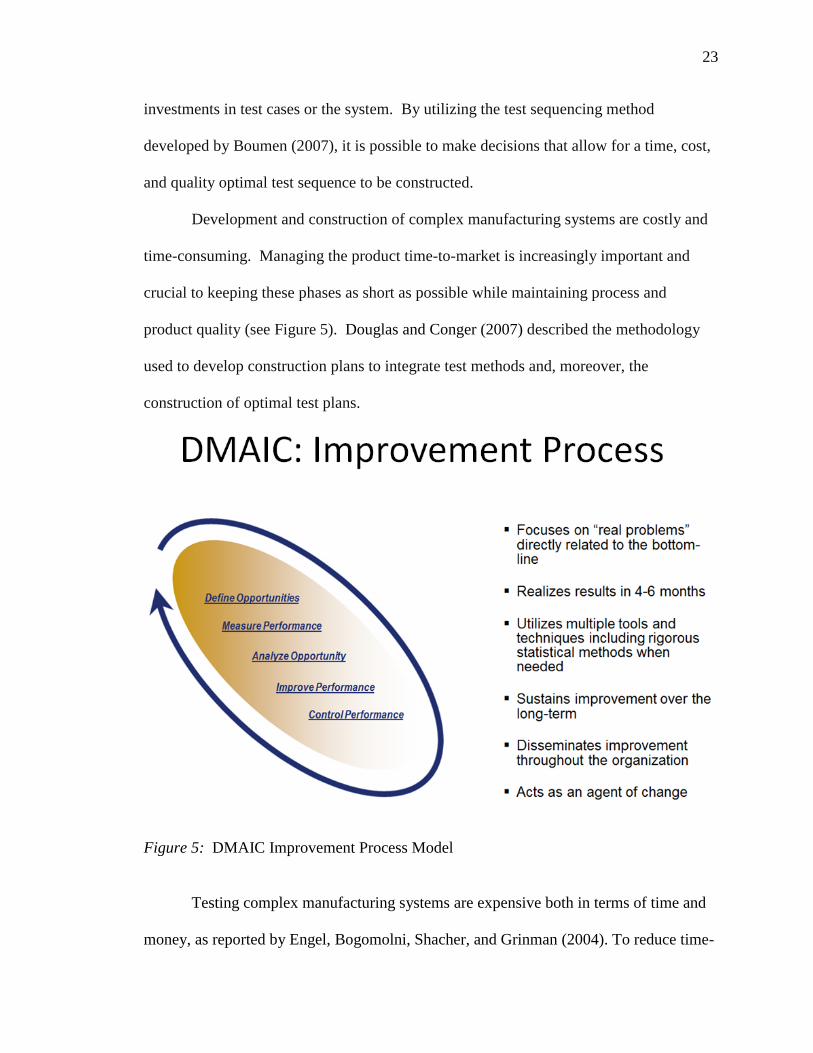
Development and construction of complex manufacturing systems are costly and
time-consuming. Managing the product time-to-market is increasingly important and
crucial to keeping these phases as short as possible while maintaining process and
product quality (see Figure 5). Douglas and Conger (2007) described the methodology
used to develop construction plans to integrate test methods and, moreover, the
construction of optimal test plans.
Figure 5: DMAIC Improvement Process Model
Testing complex manufacturing systems are expensive both in terms of time and
money, as reported by Engel, Bogomolni, Shacher, and Grinman (2004). To reduce time-
24
to-market of a new system or to reduce the lead time during the manufacturing of these
systems, it is crucial to reduce the test time. Reducing test time can be accomplished by:
(1) making testing faster by automation of test items, (2) making testing easier, by
changing the system, and (3) doing testing smarter by choosing wisely which test cases to
perform and in what sequence.
To achieve integration and test time reduction, three methods have been
developed. The methods include: (1) construction of an optimal integration and test plan
with respect to time, (2) cost, and (3) quality. The test program optimization method
consisted of two steps and the first phase was the definition of a model of the test
problem. The second phase consisted of calculating the optimal test plan based on the
test model, given an objective function and possible constraints. By constructing a graph
of the problem, all possible test sequences of the problem were obtained (Mothersell,
2000).
The integration plan optimization method consists of the same two steps as the
test program optimization method. The integration model consists of modes with
development times, interfaces that denoted system states represented by faults. This
solution included a set of test sequences in which the test sequence depends on the
outcome (pass/fail) of the previous tests (Emiliani, 2003).
The integration and test planning methods can be used to optimize real-life
industrial integration and test plans. These plans may also be used for solving other
problems. The results obtained from the project could be leveraged by providing an
overview of challenges that may be solved using the methods developed (Emiliani,
2003). The research concluded that a successful integration method had been developed
that created an optimal test plan. The method is based on sequential diagnosis methods
25
from the literature and is adjusted to solve test planning problems for test phases. The
study also concluded that a method had been developed that created an optimal
integration plan. This particular method was based on assembly sequencing methods
from the literature and is adjusted to solve integration planning problems. The
conclusion was that a plan had been developed that created both an integration and test
planning process. Several strategies could be used to combine integration and test plans.
Practical extensions were introduced to solve real-life industrial problems. This study
determined that there was also ample opportunity for continued research and
development (Emiliani, 2003). The study recommended that further development and
examination be focused on extending the current methods into the industry on a larger
scale (Engel, Bogomolni, Shacher, & Grinman, 2004).
Economic Impact Related to Lean Six Sigma
General Electric's Jack Welch described Six Sigma as "the most important
initiative GE has ever undertaken" (Bandrowski & Madison, 2003a). GE's operating
income, a critical measure of business efficiency and profitability, hovered around the
10% level for decades. In 1995, Welch mandated that each GE operation, from credit
card services to aircraft engine plants to NBC-TV, work together achieving Six Sigma.
GE averaged about 3.5 sigma when it introduced the program. With Six Sigma
embedding itself deeper into the organization's processes, GE achieved the previously
"impossible" operating margin of 16.7% in 1998, up from 13.6% in 1995 when GE
implemented Six Sigma focusing on the reduction of variation (see Figure 6). In dollar
amounts, Six Sigma delivered more than $300 million to GE's 1997 operating income,
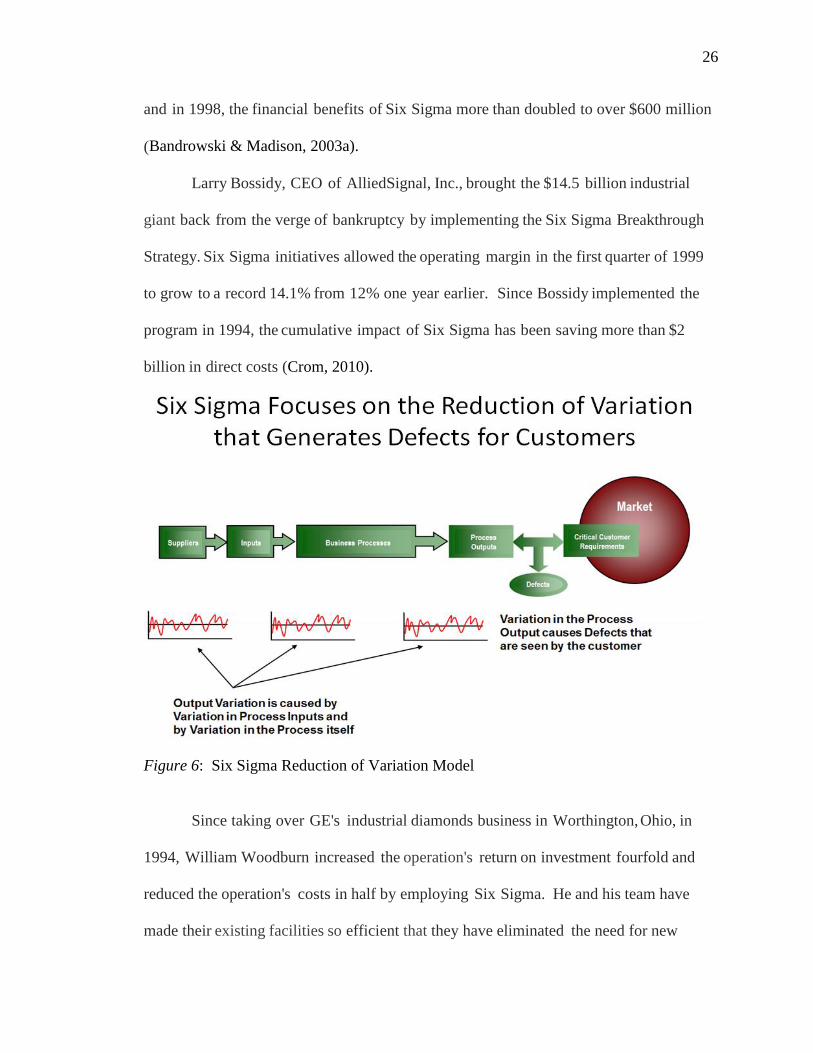
26
and in 1998, the financial benefits of Six Sigma more than doubled to over $600 million
(Bandrowski & Madison, 2003a).
Larry Bossidy, CEO of AlliedSignal, Inc., brought the $14.5 billion industrial
giant back from the verge of bankruptcy by implementing the Six Sigma Breakthrough
Strategy. Six Sigma initiatives allowed the operating margin in the first quarter of 1999
to grow to a record 14.1% from 12% one year earlier. Since Bossidy implemented the
program in 1994, the cumulative impact of Six Sigma has been saving more than $2
billion in direct costs (Crom, 2010).
Figure 6: Six Sigma Reduction of Variation Model
Since taking over GE's industrial diamonds business in Worthington, Ohio, in
1994, William Woodburn increased the operation's return on investment fourfold and
reduced the operation's costs in half by employing Six Sigma. He and his team have
made their existing facilities so efficient that they have eliminated the need for new
27
plants and equipment for at least another 10 years. Woodburn and GE's industrial
diamond business exemplify how Six Sigma can enable a company to decrease costs,
enhance productivity, and eliminate the need for new plant and equipment investments.
Polaroid Corporation's Joseph J. Kasabula believed that the most compelling
reason companies embrace Six Sigma is its impact on the bottom line. Six Sigma is
helping Polaroid to add 6 % to its bottom line each year. Asea Brown Boveri (ABB),
which successfully applied Six Sigma to its power transformer facility in Munich,
Indiana, has reduced measurement equipment error by 83%, piece count error from
8.3% to 1.3%, and no-load loss to within 2%. ABB also improved material handling,
resulting in an annual estimated cost savings of $775,000 for a single process within a
single plant (Bandrowski & Madison, 2003a).
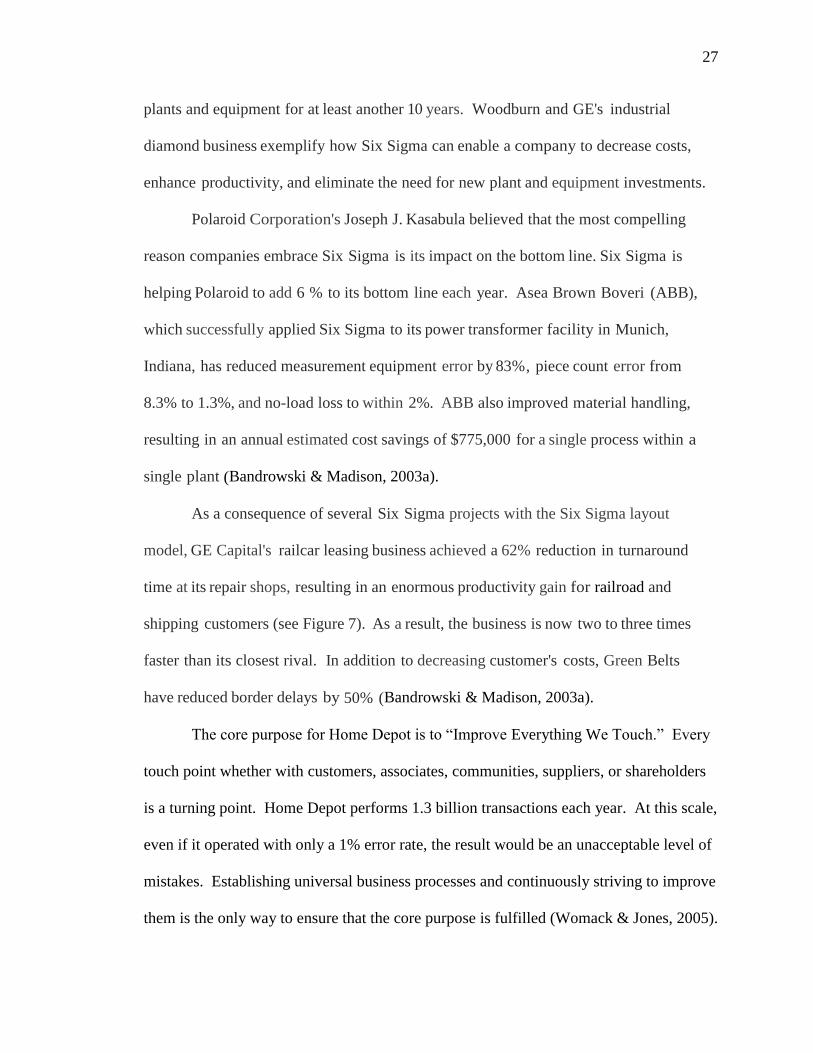
As a consequence of several Six Sigma projects with the Six Sigma layout
model, GE Capital's railcar leasing business achieved a 62% reduction in turnaround
time at its repair shops, resulting in an enormous productivity gain for railroad and
shipping customers (see Figure 7). As a result, the business is now two to three times
faster than its closest rival. In addition to decreasing customer's costs, Green Belts
have reduced border delays by 50% (Bandrowski & Madison, 2003a).
Everything W
touch point whether with customers, associates, communities, suppliers, or shareholders
is a turning point. Home Depot performs 1.3 billion transactions each year. At this scale,
even if it operated with only a 1% error rate, the result would be an unacceptable level of
mistakes. Establishing universal business processes and continuously striving to improve
them is the only way to ensure that the core purpose is fulfilled (Womack & Jones, 2005).
28
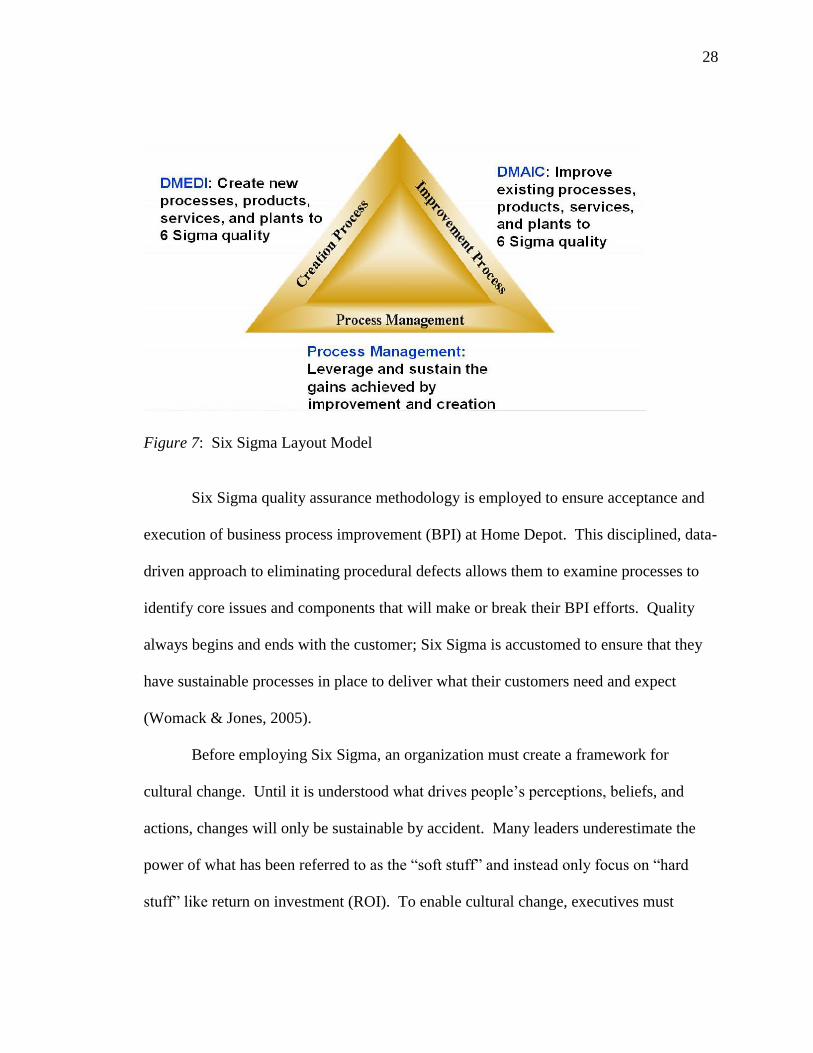
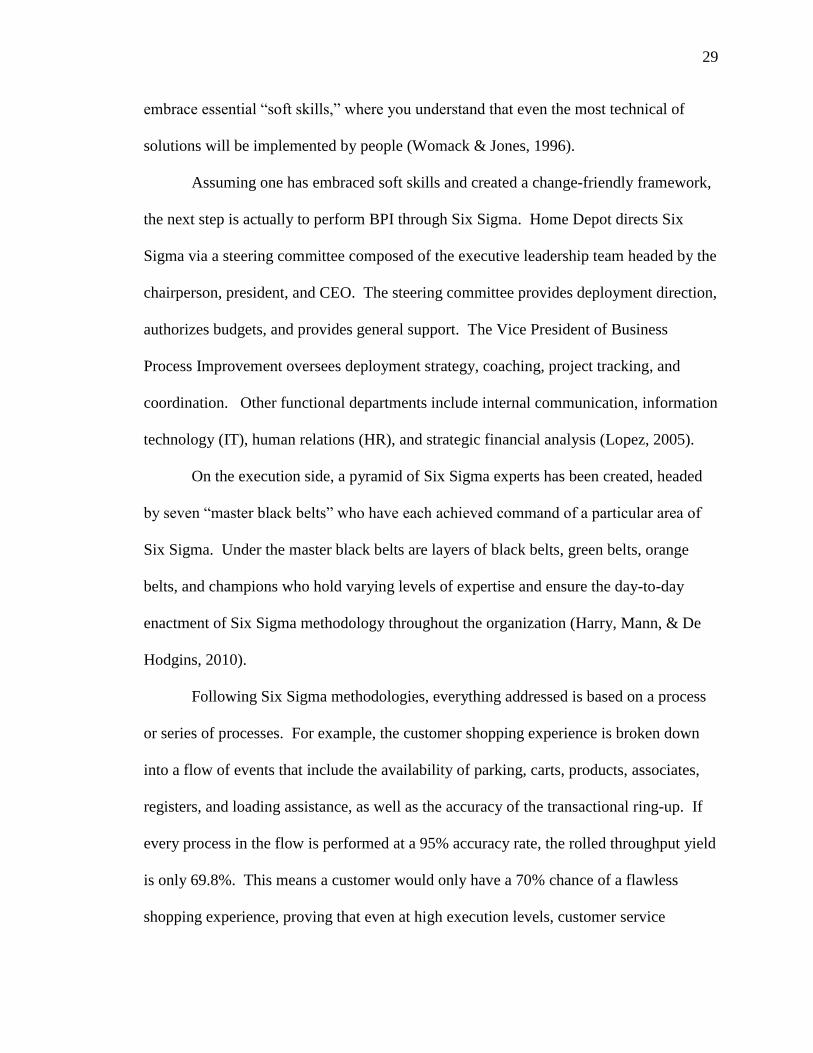
Figure 7: Six Sigma Layout Model
Six Sigma quality assurance methodology is employed to ensure acceptance and
execution of business process improvement (BPI) at Home Depot. This disciplined, data-
driven approach to eliminating procedural defects allows them to examine processes to
identify core issues and components that will make or break their BPI efforts. Quality
always begins and ends with the customer; Six Sigma is accustomed to ensure that they
have sustainable processes in place to deliver what their customers need and expect
(Womack & Jones, 2005).
Before employing Six Sigma, an organization must create a framework for
cultural change. Until it is understood eliefs, and
actions, changes will only be sustainable by accident. Many leaders underestimate the
power of what has been referred
return on investment (ROI). To enable cultural change, executives must
29
even the most technical of
solutions will be implemented by people (Womack & Jones, 1996).
Assuming one has embraced soft skills and created a change-friendly framework,
the next step is actually to perform BPI through Six Sigma. Home Depot directs Six
Sigma via a steering committee composed of the executive leadership team headed by the
chairperson, president, and CEO. The steering committee provides deployment direction,
authorizes budgets, and provides general support. The Vice President of Business
Process Improvement oversees deployment strategy, coaching, project tracking, and
coordination. Other functional departments include internal communication, information
technology (IT), human relations (HR), and strategic financial analysis (Lopez, 2005).
On the execution side, a pyramid of Six Sigma experts has been created, headed
Six Sigma. Under the master black belts are layers of black belts, green belts, orange
belts, and champions who hold varying levels of expertise and ensure the day-to-day
enactment of Six Sigma methodology throughout the organization (Harry, Mann, & De
Hodgins, 2010).
Following Six Sigma methodologies, everything addressed is based on a process
or series of processes. For example, the customer shopping experience is broken down
into a flow of events that include the availability of parking, carts, products, associates,
registers, and loading assistance, as well as the accuracy of the transactional ring-up. If
every process in the flow is performed at a 95% accuracy rate, the rolled throughput yield
is only 69.8%. This means a customer would only have a 70% chance of a flawless
shopping experience, proving that even at high execution levels, customer service
30
delivery is a difficult journey that requires total commitment (Harry, Mann, & De
Hodgins, 2010).
To provide a customer experience of the highest possible quality, there must be an
understanding and measurement of ) factors such as
overall shopping experience, store atmosphere, in-stock levels and associate helpfulness
from every point of view (Sower, Savoie, & Renick, 1999). By analyzing CTQs and
comparing them to sales conversions, it can be determined what percentage of customers
receive a defect-free shopping experience. Additionally, ways can be discovered to boost
the percentage as close to 100 percent as possible (Lopez, 2005).
Leveraging technology to identify trends and provide timely analysis is a critical
factor for success. Information Technology integration helps to perform Six Sigma-based
BPI at the desired speed of execution. Systems governing business components such as
labor, intranet, forecasting, and project management, as well as different platforms, must
all be tightly integrated and freely share data for Six Sigma to be truly successful.
Measuring progress every step of the way is the foundation of maintaining a focused,
disciplined approach. Home Depot accomplishes this by driving expectations and
- and six- month
rollout reviews and audits of project financials (Lopez, 2005).
What types of process improvement does Six Sigma actually enable? Home
Depot has launched numerous successful BPI projects based on Six Sigma methodology.
For example, on the logistics side they were able to save millions of dollars in the supply
chain by reducing less-than-truckload (LTL) shipments to improve truck utilization.
Additionally, they discovered through customer feedback that vacuum cleaners were
placed out of reach on the display shelf, prohibiting shoppers from seeing, feeling, or
31
using the product prior to purchase. By shelving vacuum cleaners at floor level, sales
were improved. At the point of purchase, analysis of loss patterns revealed that by
implementing wireless scan guns for cashiers, the errors were significantly reduced and
customer flow-through was quicker (Lopez, 2005).
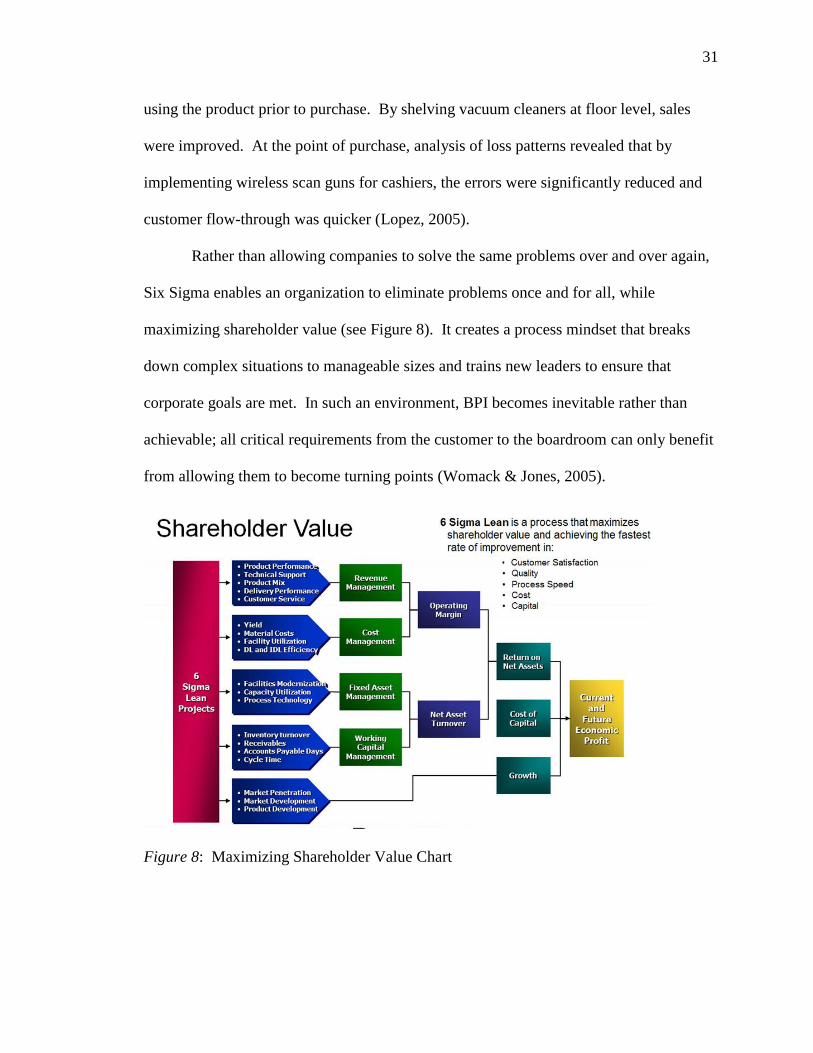
Rather than allowing companies to solve the same problems over and over again,
Six Sigma enables an organization to eliminate problems once and for all, while
maximizing shareholder value (see Figure 8). It creates a process mindset that breaks
down complex situations to manageable sizes and trains new leaders to ensure that
corporate goals are met. In such an environment, BPI becomes inevitable rather than
achievable; all critical requirements from the customer to the boardroom can only benefit
from allowing them to become turning points (Womack & Jones, 2005).
Figure 8: Maximizing Shareholder Value Chart
32
Summary
The literature review included a historical perspective on the origins of Lean Six
Sigma and related methodologies in manufacturing. The findings regarding successful
implementation strategies, an examination of the barriers to implementation of Lean Six
Sigma, and Lean Six Sigma methodologies were discussed. The primary principle of
Lean Six Sigma is the focus on activities critical to quality that offer the greatest
opportunity to improve cost, quality, capital, and lead time (Truby, 2000). It was
revealed that Lean Six Sigma methodologies could be a very powerful tool for tackling
process inefficiency problems in advanced manufacturing industries including a variety of
aviation and aerospace operations. However, this powerful methodology has not yet been
widely adopted by many universities and colleges due to the misconception that it is
only intended for manufacturing companies. Not only are colleges and universities
failing to adopt Lean Six Sigma methodologies into business processes, but few are also
providing courses or in-depth curriculum and practice in Lean Six Sigma.
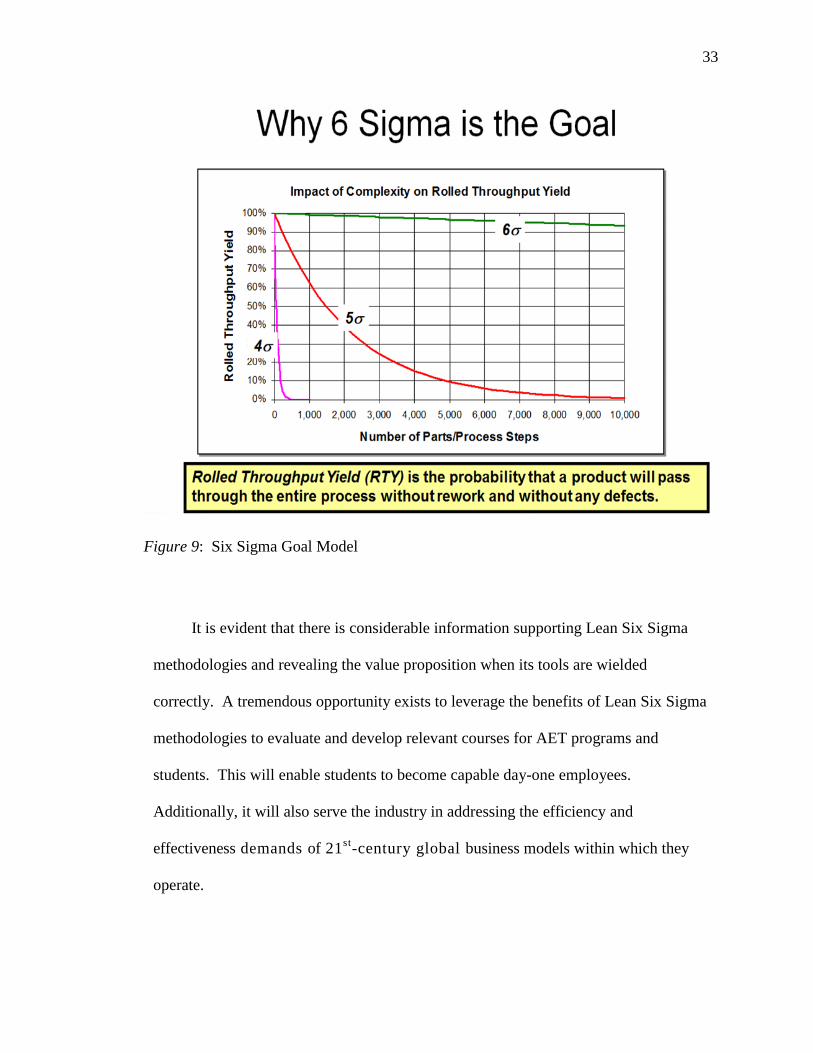
The question that emerges is, why implement Six Sigma into the AET
curriculum? The key objective in using Six Sigma goal model in many companies is to
execute game winning strategies and drive shareholder and customer value (see Figure
9). As indicated by the majority of the findings, financial performance will be improved
from the implementation of Lean Six Sigma methodologies. Other benefits gained from
implementation of Lean Six Sigma are an improved work environment, active workforce
involvement in the business, knowledge makes you more valuable, personal learning and
advancement, improved work culture and job satisfaction, and cohesive, participative,
and self-directed teams (Caterpillar Inc., 2000).
33
Figure 9: Six Sigma Goal Model
It is evident that there is considerable information supporting Lean Six Sigma
methodologies and revealing the value proposition when its tools are wielded
correctly. A tremendous opportunity exists to leverage the benefits of Lean Six Sigma
methodologies to evaluate and develop relevant courses for AET programs and
students. This will enable students to become capable day-one employees.
Additionally, it will also serve the industry in addressing the efficiency and
effectiveness demands of 21st-century global business models within which they
operate.
34
CHAPTER 3: METHODOLOGY
Rationale
The purpose of this study was to develop and evaluate Lean Six Sigma advanced
manufacturing methodologies as a course tailored to the training and education needs of
students in an AET program and students within other technology manufacturing
disciplines. The final outcome was to develop an Aeronautical Engineering Technology
course that provides students opportunities to learn and implement advanced
manufacturing techniques that are utilized in the aviation industry.
Advisory Board indicated that a gap surrounding Six Sigma practices existed among AET
students that could be addressed through additional training, thereby, improving
manufacturing and process competencies demanded by modern aviation manufacturing
and operational environments. This study can benefit the AET curriculum and
complement existing coursework, exposing students to modern manufacturing
philosophies. It is a capstone of the student experience with a practical application of
manufacturing techniques. The methodology, population and sample, methods for
sampling, description of the survey, data analysis, and discussion of reliability and
validity for the study are components of the evaluation of the course curriculum. The
research methodology is described along with the rationale for its selection. The
methodologies used for this study included a Pre-test/Post-test assessment of student
knowledge levels and a course evaluation survey. The Pre-test assessment was used to
35
determine student knowledge before participating in the Lean Six Sigma advanced
manufacturing course. After completion of the course, students were administered the
Post-test assessment to evaluate their knowledge level after participating in the
curriculum. The Pre-test and Post-test were then compared to assess whether student
understanding and knowledge levels of Lean Six Sigma had increased. The evaluation
survey was administered to the students at the conclusion of instruction to evaluate
student perceptions of the course.
Upon successful completion of the advanced aviation manufacturing curriculum,
students should possess the necessary knowledge and expertise to perform as effective
leaders and problem solvers in an advanced manufacturing environment. The objectives
of the curriculum include: (1) demonstrate competencies to utilize advanced
manufacturing processes required to operate a manufacturing facility, (2) utilize
advanced process quality planning methods to implement a quality program into a
manufacturing facility, (3) acquire knowledge and experience to implement supply chain
management techniques to implement a logistic program into a manufacturing facility,
and (4) attain knowledge of effective continuous improvement processes that will be
utilized effectively and promoted throughout the program.
Theoretical Framework
The overall goal of this study was to develop a theoretical approach for
implementing a Lean Six Sigma advanced manufacturing research methodologies course
into Aeronautical Engineering Technology curriculum. The theoretical concept was
defined as the integration of various industrial work ideas that are traditional regarding
structure and theories, derived from synergizing different views to create a theoretical
36
approach. By creating a new approach, the focus was on generating a functional premise
on which to base the implementation of a Lean Six Sigma advanced manufacturing
research methodologies course into the AET curriculum. The course has practical and
project-based learning objectives as well as theory-based illustrations. The foundation
for building the functional premise was constructed upon review of the seminal and
empirical literature. Further, feedback was received from stakeholders as to what they
deemed beneficial and value-added for the AET students enrolled in the course.
There was a perceived need for further research in the area of development and
evaluation of Lean Six Sigma advanced manufacturing techniques in the AET course
curriculum, based on the viewpoint of participants and the ideas and thoughts of those
currently engaged in the environment and affected by the change. The points illustrated
encompassed the main focus areas of Lean Six Sigma advanced manufacturing
methodologies.
The plan of study requirements were assessed to ensure the appropriateness of
developing and evaluating a Lean Six Sigma advanced manufacturing course for
integration into the curriculum. Assessment, psychometric analysis, and survey methods
were utilized. The assessment employed a Pre-test to attain a baseline knowledge level
of students prior to exposure to the course. The students were then given the Post-test at
the completion of the course presentation. The Pre-test and Post-test scores were
analyzed using SPSS statistical software. As part of the course validation process, the
Pre-test/Post-test instrument was examined using psychometric information collected to
estimate internal consistency reliability, validity, item discrimination, and difficulty index
(Carmines & Zeller, 1979; Cronbach, 1990; Guilford, 1954; Nunnally & Bernstein,
1994). The final method of analysis was a course evaluation survey administered to the
37
AET students who participated in the Lean Six Sigma advanced manufacturing course.
The survey collected systematic and empirical data from the subjects. Descriptive
statistics about the perceptions of the Lean Six Sigma advanced manufacturing
methodologies course were estimated and interpreted.
As a project-based learning laboratory, this study provided students with the
opportunity to perform in an educational environment that was very similar to an
industrial working environment. The projects for the course were developed from the
required outcomes of the SATT for the ABET-ETAC accredited plan of study and
included:
1. Technical expertise in engineering materials, statics, strength of materials, applied
aerodynamics, applied propulsion, and either electrical power or electronics.
2. Technical expertise having added depth in a minimum of three subject areas
chosen from: manufacturing processes, vehicle design and modification,
engineering materials, electro-mechanical devices and controls, industrial
operations, and systems engineering including the appreciation of the engineering
design cycle and the system life cycle relating to the manufacture and
maintenance of aeronautical/aerospace vehicles and their components.
3. Ability to function effectively as a member or leader of a technical team.
4. Ability to apply written, oral, and graphical communication in both technical and
nontechnical environments, and capacity to identify and use appropriate technical
literature.
5. Understanding of and a commitment to addressing professional and ethical
responsibilities including respect for diversity.
6. A commitment to quality, timeliness, and continuous improvement.
38
Population and Sample
The population for this study consisted of students enrolled in the Aeronautical
Engineering Technology (AET) major in the School of Aviation and Transportation
Technology at a large midwestern university. The total enrollment for the AET major
during the study was between 225 and 259 students. The population was selected
because the AET students were using the laboratory space in the School of Aviation and
Transportation Technology to perform practical hands-on projects related to their aviation
major. The subjects for the study consisted of all 28 students who were enrolled in the
Lean Six Sigma Advanced Manufacturing course. The AET plan of study requires
students to receive instruction in logistics, quality, and manufacturing terms and
descriptions. The students are required to utilize the information learned and some of the
basic lean manufacturing/continuous improvement philosophies to complete a senior
capstone project. The plan exposed students to a manufacturing facility that closely
resembled an operation that they could be hired to manage. Part of this plan allowed for
organizing the powerplant lab space into more of a manufacturing cell, enabling learners
to explore developing and operating a manufacturing facility. Courses were offered
concurrently with gas turbine technical coursework. Students in the manufacturing
course developed and implemented manufacturing simulations. Students in the turbine
classes received education and training on the engines, while the Lean Six Sigma
advanced manufacturing students managed the operation from the process development
perspective. The study allows for the development of a world-class facility to train and
educate future aviation manufacturing professionals. This facility is capable of teaching
not only aviation students, but also advanced manufacturing students from any venue.
39
Instrumentation
Two instruments were developed and utilized in this study. The first was the Pre-
test/Post-test assessment tool (see Appendix A). The assessment tool had been developed
and pilot-tested for two semesters prior to use in this study. It was used to compare the
before and after course results. The subjects were administered a 50 item multiple-choice
Pre-test prior to exposure to the Lean Six Sigma advanced manufacturing course
materials. The data from the assessment of the Pre-test/Post-test was used to estimate the
reliability and validity of the instrument. The psychometric information included
reliability, validity, item discrimination, and item difficulty (Carmines & Zeller, 1979;
Cronbach, 1990; Guilford, 1954; Nunnally & Bernstein, 1994). The Pre-test internal
consistency reliability estimate was .984, and the Post-
test internal consistency reliability rating estimate was
.978. Reliability provides an indication of the precision of measurement of a uniform
construct, and the error.
Measurement errors may be caused by: (1) examinee-specific factors such as motivation,
concentration, fatigue, boredom, momentary lapses in memory, carelessness in marking
answers, and lucky guesses, (2) test-specific factors such as specific questions selected for
a test, ambiguous or tricky items, and poor directions, and (3) scoring-specific factors such
as non-uniform scoring guidelines, carelessness, and counting or computational errors.
An unreliable test offers no advantage over randomly assigning test scores to students.
Therefore, it is desirable to use tests that demonstrate good reliability to ensure the test
scores reflect more than random error (Wells & Wollack, 2003). Additionally, reliability
is a prerequisite to test validity. If test scores cannot be assigned consistently, it is
virtually impossible to conclude that the scores measure accurately. Validity refers to the
40
extent to which inferences are made from a test are justified and accurate. Accordingly,
adequate validity and reliability estimates are essential for useful assessment instruments
and procedures (Wells & Wollack, 2003). An acceptable reliability estimate for new
instruments is .70. It is generally considered unusual
for validity coefficients to rise above .60 (Carmines & Zeller, 1979; Cronbach, 1990;
Guilford, 1954; Nunnally & Bernstein, 1994). Additionally, a correlation calculation was
performed using the assessment scores from the Pre-test and the Post-test to assess the
validity of the test instrument. The validity coefficient of .46 was considered adequate.
Validity is a function of the item difficulty of a test and defines how well a test measures
what it was designed to measure.
The item discrimination index (D) measures the extent to which a test item
discriminates or differentiates between students who do well on the overall test and those
who do not do well on the overall test. There are three types of discrimination indexes: (1)
positive discrimination index, persons who did well on the overall test chose the correct
answer for a particular item more often than those who did poorly on the overall test; (2)
negative discrimination index, persons who did poorly on the overall test chose the correct
answer for a particular item more often than those who did well on the overall test, and
(3) zero discrimination index, persons who did well and those who did poorly on the
overall test chose the correct answer for a particular item with equal frequency. The item
discrimination analysis of the test instrument had a range that remained positive for all 50
test items ranging from .18 to .27. Therefore, test items demonstrated a positive
discrimination.
The item difficulty index indicates the proportion of students who answered the
item correctly. The difficulty index (p) for the Pre-test given to the students at the
41
beginning of the semester yielded a range from .18 to 1.00, with an overall average of .62
and indicates that The difficulty index (p) for
the Post-test of the 50 items had a range from .47 to 1.00 and an overall average of .69.
This range indicated a high proportion of students selected the correct response; the
assessment items were categorized relatively is
result, therefore, may be expected since the students had received instruction regarding
course content along with engaging in practical lab activities using the methodologies
throughout the semester (Carmines & Zeller, 1979; Cronbach, 1990; Guilford, 1954;
Nunnally & Bernstein, 1994). The instrument was determined to have an adequate
degree of content and face validity and internal consistency reliability. Therefore, it was
used to assess prior knowledge of the Lean Six Sigma tools and to tailor the course
objectives to student needs.
After completion of the course, the subjects were again administered the Post-test
to assess their knowledge level of the Lean Six Sigma tools after receiving instruction
and engaging in hands-on project-based learning objectives. Comparative analysis using
a paired samples t-test and Analysis of Covariance (ANCOVA) (Howell, 2006; Miller &
Chapman, 2001; Rutherford, 2000) test were conducted to assess knowledge levels and
report the results. The results of the Pre-test/Post-test analysis indicated that the
instrument would be acceptable for the study.
The Aeronautical Engineering Technology Lean Six Sigma Course Evaluation
Survey was developed to assess the perceptions of AET students after completion of the
Lean Six Sigma course (see Appendix B). The design of the survey was critical to the
success of the research. The survey used a Likert-type scale using five options. The
survey consisted of two sections: Part A and Part B. The introduction provided students a
42
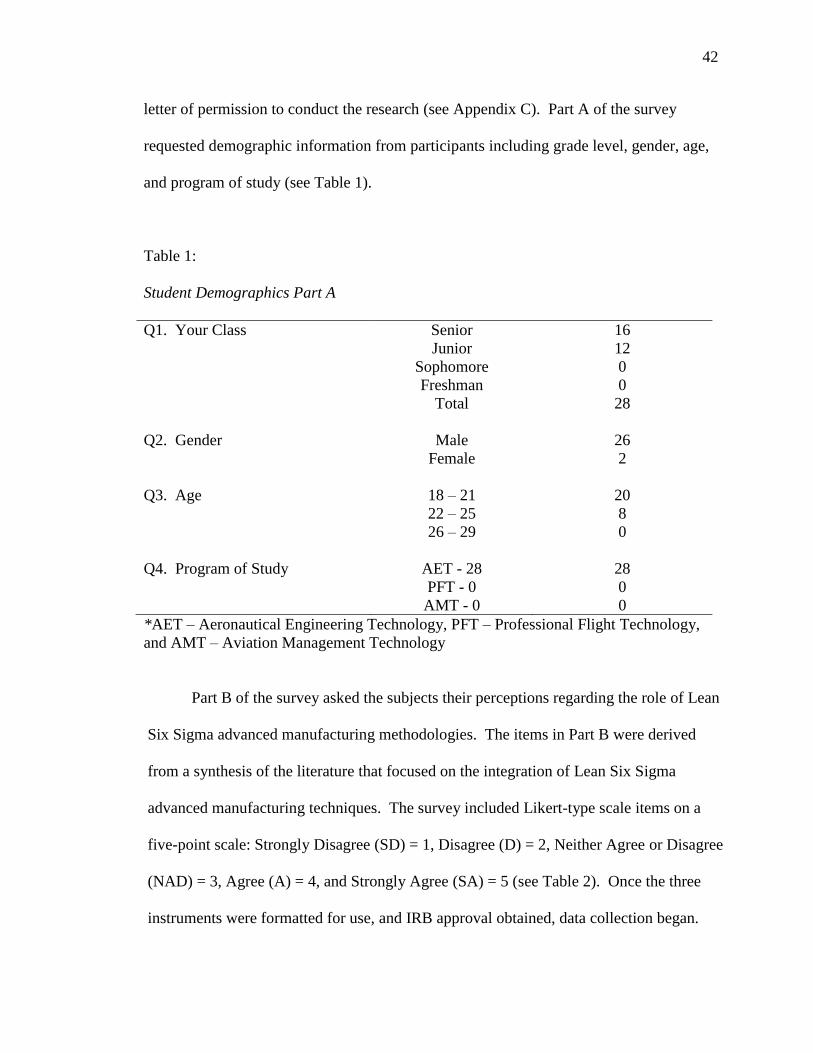
letter of permission to conduct the research (see Appendix C). Part A of the survey
requested demographic information from participants including grade level, gender, age,
and program of study (see Table 1).
Table 1:
Student Demographics Part A Q1. Your Class
Senior Junior
Sophomore Freshman
Total
16 12 0 0 28
Q2. Gender
Male Female
26 2
Q3. Age
18 21 22 25 26 29
20 8 0
Q4. Program of Study
AET - 28 PFT - 0 AMT - 0
28 0 0
*AET Aeronautical Engineering Technology, PFT Professional Flight Technology, and AMT Aviation Management Technology
Part B of the survey asked the subjects their perceptions regarding the role of Lean
Six Sigma advanced manufacturing methodologies. The items in Part B were derived
from a synthesis of the literature that focused on the integration of Lean Six Sigma
advanced manufacturing techniques. The survey included Likert-type scale items on a
five-point scale: Strongly Disagree (SD) = 1, Disagree (D) = 2, Neither Agree or Disagree
(NAD) = 3, Agree (A) = 4, and Strongly Agree (SA) = 5 (see Table 2). Once the three
instruments were formatted for use, and IRB approval obtained, data collection began.
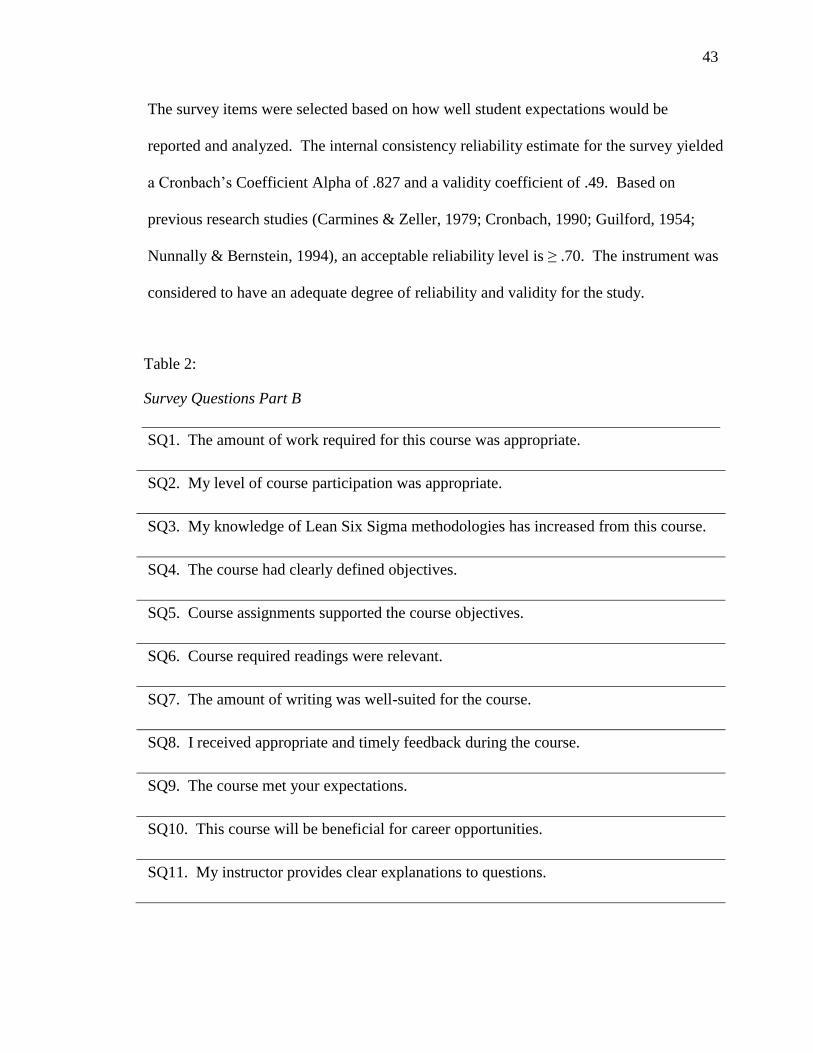
43
The survey items were selected based on how well student expectations would be
reported and analyzed. The internal consistency reliability estimate for the survey yielded
Coefficient Alpha of .827 and a validity coefficient of .49. Based on
previous research studies (Carmines & Zeller, 1979; Cronbach, 1990; Guilford, 1954;
Nunnally & Bernstein, 1994), an acceptable reliability level is .70. The instrument was
considered to have an adequate degree of reliability and validity for the study.
Table 2:
Survey Questions Part B
SQ1. The amount of work required for this course was appropriate. SQ2. My level of course participation was appropriate. SQ3. My knowledge of Lean Six Sigma methodologies has increased from this course. SQ4. The course had clearly defined objectives. SQ5. Course assignments supported the course objectives. SQ6. Course required readings were relevant. SQ7. The amount of writing was well-suited for the course. SQ8. I received appropriate and timely feedback during the course. SQ9. The course met your expectations. SQ10. This course will be beneficial for career opportunities. SQ11. My instructor provides clear explanations to questions.
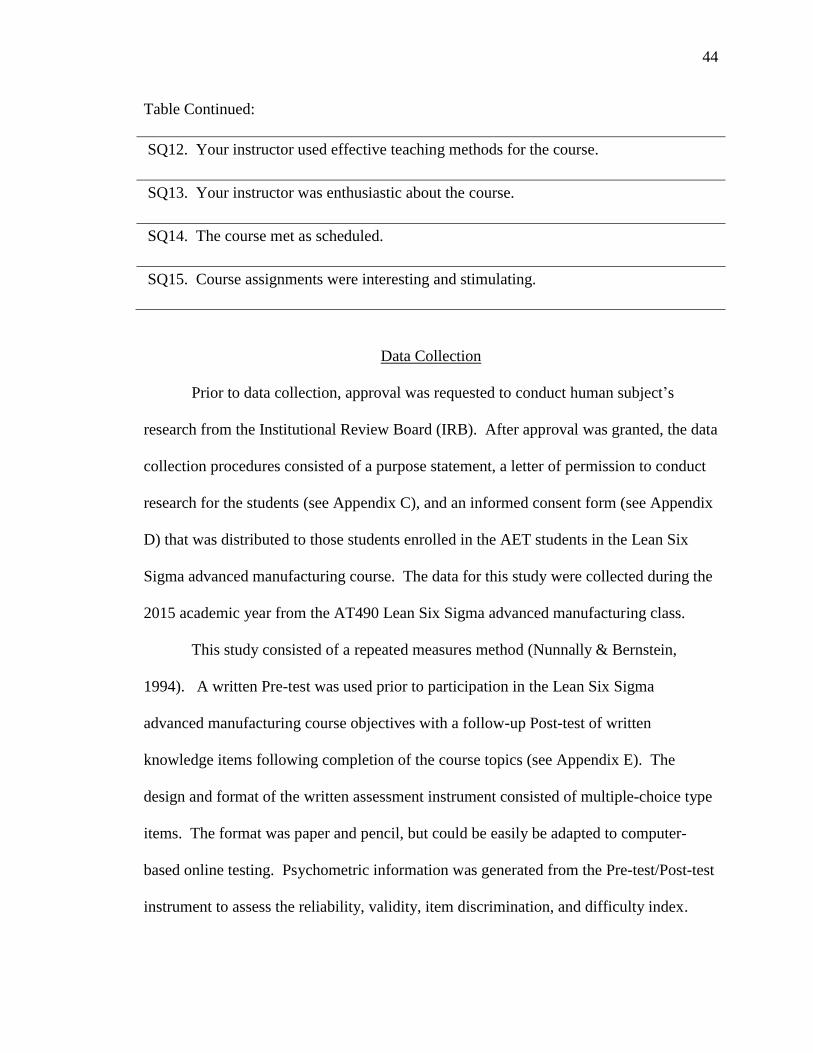
44
Table Continued:
SQ12. Your instructor used effective teaching methods for the course. SQ13. Your instructor was enthusiastic about the course. SQ14. The course met as scheduled. SQ15. Course assignments were interesting and stimulating.
Data Collection
Prior to data collection, approval was requested to conduct human subject s
research from the Institutional Review Board (IRB). After approval was granted, the data
collection procedures consisted of a purpose statement, a letter of permission to conduct
research for the students (see Appendix C), and an informed consent form (see Appendix
D) that was distributed to those students enrolled in the AET students in the Lean Six
Sigma advanced manufacturing course. The data for this study were collected during the
2015 academic year from the AT490 Lean Six Sigma advanced manufacturing class.
This study consisted of a repeated measures method (Nunnally & Bernstein,
1994). A written Pre-test was used prior to participation in the Lean Six Sigma
advanced manufacturing course objectives with a follow-up Post-test of written
knowledge items following completion of the course topics (see Appendix E). The
design and format of the written assessment instrument consisted of multiple-choice type
items. The format was paper and pencil, but could be easily be adapted to computer-
based online testing. Psychometric information was generated from the Pre-test/Post-test
instrument to assess the reliability, validity, item discrimination, and difficulty index.
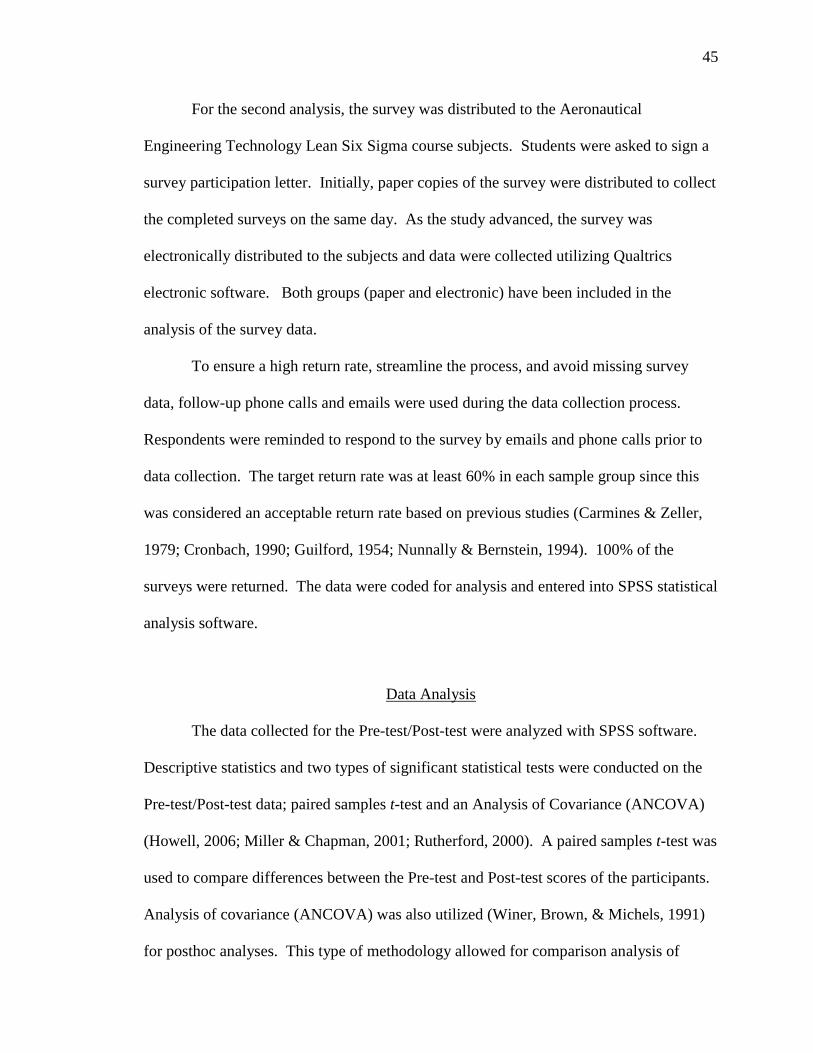
45
For the second analysis, the survey was distributed to the Aeronautical
Engineering Technology Lean Six Sigma course subjects. Students were asked to sign a
survey participation letter. Initially, paper copies of the survey were distributed to collect
the completed surveys on the same day. As the study advanced, the survey was
electronically distributed to the subjects and data were collected utilizing Qualtrics
electronic software. Both groups (paper and electronic) have been included in the
analysis of the survey data.
To ensure a high return rate, streamline the process, and avoid missing survey
data, follow-up phone calls and emails were used during the data collection process.
Respondents were reminded to respond to the survey by emails and phone calls prior to
data collection. The target return rate was at least 60% in each sample group since this
was considered an acceptable return rate based on previous studies (Carmines & Zeller,
1979; Cronbach, 1990; Guilford, 1954; Nunnally & Bernstein, 1994). 100% of the
surveys were returned. The data were coded for analysis and entered into SPSS statistical
analysis software.
Data Analysis
The data collected for the Pre-test/Post-test were analyzed with SPSS software.
Descriptive statistics and two types of significant statistical tests were conducted on the
Pre-test/Post-test data; paired samples t-test and an Analysis of Covariance (ANCOVA)
(Howell, 2006; Miller & Chapman, 2001; Rutherford, 2000). A paired samples t-test was
used to compare differences between the Pre-test and Post-test scores of the participants.
Analysis of covariance (ANCOVA) was also utilized (Winer, Brown, & Michels, 1991)
for posthoc analyses. This type of methodology allowed for comparison analysis of
46
various categories. The analysis was conducted by grade, gender, and race/ethnicity.
The decision criterion utilized was based on a 95% confidence interval with a level of
significance of p < .05. The means of two groups were also examined to determine if
there were any significant differences (p < .05) between the groups.
The final data analysis utilized a locally developed survey. Part A of the
Aeronautical Engineering Technology Lean Six Sigma course survey gathered
demographic information from participants including grade level, gender, age, and
program of study; frequencies were reported. These data described the overall
characteristics of the subjects and the population.
Part B of the survey used descriptive statistics. The data collected from the
surveys were analyzed with SPSS software to provide percentages, means, and standard
deviations related to each survey item. The internal consistency
Coefficient Alpha), means, and standard deviations for the Likert-scale items were
reported. The decision criterion utilized for the survey analysis was based on a 95%
confidence interval with a level of significance of p < .05. Survey response frequency
data were analyzed and interpreted.
47
CHAPTER 4: FINDINGS
The purpose of this study was to develop and evaluate Lean Six Sigma advanced
manufacturing methodologies for the Bachelor of Science degree program in the AET
curriculum. It also intended to develop an industry standards course based on the
education of future aviation manufacturing professionals. This chapter presents the
findings from the Pre-test/Post-test assessment and the survey data. The findings are
organized and presented around the research questions posited for this study.
Research Question #1: Did the knowledge level of AET students increase following
exposure to Lean Six Sigma and completion of the advanced manufacturing
methodologies course?
The Pre-test/Post-test assessment was utilized to answer research question #1.
The analysis examined the effects of the Lean Six Sigma advanced manufacturing
methodologies course intervention (changes between the Pre-test and Post-test scores) on
. A paired sample t-test was used for the analysis of before and
after results, since it allowed for comparison of two sample means, which in this study
consisted of the Pre-test and Post-test data. The purpose of the test was to determine
whether there was statistical evidence that the sample mean difference between the paired
observations on a particular outcome was significantly different from zero. The paired
samples t-test is a parametric test. Since the acceptable level of normality for kurtosis
and skewness was approximately -1 to 1, the data for the Pre-test and Post-test are
considered normally distributed. Also, the Shapiro-Wilk test for normality was
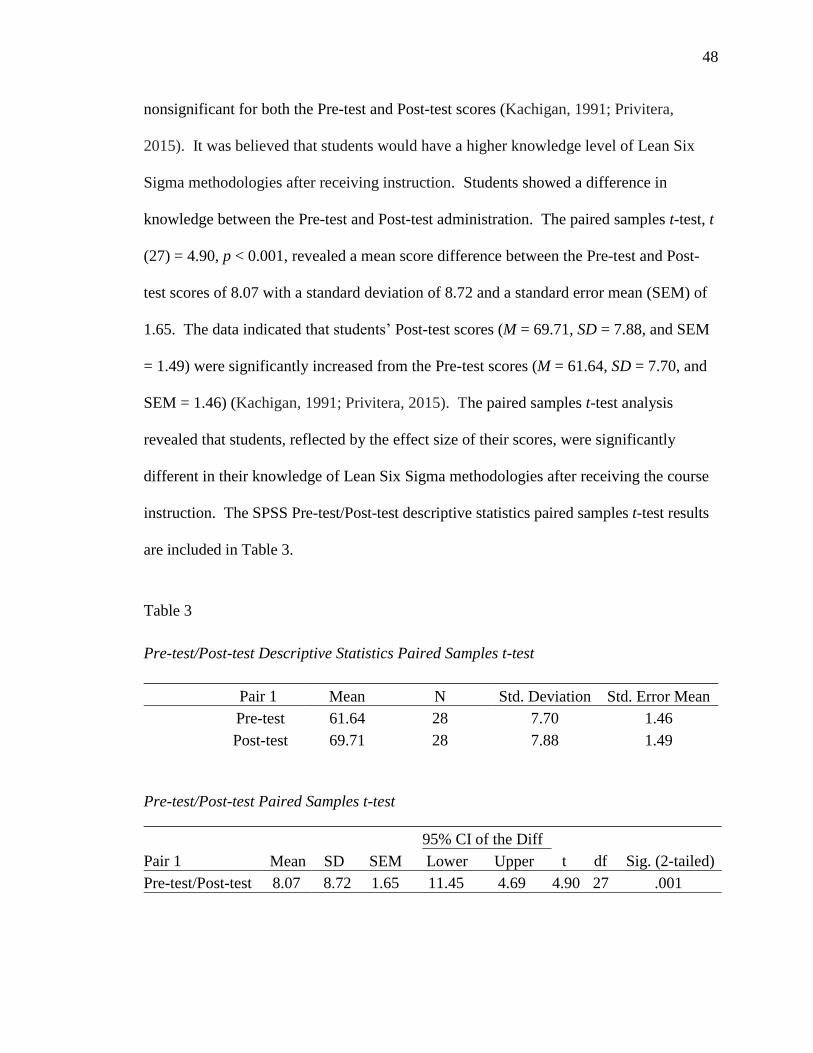
48
nonsignificant for both the Pre-test and Post-test scores (Kachigan, 1991; Privitera,
2015). It was believed that students would have a higher knowledge level of Lean Six
Sigma methodologies after receiving instruction. Students showed a difference in
knowledge between the Pre-test and Post-test administration. The paired samples t-test, t
(27) = 4.90, p < 0.001, revealed a mean score difference between the Pre-test and Post-
test scores of 8.07 with a standard deviation of 8.72 and a standard error mean (SEM) of
1.65. The data indicate Post-test scores (M = 69.71, SD = 7.88, and SEM
= 1.49) were significantly increased from the Pre-test scores (M = 61.64, SD = 7.70, and
SEM = 1.46) (Kachigan, 1991; Privitera, 2015). The paired samples t-test analysis
revealed that students, reflected by the effect size of their scores, were significantly
different in their knowledge of Lean Six Sigma methodologies after receiving the course
instruction. The SPSS Pre-test/Post-test descriptive statistics paired samples t-test results
are included in Table 3.
Table 3 Pre-test/Post-test Descriptive Statistics Paired Samples t-test Pair 1 Mean N Std. Deviation Std. Error Mean
Pre-test 61.64 28 7.70 1.46 Post-test 69.71 28 7.88 1.49
Pre-test/Post-test Paired Samples t-test
Pair 1 Mean SD SEM 95% CI of the Diff
t df Sig. (2-tailed) Lower Upper Pre-test/Post-test 8.07 8.72 1.65 - 11.45 4.69 4.90 27 .001
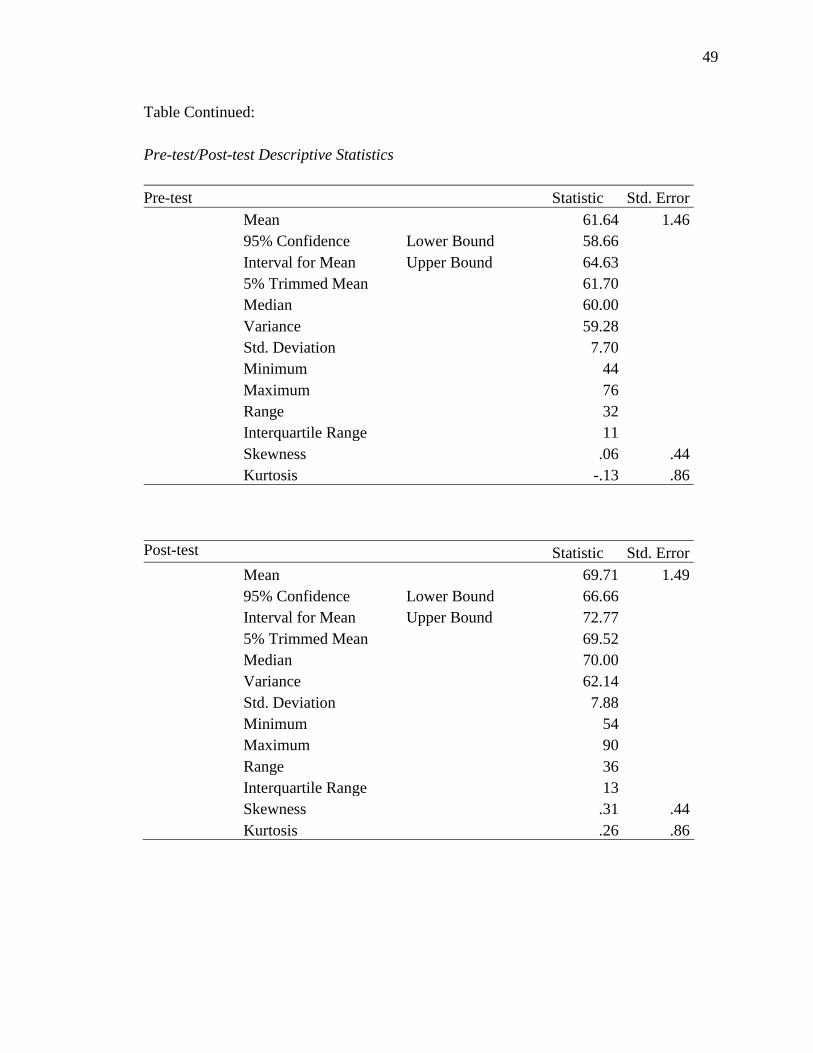
49
Table Continued: Pre-test/Post-test Descriptive Statistics Pre-test Statistic Std. Error Mean 61.64 1.46
95% Confidence Interval for Mean
Lower Bound 58.66
Upper Bound 64.63
5% Trimmed Mean 61.70
Median 60.00
Variance 59.28
Std. Deviation 7.70
Minimum 44
Maximum 76
Range 32
Interquartile Range 11
Skewness .06 .44 Kurtosis -.13 .86
Post-test Statistic Std. Error Mean 69.71 1.49
95% Confidence Interval for Mean
Lower Bound 66.66
Upper Bound 72.77
5% Trimmed Mean 69.52
Median 70.00
Variance 62.14
Std. Deviation 7.88
Minimum 54
Maximum 90
Range 36
Interquartile Range 13
Skewness .31 .44 Kurtosis .26 .86
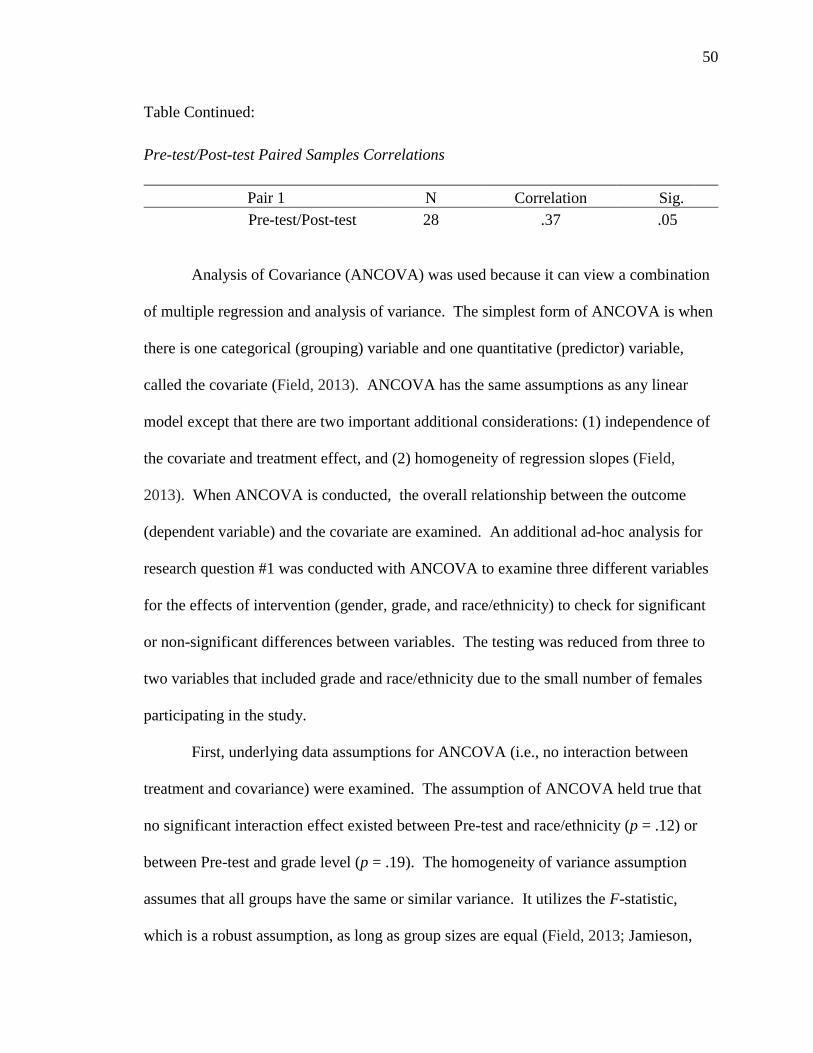
50
Table Continued: Pre-test/Post-test Paired Samples Correlations Pair 1 N Correlation Sig.
Pre-test/Post-test 28 .37 .05
Analysis of Covariance (ANCOVA) was used because it can view a combination
of multiple regression and analysis of variance. The simplest form of ANCOVA is when
there is one categorical (grouping) variable and one quantitative (predictor) variable,
called the covariate (Field, 2013). ANCOVA has the same assumptions as any linear
model except that there are two important additional considerations: (1) independence of
the covariate and treatment effect, and (2) homogeneity of regression slopes (Field,
2013). When ANCOVA is conducted, the overall relationship between the outcome
(dependent variable) and the covariate are examined. An additional ad-hoc analysis for
research question #1 was conducted with ANCOVA to examine three different variables
for the effects of intervention (gender, grade, and race/ethnicity) to check for significant
or non-significant differences between variables. The testing was reduced from three to
two variables that included grade and race/ethnicity due to the small number of females
participating in the study.
First, underlying data assumptions for ANCOVA (i.e., no interaction between
treatment and covariance) were examined. The assumption of ANCOVA held true that
no significant interaction effect existed between Pre-test and race/ethnicity (p = .12) or
between Pre-test and grade level (p = .19). The homogeneity of variance assumption
assumes that all groups have the same or similar variance. It utilizes the F-statistic,
which is a robust assumption, as long as group sizes are equal (Field, 2013; Jamieson,
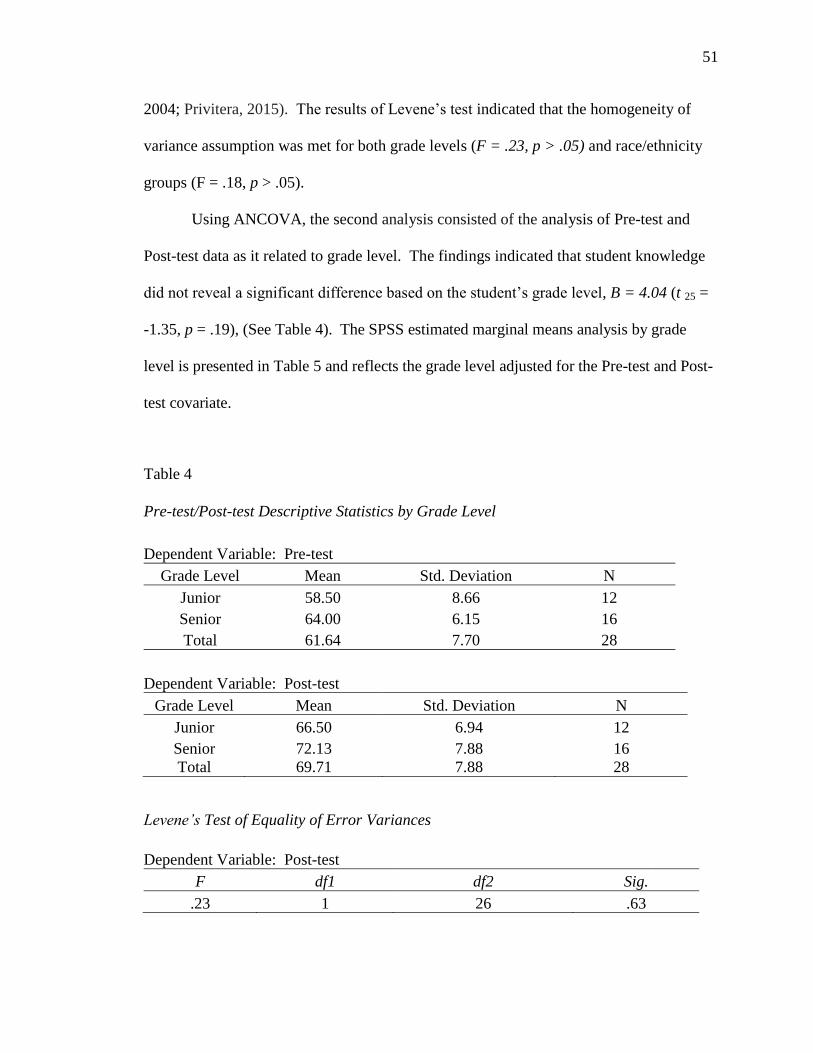
51
2004; Privitera, 2015). indicated that the homogeneity of
variance assumption was met for both grade levels (F = .23, p > .05) and race/ethnicity
groups (F = .18, p > .05).
Using ANCOVA, the second analysis consisted of the analysis of Pre-test and
Post-test data as it related to grade level. The findings indicated that student knowledge
, B = 4.04 (t 25 =
-1.35, p = .19), (See Table 4). The SPSS estimated marginal means analysis by grade
level is presented in Table 5 and reflects the grade level adjusted for the Pre-test and Post-
test covariate.
Table 4
Pre-test/Post-test Descriptive Statistics by Grade Level Dependent Variable: Pre-test
Grade Level Mean Std. Deviation N Junior 58.50 8.66 12 Senior 64.00 6.15 16 Total 61.64 7.70 28
Dependent Variable: Post-test
Grade Level Mean Std. Deviation N Junior 66.50 6.94 12 Senior 72.13 7.88 16 Total 69.71 7.88 28
Test of Equality of Error Variances
Dependent Variable: Post-test F df1 df2 Sig.
.23 1 26 .63
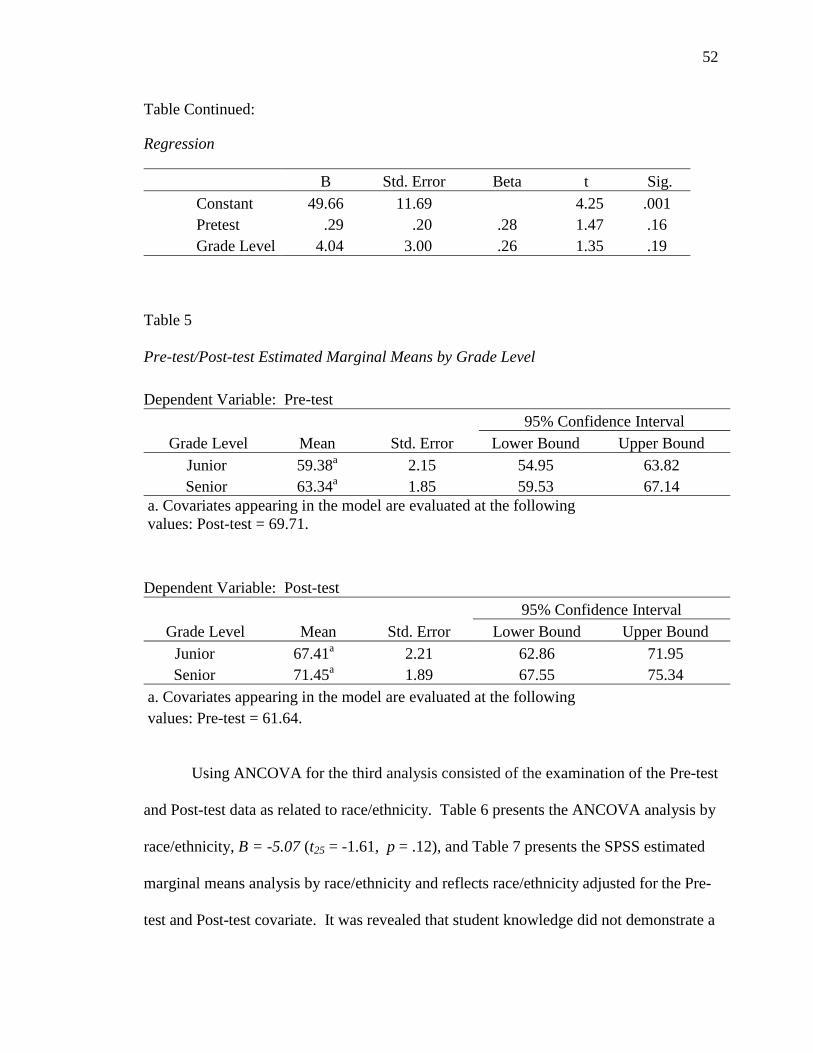
52
Table Continued:
Regression
B Std. Error Beta t Sig. Constant 49.66 11.69 4.25 .001 Pretest .29 .20 .28 1.47 .16
Grade Level 4.04 3.00 .26 1.35 .19 Table 5 Pre-test/Post-test Estimated Marginal Means by Grade Level Dependent Variable: Pre-test
Grade Level Mean Std. Error 95% Confidence Interval
Lower Bound Upper Bound Junior 59.38a 2.15 54.95 63.82 Senior 63.34a 1.85 59.53 67.14
a. Covariates appearing in the model are evaluated at the following values: Post-test = 69.71.
Dependent Variable: Post-test
Grade Level Mean Std. Error 95% Confidence Interval
Lower Bound Upper Bound Junior 67.41a 2.21 62.86 71.95 Senior 71.45a 1.89 67.55 75.34
a. Covariates appearing in the model are evaluated at the following values: Pre-test = 61.64.
Using ANCOVA for the third analysis consisted of the examination of the Pre-test
and Post-test data as related to race/ethnicity. Table 6 presents the ANCOVA analysis by
race/ethnicity, B = -5.07 (t25 = -1.61, p = .12), and Table 7 presents the SPSS estimated
marginal means analysis by race/ethnicity and reflects race/ethnicity adjusted for the Pre-
test and Post-test covariate. It was revealed that student knowledge did not demonstrate a
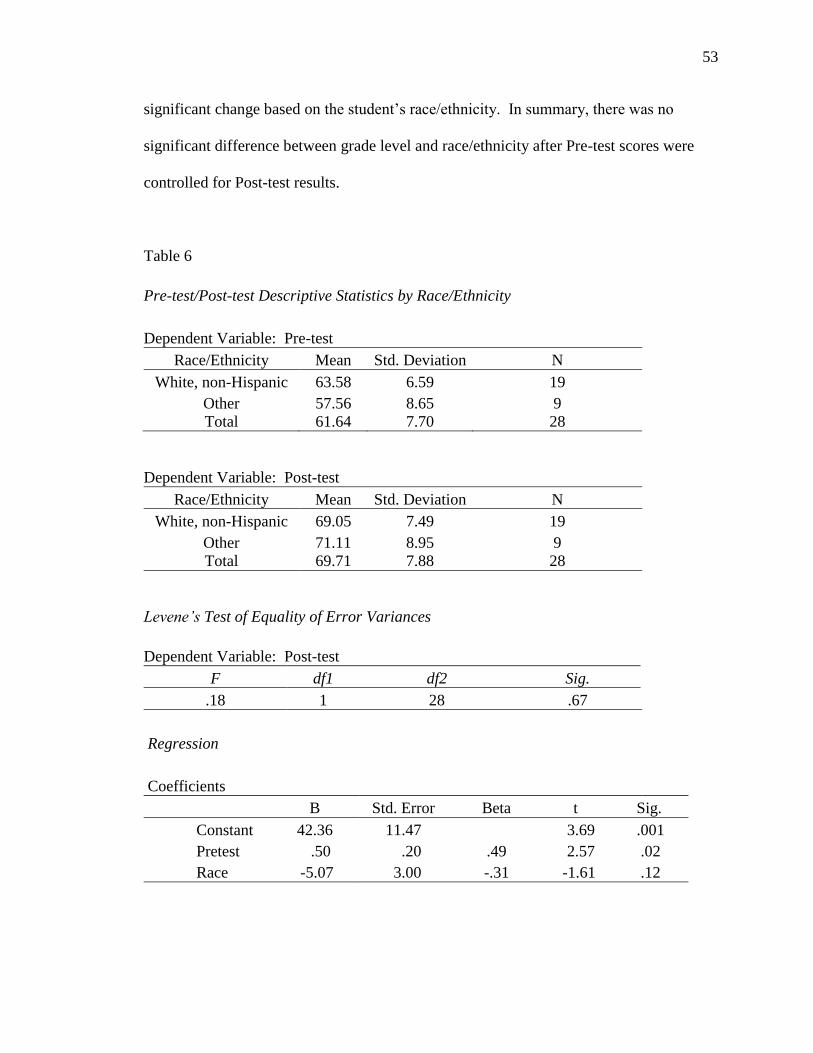
53
significant change based on
significant difference between grade level and race/ethnicity after Pre-test scores were
controlled for Post-test results.
Table 6
Pre-test/Post-test Descriptive Statistics by Race/Ethnicity Dependent Variable: Pre-test
Race/Ethnicity Mean Std. Deviation N White, non-Hispanic 63.58 6.59 19
Other 57.56 8.65 9 Total 61.64 7.70 28
Dependent Variable: Post-test Race/Ethnicity Mean Std. Deviation N
White, non-Hispanic 69.05 7.49 19 Other 71.11 8.95 9 Total 69.71 7.88 28
Test of Equality of Error Variances
Dependent Variable: Post-test F df1 df2 Sig.
.18 1 28 .67 Regression Coefficients B Std. Error Beta t Sig. Constant 42.36 11.47 3.69 .001 Pretest .50 .20 .49 2.57 .02
Race -5.07 3.00 -.31 -1.61 .12
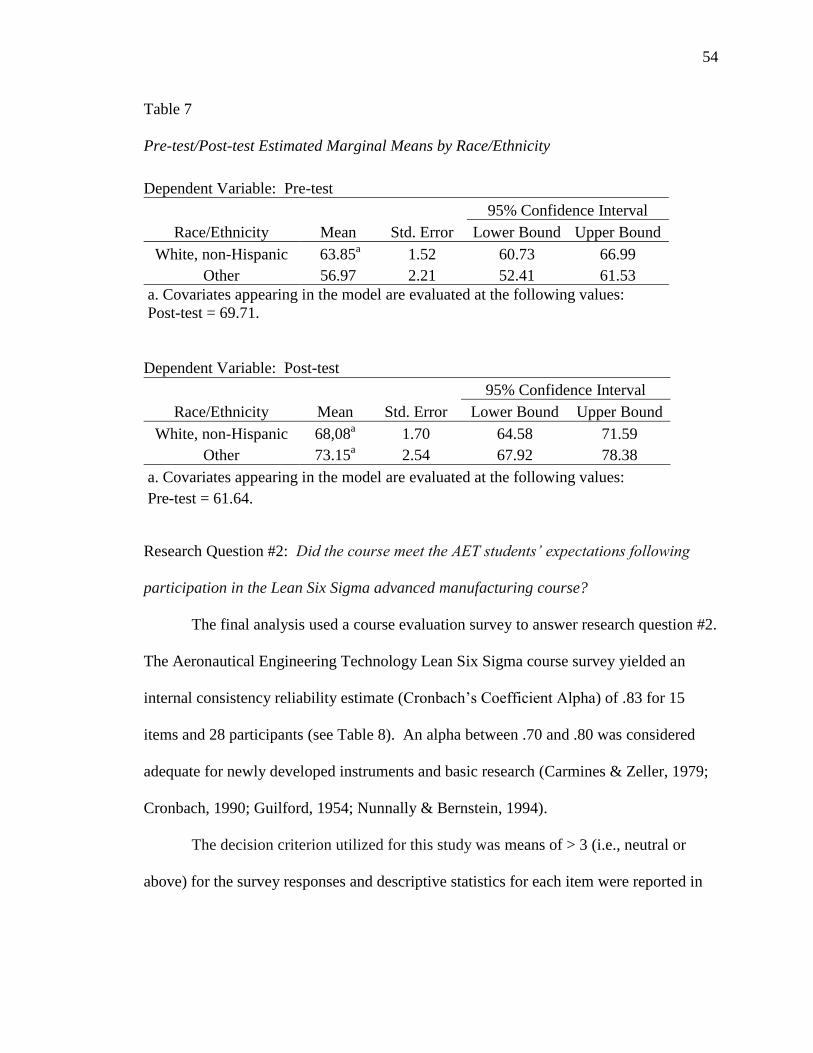
54
Table 7
Pre-test/Post-test Estimated Marginal Means by Race/Ethnicity Dependent Variable: Pre-test
Race/Ethnicity Mean Std. Error 95% Confidence Interval
Lower Bound Upper Bound White, non-Hispanic 63.85a 1.52 60.73 66.99
Other 56.97 2.21 52.41 61.53 a. Covariates appearing in the model are evaluated at the following values: Post-test = 69.71. Dependent Variable: Post-test
Race/Ethnicity Mean Std. Error 95% Confidence Interval
Lower Bound Upper Bound White, non-Hispanic 68,08a 1.70 64.58 71.59
Other 73.15a 2.54 67.92 78.38 a. Covariates appearing in the model are evaluated at the following values: Pre-test = 61.64.
Research Question #2:
participation in the Lean Six Sigma advanced manufacturing course?
The final analysis used a course evaluation survey to answer research question #2.
The Aeronautical Engineering Technology Lean Six Sigma course survey yielded an
internal consistency reliability estimate ( ) of .83 for 15
items and 28 participants (see Table 8). An alpha between .70 and .80 was considered
adequate for newly developed instruments and basic research (Carmines & Zeller, 1979;
Cronbach, 1990; Guilford, 1954; Nunnally & Bernstein, 1994).
The decision criterion utilized for this study was means of > 3 (i.e., neutral or
above) for the survey responses and descriptive statistics for each item were reported in
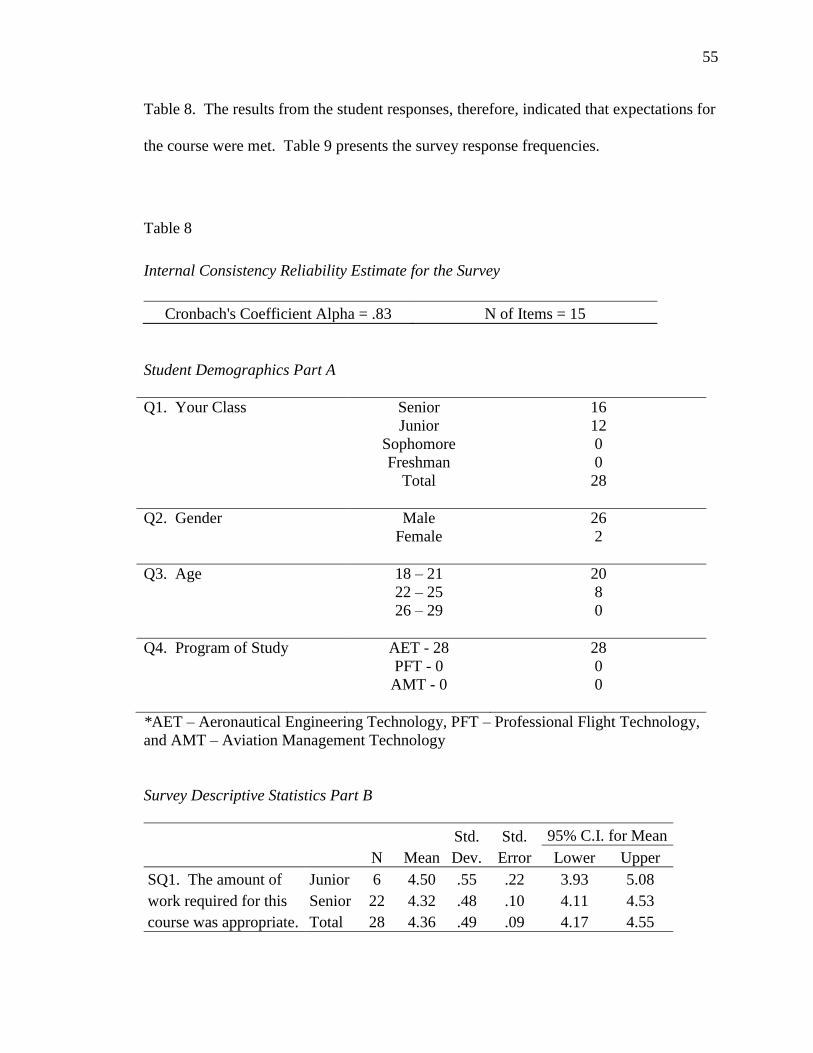
55
Table 8. The results from the student responses, therefore, indicated that expectations for
the course were met. Table 9 presents the survey response frequencies.
Table 8 Internal Consistency Reliability Estimate for the Survey
Cronbach's Coefficient Alpha = .83 N of Items = 15 Student Demographics Part A Q1. Your Class
Senior Junior
Sophomore Freshman
Total
16 12 0 0 28
Q2. Gender
Male Female
26 2
Q3. Age
18 21 22 25 26 29
20 8 0
Q4. Program of Study
AET - 28 PFT - 0 AMT - 0
28 0 0
*AET Aeronautical Engineering Technology, PFT Professional Flight Technology, and AMT Aviation Management Technology Survey Descriptive Statistics Part B
N Mean Std. Dev.
Std. Error
95% C.I. for Mean Lower Upper
SQ1. The amount of work required for this course was appropriate.
Junior 6 4.50 .55 .22 3.93 5.08 Senior 22 4.32 .48 .10 4.11 4.53 Total 28 4.36 .49 .09 4.17 4.55
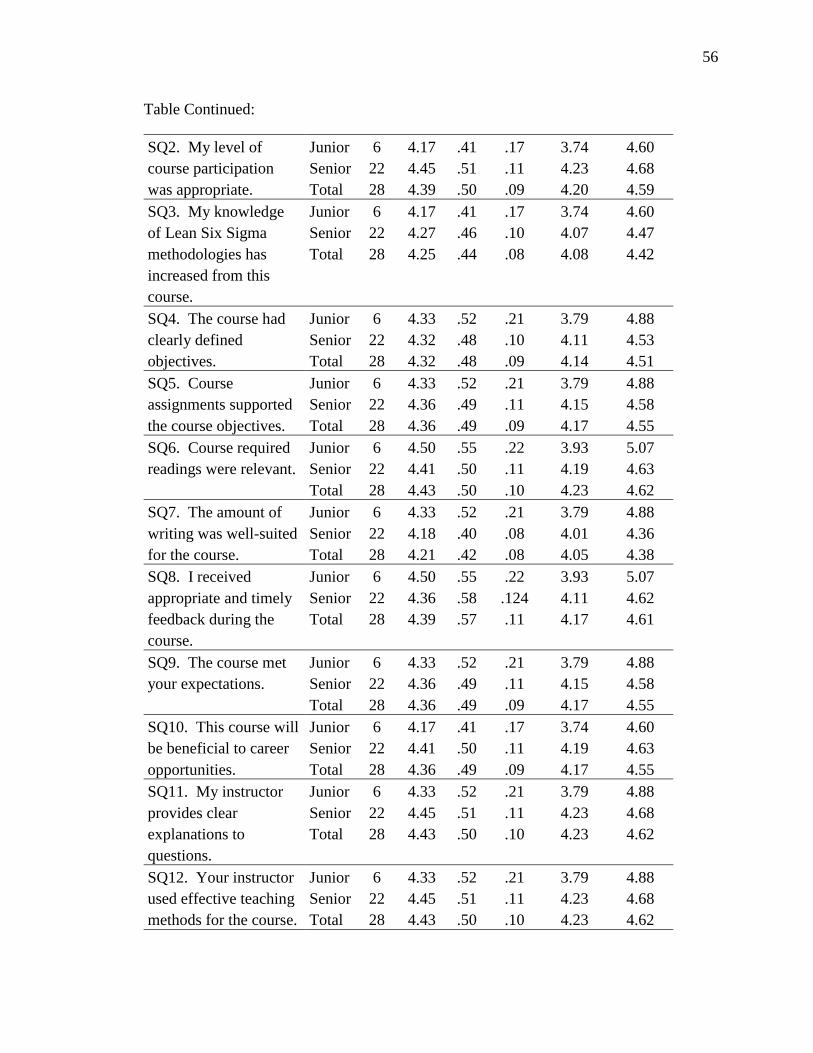
56
Table Continued:
SQ2. My level of course participation was appropriate.
Junior 6 4.17 .41 .17 3.74 4.60 Senior 22 4.45 .51 .11 4.23 4.68 Total 28 4.39 .50 .09 4.20 4.59
SQ3. My knowledge of Lean Six Sigma methodologies has increased from this course.
Junior 6 4.17 .41 .17 3.74 4.60 Senior 22 4.27 .46 .10 4.07 4.47 Total 28 4.25 .44 .08 4.08 4.42
SQ4. The course had clearly defined objectives.
Junior 6 4.33 .52 .21 3.79 4.88 Senior 22 4.32 .48 .10 4.11 4.53 Total 28 4.32 .48 .09 4.14 4.51
SQ5. Course assignments supported the course objectives.
Junior 6 4.33 .52 .21 3.79 4.88 Senior 22 4.36 .49 .11 4.15 4.58 Total 28 4.36 .49 .09 4.17 4.55
SQ6. Course required readings were relevant.
Junior 6 4.50 .55 .22 3.93 5.07 Senior 22 4.41 .50 .11 4.19 4.63 Total 28 4.43 .50 .10 4.23 4.62
SQ7. The amount of writing was well-suited for the course.
Junior 6 4.33 .52 .21 3.79 4.88 Senior 22 4.18 .40 .08 4.01 4.36 Total 28 4.21 .42 .08 4.05 4.38
SQ8. I received appropriate and timely feedback during the course.
Junior 6 4.50 .55 .22 3.93 5.07 Senior 22 4.36 .58 .124 4.11 4.62 Total 28 4.39 .57 .11 4.17 4.61
SQ9. The course met your expectations.
Junior 6 4.33 .52 .21 3.79 4.88 Senior 22 4.36 .49 .11 4.15 4.58 Total 28 4.36 .49 .09 4.17 4.55
SQ10. This course will be beneficial to career opportunities.
Junior 6 4.17 .41 .17 3.74 4.60 Senior 22 4.41 .50 .11 4.19 4.63 Total 28 4.36 .49 .09 4.17 4.55
SQ11. My instructor provides clear explanations to questions.
Junior 6 4.33 .52 .21 3.79 4.88 Senior 22 4.45 .51 .11 4.23 4.68 Total 28 4.43 .50 .10 4.23 4.62
SQ12. Your instructor used effective teaching methods for the course.
Junior 6 4.33 .52 .21 3.79 4.88 Senior 22 4.45 .51 .11 4.23 4.68 Total 28 4.43 .50 .10 4.23 4.62
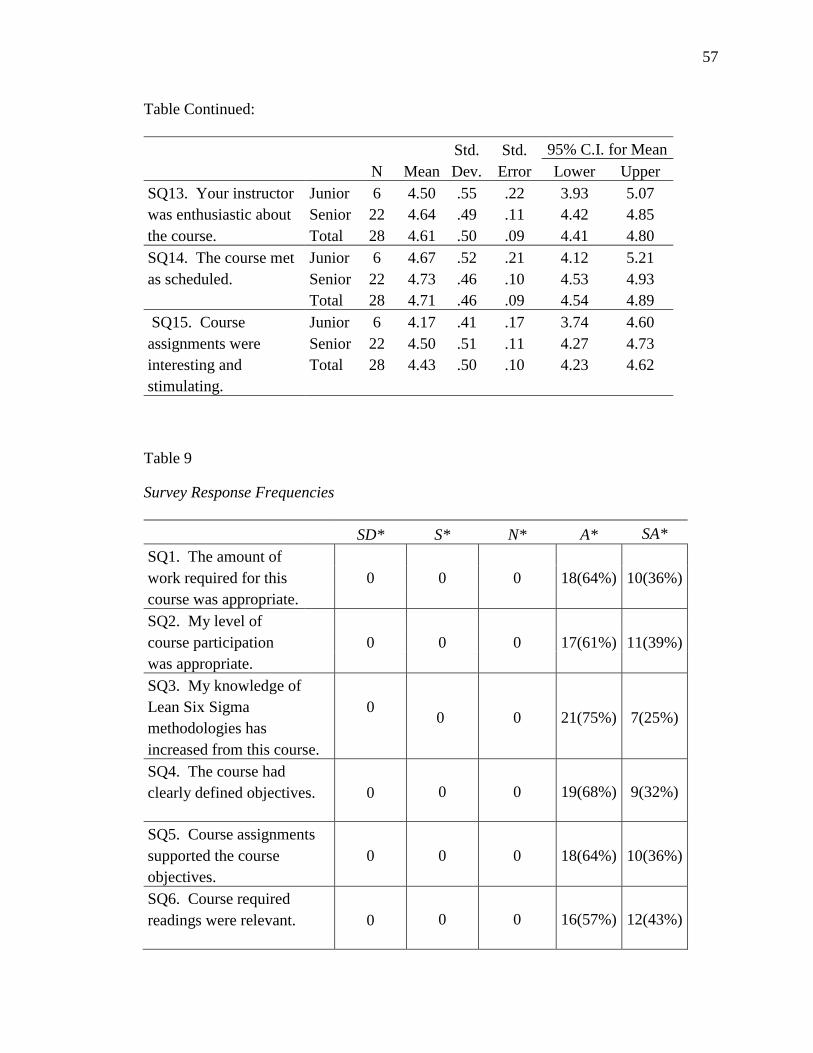
57
Table Continued:
N Mean Std. Dev.
Std. Error
95% C.I. for Mean Lower Upper
SQ13. Your instructor was enthusiastic about the course.
Junior 6 4.50 .55 .22 3.93 5.07 Senior 22 4.64 .49 .11 4.42 4.85 Total 28 4.61 .50 .09 4.41 4.80
SQ14. The course met as scheduled.
Junior 6 4.67 .52 .21 4.12 5.21 Senior 22 4.73 .46 .10 4.53 4.93 Total 28 4.71 .46 .09 4.54 4.89
SQ15. Course assignments were interesting and stimulating.
Junior 6 4.17 .41 .17 3.74 4.60 Senior 22 4.50 .51 .11 4.27 4.73 Total 28 4.43 .50 .10 4.23 4.62
Table 9
Survey Response Frequencies
SD* S* N* A* SA*
SQ1. The amount of work required for this course was appropriate.
0 0 0 18(64%) 10(36%)
SQ2. My level of course participation was appropriate.
0 0 0 17(61%) 11(39%)
SQ3. My knowledge of Lean Six Sigma methodologies has increased from this course.
0
0 0 21(75%) 7(25%)
SQ4. The course had clearly defined objectives.
0 0 0 19(68%) 9(32%)
SQ5. Course assignments supported the course objectives.
0 0 0 18(64%) 10(36%)
SQ6. Course required readings were relevant.
0 0 0 16(57%) 12(43%)
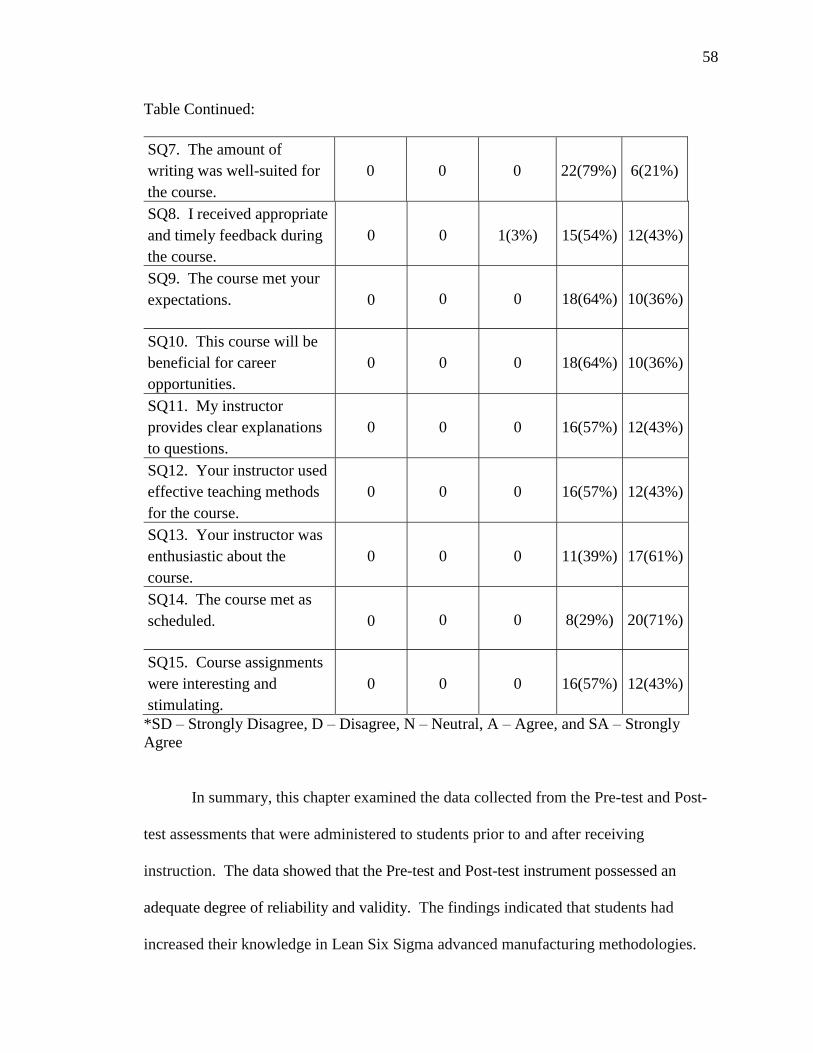
58
Table Continued:
SQ7. The amount of writing was well-suited for the course.
0 0 0 22(79%) 6(21%)
SQ8. I received appropriate and timely feedback during the course.
0 0 1(3%) 15(54%) 12(43%)
SQ9. The course met your expectations.
0 0 0 18(64%) 10(36%)
SQ10. This course will be beneficial for career opportunities.
0 0 0 18(64%) 10(36%)
SQ11. My instructor provides clear explanations to questions.
0 0 0 16(57%) 12(43%)
SQ12. Your instructor used effective teaching methods for the course.
0 0 0 16(57%) 12(43%)
SQ13. Your instructor was enthusiastic about the course.
0 0 0 11(39%) 17(61%)
SQ14. The course met as scheduled.
0 0 0 8(29%) 20(71%)
SQ15. Course assignments were interesting and stimulating.
0 0 0 16(57%) 12(43%)
*SD Strongly Disagree, D Disagree, N Neutral, A Agree, and SA Strongly Agree
In summary, this chapter examined the data collected from the Pre-test and Post-
test assessments that were administered to students prior to and after receiving
instruction. The data showed that the Pre-test and Post-test instrument possessed an
adequate degree of reliability and validity. The findings indicated that students had
increased their knowledge in Lean Six Sigma advanced manufacturing methodologies.
59
However, there were no significant differences between the two groups by grade level
and race/ethnicity. Additionally, the course evaluation survey revealed that students
reported a high degree of satisfaction with the course.
60
CHAPTER 5: CONCLUSIONS, IMPLICATIONS, AND RECOMMENDATIONS
This purpose of this study was to develop and evaluate a Lean Six Sigma
advanced manufacturing methodologies course for the AET curriculum. The objectives
for this course included: (1) AET students will develop the competencies required to
effectively utilize advanced manufacturing processes to successfully operate a
manufacturing facility, (2) AET students will acquire the knowledge and skills required
to effectively utilize advanced process quality planning methods to successfully
implement a quality program in a manufacturing facility, (3) AET students will increase
their knowledge and experiences to successfully implement supply chain management
techniques and logistic programs in a manufacturing facility, and (4) AET students will
promote and implement a continuous improvement process that will be successfully
utilized throughout the curriculum. Accordingly, the research questions posited for this
study included:
1. Did the knowledge level of AET students increase following exposure to Lean Six
Sigma and completion of the advanced manufacturing methodologies course?
2. D in the
Lean Six Sigma advanced manufacturing course?
This study served as a development platform for courses in the AET program.
Additional dissemination will occur through presentations at teacher education and
advanced manufacturing conferences, regionally and nationally, and through articles
published in peer-reviewed journals.
61
Conclusions
Students had been using the lab space in the School of Aviation and
Transportation Technology (SATT) to engage in practical hands-on projects related to
their aviation major. This study developed the Lean Six Sigma advanced manufacturing
course to allow undergraduate AET students to receive instruction in logistics, quality,
and manufacturing terms and descriptions. Students received instruction in the Lean Six
Sigma tools and utilized their new knowledge of basic lean manufacturing and
continuous improvement philosophies to complete course projects. The course projects
powerplant laboratory into a more typical aerospace
manufacturing cell layout, therefore, enabling the exploration of ways to operate an
advanced manufacturing facility based on modern industry standards and practices.
Students in this advanced aviation manufacturing course developed and implemented
manufacturing simulations to test process improvement techniques. The vision for this
study was to develop a world class course utilizing an operating laboratory facility to
better educate and equip students as future aviation manufacturing professionals with
industry-leading skill sets. This study provided the required data for development and
evaluation of a Lean Six Sigma advanced manufacturing course. In addition, the course
has been engineered to be used for future scaffolding opportunities with other SATT
courses, which in turn could provide a robust and salient minor for the AET curriculum in
advanced aviation manufacturing.
The development and evaluation of a Lean Six Sigma advanced manufacturing
methodologies course for the Aeronautical Engineering Technology curriculum became
the focus of this study after reviewing plan of study requirements and assessing the
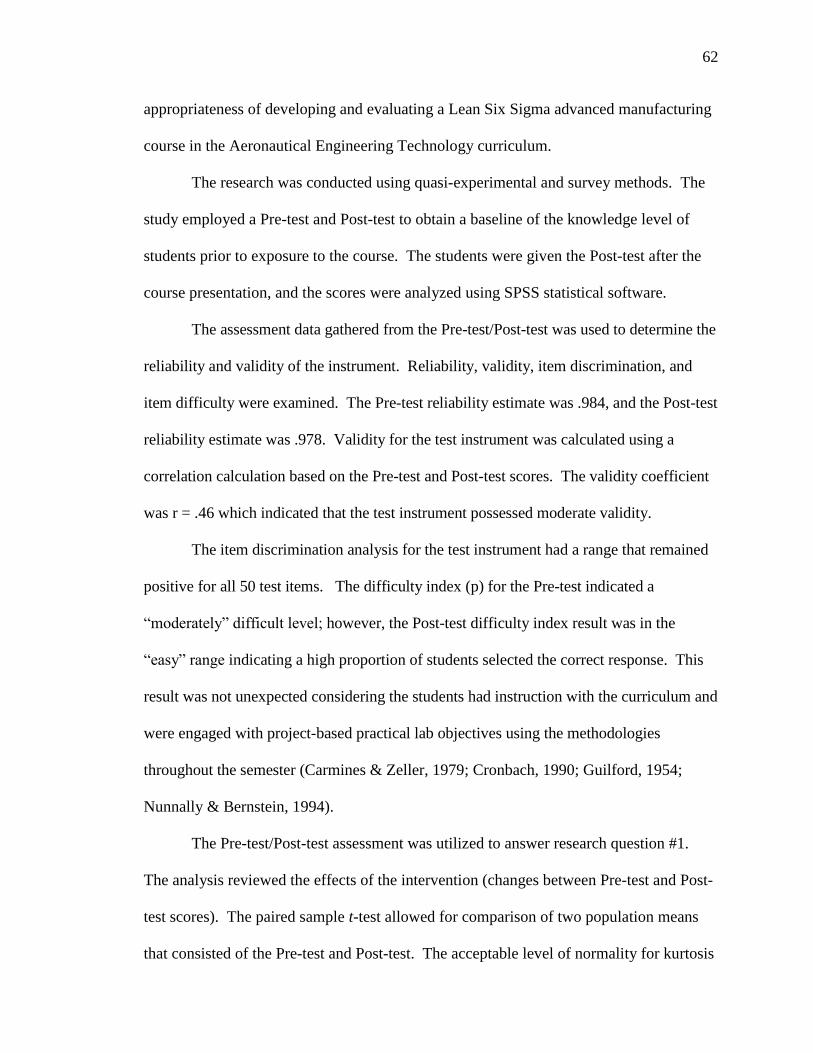
62
appropriateness of developing and evaluating a Lean Six Sigma advanced manufacturing
course in the Aeronautical Engineering Technology curriculum.
The research was conducted using quasi-experimental and survey methods. The
study employed a Pre-test and Post-test to obtain a baseline of the knowledge level of
students prior to exposure to the course. The students were given the Post-test after the
course presentation, and the scores were analyzed using SPSS statistical software.
The assessment data gathered from the Pre-test/Post-test was used to determine the
reliability and validity of the instrument. Reliability, validity, item discrimination, and
item difficulty were examined. The Pre-test reliability estimate was .984, and the Post-test
reliability estimate was .978. Validity for the test instrument was calculated using a
correlation calculation based on the Pre-test and Post-test scores. The validity coefficient
was r = .46 which indicated that the test instrument possessed moderate validity.
The item discrimination analysis for the test instrument had a range that remained
positive for all 50 test items. The difficulty index (p) for the Pre-test indicated a
however, the Post-test difficulty index result was in the
indicating a high proportion of students selected the correct response. This
result was not unexpected considering the students had instruction with the curriculum and
were engaged with project-based practical lab objectives using the methodologies
throughout the semester (Carmines & Zeller, 1979; Cronbach, 1990; Guilford, 1954;
Nunnally & Bernstein, 1994).
The Pre-test/Post-test assessment was utilized to answer research question #1.
The analysis reviewed the effects of the intervention (changes between Pre-test and Post-
test scores). The paired sample t-test allowed for comparison of two population means
that consisted of the Pre-test and Post-test. The acceptable level of normality for kurtosis
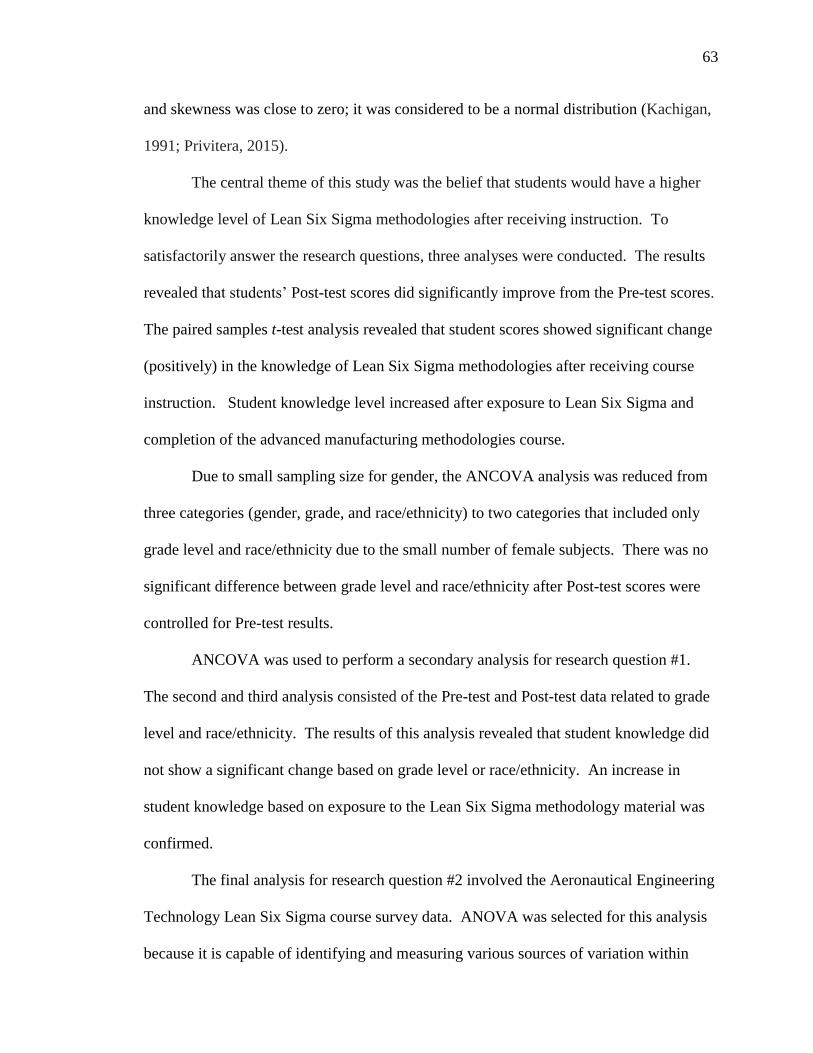
63
and skewness was close to zero; it was considered to be a normal distribution (Kachigan,
1991; Privitera, 2015).
The central theme of this study was the belief that students would have a higher
knowledge level of Lean Six Sigma methodologies after receiving instruction. To
satisfactorily answer the research questions, three analyses were conducted. The results
revealed Post-test scores did significantly improve from the Pre-test scores.
The paired samples t-test analysis revealed that student scores showed significant change
(positively) in the knowledge of Lean Six Sigma methodologies after receiving course
instruction. Student knowledge level increased after exposure to Lean Six Sigma and
completion of the advanced manufacturing methodologies course.
Due to small sampling size for gender, the ANCOVA analysis was reduced from
three categories (gender, grade, and race/ethnicity) to two categories that included only
grade level and race/ethnicity due to the small number of female subjects. There was no
significant difference between grade level and race/ethnicity after Post-test scores were
controlled for Pre-test results.
ANCOVA was used to perform a secondary analysis for research question #1.
The second and third analysis consisted of the Pre-test and Post-test data related to grade
level and race/ethnicity. The results of this analysis revealed that student knowledge did
not show a significant change based on grade level or race/ethnicity. An increase in
student knowledge based on exposure to the Lean Six Sigma methodology material was
confirmed.
The final analysis for research question #2 involved the Aeronautical Engineering
Technology Lean Six Sigma course survey data. ANOVA was selected for this analysis
because it is capable of identifying and measuring various sources of variation within
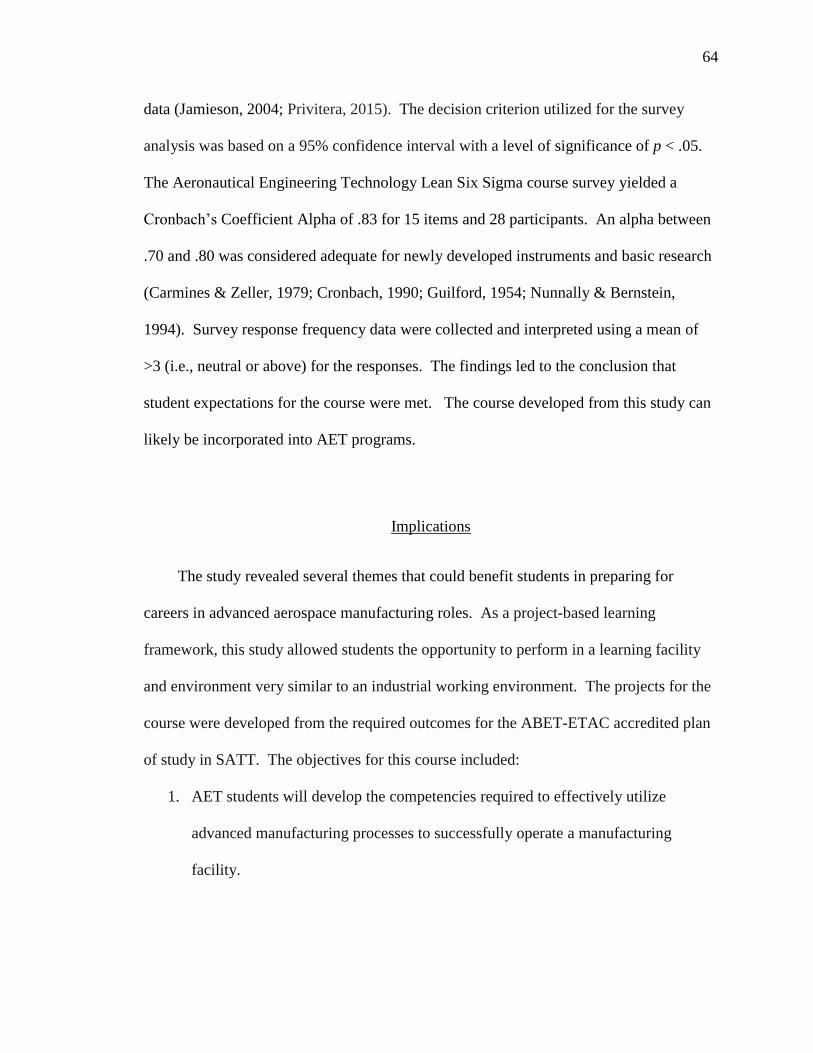
64
data (Jamieson, 2004; Privitera, 2015). The decision criterion utilized for the survey
analysis was based on a 95% confidence interval with a level of significance of p < .05.
The Aeronautical Engineering Technology Lean Six Sigma course survey yielded a
Coefficient Alpha of .83 for 15 items and 28 participants. An alpha between
.70 and .80 was considered adequate for newly developed instruments and basic research
(Carmines & Zeller, 1979; Cronbach, 1990; Guilford, 1954; Nunnally & Bernstein,
1994). Survey response frequency data were collected and interpreted using a mean of
>3 (i.e., neutral or above) for the responses. The findings led to the conclusion that
student expectations for the course were met. The course developed from this study can
likely be incorporated into AET programs.
Implications
The study revealed several themes that could benefit students in preparing for
careers in advanced aerospace manufacturing roles. As a project-based learning
framework, this study allowed students the opportunity to perform in a learning facility
and environment very similar to an industrial working environment. The projects for the
course were developed from the required outcomes for the ABET-ETAC accredited plan
of study in SATT. The objectives for this course included:
1. AET students will develop the competencies required to effectively utilize
advanced manufacturing processes to successfully operate a manufacturing
facility.
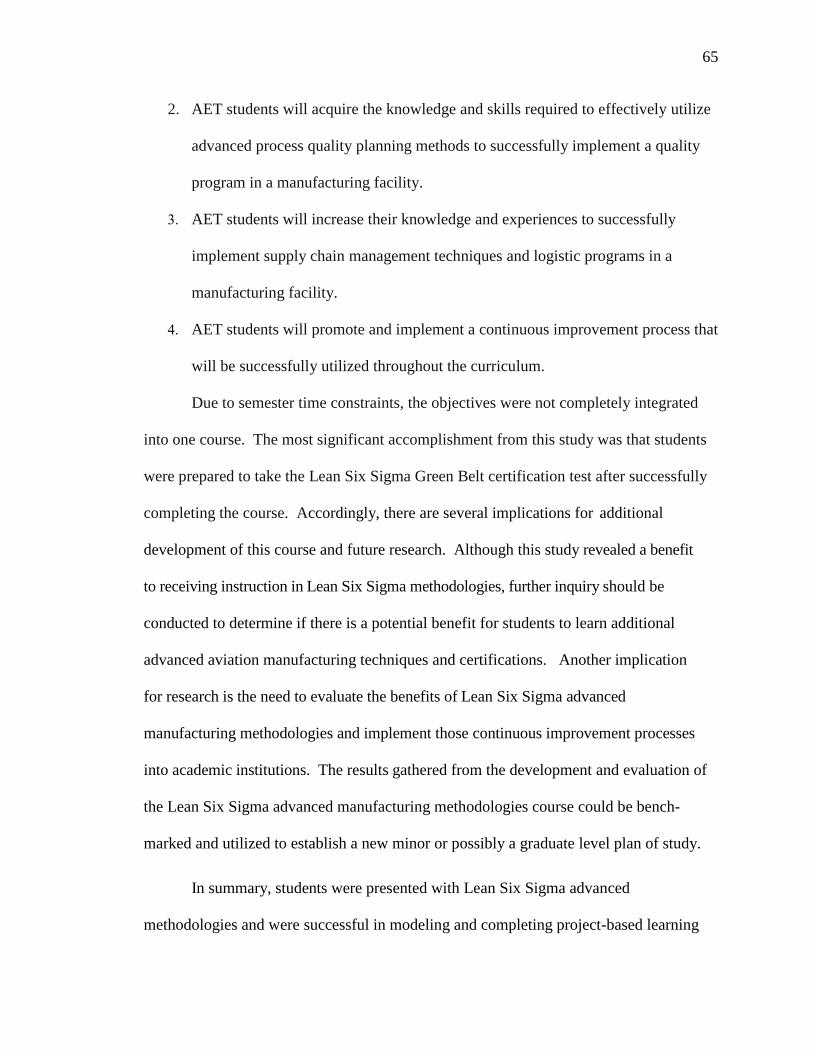
65
2. AET students will acquire the knowledge and skills required to effectively utilize
advanced process quality planning methods to successfully implement a quality
program in a manufacturing facility.
3. AET students will increase their knowledge and experiences to successfully
implement supply chain management techniques and logistic programs in a
manufacturing facility.
4. AET students will promote and implement a continuous improvement process that
will be successfully utilized throughout the curriculum.
Due to semester time constraints, the objectives were not completely integrated
into one course. The most significant accomplishment from this study was that students
were prepared to take the Lean Six Sigma Green Belt certification test after successfully
completing the course. Accordingly, there are several implications for additional
development of this course and future research. Although this study revealed a benefit
to receiving instruction in Lean Six Sigma methodologies, further inquiry should be
conducted to determine if there is a potential benefit for students to learn additional
advanced aviation manufacturing techniques and certifications. Another implication
for research is the need to evaluate the benefits of Lean Six Sigma advanced
manufacturing methodologies and implement those continuous improvement processes
into academic institutions. The results gathered from the development and evaluation of
the Lean Six Sigma advanced manufacturing methodologies course could be bench-
marked and utilized to establish a new minor or possibly a graduate level plan of study.
In summary, students were presented with Lean Six Sigma advanced
methodologies and were successful in modeling and completing project-based learning
66
activities. This course has likely been beneficial for students who have graduated from
the AET program. There is a need to continue development of the Lean Six Sigma
advanced manufacturing course; it fits well with the requirements of Lean Six Sigma
continuous improvement philosophies. Accordingly, continuous improvement tools may
be utilized to enhance and transform the learning activities in several of the AET courses.
Recommendations
This study, as is the case with most studies, had several limitations. For example,
the population for this study consisted of only those students enrolled in the Aeronautical
Engineering Technology (AET) major in the School of Aviation and Transportation
Technology at a large midwestern university. The total enrollment for the AET major
during the study was 225 to 259 students. The subjects for the study consisted of 28
students and were determined by enrollment in the Lean Six Sigma advanced
manufacturing course. It could have been beneficial to have a larger pool of subjects for
the study. Additionally, there were some key improvements suggested that have already
been integrated into the course. One is the class is no longer taught concurrently with
another course. The original idea blended two courses and used them as a collaboration
opportunity. However, it was observed that there was insufficient time to build the
cohesiveness between the courses without causing both to fall behind in their respective
objectives. The course was, therefore, developed into a stand-alone course with the
lecture and team-building objectives taught during the first half of the semester. The
project-based learning activities were emphasized during the second half of the semester.
This enabled students to have the prerequisite knowledge of objectives before engaging
67
in the more intensive project-based learning objectives. Accordingly, in light of the
for practice and future research:
1. During the initial stages of development of the Lean Six Sigma Advanced
Manufacturing course, students were provided instruction in project management
techniques. After two semesters, it was determined that students did not have the
necessary abilities and knowledge to complete advanced project based learning
activities. Therefore, it is recommended that a project management course be
developed that concentrates solely on project management. This would provide
students an opportunity to apply knowledge, skills, tools, and techniques related to
project activities to meet project requirements. This course would be presented as
a prerequisite to the Lean Six Sigma advanced manufacturing course. The project
management techniques learned from this course will better prepare students for
the project-based learning activities that they would be expected to complete
during the Lean Six Sigma advanced manufacturing course.
2. Develop graduate level courses for students to assist them to further specialize or
focus on a particular concentration area within Lean Six Sigma methodologies.
An advanced process quality planning course would be an example of a focused
course. The graduate level experience would be tailored towards a student
preparing for a Lean Six Sigma Blackbelt or Master Blackbelt certification.
3. Use the currently developed courses to offer a minor concentration in Lean Six
Sigma advanced manufacturing methodologies. The courses would be organized
for undergraduate students to complete without involving additional time before
graduation.
68
4. Recruit industry partners to work with students on real-life problems from the
field; provide a working laboratory for brainstorming ideas for integration and
implementation into the facilities of industry partners.
5. Develop a powerplant laboratory within a technology incubator to grow and
develop new techniques and processes. It could be a responsive research and
development facility for industry partners to bring projects to the lab for testing.
6. Develop and evaluate a Project Management Professional (PMP) certification
program. Using industry best practices, students could be provided the learning
objectives and be evaluated with respect to the expected outcomes. The course
should be a project-based learning curriculum allowing students practical project
management exercises.
7. Identify key issues and trends in aviation and advanced manufacturing, develop
and evaluate cutting-edge courses to foster increased technical competence, and
provide students advanced skills as they enter the workforce.
8. Initiate an Advanced Process Quality Planning (APQP) course for innovation to
advance student knowledge in aviation and manufacturing processes.
9. Leverage technology to establish a Center of Excellence for next generation
product design, industrial analysis, and process development.
10. Research and develop a graduate level advanced program/project management
course. The course could create advanced project planning and control
techniques. Students would receive instruction in planning, organizing, directing,
and controlling of company resources. The mode of delivery for the course
should use project-based learning activities.
11. Future studies should include larger populations and samples of subjects while
69
controlling for variables of interest and significance.
12. Future studies should examine courses related to Lean Six Sigma advanced
manufacturing methodologies programs and explore related achievement and
affective outcome assessment instruments and procedures.
In summary, it is incumbent upon academic institutions to keep pace with the
newest skill sets demanded by highly dynamic global technology industries like aviation
and aerospace. The success of students, the most important customers in academic
institutions and, therefore, the academic programs, depends on it. Doing so will prepare
students to meet the challenges that lie ahead and equip them with the tools for life-long
learning and careers in a global aerospace and advanced manufacturing environment.

REFERENCES
70
REFERENCES
ABET-ETAC (2016). Criteria for accrediting engineering technology programs.
Retrieved from http://www.abet.org/wp-content/uploads/2015/05/T001-15-16-
ETAC-Criteria-05-04-15
Adams, C.W., Gupta, P., & Wilson, C. (2003). Six sigma deployment. New York, NY:
Routledge.
Bandrowski, J., & Madison, D. (2003a). Financial results from six sigma: A reading
exercise. New York, NY: The Free Press.
Bandrowski, J., & Madison, D. (2003b). Six sigma organization: A definition. New
York, NY: The Free Press.
Bandrowski, J., & Madison, D. (2003c). The origins of six sigma. New York, NY: The
Free Press.
Boumen, R. (2007). Integration and test plans for complex manufacturing systems.
Eindhoven: Eindhoven University of Technology.
Brandt, D. (2007). A healthy dose of kaizen. Industrial Engineer, 39(11), 52-54.
Brown, C. B., Collins, T. R., & McCombs, E. L. (2006). Transformation from batch to
lean manufacturing: The performance issues. Engineering Management Journal,
18(2), 3-13. Retrieved from
http://search.proquest.com/docview/208949741?accountid=13360
71
Burton, T. (2004). Six sigma for small and medium sized businesses. Retrieved from
https://www.isixsigma.com/implementation/basics/six-sigma-small-and-medium-
sized-businesses
Carmines, E., & Zeller, R. (1979). Reliability and validity assessment. Beverly Hills,
CA: Sage Publications.
Caterpillar Inc. (2000). Six sigma corporate training. Peoria, IL: Caterpillar
Publications.
Crom, S. (2010). Six sigma culture: Better process and problem-solving. Retrieved from
https://www.isixsigma.com/implementation/change-management-
implementation/six-sigma-culture-better-processes-and-problem-solving
Cronbach, L. (1990). Essentials of psychological testing. New York, NY: Harper &
Row.
Douglas, A.R., & Conger, J. (2007). Make your company a talented company. Harvard
Business Review, 85(6), 68-77.
Emiliani, M.L. (2003). Better thinking, better results: Using the power of lean as a total
business solution. Kensington, CT: Center for Lean Business Management.
Engel, A., Bogomolni, I., Shacher, S., & Grinman, A. (2004). Gathering historical
lifecycle quality costs to support optimizing the VVT process. International
Symposium, 14(1), 1884-1897.
Field, A. (2013). Discovering statistics using IBM SPSS statistics. Los Angeles, CA:
Sage Publications.
Fiore, C. (2005). Accelerated product development: Combining lean and six sigma for
peak performance. New York, NY: Productivity Press.
72
Gagnon, M. A. (2004). Investigating employee strategic alignment during a
transformation to lean manufacturing. Retrieved from Dissertation Abstracts.
(UMI No. 3147612)
Gay, L. (1987). Educational research: Competencies for analysis and application.
Columbus, OH: Merrill Publishing Company.
Guilford, J. (1954). Psychometric Methods. New York, NY: McGraw-Hill.
Gunter, B. (1987). A perspective on the Taguchi methods. Quality Progress, 20(6), 44-
52.
Harry, M. J., Mann, P.S., & De Hodgins, O.C. (2010). guide to statistics
and lean six sigma for process improvements. Hoboken, NJ: John Wiley and
Sons.
Harry, M. J., & Crawford, J. D. (2004). Six sigma for the little guy. Mechanical
Engineering, 126(11). Retrieved from
http://search.proquest.com/docview/230188657?accountid=13360
Harry, M., & Schroeder, R. (2000). Six sigma. New York, NY: Doubleday.
Hogg, T. M. (1993). Lean manufacturing. Human Systems Management, 12(1), 35-40.
Howell, D. C. (2006). Statistical methods for psychology (6th ed.). Belmont, CA:
Thomson.
Jamieson, J. (2004). Analysis of covariance (ANCOVA) with difference scores.
International Journal of Psychophysiology, 52(3), 277-283.
73
Johnson, M E., & Dubikovsky, S. (2008). Introduction of lean six sigma principles into
aeronautical engineering technology courses. 2008 IAJC-IJME International
Conference on Engineering and Technology Proceedings. Nashville,
Tennessee November 17-19 (2008).
Kachigan, S. K. (1991). Multivariate statistical analysis: A conceptual approach. New
York, NY: Radius Press.
Kaushik, P., Khanduja, D., Mittal, K., & Jaglan, P. (2012). A case study. TQM Journal,
24(1), 4-16.
Karlin, J. N. (2004). Defining the lean logistics learning enterprise: Examples from
Retrieved from Dissertation Abstracts
International. (UMI No 3121959)
Keller, P. (2003). Does six sigma work in smaller companies? Retrieved from
www.qualityamerica.com/knowledgecentre/articles/
Kumar, M., Antony, J., & Cho, B.R. (2009). Project selection and its impact on the
successful deployment of six sigma. Business Process Management Journal,
15(5), 669-686.
Lopez, J. (2005). Six sigma enables atmosphere of success. Extended Retail Industry
Journal, 23(1), 10-16.
Mathaisel, D., & Comm, C.L. (2000). Developing, implementing and transferring lean
quality initiatives from the aerospace industry to all industries. Managing Service
Quality, 10(4), 248-256.
74
McAdam, R., & Lafferty, B. (2004). A multilevel case study critique of six sigma:
statistical control or strategic change? International Journal of Operations &
Production Management, 24(5), 530-549.
McFadden, F.R. (1993). Six-sigma quality programs. Quality Progress, 26(6), 37-42.
Miller, G.A., & Chapman, J. P. (2001). Misunderstanding analysis of covariance.
Journal of Abnormal Psychology, 110(1), 40-48.
Mothersell, W. M. (2000). Understanding the diffusion of lean production: The
integration of technology and people in lean production. Retrieved from
Dissertation Abstracts International. (UMI No. 3009152)
Nunnally, J. C., & Bernstein, I. H. (1994). Psychometric theory (3rd Ed.). New York,
NY: McGraw-Hill.
Ohno, T. (1988). Taiichi Ohno. Toyota production system Beyond large-scale
production. Cambridge, MA: Productivity Press.
Olsen, E. O. (2004). Lean manufacturing management: The relationship between
practice and firm-level financial performance. Retrieved from Dissertation
Abstracts International. (UMI No 3148201)
Pande, P.S., Neuman, R.P., & Cavanagh, R.R. (2001). The six sigma way How GE,
Motorola, and other top companies are honing their performance. New York,
NY: McGraw-Hill.
Platzer, M. D., & Harrison, G. J. (2011). The U.S. automotive industry: National and
state trends in manufacturing employment. In U.S. and Asian Motor Vehicle
Industry in the Global Economy (pp. 171-204). Nova Science.
75
Privitera, G. J. (2015). Essential statistics for the behavioral sciences. Los Angeles, CA:
Sage Publications.
Ramesh, V., Prasad, K. S., & Srinivas, T. R. (2008). Implementation of a lean model for
carrying out value stream mapping in a manufacturing industry. Journal of
Industrial and Systems Engineering, 2(3), 180-196.
Rasch, S. F. (1998). Lean manufacturing practices: Do they work in American
companies? Retrieved from Dissertation Abstracts International. (UMI No.
9825328)
Rowlands, H. (2004). Implementation issues of Six Sigma in an SME. In First
International Conference on Six Sigma, Glasgow, UK, December 16-17.
Rutherford, A. (2000). Introducing ANOVA and ANCOVA: A GLM approach. London,
UK: Sage Publications.
Shah, R. (2002). A configurational view of lean manufacturing and its theoretical
implications. Retrieved from Dissertation Abstracts International. (UMI No.
3059319)
Snee, R.D. (2010). Lean Six Sigma Getting better all the time. International Journal
of Lean Six Sigma, 1(1), 9-29.
Sower, V.E., Savoie, M., & Renick, S. (1999). An introduction to quality management
and engineering, Upper Saddle River, NJ: Prentice-Hall.
Starns, J. F. (1995). A systematic approach for assessing manufacturing capability.
Retrieved from Dissertation Abstracts International, B56/06. (AAT 9534272)
Truby, M. (2000). Nasser, Ford embrace data-driven quality plan. Detroit News, 26, F1 .
76
Watson, J., Jr. (2006). Integrating lean manufacturing with technology: Analyzing
the effects on organizational performance in terms of quality, cost, and response
time. Retrieved from ProQuest Dissertations and Theses Global. (UMI No.
304909384)
Wells, C., & Wollack, J. (2003). An bility.
Testing & Evaluation Services, Madison, WI: University of Wisconsin.
Wessel, G., & Burcher, P. (2004). Six Sigma for small- and medium-sized enterprises.
The TQM Magazine, 16(4), 264-272.
Winer, B., Brown, D., & Michels, K. (1991). Statistical principles in experimental
design. New York, NY: McGraw-Hill.
Womack, J., & Jones, D. (2005). Lean solutions: How companies and customers can
create value and wealth together. New York, NY: Free Press.
Womack, J. P., & Jones, D.T. (1996). Lean thinking. New York, NY: Simon &
Schuster.
Womack, J. P., Jones, D. T., & Roos, D. (1990). The machine that changed the world.
New York, NY: Simon & Schuster.

APPENDICES
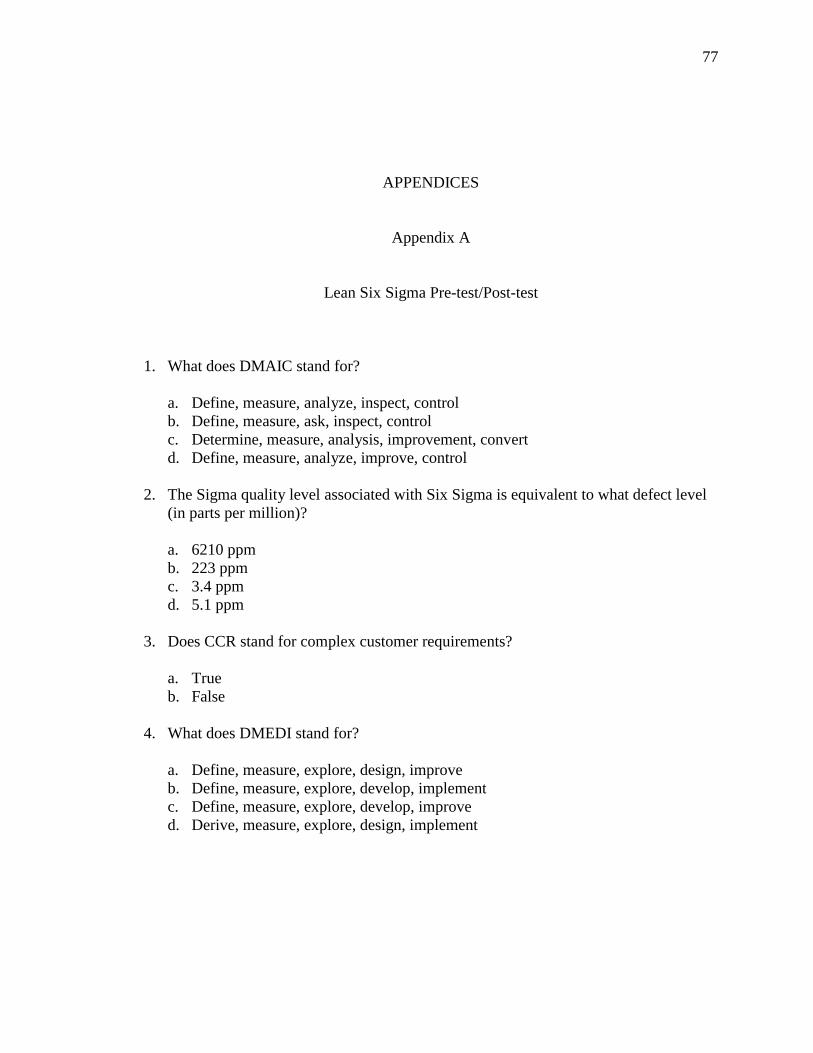
77
APPENDICES
Appendix A
Lean Six Sigma Pre-test/Post-test
1. What does DMAIC stand for? a. Define, measure, analyze, inspect, control b. Define, measure, ask, inspect, control c. Determine, measure, analysis, improvement, convert d. Define, measure, analyze, improve, control
2. The Sigma quality level associated with Six Sigma is equivalent to what defect level (in parts per million)? a. 6210 ppm b. 223 ppm c. 3.4 ppm d. 5.1 ppm
3. Does CCR stand for complex customer requirements?
a. True b. False
4. What does DMEDI stand for? a. Define, measure, explore, design, improve b. Define, measure, explore, develop, implement c. Define, measure, explore, develop, improve d. Derive, measure, explore, design, implement
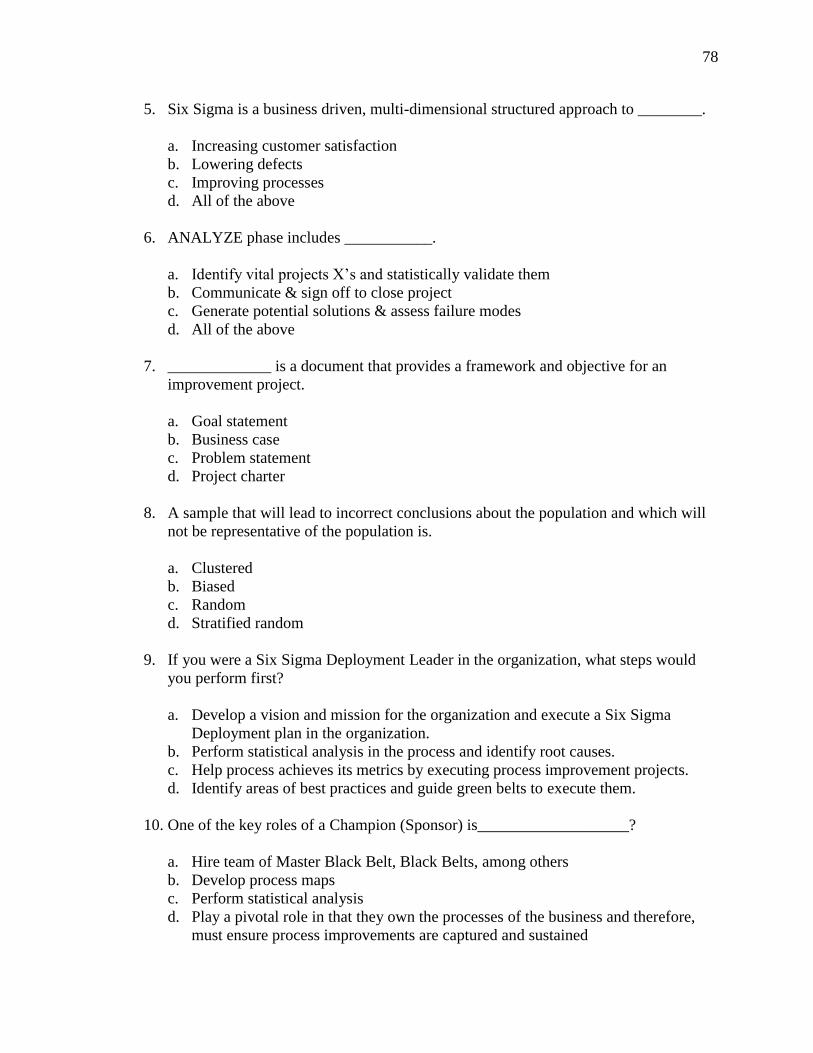
78
5. Six Sigma is a business driven, multi-dimensional structured approach to ________. a. Increasing customer satisfaction b. Lowering defects c. Improving processes d. All of the above
6. ANALYZE phase includes ___________.
a. statistically validate them b. Communicate & sign off to close project c. Generate potential solutions & assess failure modes d. All of the above
7. _____________ is a document that provides a framework and objective for an
improvement project. a. Goal statement b. Business case c. Problem statement d. Project charter
8. A sample that will lead to incorrect conclusions about the population and which will
not be representative of the population is. a. Clustered b. Biased c. Random d. Stratified random
9. If you were a Six Sigma Deployment Leader in the organization, what steps would
you perform first? a. Develop a vision and mission for the organization and execute a Six Sigma
Deployment plan in the organization. b. Perform statistical analysis in the process and identify root causes. c. Help process achieves its metrics by executing process improvement projects. d. Identify areas of best practices and guide green belts to execute them.
10. One of the key roles of a Champion (Sponsor) is___________________?
a. Hire team of Master Black Belt, Black Belts, among others b. Develop process maps c. Perform statistical analysis d. Play a pivotal role in that they own the processes of the business and therefore,
must ensure process improvements are captured and sustained

79
11. They set a very clear scope for all Six Sigma projects. They are responsible for approving any changes to the scope of the project. a. Six Sigma deployment leader b. Champion (Sponsor) c. Master Black Belt d. Black Belt
12. They are expert statisticians and help the Black Belts in the case of issues.
a. Champion (Sponsor) b. Master Black Belt c. Black Belt d. Green Belt
13. This position drives more than one process improvement project within the
functional area and achieves the savings and quality goals.
a. Champion b. Master Black Belt c. Black Belt d. Green Belt
14. These are the project-specific, full or part-time resources that provide a process and
cross-functional knowledge, as well as help sustain the gains.
a. Yellow Belt b. Champion (Sponsor) c. Black Belt d. Green Belt
15. What is the purpose of a storyboard?
a. To tell a story b. To give a detailed description of how the project is progressing c. To show all steps d. None of the above
16. How do customers communicate with us?
a. Product returns b. Contract cancellations c. Change in market share d. All of the above
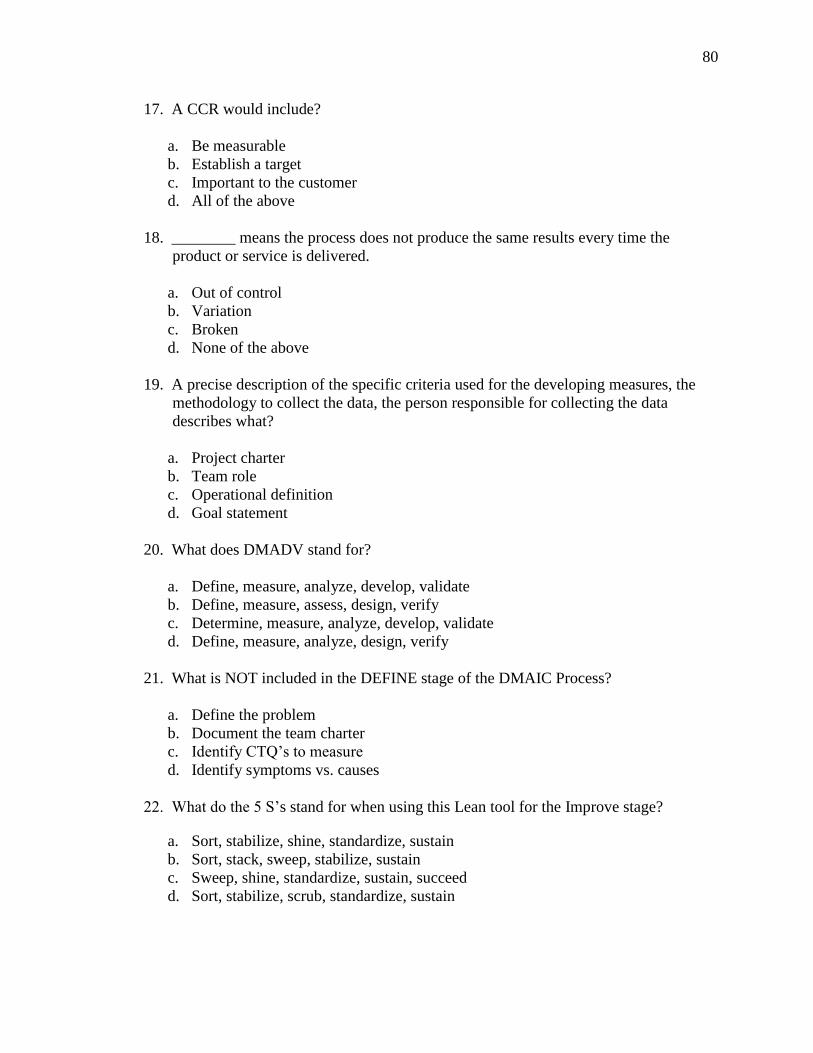
80
17. A CCR would include?
a. Be measurable b. Establish a target c. Important to the customer d. All of the above
18. ________ means the process does not produce the same results every time the
product or service is delivered.
a. Out of control b. Variation c. Broken d. None of the above
19. A precise description of the specific criteria used for the developing measures, the
methodology to collect the data, the person responsible for collecting the data describes what?
a. Project charter b. Team role c. Operational definition d. Goal statement
20. What does DMADV stand for?
a. Define, measure, analyze, develop, validate b. Define, measure, assess, design, verify c. Determine, measure, analyze, develop, validate d. Define, measure, analyze, design, verify
21. What is NOT included in the DEFINE stage of the DMAIC Process?
a. Define the problem b. Document the team charter c. d. Identify symptoms vs. causes
s stand for when using this Lean tool for the Improve stage?
a. Sort, stabilize, shine, standardize, sustain b. Sort, stack, sweep, stabilize, sustain c. Sweep, shine, standardize, sustain, succeed d. Sort, stabilize, scrub, standardize, sustain
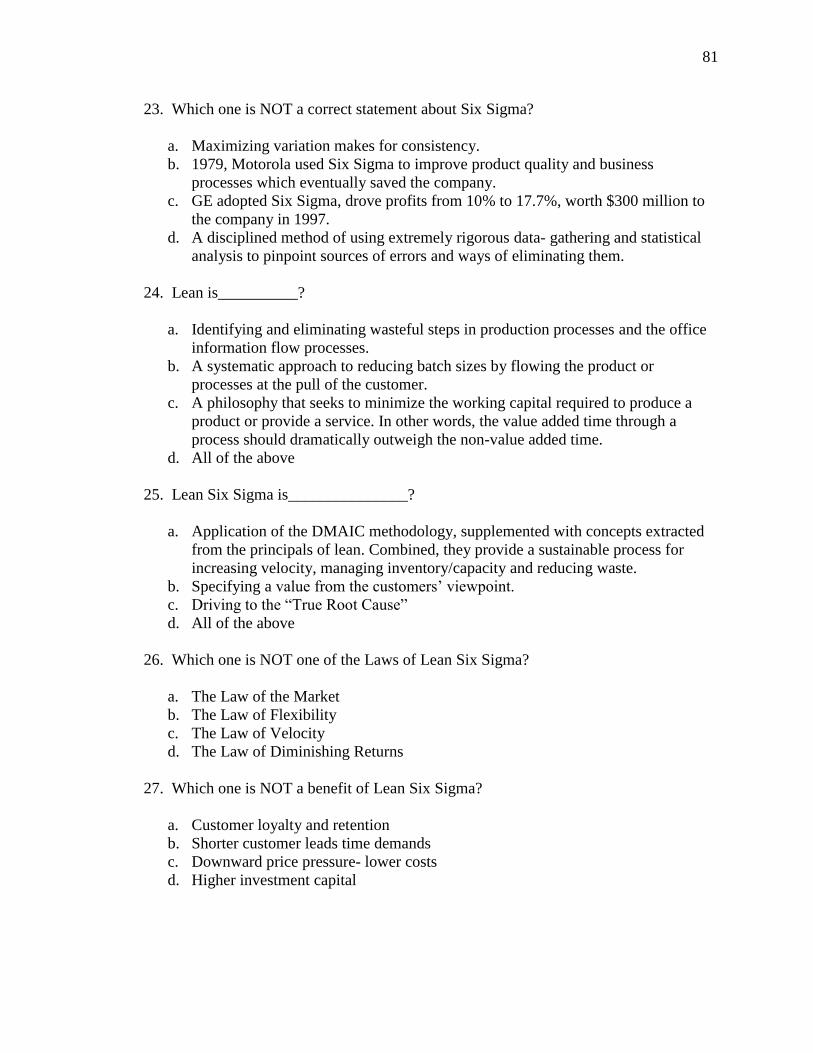
81
23. Which one is NOT a correct statement about Six Sigma?
a. Maximizing variation makes for consistency. b. 1979, Motorola used Six Sigma to improve product quality and business
processes which eventually saved the company. c. GE adopted Six Sigma, drove profits from 10% to 17.7%, worth $300 million to
the company in 1997. d. A disciplined method of using extremely rigorous data- gathering and statistical
analysis to pinpoint sources of errors and ways of eliminating them.
24. Lean is__________?
a. Identifying and eliminating wasteful steps in production processes and the office information flow processes.
b. A systematic approach to reducing batch sizes by flowing the product or processes at the pull of the customer.
c. A philosophy that seeks to minimize the working capital required to produce a product or provide a service. In other words, the value added time through a process should dramatically outweigh the non-value added time.
d. All of the above 25. Lean Six Sigma is_______________?
a. Application of the DMAIC methodology, supplemented with concepts extracted from the principals of lean. Combined, they provide a sustainable process for increasing velocity, managing inventory/capacity and reducing waste.
b. Specifying a c. d. All of the above
26. Which one is NOT one of the Laws of Lean Six Sigma?
a. The Law of the Market b. The Law of Flexibility c. The Law of Velocity d. The Law of Diminishing Returns
27. Which one is NOT a benefit of Lean Six Sigma?
a. Customer loyalty and retention b. Shorter customer leads time demands c. Downward price pressure- lower costs d. Higher investment capital
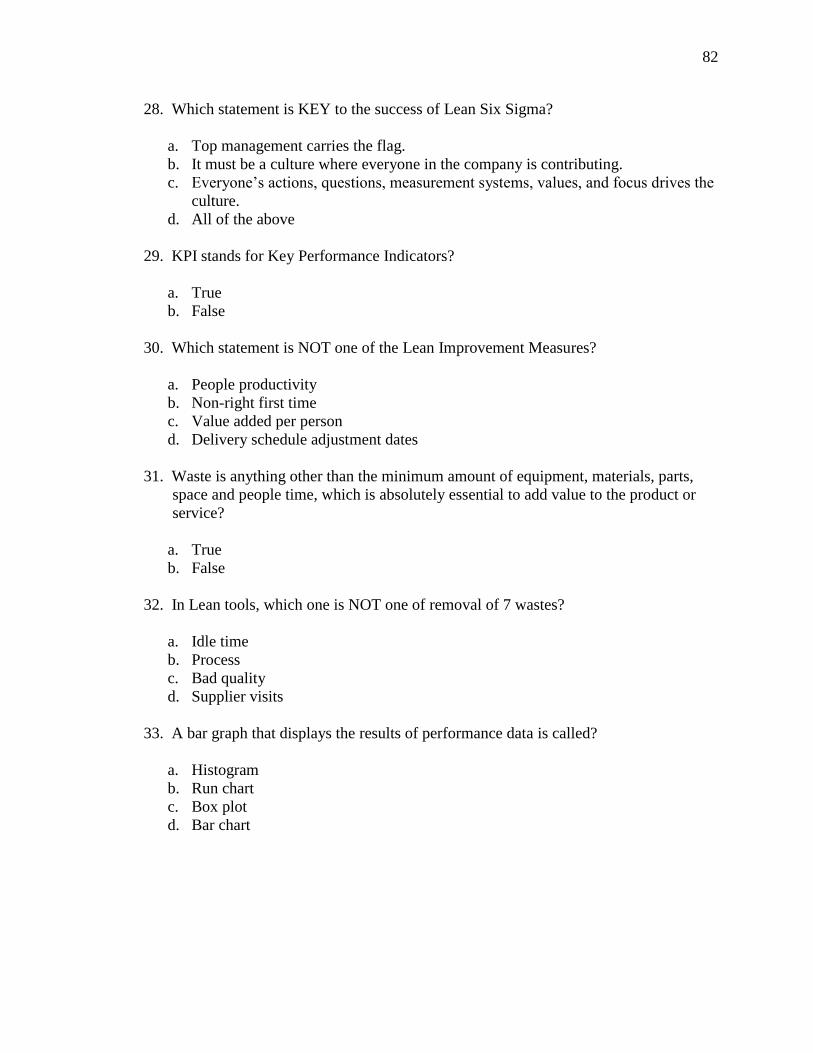
82
28. Which statement is KEY to the success of Lean Six Sigma?
a. Top management carries the flag. b. It must be a culture where everyone in the company is contributing. c.
culture. d. All of the above
29. KPI stands for Key Performance Indicators?
a. True b. False
30. Which statement is NOT one of the Lean Improvement Measures?
a. People productivity b. Non-right first time c. Value added per person d. Delivery schedule adjustment dates
31. Waste is anything other than the minimum amount of equipment, materials, parts,
space and people time, which is absolutely essential to add value to the product or service?
a. True b. False
32. In Lean tools, which one is NOT one of removal of 7 wastes?
a. Idle time b. Process c. Bad quality d. Supplier visits
33. A bar graph that displays the results of performance data is called?
a. Histogram b. Run chart c. Box plot d. Bar chart
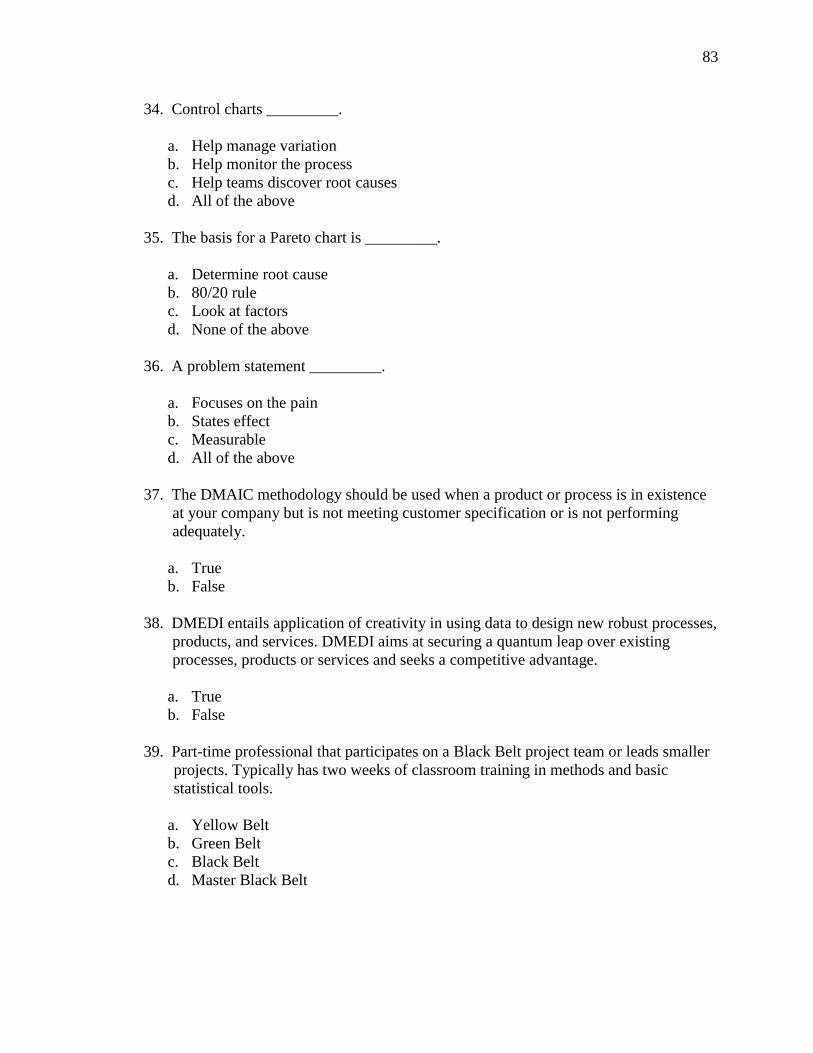
83
34. Control charts _________.
a. Help manage variation b. Help monitor the process c. Help teams discover root causes d. All of the above
35. The basis for a Pareto chart is _________.
a. Determine root cause b. 80/20 rule c. Look at factors d. None of the above
36. A problem statement _________.
a. Focuses on the pain b. States effect c. Measurable d. All of the above
37. The DMAIC methodology should be used when a product or process is in existence
at your company but is not meeting customer specification or is not performing adequately.
a. True b. False
38. DMEDI entails application of creativity in using data to design new robust processes,
products, and services. DMEDI aims at securing a quantum leap over existing processes, products or services and seeks a competitive advantage.
a. True b. False
39. Part-time professional that participates on a Black Belt project team or leads smaller
projects. Typically has two weeks of classroom training in methods and basic statistical tools.
a. Yellow Belt b. Green Belt c. Black Belt d. Master Black Belt
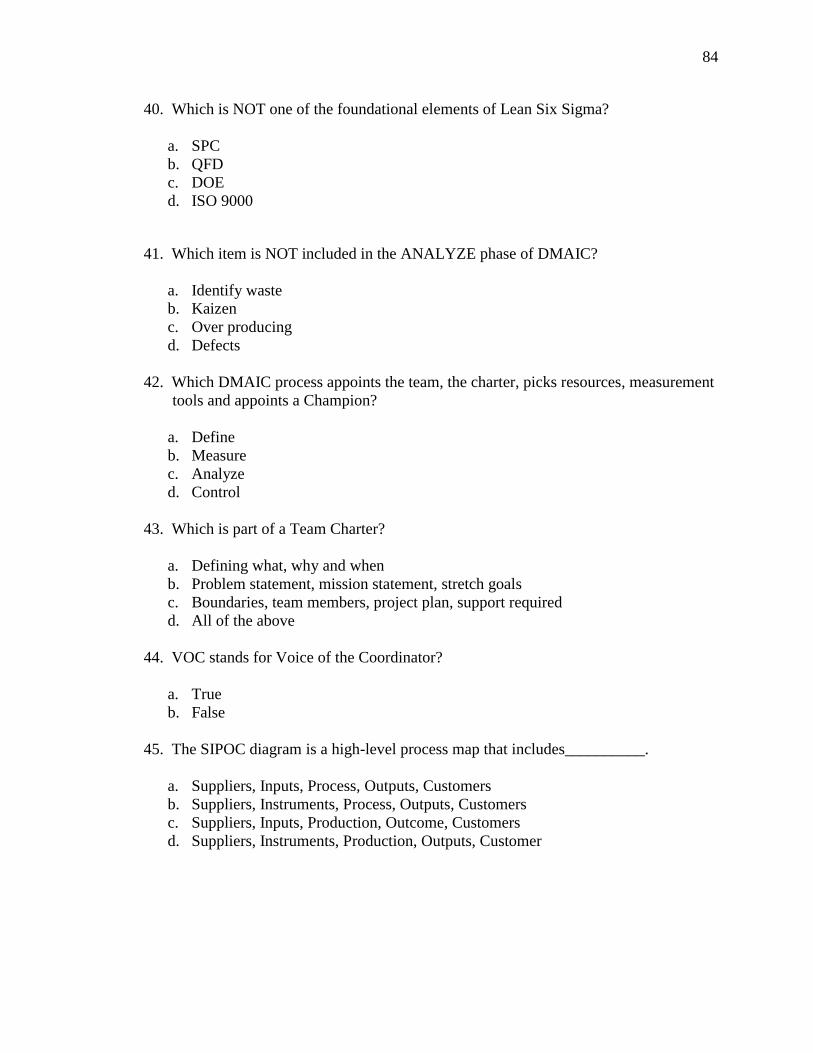
84
40. Which is NOT one of the foundational elements of Lean Six Sigma?
a. SPC b. QFD c. DOE d. ISO 9000
41. Which item is NOT included in the ANALYZE phase of DMAIC?
a. Identify waste b. Kaizen c. Over producing d. Defects
42. Which DMAIC process appoints the team, the charter, picks resources, measurement tools and appoints a Champion?
a. Define b. Measure c. Analyze d. Control
43. Which is part of a Team Charter?
a. Defining what, why and when b. Problem statement, mission statement, stretch goals c. Boundaries, team members, project plan, support required d. All of the above
44. VOC stands for Voice of the Coordinator?
a. True b. False
45. The SIPOC diagram is a high-level process map that includes__________.
a. Suppliers, Inputs, Process, Outputs, Customers b. Suppliers, Instruments, Process, Outputs, Customers c. Suppliers, Inputs, Production, Outcome, Customers d. Suppliers, Instruments, Production, Outputs, Customer
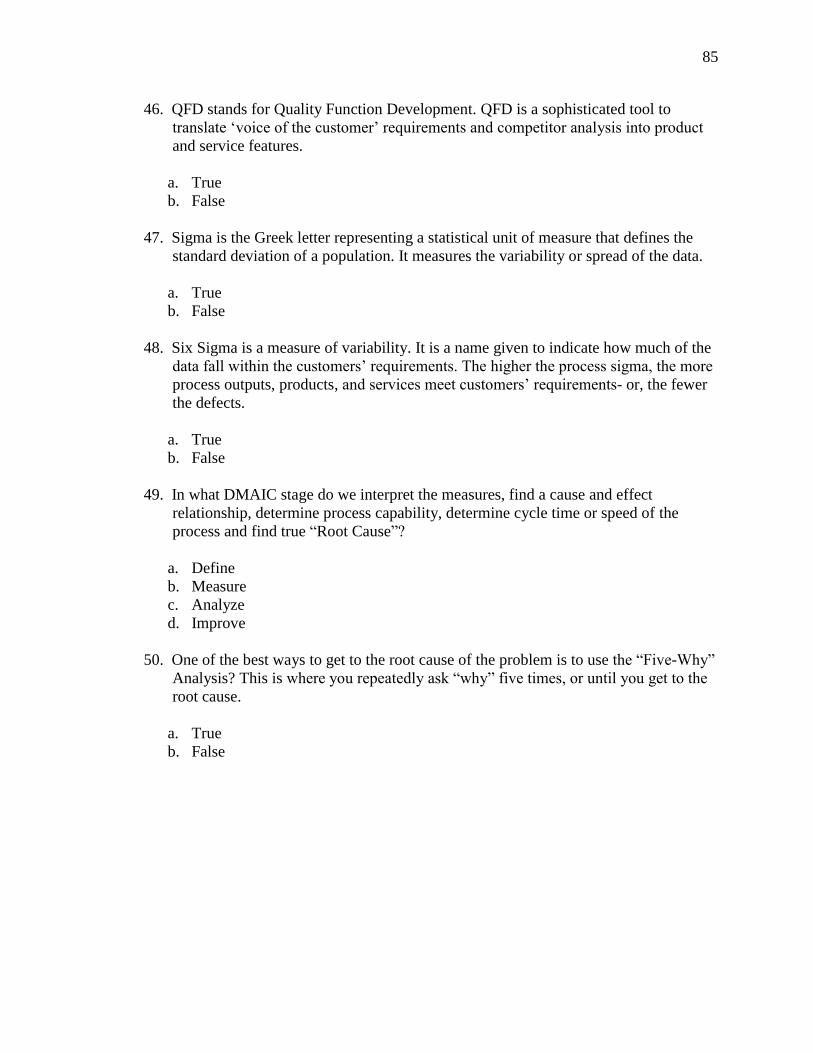
85
46. QFD stands for Quality Function Development. QFD is a sophisticated tool to
and service features.
a. True b. False
47. Sigma is the Greek letter representing a statistical unit of measure that defines the
standard deviation of a population. It measures the variability or spread of the data.
a. True b. False
48. Six Sigma is a measure of variability. It is a name given to indicate how much of the
process outputs, products, - or, the fewer the defects.
a. True b. False
49. In what DMAIC stage do we interpret the measures, find a cause and effect
relationship, determine process capability, determine cycle time or speed of the process and find true Root Cause
a. Define b. Measure c. Analyze d. Improve
50. One of the best ways to get to the root cause of the problem is to use -
Analysis? This is root cause.
a. True b. False
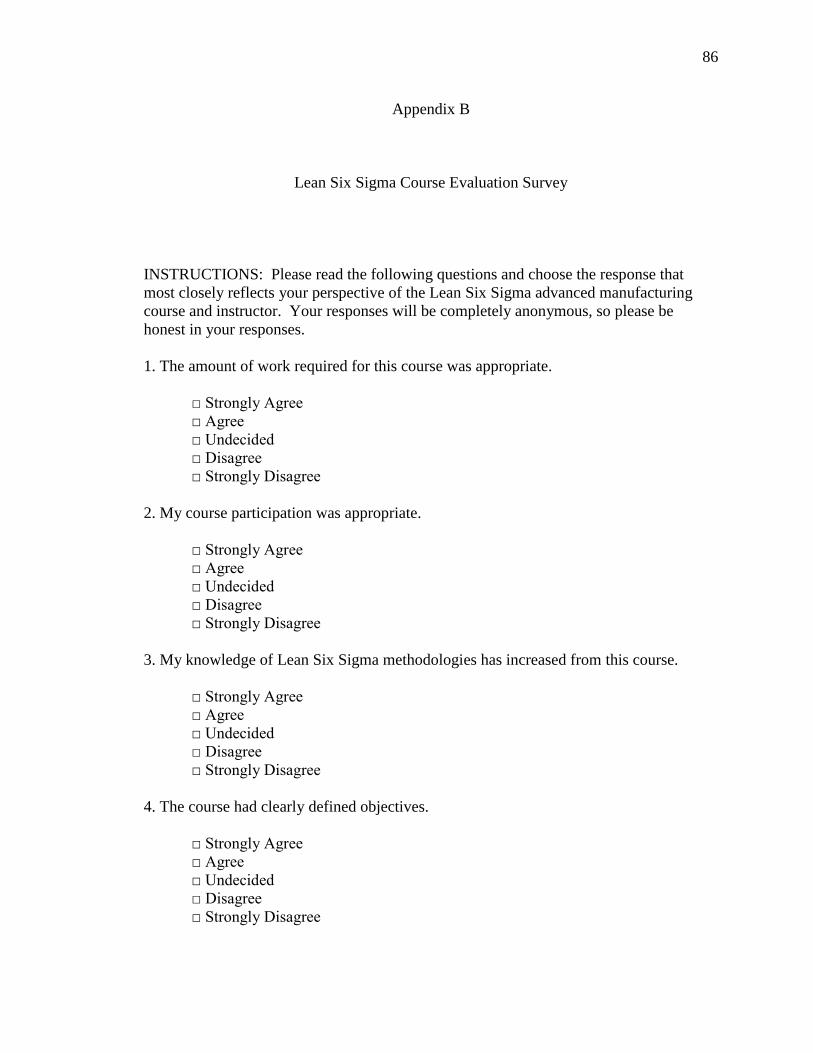
86
Appendix B
Lean Six Sigma Course Evaluation Survey
INSTRUCTIONS: Please read the following questions and choose the response that most closely reflects your perspective of the Lean Six Sigma advanced manufacturing course and instructor. Your responses will be completely anonymous, so please be honest in your responses. 1. The amount of work required for this course was appropriate.
2. My course participation was appropriate.
3. My knowledge of Lean Six Sigma methodologies has increased from this course.
4. The course had clearly defined objectives.
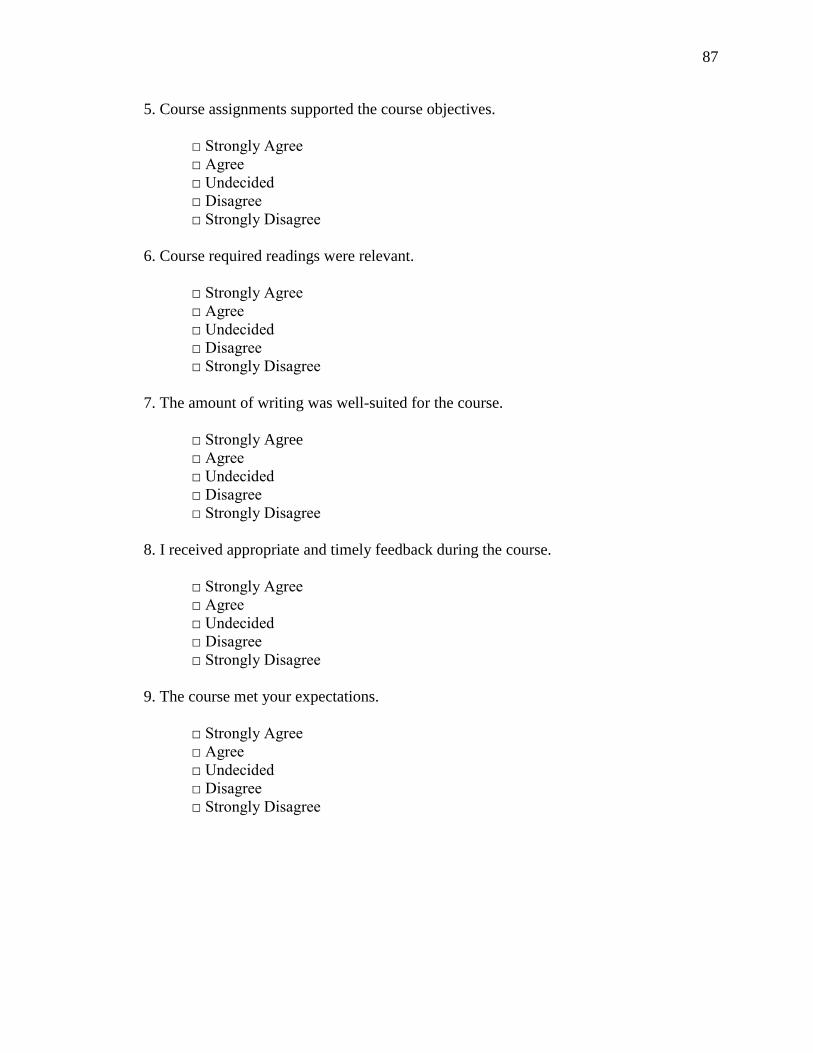
87
5. Course assignments supported the course objectives.
6. Course required readings were relevant.
7. The amount of writing was well-suited for the course.
Agree
8. I received appropriate and timely feedback during the course.
9. The course met your expectations.
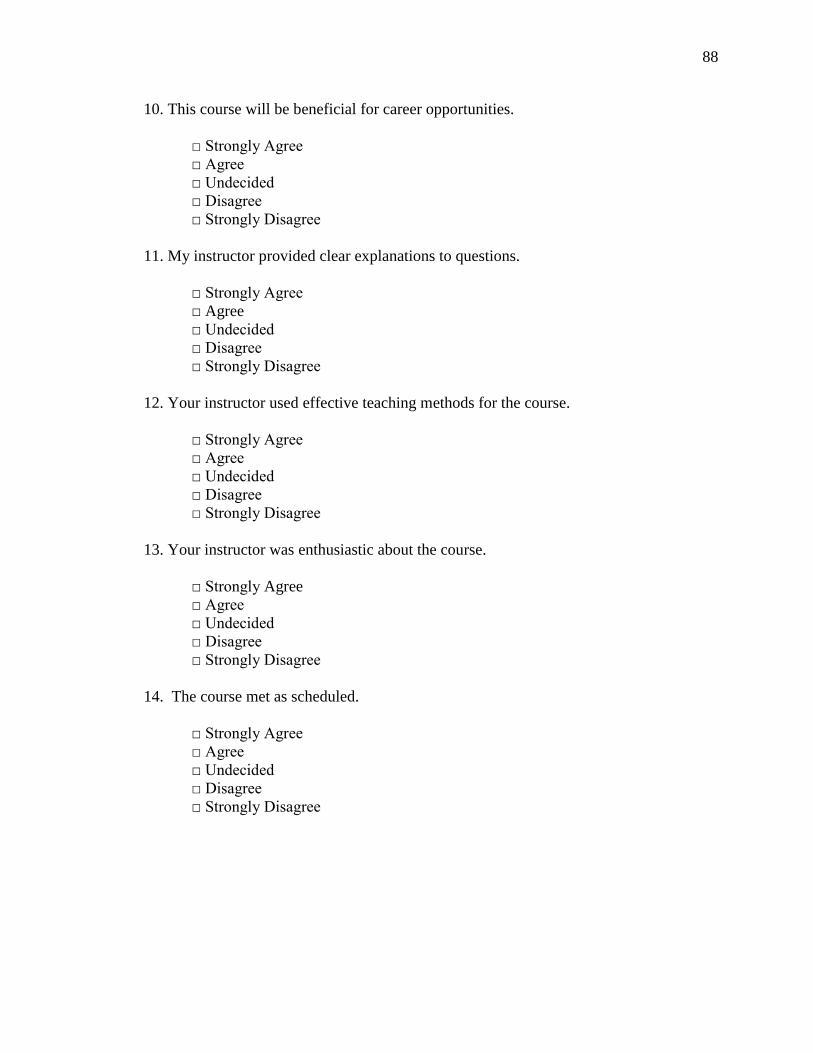
88
10. This course will be beneficial for career opportunities.
11. My instructor provided clear explanations to questions.
Agree
12. Your instructor used effective teaching methods for the course.
13. Your instructor was enthusiastic about the course.
Agree
14. The course met as scheduled.

89
15. Course assignments were interesting and stimulating.
Undecided
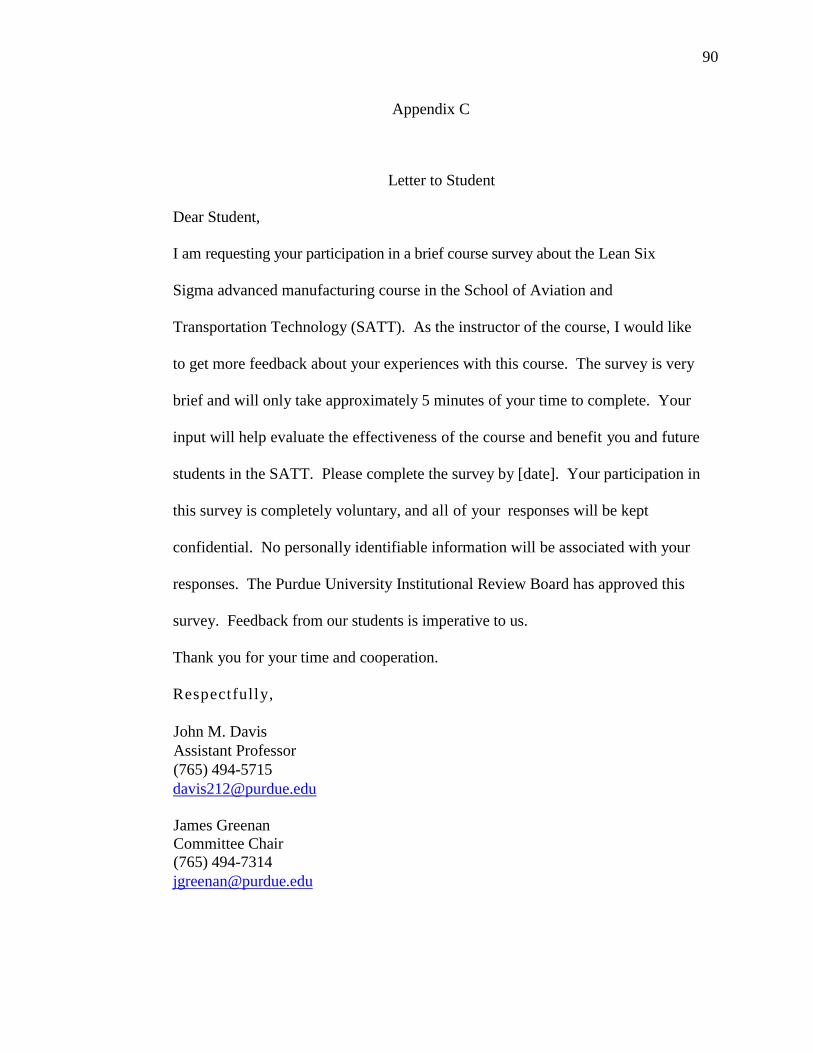
90
Appendix C
Letter to Student
Dear Student,
I am requesting your participation in a brief course survey about the Lean Six
Sigma advanced manufacturing course in the School of Aviation and
Transportation Technology (SATT). As the instructor of the course, I would like
to get more feedback about your experiences with this course. The survey is very
brief and will only take approximately 5 minutes of your time to complete. Your
input will help evaluate the effectiveness of the course and benefit you and future
students in the SATT. Please complete the survey by [date]. Your participation in
this survey is completely voluntary, and all of your responses will be kept
confidential. No personally identifiable information will be associated with your
responses. The Purdue University Institutional Review Board has approved this
survey. Feedback from our students is imperative to us.
Thank you for your time and cooperation.
Respectfully,
John M. Davis Assistant Professor (765) 494-5715 [email protected]
James Greenan Committee Chair (765) 494-7314 [email protected]
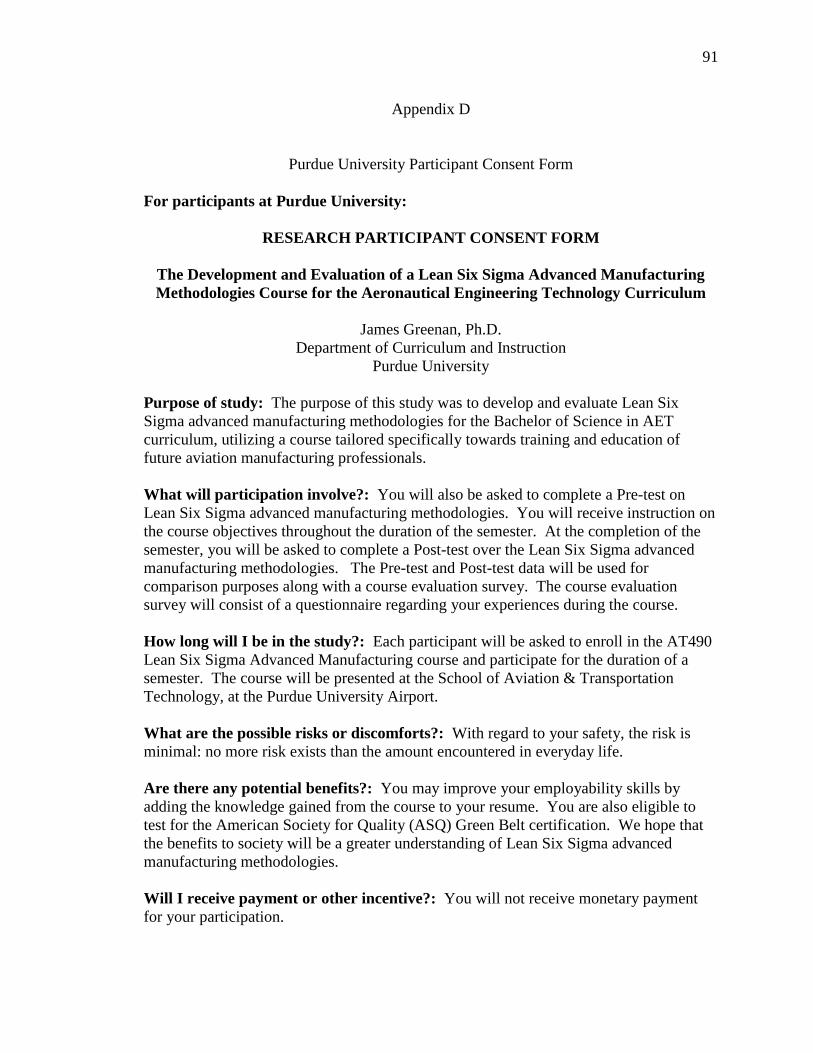
91
Appendix D
Purdue University Participant Consent Form
For participants at Purdue University:
RESEARCH PARTICIPANT CONSENT FORM
The Development and Evaluation of a Lean Six Sigma Advanced Manufacturing Methodologies Course for the Aeronautical Engineering Technology Curriculum
James Greenan, Ph.D.
Department of Curriculum and Instruction Purdue University
Purpose of study: The purpose of this study was to develop and evaluate Lean Six Sigma advanced manufacturing methodologies for the Bachelor of Science in AET curriculum, utilizing a course tailored specifically towards training and education of future aviation manufacturing professionals. What will participation involve?: You will also be asked to complete a Pre-test on Lean Six Sigma advanced manufacturing methodologies. You will receive instruction on the course objectives throughout the duration of the semester. At the completion of the semester, you will be asked to complete a Post-test over the Lean Six Sigma advanced manufacturing methodologies. The Pre-test and Post-test data will be used for comparison purposes along with a course evaluation survey. The course evaluation survey will consist of a questionnaire regarding your experiences during the course. How long will I be in the study?: Each participant will be asked to enroll in the AT490 Lean Six Sigma Advanced Manufacturing course and participate for the duration of a semester. The course will be presented at the School of Aviation & Transportation Technology, at the Purdue University Airport. What are the possible risks or discomforts?: With regard to your safety, the risk is minimal: no more risk exists than the amount encountered in everyday life. Are there any potential benefits?: You may improve your employability skills by adding the knowledge gained from the course to your resume. You are also eligible to test for the American Society for Quality (ASQ) Green Belt certification. We hope that the benefits to society will be a greater understanding of Lean Six Sigma advanced manufacturing methodologies. Will I receive payment or other incentive?: You will not receive monetary payment for your participation.
92
Will information about me and my participation be kept confidential?: All data collected from you will remain anonymous. To prevent any link between your identifying information and performance, all forms with your information will be kept in a separate file from the data collected. Identifying information will not be used in the data analysis or in any subsequent presentation or document. No other identifying information will be linked to the data, making all research data anonymous. All data will be stored in a locked cabinet and destroyed one year after the last participant has been tested. The research records of this project may be reviewed by principle investigators or coinvestigators involved in the management and administration of this study. Findings from this study may be published and presented in a scientific journal or conference. In addition, any departments responsible for regulatory and research oversight may also review records from this project. What are my rights if I take part in this study?: Your participation in this study is voluntary. You may choose not to participate or, if you agree to participate, you can withdraw your participation at any time without penalty or loss of benefits to which you are otherwise entitled. Who can I contact if I have questions about the study?: For research-related problems or questions regarding your rights as a research participant, contact the Principal Investigator, Dr. James Greenan, Department of Curriculum and Instruction, Purdue University, at 765-494-7314 or [email protected]. You may also contact the Purdue University Human Research Protection Program (HRPP), at (765) 494-5942. Documentation of Informed Consent: I have had the opportunity to read this consent form and have the research study explained. I have had the opportunity to ask questions about the research study, and my questions have been answered. I am prepared to participate in the research study described above. I will be offered a copy of this consent form after I sign it. __________________________________________
__________________________________________
__________________________________________
93
Appendix E
Lean Six Sigma Summarized Course Topics
Lesson 1, Topic: Six Sigma
-
- - Caterpillar Inc., 2000) -
Lesson 2, Topic: Six Sigma Process Tools
- - -
Lesson 3, Topic: Lean & Lean Six Sigma and Six Sigma Rules & Responsibilities
- -
o o - o -
- -
Lesson 4, Topic: Six Sigma & Lean Tools
-
94
Lesson 5, Topic: DMAIC- Define
- - -
o o o - o o o o
Lesson 6, Topic: DMAIC- Measure
- -
- - - - Caterpillar Inc., 2000)
Lesson 7, Topic: DMAIC- Analyze
- - - -
o - - - - Caterpillar Inc., 2000)
Lesson 8, Topic: DMAIC- Improve
- - - -
95
Lesson 9, Topic: DMAIC- Control
- - - -

VITA
96
VITA
JOHN MICHAEL DAVIS EDUCATION:
PhD., Career and Technical Education, Purdue University, 2016 M.S., Industrial Technology, Eastern Illinois University, 1992 B.S., Industrial Technology, Eastern Illinois University, 1990 A.A.S, Instructional Systems Development, Community College of the Air Force, 1990 A.A.S, Aerospace Propulsion Technology, Community College of the Air Force, 1990
PROFESSIONAL EXPERIENCE:
Assistant Clinical Professor, 2009-Present Vice President of Quality, 2007-2009 Senior Business Consultant, 2006-2007 Plant and Operations Manager, 1994-2006 USAFR Aircraft Maintenance Unit Superintendent, 2003-Present USAF Technical Training Instructor, 1985-1993 USAF Aerospace Propulsion Technician, 1978-1993
PROFESSIONAL REGISTRATION/CERTIFICATION:
FAA Airframe and Powerplant Mechanic FAA Private Pilot CCAF Professional Manager Project Management Professional Lean Six Sigma Green Belt USAF Master Technical Training Instructor CCAF Aerospace Management Certificate
ACTIVE MEMBERSHIP IN PROFESSIONAL/SCIENTIFIC SOCIETIES:
Purdue University Representative to the Aviation Technician Education Council (ATEC)
97
PUBLICATIONS (2009 AND LATER):
Ropp, T. D., Amadou, A., & Davis, J. M. (2014). Incorporating 3D Printing as an Introduction to Digital Manufacturing in an Aeronautical Engineering Technology Curriculum. ATEC Journal, (36)2, 1-7
Ropp, T. D., Hedden, J. B., Mick, P. J., Davis, J. M., & Austin, S., Jr. (2012). Incorporating Advanced Aircraft Technologies into an Aeronautical Engineering Technology Curriculum. Journal of Aviation Technology and Engineering, (2)1, 5.
INSTITUTIONAL AND PROFESSIONAL SERVICE (2009 AND LATER):
Purdue Polytechnic Institute Faculty Senator, August 2015 Present School of Aviation and Transportation Technology Safety Committee Chair, August 2015 Present Aeronautical Technology: Engineering and Maintenance (ATeAM) Student Group Sponsor, April 2013 Present FAA Liaison, December 2010 Present FAA Part 147 Curriculum Co-Chair, January 2010 - Present AT Curriculum Committee Member, August 2010 Present Test Cell Area Director for the National Test Facility for Fuel and Propulsion at Purdue University, January 2009 Present School of Aviation and Transportation Technology Safety Committee Member, September 2009 Present
PROFESSIONAL DEVELOPMENT ACTIVITIES (2009 AND LATER):
Purdue Polytechnic Institute Transformation Phase 2 Workshop, June 2016 Purdue Polytechnic Institute Faculty & Staff Learning Innovation Workshop, May 2016 Fundamentals of Earned Value Management, Spring 2013 Fundamentals of Acquisition Management, Spring 2012 Boeing Extended Twin Engine Operations Course, Summer 2011