Embed Size (px)
Citation preview
THE DETERMINATION PROCESS OF INDUSTRIAL PRICES IN U.S.:
A Post Keynesian Approach
GYUN CHEOL GU1
September 1, 2009
Abstract This study investigates the pricing behavior of the U.S. manufacturing industry
by using Johansen’s cointegration method. It demonstrates that industrial prices, investment,
money wage and productivity were cointegrated in the four industries significantly and
meaningfully. In light of their competition environments and market structures compared with
those of the other industries, the empirical results in U.S. are shown to be not inconsistent with a
Post Keynesian theory.
Keywords Price determination, U.S. manufacturing industry, Post Keynesian Model
JEL Classification L11, L60
1 The author is a PhD student in Department of Economics at the University of Missouri at Kansas City. E-mail address is [email protected]. The author wishes to thank Professor Lee and Professor Eaton for a number of suggestions that have helped to significantly improve this paper. All errors remain the author’s own.
2
I. INTRODUCTION
The neoclassical price theory is predicated on unrealistic hypotheses concerning behaviors of
consumer and firm, and technology. To begin with, it needs to make a consumer keep the
transitive property which is fundamental to the whole consumer theory, and assume that each
consumer has a specific form of utility function to aggregate across consumer demand curves for
market demand curve. In addition, the neoclassical microeconomic theory requires that firm’s
marginal cost curve be increasing, which can allow for profit maximization under perfect
competition market condition (Lee and Keen 2004). Even in the neoclassical monopoly model, it
needs to maintain the assumptions on consumer behaviors in order to attain the elasticity of
demand as well as market demand function, which means that the relatively realistic monopoly
model cannot avoid the same critiques, either.
The neoclassical theory has been accused by heterodox theorists of being at odds with
real-world observations. Heterodox microeconomists argue that a completely different approach
to pricing theory is needed, which is supposed to be predicated on realistic understandings of the
nature of decision-making by an enterprise, in particular, run in an oligopolistic market
environment characterized by mutual interdependence. One of them is cost-markup pricing model,
which is extended to incorporate firm’s economic activities by Eichner and Moss. In light of the
theory, I shall show how well the Post Keynesian framework can explain the real world by
empirical study using cointegrating vectors and vector error correction model.
The organization of the paper is as follows. In Section II, we review Eichner-version of
Post Keynesian theory critically and discuss particular theoretical issues on a theory of enterprise
pricing. Section III investigates previous empirical studies and their limitations as a starting point.
Section IV provides econometric methodology and empirical results consistent with the theory.
Section V discusses the findings and suggests some possible reasons for the behaviors of the main
3
economic variables. Section VI deals with the transformation of US economy and the slowdown
of accumulation. Lastly, Section VII concludes.
II. POST KEYNESIAN THEORY OF INDUSTRIAL PRICING
The most basic motivation of business enterprise is survival, which is for the reproduction and
continuation of it. Business enterprise must grow in order to survive under the context of
imperfect competition, more specifically in oligopolistic market characterized by mutual
interdependence2 (Eichner 1976 and Lavoie 1992). This interdependence forces the business
enterprise to make a strategic decision about its investment and thus prices. Most of the Post
Keynesian theories of industrial pricing are predicated upon realistic assumptions reflecting
actual conditions in oligopolistic industries and applying to the prevailing type of enterprises in
most industries.
For a better understanding of how prices are set under oligopoly it is necessary to
examine the conditions impinging upon the industry at large as well as the individual firm over
the long run. Analyzing the oligopolistic industry is tantamount to dealing with the strategic
behaviors of the involved players, in particular, the megacorp-price leader as the surrogate for its
fellow oligopolists in the industry since the common interest among them is to avoid price
competition that would be destructive to all its members. Furthermore, the analysis needs to shed
light on the mechanism through which the industry price set by the leader is acceptable to other
oligopolists in the same industry.
Eichner (1976) provides a pricing formula for oligopoly which is a refined version of
cost-plus approach. Under this formula, the ‘plus’ added to variable and fixed costs is called the
2 What the interdependence means is that no single member of the industry can expect to take action without evoking a response from the other firms which are its rivals.
4
corporate levy, which is required by the megacorp to finance its planned investment expenditures3.
Price should be changed reflecting a change in any of the pricing formula’ components, and thus
assuming variable and fixed costs remain constant the change in price should be a result of a
change in the required corporate levy, which reflects the megacorp’s cost of internally generated
investment funding. Therefore, “the pricing decision in an oligopolistic industry is intimately
bound up with the capital accumulation process” (Eichner 1976, p.56). This linking of the price
level to the industry’s investment program is the most important feature of the Eichner’s
microeconomic model.
In this model, the megacorp price leader can alter intertemporal revenue flow by using
the price variable, which means that it can increase the margin above costs in order to obtain
more internally generated investment funds because of the existence of collective monopolistic
rent. Eichner (1976, p.56) suggests that the real cost is what constrains the price leader from
increasing the industry price level and securing additional internal investment funds. The cost
derives from the substitution effect, the entry factor and the possibility of meaningful government
intervention. Besides the internally generated funds for investment, the oligopolists can obtain
additional investment funds externally by issuing either fixed-interest obligations or equity shares
at the ‘permanent’ interest rate without being significantly affected by current money market
conditions. The extent to which a particular type of expenditure leads to a relatively high increase
in the total corporate levy realized hinges on the marginal efficiency of investment. There are four
types of investment expenditures, each of which can be supposed to promote the growth of the
internally generated funds over time. They can be categorized as follows: (a) the purchase of new
plant and equipment, (b) the differentiation of the industry’s product more sharply, (c) the
erection of higher barriers to entry, or (d) the creation of a more favorable public image. The
overall marginal efficiency of investment schedule provides the price leader’s total demand for
3 It is interchangeable with such terms as discretionary income, internally generated funds, and individual megacorp savings.

5
investment funds. Since the price leader enjoys a cost advantage, the other firms in the industry
will accept the price leader’s choice of price change and thus the change in price will then prevail
until at least the next pricing period.
However, according to Moss (1981), the problem with Eichner’s theory is that it is
applicable only to oligopolistic markets where a price leader has undisputable power to constrain
its peers from deviating from the price set by the leader. Moss (1981, p 162) argues that the price
leader must have some sort of market power4 to ensure that competitors follow its pricing
decisions, and then suggests markets to which the Eichner pricing theory is applicable as follows:
[T]he Eicher-Wood price theory applies to what were called ‘fixprice’ markets by Hicks
(1965) but not to those which he called ‘flexprice’markets. For in fixprice markets, prices
do not adjust in the short run to eliminate excess supplies and demands, while in flexprice
markets they do. Thus, the conditions in which Eichner-Wood price theory can be applid
are the same conditions that give rise to fixprice markets. The conditions in which
Eichner-Wood price theory cannot be applied are the same conditions that give rise to
flexprice markets.5
In the fixprice market fluctuations in stockholdings, queue lengths and production rates
resolve discrepancies between supplies and demands, whereas in the flexprice market such
difference are settled by such price coordination as neoclassical theory hinges on. This
differentiation of fixprice from flexprice market is just necessary condition for specifying the
applicability of Eichner’s theory.
4 Moss (1981) identifies market power with the ability systematically to eliminate the positive net cash flows of competitors, suppliers and/or customers in so far as that cash flow derives from, or depends upon, activities in the markets in which the holder of market power trades. 5 S. Moss, An Economic Theory of Business Strategy, 1981, p. 191
6
III. PREVISOUS EMPIRICAL STUDIES AND LIMITATIONS
Sen and Vaidya (1995) test the validity of the Post Keynesian model in India using methods of
cointegration, and demonstrated that industrial prices, the interest rate, investment, money wages,
and productivity were cointegrated. Using error correction models, they trace the short-run
dynamics of these five variables and argue that the empirical results are consistent with the Post
Keynesian theory. Cin (2005) investigates the pricing behavior of the subsectors of the Turkish
private manufacturing industry by using Johansen’s cointegration analysis. Cin argues that it is
found that prices, demand and unit wage cost demonstrate cointegration relations in 14 out of 16
subsectors in accordance with the expectation of the theory. Cin considers output in an industry as
a proxy for demand pressure. The output, however, includes foreign demand, which is
inconsistent with domestic wholesale price indices used as the dependent variable.
Bloch and Olive (1996) argues that the implication of fixed mark-up pricing that the rate
of change in domestic manufacturing prices is equal to the rate of change of unit production costs
receives qualified support from their empirical results for explaining pricing in Australian
manufacturing. Moreover, the pricing equation based on a fixed mark-up is found to provide the
most reasonable explanation of pricing behaviour for industries in which either the intensity of
domestic competition is high or there is little exposure to foreign competition.
Atesoglu (1997) provides a Post Keynesian explanation of U.S. inflation. The emphasis
of the modeling approach in explaining inflation is on the growth rate of wages relative to the
growth rate of labor productivity, i.e. the wage-cost markup model. Atesoglu (2000) finds a
positive cointegration relationship between income and autonomous expenditures, employment
and autonomous expenditures in wage units, inflation and rate of growth in unit labor costs, and
the money supply and autonomous expenditures. Atesoglu also argues that these results provide
rigorous empirical support for the Post Keynesian, demand-oriented explanation of income and
employment, the wage-cost model of inflation, and the endogeneity of the money supply thesis.
7
Two of the papers utilize highly aggregated variables for wage rate, productivity and inflation as
a whole. Indeed, there have been little studies on the price determination process by industrial
level in U.S.
IV. ECONOMETRIC METHODS AND EMPRICAL FINDINGS
Economic Model
According to Eichner (1976), there is a long-run relationship between industrial prices,
investment, money wages, and productivity. A rise in industrial prices can occur when firms
increase markups in order to generate internal funds for planned investment. Also, industrial
prices can rise when workers’ compensation increases more than productivity improvement. The
Wage-Cost Markup (WCM) provides a Post Keynesian functional framework which has been
discussed in the previous section:
, where P is the price index of a manufacturing industry, K is the profit markup, W is the
money wage per worker, and Z is labor productivity in the industrial sector.
The markup is assumed to be an increasing function of investment. The markup can be
affected by the wage and productivity since a firm would absorb a part of the increase in money
wages by reducing the markup; and the firm also has a strong incentive to maintain productivity
gains without price reductions (Sen and Vaidya 1995). That is, a part of the gains would be
retained for a higher corporate levy. Considering these factors, a general formulation of the
markup and the implied price equation would be as follows:
8
, where a2, a3 > 0.
Substituting equation (2) into K in (1) and taking log of both sides give us
Equation (3) is the equation to be estimated by MLE in VECM (Vector Error Correction Model).
The equation represents the long-run relationship between industrial price, investment, money
wage and labor productivity. The actual price may be greater or less than the price shown in the
equation.
It should be noted that the rate of interest is excluded from the determinants of the
markup, which has real effects on the result of Sen and Vaidya (1995). Most evidence shows that
the demand for credit are inelastic (or at times even perversely positive) with respect to the
general level of interest rates; and in a downturn, the expected returns to investment fall farther
and faster than market interest rates can be brought down (Wray 2004). Corbett and Jenkinson
(1997) investigates how physical investment has been funded in four countries over the period
1970 to 1994 and reports that Germany, UK and US are predominantly internally financed and
Japan has shown relatively higher level of bank finance as the second big part of investment fund,
of which the contribution has continued to fall. Moreover, Fazzari (1993) also argues that there is
no credible evidence that a negative relation between interest rate and the amount of investment.
Fazzari offers evidence that policies aimed at stimulating private sector investment through
interest rate reductions are, at best, misguided because of the nebulous effect of interest rates on
investment. Now that there is little evidence of relations between interest rate and private
investment, it can be ignored that interest rate can affect the size of markup through planning to
finance investment with borrowed funds from financial sector.
9
Data Source and Industries
Our data sample period runs from 1987 to 2006 annually and contains a total of 20 observations
for each industry. All data are taken from OECD STAN database. The STAN database for
industrial analysis includes annual measures of output, labor input, investment and international
trade. STAN is primarily based on member countries' annual National Accounts by activity tables
and uses data from other sources, such as national industrial surveys/censuses, to estimate any
missing detail. The current version of STAN is based on the International Standard Industrial
Classification of all Economic Activities, Revision 3 (ISIC Rev.3) and covers all activities
(including services).
The industry levels were chosen as specifically as possible according to the availability.
These industries are 15, 17, 20, 21, 22, 23, 24, 25, 26, 27, 28, 29, 34, and 35 defined as follows:
15: FOOD PRODUCTS AND BEVERAGES 17: TEXTILES, TEXTILE PRODUCTS, LEATHER AND FOOTWEAR 20: WOOD AND PRODUCTS OF WOOD AND CORK 21: PULP, PAPER AND PAPER PRODUCTS 22: PRINTING AND PUBLISHING 23: COKE, REFINED PETROLEUM PRODUCTS AND NUCLEAR FUEL 24: CHEMICALS AND CHEMICAL PRODUCTS 25: RUBBER AND PLASTICS PRODUCTS 26: OTHER NON-METALLIC MINERAL PRODUCTS 27: BASIC METALS 28: FABRICATED METAL PRODUCTS, except machinery and equipment 29: MACHINERY AND EQUIPMENT, N.E.C 34: MOTOR VEHICLES, TRAILERS AND SEMI-TRAILERS 35: OTHER TRANSPORT EQUIPMENT
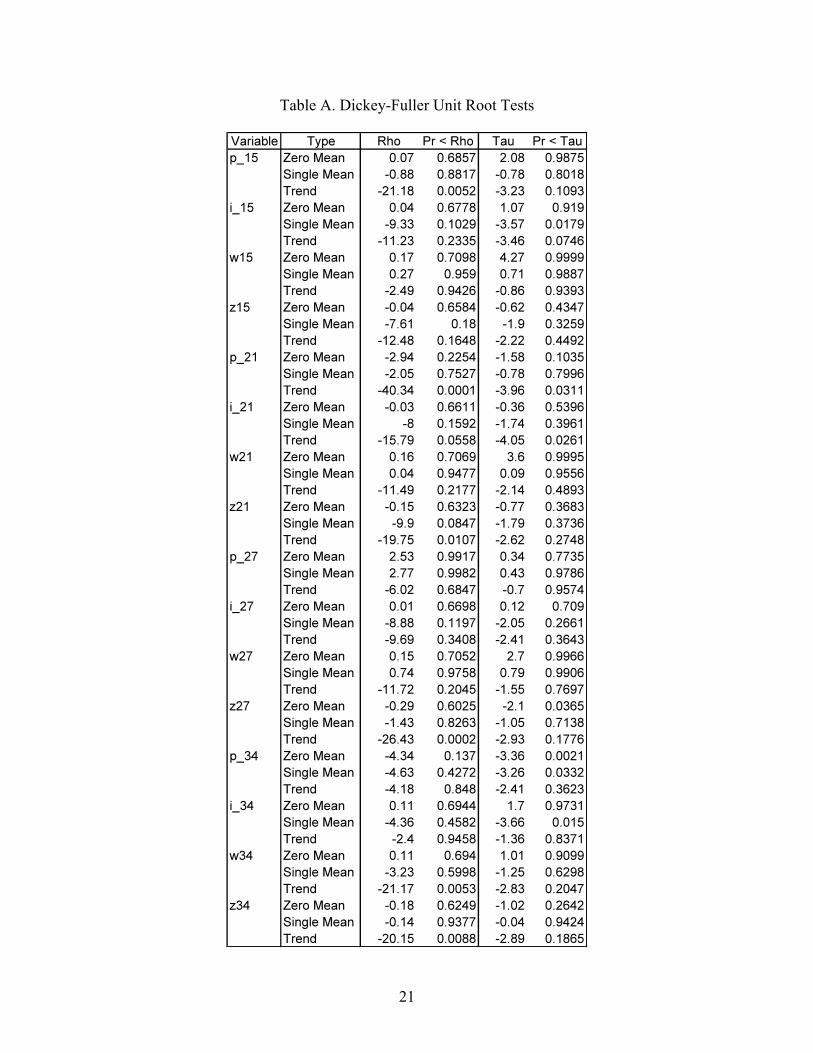
Unit Root Tests
The unit root tests are calculated and reported in the appendix. Dickey-Fuller (DF) unit root test,
Augmented Dickey-Fuller (ADF) test and Phillips and Perron (PP) test are investigated. Trend is
included, as these series contain clear trend, and lag lengths are chosen according to Akaike
information criterion (AIC). Accordingly, all the variables are integrated of order 1, i.e. I(1) in
10
accord with the usual expectation that many macroeconomic time series are non-stationary. The
results are shown in Table A on the appendix.
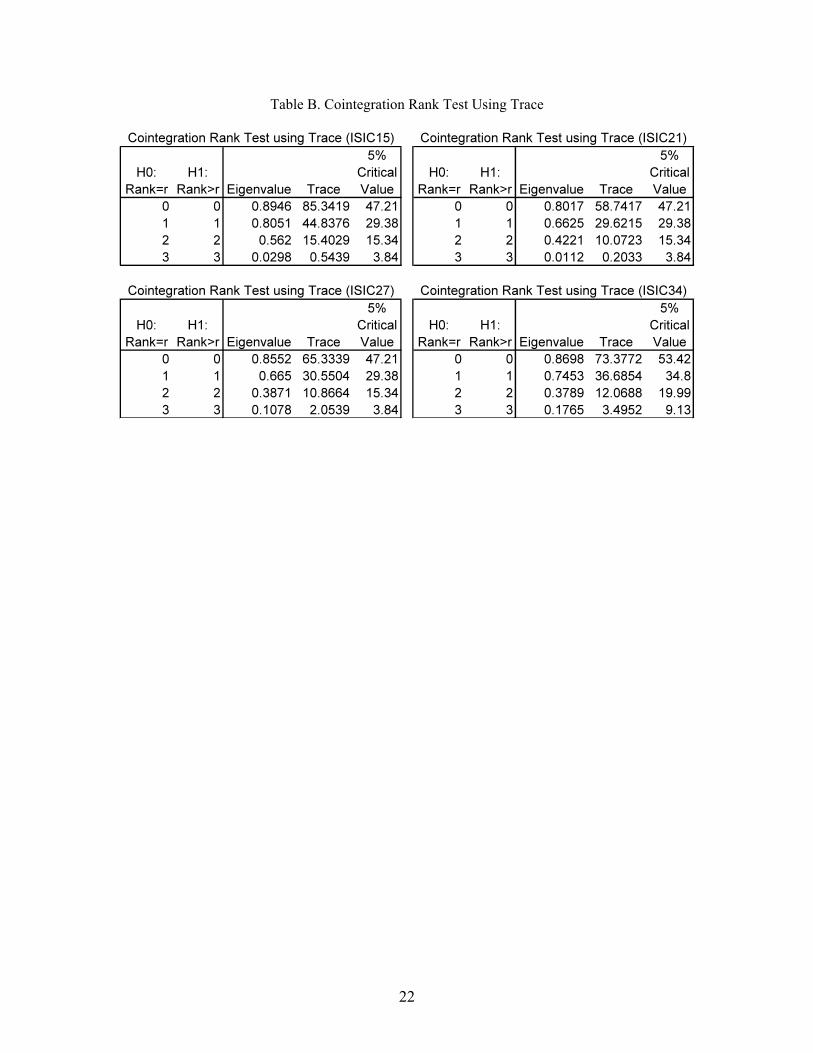
Cointegration Rank Tests
I employ the cointegration rank test developed by Johansen (1988) and Johansen and Juselius
(1990), which allows for the maximum likelihood multivariate cointegration technique.
According to Hansen and Juselius (1995), this method allows for testing various hypotheses more
appropriately than the other methods, even if some variables are I(0).
SAS Varmax procedure provides cointegration rank test using trace with and without
restriction, and also hypothesis test of the restriction. The result from hypothesis test of the
restriction indicates that there is a separate drift and no separate linear trend in the VECM form.
In light of the result as well as the graphs of the variables, the specification of deterministic trends
is determined as follows:
(4)
, where and
, is normalized adjustment parameters and is normalized cointegration coefficients
Johansen cointegration tests are applied for 14 industries of the U.S. manufacturing.
According to maximum eigenvalue and trace statistics, the existence of a long-run relationship
among prices, investment, wage and productivity is found in almost all the industries. Their
11
results of the cointegration tests are shown in Table B of the appendix6. The test statistics present
in Table B indicate that the hypothesis of no integration relationship can be rejected in 5%
significant level. Hence, there is at least one long-run relationship between p, i, w and z.
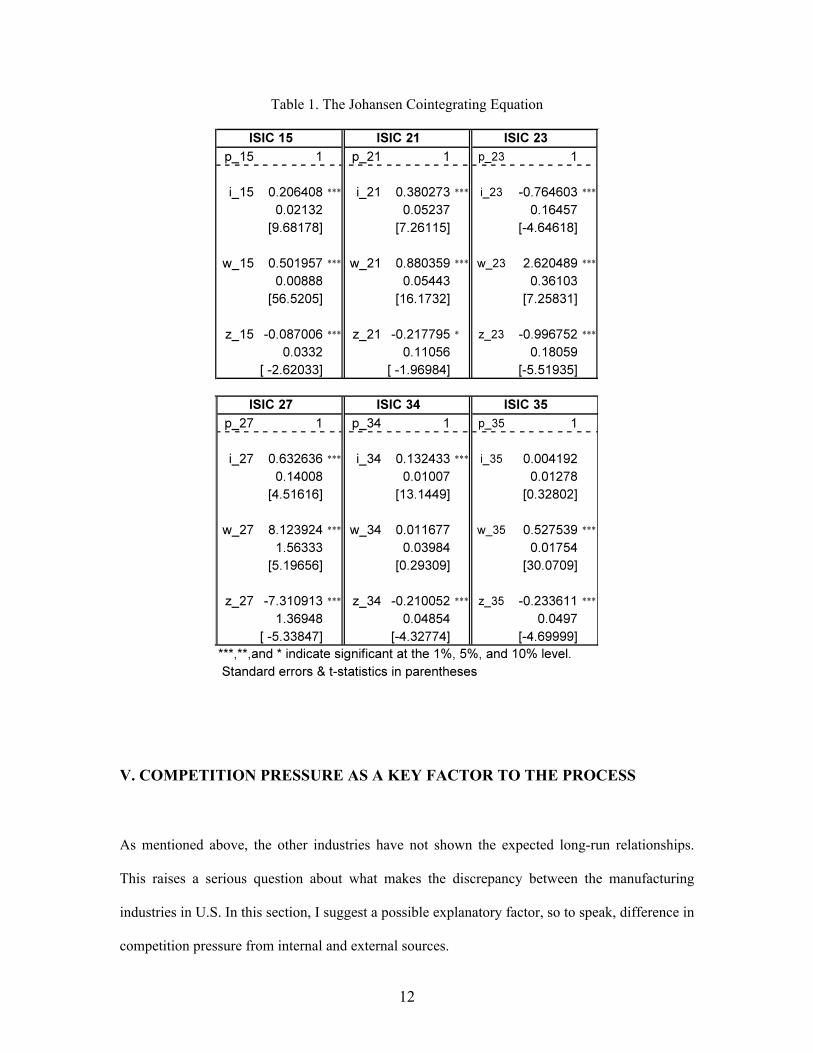
Moreover, the maximum likelihood estimator of in equation (4) is obtained from the
eigenvectors that correspond to the r largest eigenvalues. The cointegrating vectors are
normalized to coefficient of price variable p, and the long-run relationship can be written as
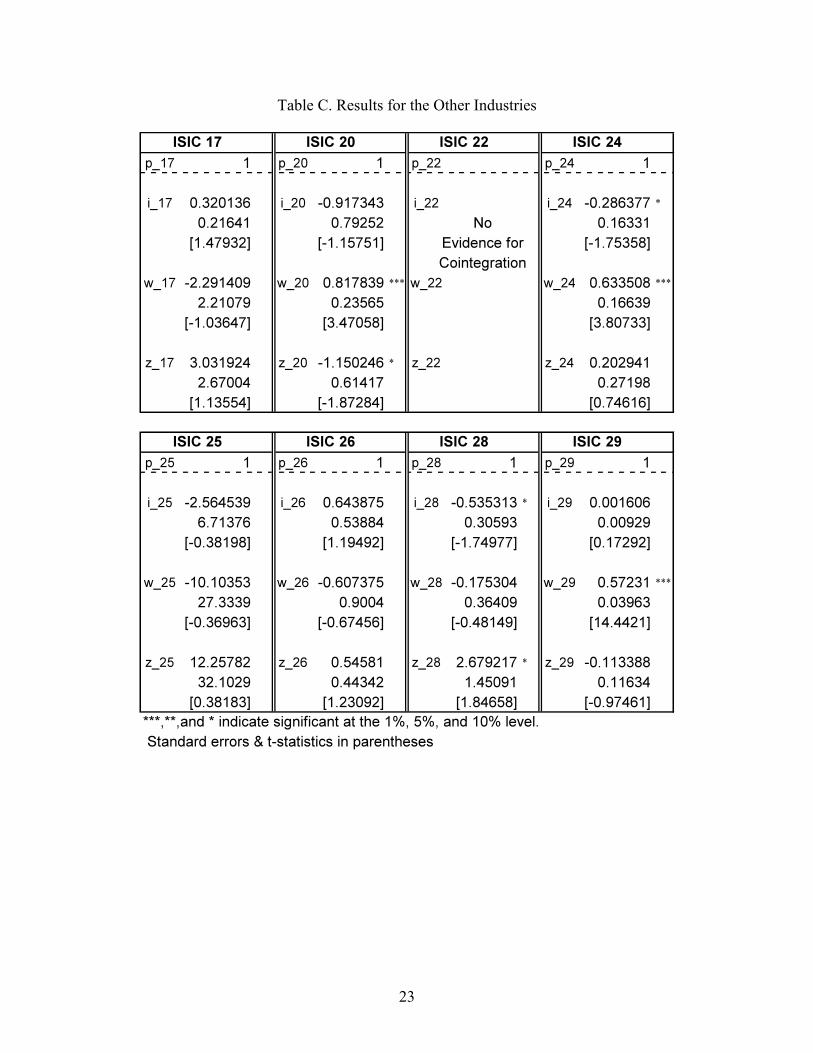
shown in Table 1, which includes the six industries. Each of these industries allows its own
cointegrating vector to have at least two variables significant at 1% level, while the other
industries do not meet this criterion and thus they are reported in table C of the appendix.
Of those industries, only four industries (ISIC 15, 21, 27 and 34) suggest that the
influences of money wage and investment amount on prices are positive and the influences of
labor productivity on prices are negative as expected from the Post Keynesian view. Interestingly,
even if ISIC 23 allows all the variables of its cointegrating vector to be significant at 1% level,
the sign of investment is negative as opposed to the theory. Given that the industry is coke and
refined petroleum products, the result can be ignored since the Eichner model is not applicable to
‘flexprice’ markets which include agriculture and natural resources industries like ISIC 23. In
addition, the industry of ISIC 35 (other transport equipment) follows simple wage markup model
in which investment is not relevant to price determination since the investment variable is not
statistically significant at all.
Moreover, logarithmic values show the responsiveness of prices to other variables. It is
found that the long-run responsiveness of prices to real wage costs (money wage/labor
productivity) is smaller than one, in all the industries except motor vehicles (ISIC 34).
6 It will be shown that only four of them (15, 21, 27, and 34) appear to be in support of the Post Keynesian theory on which the price is an increasing function of money wage and investment amount and also a decreasing function of labor productivity. Accordingly, the table B includes only the results of the four industries.
12
Table 1. The Johansen Cointegrating Equation
V. COMPETITION PRESSURE AS A KEY FACTOR TO THE PROCESS
As mentioned above, the other industries have not shown the expected long-run relationships.
This raises a serious question about what makes the discrepancy between the manufacturing
industries in U.S. In this section, I suggest a possible explanatory factor, so to speak, difference in
competition pressure from internal and external sources.
13
It has been found that the long-run relationships between industrial price, investment,
money wage and labor productivity shown in four industries are exactly in accord with the
expectation of the Post Keynesian pricing theory, whereas others are not following the prediction.
However, it does not imply that the Post Keynesian theory fails to explain the U.S. economy, in
particular the price determining mechanism. Since an enterprise’s market power depends heavily
on relative market competition pressure, the four explainable industries are expected to have
relatively less fierce competition pressure than other 10 industries which have different
coefficients from the expected ones from Post Keynesian vantage point.
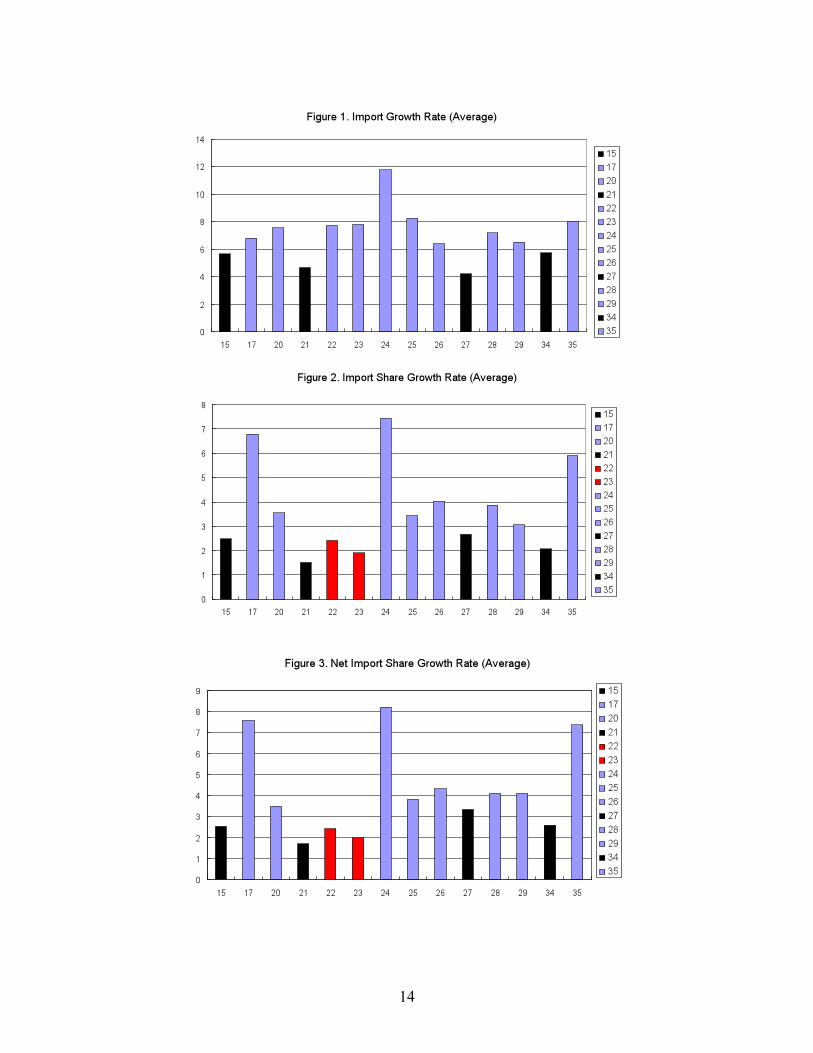
Indeed, figure 1, 2 and 3 show that the four industries have less competition pressure
from outside the country than the others in terms of import growth rate and the growth rate of the
market share of the imported goods as well as the growth rate of the market share of the net
imported goods in their industries.
Nevertheless, the industries 22 and 23 are among the group with less import pressure in
terms of the growth rate of the market share even if they don’t have the expected coefficients. As
discussed above, ISIC 23 (coke and petroleum products) can be ignored where the price change
depends highly on market situations such as demand and supply, shortage from natural disaster
and business cycle. Even so, ISIC 22 (printing and publishing) is left to be explained concerning
the reason why the low external competition does not lead to such high market power that it can
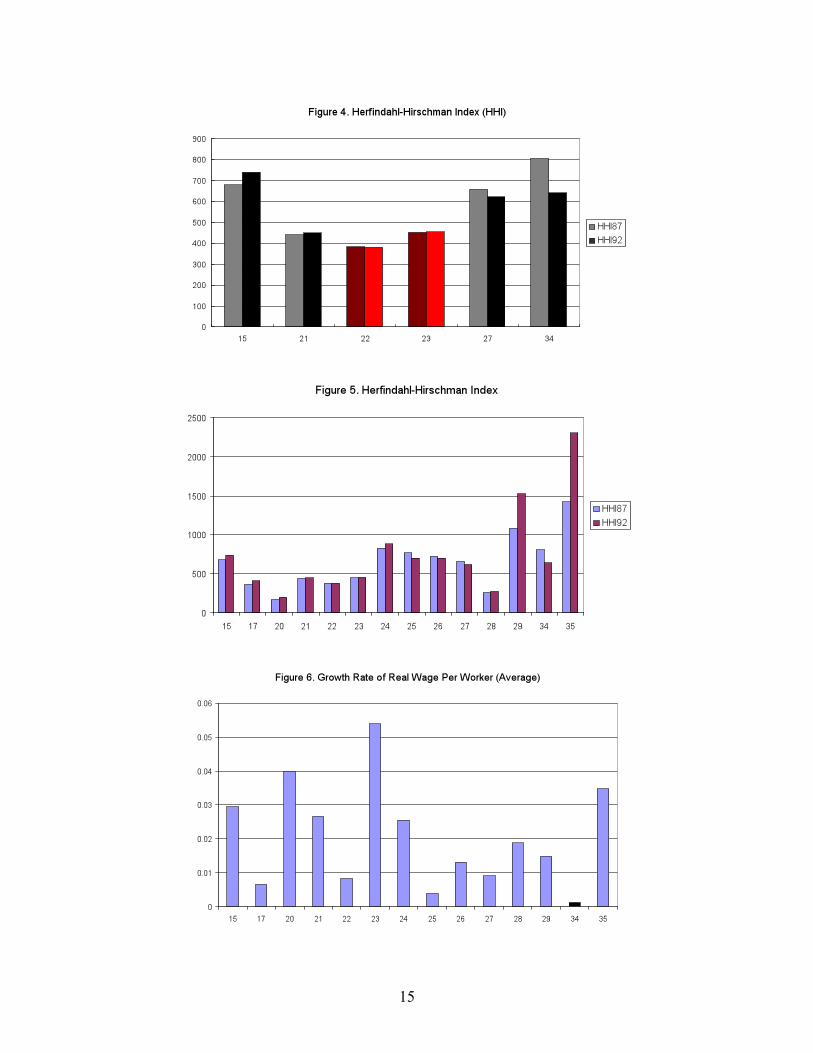
utilize pricing policy to finance its investment. How can it be reconciled with the story? Figure 4
shows Herfindahl-Hirschman Index (HHI) for the six industries with relatively low growth rate of
the market share of the imported goods. Higher HHI generally indicate a higher concentration and
thus a higher market power, whereas lower HHI indicate the opposite. It shows that the firms in
the industries 22 and 23 have fiercer competition pressures from other domestic enterprises in the
same industries than as in industries 15, 21, 27, and 34 to which the theory applies directly.
Hence we come to a conclusion that the question above can be solved by the relative high
competition between domestic firms occupying industries 22 and 23 respectively.
14
15

16
Therefore, it can be said that even if we can not say that every industry in U.S. is fully
explained by the markup model, at least it can be said that the U.S. industries are not
incompatible with the Post Keynesian price theory.
VI. TRANSFORMATION OF CORPORATE STRATEGY
There is a fundamental question left to be asked – what if changes in corporate
governance have been transforming corporate strategy from an orientation towards retention of
corporate earnings and reinvestment in its growth to distribution of the earnings to shareholders
over the past two decades?
Minsky (1993) suggests that money manager capitalism emerged in which the main
business in the financial markets become far removed from the financing of the capital
development of the country; furthermore, the main purpose of those who controlled corporations
was no longer making profits from production and trade but rather to assure that the liabilities of
the corporations were fully priced in the financial market, to give value to stockholders. He
continues to argue:
“The giving of value to stockholders took the form of pledging a very high
proportion of prospective cash flows to satisfy debt liabilities. This prior
commitment of cash meant that there was little in the way of internal finance
left for the capital development of the economy.” (Minsky 1993 p. 112)
Accordingly, Lazonick and O’Sullivan (2000) provide an historical analysis of the rise of
shareholder value as a principle of corporate governance in the United States, tracing the

17
transformation of US corporate strategy from an orientation towards retention of corporate
earnings and reinvestment in corporate growth through the 1970s to one of downsizing of
corporate labour forces and distribution of corporate earnings to shareholders over the past two
decades. In addition, Stockhammer (2004) asserts that power has been shifted to shareholders and
thus reshaped a manager’s priorities, and also offers the empirical link between accumulation and
financialization which is tested using a time series analysis of aggregate non-housing private
investment for the USA, providing evidence of the negative effect of financialization on
accumulation. Indeed, figure 7 shows that the proportion of manufacturing investment out of
grand total of gross fixed capital formation has been continue to fall from almost 20% to 12%
since 1970.
However, it is not clear whether the slowdown of manufacturing accumulation results
from the transformation of US corporate strategy from an orientation towards corporate growth or
not; it could be reflecting the structural transformation of US economy into more intensive
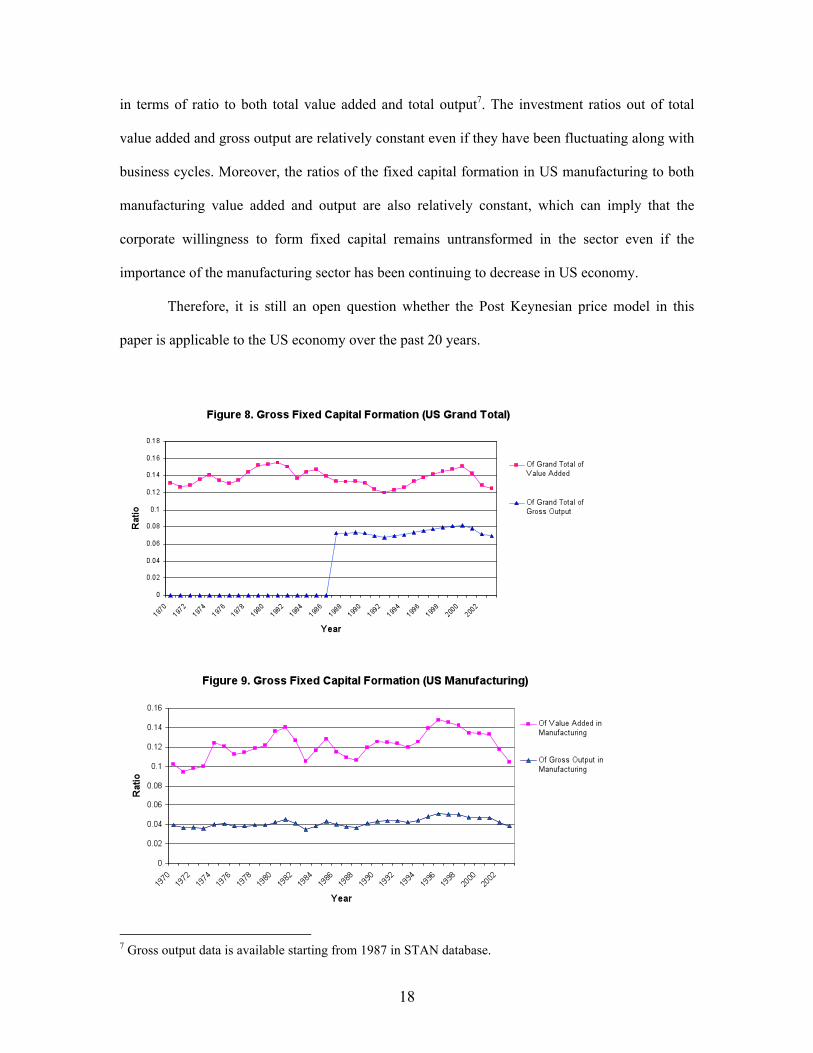
service-based one. Figure 8 indicates the gross fixed capital formation of US economy as a whole
18
in terms of ratio to both total value added and total output7. The investment ratios out of total
value added and gross output are relatively constant even if they have been fluctuating along with
business cycles. Moreover, the ratios of the fixed capital formation in US manufacturing to both
manufacturing value added and output are also relatively constant, which can imply that the
corporate willingness to form fixed capital remains untransformed in the sector even if the
importance of the manufacturing sector has been continuing to decrease in US economy.
Therefore, it is still an open question whether the Post Keynesian price model in this
paper is applicable to the US economy over the past 20 years.
7 Gross output data is available starting from 1987 in STAN database.
19
VII. CONCLUSION
This study investigates the pricing behavior of the U.S. manufacturing industries by using
Johansen’s cointegration method. It demonstrates that industrial prices, investment, money wage
and productivity are cointegrated in the four industries. In other words, they move together in the
long run. The error correction terms shows the short-run dynamics of these four variables. In light
of the market structures, the empirical results of the U.S. manufacturing industries prove to be not
inconsistent with the Post Keynesian price model.
REFERENCES
Atesoglu, H., ”A Post Keynesian Explanation of U.S. Inflation”, Journal of Post Keynesian
Economics, Vol. 19, No. 4, 1997
__________, “Income, Employment, Inflation, and Money in the United States”, Journal of Post
Keynesian Economics, Vol. 22, No. 4, 2000
Bloch and Olive, “Can Simple Rules Explain Pricing Behaviour in Australian Manufacturing”,
Australian Economics Papers, June, 1996
Cin M., “Industrial price determination process in the Turkish private manufacturing industry
between 1980 and 2000: a Keynesian approach”, Journal of Post Keynesian Economics,
Vol. 27, No. 3, 2005
Corbett, J. and T. Jenkinson, “How is Investment Financed? A Study of Germany, Japan, the
United Kingdom and the United States”, Manchester School of Economics and Social
Science, Vol. 65, 1997, p. 69-93
20
Eichner, A., The Megacorp and Oligopoly, Cambridge University Press, 1976
Fazzari, “The Investment-Finance Link, Investment and U.S. Fiscal Policy in the 1990s”,
Public Policy Brief 9, Levy Economics Institute, 1993
Hansen, H. and Juselius, K., CATS in RATS: Co-Integration Analysis of Time Series, Evanston,
1995
Johansen, S., “Statistical Analysis of Co-Integration Vectors”, Journal of Economic Dynamics
and Control, Vol. 12, No.2-3, 1988
________ and Juselius, K., “Maximum Likelihood Estimation with Inference on Co-Integration
with Application to the Demand for Money”, Oxford Bulletin of Economics and Statistics,
Vol. 52, 1990
Lavoie, M., Foundations of Post- Keynesian Economic Analysis, Edward Elgar, 1992
Lazonick and O’Sullivan, “Maximizing shareholder value: a new ideology for corporate
governance”, Economy and Society, Vol. 29, p. 13-35, 2000
Lee and Keen, “The Incoherent Emperor: A Hetetodox Critique of Neoclassical Microeconomic
Theory”, Review of Social Economy, 2004
Minsky, H., “Schumpeter and Finance”, in Market and Institutions in Economic Development
(eds.) Biasco and Roncaglis, 1993
Moss, S., An Economic Theory of Business Strategy, Wiley Blackwell, 1981
Sen, K. and R. Vaidya, “The determination of industrial prices in India: a Post Keynesian
approach”, Journal of Post Keynesian Economics, Vol. 18, No. 1, 1995
Stockhammer, E., “Financialization and the slowdown of accumulation”, Cambridge Journal of
Economics, Vol. 28, p. 719-741, 2004
Wray, L. Randall, “International Aspects of Current Monetary Policy, CFEPS working paper No.
31
21
Table A. Dickey-Fuller Unit Root Tests
22
Table B. Cointegration Rank Test Using Trace
23
Table C. Results for the Other Industries

24
Table D. Error Correction Estimates8
8 From table D, it is clear that the error correction term is significant in most variables for each industry. It implies that those variables adjust in the short run to the disequilibrium. One can interpret the error correction term (CointEq) as a situation where the actual price is greater than the long-run relationship indicates. The situation would happen at a time when firms have market power in the industry that allows them to raise the market price. The firms would try to correct the deviation of actual price from its long-run level in the current period by cutting prices, raising investment or raising money wage. Food products and beverages industry (ISIC15) tends to reduce the next period’s price and increase the next investment. The others are inclined to raise investment or wage bill in the process toward their long-run positions.
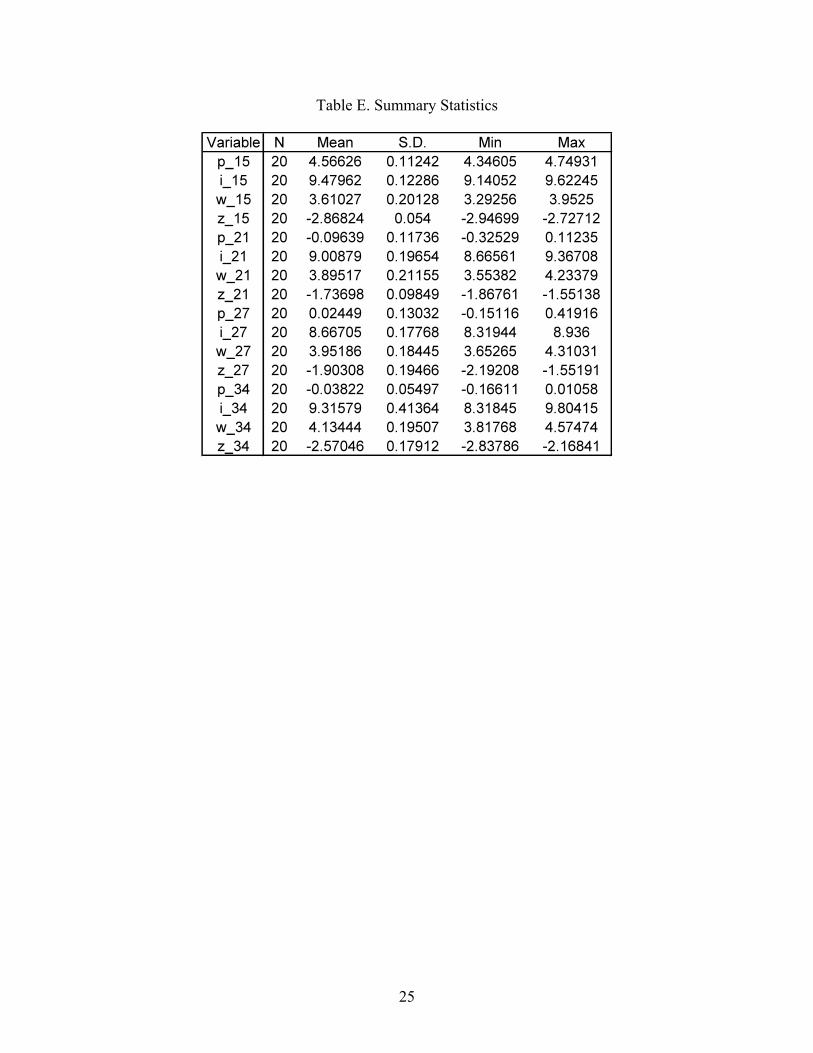
25
Table E. Summary Statistics