Embed Size (px)
Citation preview

1
IFLIP Research Paper 03-9
The Determinants of Transactions Cost And Access to Credit by SMEs and the Poor In Zimbabwe
Louis Masuko, University of Zimbabwe* Desmond Marufu, University of Zimbabwe
May 2003
Copyright. International Labour Organization 2003
ISBN 92-2-113743-0 ISSN 1609-8382

2
The Determinants of Transactions Cost and Access to Credit by Small and Medium Enterprises (SMEs) and the Poor in Zimbabwe
Louis Masuko, University of Zimbabwe*
Desmond Marufu, University of Zimbabwe
May 2003
Abstract Focus is on the determinants of transactions cost and access to credit by SME and the poor in Zimbabwe. Studies have shown that transactions cost constrain the access to credit by SMEs and the poor. This study attempted to answer the question on whether the transactions cost associated with the exchange of credit for a promise to pay later could be minimized to facilitate access to credit by SMEs and the poor. Results from a sample of sixty SMEs have shown that such costs can be minimized if only policy proposals could target the sources of such costs. JEL Classification Number: O12 Keywords: Transactions cost, SMEs, Imperfect information, access to credit, loan size, borrowing experience, group credit guarantee scheme. Corresponding author: Mr. Louis Masuko , P. Box MP 167 MT. Pleasant, Harare. E-mail: [email protected] ___________________________________ * We would like to thank Dr D.M. Gross and Prof. R. Davies, from the University of Zimbabwe, for their comments on the initial and final drafts as well as an anonymous referee; Mr. C. Magaya for logistical assistance and the Zimbabwe IFLIP National Steering Committee for policy guidance. Our thanks also go to Mr. Mabenge, Mr. Tongoona and Mr. Takwada who worked tirelessly behind the scene, and lastly to the Government of The Netherlands without whose financial assistance the study would not have been possible. The usual disclaimers apply.

3
THE DETERMINANTS OF TRANSACTIONS COST AND ACCESS TO CREDIT BY SMALL AND MEDIUM ENTERPRISES (SMEs) AND THE POOR IN ZIMBABWE
Louis Masuko, IDS, University of Zimbabwe Desmond Marufu, University of Zimbabwe
May 2003
Résumé Cette étude se concentre sur les déterminants des coûts de transactions et l'accès au crédit par les PME et les défavorisés au Zimbabwe. De nombreuses études démontrent que les coûts de transactions empêchent les PME et les défavorisés d'accéder au crédit. La question est donc est-ce que les coûts de transactions associés avec l'échange du crédit contre une promesse de paiement à une date future peuvent être minimisés pour faciliter l'accès au crédit des PME et des défavorisés? Les résultats dérivés d'un échantillon de soixante PME montrent que de tels coûts peuvent être minimisés seulement par des politiques ciblées sur la source de tels coûts.
4
Table of Contents
1. Introduction……………………………………………………………………………3
2. Transactions Cost: Theory and Concept…………………………………………….5
2.1 Theoretical Context….………………………………………………………...……5
2.2 Transaction cost....…………………………………………………………………..7
2.3 Sources of Transactions Cost and their Variation…………………………………..8
3. Financial Sector in Zimbabwe before and after Reforms…………………...…….10
3.1 Financial Sector Before Reforms………………………………………………….11
3.2 Post Reform Financial Sector..………...……………………………………...…..12
4. Literature Review……………………………………………………………………13
5. Methodolgical Framework…...……………………………………………………...17
5.1 Research Design…………………………………………………………………17
5.2 Population………………………………………………………………………..18
5.3 Sampling Procedure…………….………………………………………………..18
5.4 Data Collection…………..………………………………………………………19
5.5 Questionnaire Design, Validity and Tools of Analysis………………………….19
5.6 Interviews, Field Visits and Data Entry………………………………………….20
6. Access to Credit and Constraints face by SMEs…………………………………...21
6.1 Year Business Started……………………………………………………….…….21
6.2 Location.……….…………………………………………………………………22
6.3 Labour Force……………………………………………………………………...22
6.4 Nature of Business………………………………………………………………..23
6.5 Source of Capital for SMEs………………………………………………………24
6.6 Sources of Loans and Loan Size…………………………………………………24
6.7 Success Rate…………………………………………………………………...…26
6.8 Distance From Lending Institution……………………………………………….26
6.9 The Costs of Applying for Loans: Contacts before and after Submission.……...27
6.10 Means Used To Contact Lending Institutions by SMEs………………………..29
6.11 Decision Lag……………………………………………………………………30
6.12 Application Requirements..…………………………………………………….31
6.13 The Estimated Borrowing Transactions Cost Function.……………………….33

5
7. Conclusions and Recommendations…………………………………...……………37
7.1 Conclusion.………………………………………………………………………37
7.2 Policy Relevence…………………………………………….…………………..39
7.3 Recommendations………...……………………………………………………..40
References……………………………………………………………………………….42
Appendix…………………………………………………………………………………44
List of Tables
Table 1: Effective Transaction Cost.……………………………………………………..8
Table 2:Year Business Started.………………………………………………………….22
Table 3: Contact Before Submission of Application.………………………………..….27
Table 4: Contact After Submission.……………………………………………………..28
Table 5: Decision Lag….………………………………………………………….…….30
Table 6: Application Fees.………………………………………………………………31
Table 7: Fees for Application Requirements.…………………………………………...32
Table 8: Estimated Borrowing Transaction Cost Function.……………………………..35
Figure 1: Location
Figure 2: Labour Force Size
Figure 3: Nature of Business
Figure 4: Source of Start Up-Capital
Figure 5: Loan Size

6
Executive Summary
The Financial sector in Zimbabwe has gone through two important phases since 1980. From 1980 to 1990, government controls dominated this sector. The post reform period (1991-2000) witnessed the relaxation of controls on lending, deposit and credit. Regardless of these changes Small and Medium Enterprises (SMEs) in Zimbabwe continued to face problems in accessing credit. Costs associated with transactions in credit markets have been identified in a number of studies as the main constraint to SMEs success in accessing credit. This study sought to investigate the relationship between the costs of transacting credit and the ability of borrowers (in this case the SMEs) to meet these costs and recommend means and ways that could minimize the cost to facilitate their access to credit.
To achieve the intended results, the study identified the elements that make up transactions cost in Zimbabwe from both the lenders’ and borrowers’ viewpoint. It is generally accepted that the higher the transactions cost the greater is the extent to which they inhibit access to credit by the SMEs and the poor. To be able to recommend ways of minimizing these costs it was prudent to identify factors that contribute to the variation of transactions cost. Factors that were identified and analysed included borrowing experience, decision lag, loan and firm size and borrowers’ distance from the lending institution.
An analysis of the relationship between these factors and total transactions cost was carried out with a view to identifying specific components of the transaction costs that constrain access and explain how they could be attended to in order to harmonize and facilitate access to credit. Total transactions cost are made up of costs that go into meeting conditional requirements by lenders, costs that go directly into transacting credit and those that are part of the credit search by borrowers.
Transactions cost can therefore be broadly defined as costs involved in exchange of
credit for a promise to pay later. Thus it is intrinsically a risky activity. The risk is related to the level of information possessed by the two contracting parties, the lender and the borrower. This raises issues of information search to establish the credit risk of each borrower and predict the actions of those borrowers, which may not necessarily be what enhances the probability of repayment.
To investigate these issues in the Zimbabwean context, a sample of sixty SMEs was randomly selected from three databases after which a questionnaire was administered. Targeted interviews were carried out with nine lenders. Statistical Package for Social
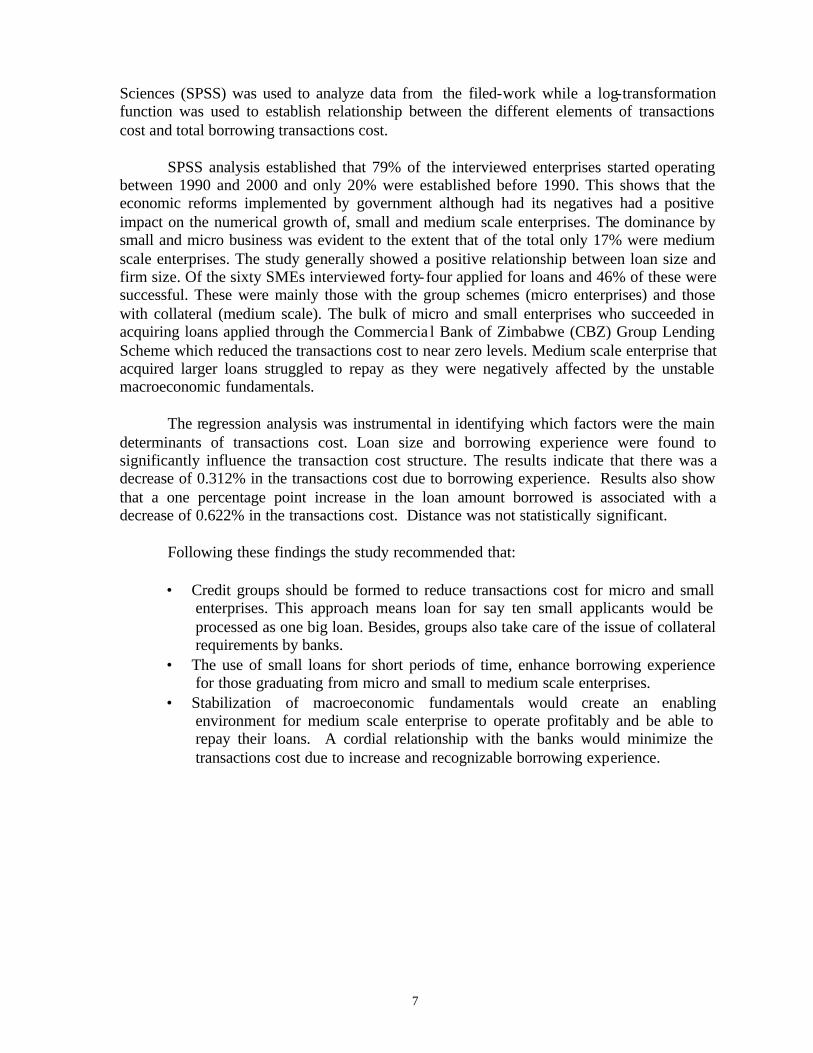
7
Sciences (SPSS) was used to analyze data from the filed-work while a log-transformation function was used to establish relationship between the different elements of transactions cost and total borrowing transactions cost. SPSS analysis established that 79% of the interviewed enterprises started operating between 1990 and 2000 and only 20% were established before 1990. This shows that the economic reforms implemented by government although had its negatives had a positive impact on the numerical growth of, small and medium scale enterprises. The dominance by small and micro business was evident to the extent that of the total only 17% were medium scale enterprises. The study generally showed a positive relationship between loan size and firm size. Of the sixty SMEs interviewed forty-four applied for loans and 46% of these were successful. These were mainly those with the group schemes (micro enterprises) and those with collateral (medium scale). The bulk of micro and small enterprises who succeeded in acquiring loans applied through the Commercia l Bank of Zimbabwe (CBZ) Group Lending Scheme which reduced the transactions cost to near zero levels. Medium scale enterprise that acquired larger loans struggled to repay as they were negatively affected by the unstable macroeconomic fundamentals.
The regression analysis was instrumental in identifying which factors were the main determinants of transactions cost. Loan size and borrowing experience were found to significantly influence the transaction cost structure. The results indicate that there was a decrease of 0.312% in the transactions cost due to borrowing experience. Results also show that a one percentage point increase in the loan amount borrowed is associated with a decrease of 0.622% in the transactions cost. Distance was not statistically significant.
Following these findings the study recommended that:
• Credit groups should be formed to reduce transactions cost for micro and small enterprises. This approach means loan for say ten small applicants would be processed as one big loan. Besides, groups also take care of the issue of collateral requirements by banks.
• The use of small loans for short periods of time, enhance borrowing experience for those graduating from micro and small to medium scale enterprises.
• Stabilization of macroeconomic fundamentals would create an enabling environment for medium scale enterprise to operate profitably and be able to repay their loans. A cordial relationship with the banks would minimize the transactions cost due to increase and recognizable borrowing experience.

8
1. Introduction
Any attempts to increase access to credit by the SMEs 1 and the poor2 in Zimbabwe3
should in the main be guided by how the SMEs, the poor and the policy makers perceive the
constraining factors to be. One such constraining factor is the transactions cost. It has been
the subject of empirical studies for sometime now (see, for example, Saito and Villaneuva,
1981, Liedholm, 1985, and Olomola, 1991). The overwhelming majority of these studies are
viewed as generally accepting the hypothesis that the higher the transaction costs, the greater
is the extent to which they inhibit the access to credit by the SMEs and the poor. Acceptance
of this hypothesis has generally led to the promotion of the micro finance schemes. In this
article, the argument is that relationships of trust between banks and SMEs should be
developed to encourage a sustainable flow of credit to the latter. The capacity of micro
finance institutions, like the institutions set-up in the 1980s by government is susceptible to
the problem of undercapitalisation.
The common theme that runs through the majority of the studies done on transactions
cost and those from the new institutionalist economics is that costs associated with
transactions in the credit market lead to market imperfections or the absence of trade (see for
example Stiglitz, 1981, Herath, 1994, and Roman, 1994). While resources would still flow to
their highest valued uses, the later typically are different from and lower-valued than if
transactions cost had been zero. To the SMEs and the poor the transactions cost may actually
1 Survey from McPherson (1998) showed that there were 860,000 manufacturing, commercial and service SMEs in Zimbabwe employing about 1,6 million people. 2 The poor in business. 3 Member of SADC and COMESA. Has a population of 13 million. Experienced a GDP growth rate of 4.2%, inflation and interest of 55.7% and 60% respectively in the year 2000.

9
exceed the benefits of exchange. Nonetheless, transactions costs remain a fact of life that
must be taken into account in credit markets to minimize the effects of adverse selection and
moral hazard. One question associated with this role of the credit market is whether
transactions cost associated with the exchange of credit for a promise to pay later, could be
minimized to facilitate the access to credit by SMEs and the poor. Serve for empirical studies
done in Asia, there has been no attempts at assessing empirically the role of transactions cost
on access to credit by SMEs and the poor in Zimbabwe.
This study attempted to provide an answer to the question raised above using the Log
Transformation method. The model is estimated using data collected from a sample of 60
SMEs and the poor. The aim is to provide information on the magnitude of the transactions
cost and the (in) ability of the borrowers to meet them. This calls for the identification of the
component of the transactions cost associated with borrowing from banking institutions
(both on the borrowers’ and lenders’ side) in particular those that go directly into transacting
credit. Total borrowing transactions cost were calculated and measured from these
components. Factors that determine the variations of transactions cost were then regressed
against total transactions cost of borrowing to establish the influence of each of these
explanatory variables on the total transactions cost. Such an approach would most likely
provide information useful for policy recommendations to be made, particularly those related
to which costs could be minimized. The general characteristics of the sampled SMEs and the
poor and those aspects that characterized their relationships with the lenders and the
regression analysis were analysed using the Statistical Package for Social Sciences (SPSS).
10
The organisation of the report is as follows. Section 2 discusses the theory and
concept of transactions cost. The third section briefly looks at the financial sector before and
after reforms in Zimbabwe and the implications of both on access to credit by the SMEs and
the poor. Section 4 reviews literature on transactions cost. The fifth section is the
methodology section. Analysis and interpretation of results are in Section 6. Conclusion and
recommendations are discussed in Section 7.
2. Transactions Cost: Theory and Concept
The theoretical framework within which the current study is situated is discussed in
this section. The weakness in the way that neo-classical economics deals with the credit
market is exposed. A concise definition of transactions cost is provided together with a
discussion on the sources of transactions cost and their variation.
2.1. Theoretical Context
Two central views regarding credit markets have dominated academic and policy
space between 1950 and the 1990. The first recommended cheap credit as a relevant form of
market intervention (Herath, 1994). The argument was that interest rates should be kept low
in order to speed up the accumulation of capital. The other view primarily from the financial
repression school of thought (see McKinnon, 1973) was that credit markets work like
classical competitive markets and observed that high interest rates are a reflection of the risks
of default. The policy recommendation was basically to discourage any intervention in credit
markets. Both policy recommendations were implemented with some consistency in
Zimbabwe in the 1980's and in the 1990s respectively. The results confirmed the finding by

11
Rittenberg (1991) and Roe (1982) that high interest rates creates excess supply of funds and
the effect of this on investment is as that of low interest rates. This goes to further confirm
that if credit market reforms merely amounts to getting prices right (interest rates) without
institutional change, they would not yield the expected benefits.
New Institutional Economists (Nabli and Nugent, 1989, North, 1992, Lin and
Nugent, 1995), in an attempt to overcome the limitations of mainstream neo-classical
economics, that take institutions as given, put forward an argument that account for
institutions characteristic of credit markets. Hoff and Stiglitz (1990) argue that with
imperfect information, interest rates have sorting and incentive effects. For example high
interest rates adversely sort good credit risks from bad credit risks. Alternatively high interest
rates may induce borrowers to invest in riskier projects and not exercise due diligence in
reducing risks. It should also be highlighted that the supply of loanable funds is an increasing
function of expected profits. Thus, unlike in the classical economic analysis where excess
demand at a given interest rate is choked off by a rise of interest rates, the adverse selection
and moral hazard literature proposes that there is no tendency for interest rate to rise in order
to choke off excess demand, as credit may be rationed through non price mechanisms.
The above discussion shows the limitations imposed on credit operations in
administratively determined interest rates and full credit liberalization regimes. This
underscores the importance of two basic problems that neo-classical economics overlook,
that of transactions cost and imperfect information. These together with the theory of
collective action constitute the main themes of New Institutionalist Economics (NIE).
Transactions cost and imperfect information are discussed below.

12
2.2. Transaction cost
Transactions cost broadly refers to the cost involved in exchange. These are costs that
prevent market from operating efficiently or factors that prevent markets from forming
altogether. Transactions cost occur both on the lenders' side as well as on the borrowers' side.
On the lender's side, transactions cost involve costs of information gathering, loan
administration, enforcement, etc. Where loanable funds are in limited supply the use of non-
price factors such as collateral, quotas, compensating deposit balance, bureaucratic
procedures, long delays in disbursement are employed to eliminate excessive credit demand.
These factors need to be considered in determining the effective transactions cost of
procuring credit.
Borrowers also incur transactions cost. Borrower transactions cost mainly involve
various charges imposed by lenders beyond interest payments such as application fees,
services fees, photographs, etc. The most important transactions cost is borrower's travel
time and time spent in obtaining the loan. Lost time from work is an important part of the
transactions cost for most borrowers. The addition of costs such as the cost of transportation
and inconveniences indicates that the efficient opportunity sets of borrowers would vary not
only with the size of their portfolios, but also with the physical location and the opportunity
cost of their time.

13
Table 1: Effective Transactions Cost
EFFECTIVE TRANSACTIONS COST Conditions - Collateral
- Compensating Depository Balance - Financial Accounts - Business Proposals/Plans - Company Registration
Borrower's Cost
Search Costs - Information Gathering - Screening Fees
Lender's Cost
Transacting Costs - Service Fees - Travel/ Contact Time - Photos - Time Spent Obtaining Loan
Borrower's Cost
Table 1 splits both the lenders and the borrowers cost into those that go towards meeting
conditional requirement, costs that go directly into transacting credit and those that are part
of the credit search. In the current study costs that go directly into transacting credit and
search costs were considered and measured. These include services fees, travel and
telephones fees, photos, and time spent on obtaining the loan and administrative fees. These
were calculated for each firm, which was sampled.
2.3. Sources of Transactions Cost and their Variation
Credit markets involve an exchange of credit for a promise of repayment later. Thus
it is intrinsically a risky activity. The risk is related to the level of information possessed by
the two contracting parties. In general there is imperfect information in credit markets. There
is information asymmetry between the borrowers and lenders where the borrower possess
more information than the lender. A borrower may plan to default a loan but the lender may
not know this. Imperfect information of the credit risks of different individuals (adverse
selection) and the actions of those borrowers which may not necessarily be what enhances
the probability of repayment (moral hazard) makes the market Pareto inefficient. Thus

14
formal lenders have to contend with the critical information constraints. Information
problems can be considered as one major source of transaction cost.
The general hypothesis is that institutions are transactions cost minimizing
arrangements, which may change and evolve with changes in the nature and sources of
transactions cost and the means for minimizing them. This presents a challenge to the current
formal credit market logic that institutional credit is better seen as a means of facilitating the
expansion of firms that have passed the survival stage and have acquired at least the
beginnings of a good track record.
Variations of transactions cost at the firm level are determined by a number of factors
such as borrowing experience, decision lag, size of firm or loan and borrowers distance from
the bank. Borrowing firms come in different sizes, have varying borrowing experiences, and
are located in different areas relative to the banks. If lenders are satisfied with the
characteristics that each possess and have reason to believe that such borrowers are credit
worthy, the negotiation, processing and delivery of loan progresses smoothly and quickly.
On the other hand non-preferred clients could be made to face numerous hurdles, which
affect the borrowing transactions cost. This becomes imperative therefore to examine the
factors that determine the transactions cost and hypothesize their relationship with a view to
identifying specific components of the transactions cost that are a constraint and how they
could be changed.
Four factors are hypothesized to have impact on transactions cost and these are
regressed against the total borrowing transactions cost. The first is borrowing experience.

15
Borrowing experience is considered to be a possible determinant of transactions cost. It is
assumed that experienced borrowers are likely to face less hurdles in negotiating and
acquiring the loan. Good repayment record would put the borrower on the preference list of
lenders and thus no undue transactions cost are imposed. The hypothesis is that transactions
cost is inversely related to experience.
The second is decision lag. Decision lag is apt to have effect on borrowing
transactions cost in view of the fact that borrowers may be compelled to pay several visits to
the loan office when the deals associated with loan negotiation and acquisition appear to be
unbearable. Thus, it is expected that loan decision lag varies directly with the borrowing
transactions cost. Firm size is the third factor considered in this study. This is also related to
loan size. The assumption being used is that small firms do generally apply for small loans.
Firm or loan size may affect transactions cost directly or inversely depending on the system
of loan administration. The borrower's distance from the loan office, which is the fourth
factor that is looked into, is expected to vary directly with the transactions cost.
3. Financial Sector in Zimbabwe before and after Reforms
Section 3 gives a short background to the financial sector in Zimbabwe. It is divided
into two subsections. The first looks at the financial sector before the 1991 economic reforms
and the period 1991 and beyond is reviewed in the second subsection.
16
3.1. Financial Sector before Reforms
Financial sector liberalization was one of the main components of the Economic
Structural Adjustment Programme (ESAP)4, which was introduced in 1991. Prior to these
reforms, state controls dominated this sector. Government fixed interest rate. Lending rates
to be charged by banks and deposit rates to savers were all controlled. Credit ceilings were
used to channel resources to specified sectors and there were restrictions as to who could
carry out banking business. The sector was segmented according to type of banking business
they were involved in. For example, commercial banks would only provide short-term
finance for working capital, merchant banks for wholesale banking and building societies
could only engage in mortgage finance. Due to ceilings on lending rates and administrative
controls on other interest rates, interest rates remained more or less at the same level since
1965. Marginal changes were introduced in 1980 as authorities sought a more active role for
monetary policy. Real interest rates remained negative for most of the categories of savings
deposit in spite of these changes.
Special financial institutions were created for the purposes of directing credit to
specified sectors. Such allocative controls sought to direct financial resources towards
projects and sectors, which financial institutions shield away from either because of risks
involved or long gestation periods. The Reserve Bank (RBZ) mobilized specialized funds
through the issue of Certificates of Deposits (CDs) for on- lending to development
institutions such as the Zimbabwe Development Bank (ZDB), Small Enterprise Development
Corporation (SEDCO), and the Credit Guarantee Company (CGC) for small to medium-scale
4 See, The Government of Zimbabwe (1991).

17
enterprises for approved projects. However regardless of these efforts the rural and urban
poor and low-income groups, the informal sector and small-medium scale enterprises did not
benefit significantly. Reason for this has been the lack of complimentary from banks. The
established banks do not simply lend to risky groups who do not have collateral.
3.2. Post Reform Financial Sector
With the advent of ESAP, lending and deposit rates, and credit controls were
significantly reduced. Barriers to entry into the money and financial sectors were also
removed. The Reserve Bank Act was revised to eliminate segmentation and to increase
competition. Restrictions on the use of surplus funds and the interest cap on them, was done
away with, freeing such funds for investment in the market at the ruling market rates.
The success of these and other reforms in the financial sector can be observed in the
improvements to the mobilization of savings. This sector is one of the very few which
experienced growth5 under ESAP, Zimbabwe Programme for Economic and Social
Transformation (ZIMPREST) and Millennium Economic Recovery Programme (MERP).
There were many new entrants in the sector. Competition as a result of new entrants also
contributed to the improvement of the range of products or services provided to clients.
Lending by the financial sector increased from 1991. However surveys indicate that rural and
disadvantaged urban communities did not benefit from these reforms. High interest rates that
characterized credit from banks and other finance houses spilled over into the informal
sector, with money lenders charging even higher interest rates than banks (Moyo, 2001).
5 Before reforms (pre 1990) there were 20 banking institutions compared to 36 in the year 2001.

18
The SME enterprises and the poor in Zimbabwe did not benefit from the controlled
interest rates of the 1980's neither have they benefited from the liberalization of the financial
sector (Moyo, 2001). The main reason in the 1980's is cited as that of little resources on the
part of government and the non-complimentary support by the private banking sector. High
interest rates are generally cited for the 1990s. Collateral, which is generally linked to the
property rights (Klitgaard, 1991), cuts across the two phases. Most SMEs do not have the
assets on which to exercise the above right and use as collateral.
4. Literature Review
Bank credit or non-Bank credit is central to the success or failure of business ventures
as they provide a source of working capital and/or of start-up capital. To date there are
indications that the use of credit by SMEs and the poor is highly constrained. Studies
elsewhere have shown that the transactions cost of borrowing, constitute a serious
impediment to the acquisition of credit (FASID, 1998). These costs tend to be high for small
borrowers than larger borrowers. Saito and Villanueva (1981) estimated that in the
Philippines lenders transactions cost of loans to small firms justify lending rates 5-7% higher
than to large borrowers. Gonzalez-Vega (1976) also found the transactions cost of lending to
small borrowers to be higher than that of larger borrowers. Liedholm (1985) provides a
succinct summary of costs of lending in a number of developing countries, which confirms
high transactions cost for small borrowers. Transactions cost of borrowing both from the
formal and informal sources is positively related to the size of the loan. However when
measured as a percentage of the loan amount, the borrowing transactions cost is expected to
be inversely related to the loan amount. This has been examined for a number of developing

19
countries. In Bangladesh, for a small loan of about Taka 150 the transactions cost are about
30% of the loan. Another study by the Bank of Ceylon (Herath, 1994), in two areas of Sri
Lanka shows that effective interest rates (transactions cost and official interest rates of 9%)
for loans of less than Rs7000 are around 22% in the Southern region and 28% in the
Northern Region.
Lenders who face high transactions cost often engage in implicit price setting to
ration unwanted borrowers. Such non-price factors may include collateral, quotas,
compensating deposit balance, bureaucratic procedures, and long delays in disbursement etc.
Under subsided lending rates, high transactions cost discourage lending. In a liberalized
interest rates regime it is not uncommon to observe a sizeable gap between supply and
demand for enterprise finance, mainly in developing countries like Zimbabwe. The gap owes
its origin to problems of imperfect and costly information, high-perceived risk and
transactions cost and enforcement problem associated with SME lending (FASID, 1998). As
far as the banks are concerned, this condition may well be consistent with prudent lending
operations.
On the borrowers' side the most important transaction cost is borrowers travel time
and time spend in obtaining the loan. These often constitute an important part of the
transactions cost for most poor borrowers. Herath (1994) observed that high transactions cost
of borrowing emanating from these two sources discourage small farmers, artisans,
entrepreneurs from availing themselves of formal credit. Here the market fails from the
demand side.

20
The constrained access or the gap between demand and supply of credit by SMEs,
characteristic of the financing pattern common in Africa, has been confirmed by a number of
studies of Zimbabwe's SMEs. The studies found out that the majority of SMEs used owners'
savings as the primary source of start-up capital (McPherson, 1998, Tevera, 1998 and
Matshalaga, 1998). FASID (1998) publication noted that as many as 71% of the entire
Zimbabwean REPO sample used owner's savings as the primary source of start-up capital.
The use of owners' savings was much more prevalent in smaller operations. Micro-firms
drew 87% of start-up capital from own savings and 13% from relatives and friends. Once in
operation, retained earnings were cited by 63% of the respondents across different size
categories as the main source of funding, while bank loans, personal savings, various other
sources of funding were cited by 12%, 4% and 21% of these respondents as main sources of
finance for investment respectively. For micro enterprises, however, personal savings of
owners remained important, second only to retained earnings.
Suppliers' credit was the most important source of external funds, accounting for
about 30% of outstanding balances for all firm categories. Small and medium sized firms
were, however, more likely to benefit from such credit than micro-enterprises. Next in order
of importance were loans from Non Bank Financial Institutions (NBFI), such as finance
houses, building societies, pension funds and government credit programs, which accounted
for 28% of total credit inflows. These loans benefited mostly larger firms, only a few
medium-small firms and none of micro-enterprises. The third important source of funds was
bank overdrafts (which were normally rolled-over in effect to become longer-term credit)
and bank loans, which provided 23% and 14% respectively of total credit (FASID, 1998).

21
Again micro-enterprises had less access to these facilities. 20% of micro-enterprises
reported ever having received a bank loan, as opposed to 75% of larger firms. Borrowing
from informal sources was generally not found to be important, except for a few smaller size
firms (FASID, 1998).
Borrowing experience is one other source of variation of transactions cost. This is
one of the reasons why collateral is such a major requirement on the part of the lenders and a
constraint to the borrowers. Olomola (1999) contents that an experienced borrower with a
good repayment performance is likely to face minimal transactions cost from the lenders. A
good track record helps to eliminate critical informational bottleneck. Johnson and Rogaly
(1997) demonstrated this point by looking at the informal lenders. They found out that
informal lenders (as well as banks and other non-bank institutions) that have Group Lending
Schemes did not face problems associated with adverse selection and moral hazard. Most
informal lenders operate in geographically limited areas and information is a by-product of
such living. Further, inter- linking with input as well as product markets serves an
information augmenting function, which facilitates lending. This has reduced the default
rates in informal loans (Roman, 1994, FASID, 1998, Olomola, 1999) and improved access
by the poor.
Decision lag has not received enough attention in many of the studies reviewed in
this section. But its importance can be traced to travel time and time spend following up on
the loan. The two variables were identified earlier on as influencing the transactions cost of
the borrowers. Olomola (1999) using a transactions cost model found out that loan decision
lag was a significant determinant of transaction cost.

22
In Zimbabwe very little has been done on this subject in terms of any empirical
research. The size and structure of the transactions cost incurred by borrowers are largely
unknown, regardless of whether the source is bank or non-bank. As a rule articulating
transaction cost cutting measures to enhance access of SMEs and the poor to production
credit becomes difficult. The following section discusses how the research into these issues
was carried out before the results of the research are discussed in the following section.
5. Methodological Framework
Section 5 shows how the research was designed, sampling procedures, data collection
and the relevant instruments used and the tools of analysis employed. Besides information on
the characteristics of the lenders and borrowers, information on the components of
transactions cost as defined in Section 2 was collected. Data that assisted in calculating
distance, loan size, experiences of borrowers and the time it took lenders to make their final
decision on loan applications was also gathered.
5.1. Research Design
In the process of research design, the following factors were considered.
• The target population of borrowers considered for interviews included all SMEs that are already in business.
• All SMEs that have in their time of existence applied for funding regardless of whether they succeeded or not.
• Due to the financial and time constraint considerations, the target population must be easy to reach.

23
5.2. Population
The target population considered for the survey was identified and divided into two
categories in line with the confines of the survey. These two categories are namely, the
borrowers and the lenders. In this survey borrowers were taken to be the SMEs and these
were classified into micro (1-10 employees), small (11-20 employees) and medium scale
(over 20 employees) enterprises.
5.3. Sampling Procedure
Two broad groups of lenders namely the commercial banks and the non bank lending
institutions were identified to be the main sources of finance available to small and medium
enterprises (SMEs). In order to come up with an independent sample of borrowers from
these two main categories, a list of beneficiaries (SMEs) was obtained from EMPRETEC,
Commercial Bank Zimbabwe and Collective Self-Finance Scheme. Using the random
selection technique, a sample of sixty different borrowers was derived from these lists.
In coming up with the required population sample of sixty, thirty respondents were
interviewed in Harare, nine from Chitungwiza, six from Norton and fifteen from Non Bank
Institutions. Harare is the administrative and commercial capital of Zimbabwe. Chitungwiza
is the third largest city situated about 28 kilometres south east of Harare. Norton is a small
farming town 49 kilometres west of Harare along the Harare-Bulawayo route. Four
commercial and merchant banks as well as the non-bank institutions were interviewed.

24
5.4. Data Collection
Primary data was collected by means of questionnaires, which were administered
during face-to-face interviews. A set of questions was also formulated and used to gather
information from the lenders on the actual nature of transactions cost. The purpose of these
questions was to get information from key informants on the exact allocations of transactions
cost charged by the lenders in their dealings with borrowers. A contact summary form was
used to capture any other relevant data that could not be extracted through the questionnaire.
Secondary data was derived from various documents and publications provided by the
Institute of Development Studies, World Bank, Zimbabwe Congress of Trade Union
(ZCTU), United Nations Development Programme (UNDP) libraries.
5.5. Questionnaire Design, Validity and Tools of Analysis
A questionnaire consisting of twenty-seven questions was designed for the purpose of
extracting primary data from borrowers. Similarly, questions were formulated to act as
guidelines during the process of extracting information from lending institutions. A number
of factors were considered in quaranteeing the validity of the questionnaire. Such measures
taken were:
• There was a brief explanation of both the purpose of the study and the content of the questionnaire by the interviewer prior to the administering of the questionnaire.
• Questions asked in the questionnaire were directly derived from the objectives of the study. Each question was essential for fulfilling a specific objective.
• Key questions, especially of transactions cost, were provided with more than one question. These multiple questions complemented each other in revealing the maximum possible information about the magnitude of transactions cost.
• Questions were straightforward and easy to comprehend to cater for the different intellectual capacities of the various respondents.
• A test run of the questionnaire was carried out in Harare before the actual survey was carried out.

25
The questionnaire was designed in such a way that the responses on the characteristics and
nature of borrowers as well as background information on the total transactions cost could
then be analyzed using the Statistical Package for Social Sciences (SPSS). The Log-
Transformation method was used to further explain the relationships between total
borrowing transactions cost and the four variables namely firm/loan size, distance traveled,
borrowing experience, and decision lag. The regression analysis was performed in SPSS.
There was also information that constituted transactions cost such as bus fares and
telephone charges that could not be captured by the questionnaire. This information was
obtained from sources such as old directories and transport organizations.
5.6. Interviews, Field Visits and Data Entry
Appointments for interviews commenced on May 14th, 2001. These were made by
telephone three to four days prior to the day of the intended interviews to accommodate
cancellations and other unforeseeable circumstances. Field visits commenced on Monday 20
May 2001. A total of sixty interviews were conducted in Harare (45), Chitungwiza (6) and
Norton (9). Two visits each were made to Norton and Chitungwiza. After the initial field
visits a follow-up visit was done to each of the two towns. These were made for the purpose
of obtaining additional information and to verify some information obtained during the first
visits. Two visits were also made to lending institutions. The purpose of these visits was to
obtain information on the magnitude of transactions cost faced by lending institutions and
also to verify the nature of costs given by the borrowers in their responses in the
questionnaires. The third visit was organized to discuss the findings and clarify some gray
areas that emerged from the analysis of data.

26
Data was entered into the computer as it came from the field using the Statistical
Package for Social Science. Twenty two of the sixty randomly selected respondents were
dropped because they did not incur borrowing transactions cost, i.e. they have zero
borrowing transactions cost. As a result the loan to the total borrowing transactions cost
ratio is invalid.
6. Access to Credit and Constraints Faced by SMEs
This section is divided into two parts. The first part gives a detailed analysis of the
characteristics of the interviewees and the nature of relations between lenders and borrowers.
In order to obtain a systematic and detailed analysis of the responses given by borrowers in
the questionnaires the SPSS package was used. The second part of the study presents an
analysis of the relationship between transactions cost and each of the following variables: (i)
Firm/loan size, (ii) Distance, (iii) Borrowing Experience and, (iv) Decision Lag. Most of the
data used for this part came from the descriptive statistics analysis. The Ordinary Least
Squire technique was used to estimate the coefficients.
6.1. Year Business Started
Seventy nine per cent of SMEs interviewed started operating between 1990 and 2000.
The majority of the SMEs falling under this category did in fact start operating after 1995.
As such 20% and 1% of the firms interviewed began operating before 1990 and after 2000
respectively. It was prominently observed that most businesses started around the years
1994 and 1995. A number of reasons were noted for this. This period coincided with the
height of economic reform program, which was characterized by a lot of retrenchments.

27
This resulted in many people resorting to starting their own businesses. This period was also
the height of the indeginization advocacy, which made people more aware of the need for
self-employment through the opening up of their own businesses as a remedy to the
prevailing economic hardships. A summary of the above analysis is shown in Table 2 below.
Table 2: Year Business Started
Year Business Started Percentage Before 1990 20 Between 1990 And 2000 79 After 2000 1
6.2. Location
The enterprises interviewed are located in 3 different localities as shown in Figure 1.
[See Figure 1, end of document]
The majority of micro enterprises interviewed are located in areas designated by local
authorities as home industrial areas whilst the majority of medium scale enterprises are
located in the traditional industrial areas and the city centre. Micro enterprises are located in
home industries because of a number of reasons. The rents are cheaper and affordable in the
home industrial areas and they are nearer to their customers. On the contrary, the medium
scale enterprises are located in the more established industrial areas and the city centre. This
is mainly because they have reached a stage where they can afford the higher rents as well as
to cater for their need for more space.
6.3. Labour Force
60% of the enterprises interviewed employ between 1 and 10 people. These
constitute the micro enterprises operating in the home industry areas at a micro level, 23%

28
employ between 11 and 20 people and this population is dominated by the small enterprises.
About 70% of the SMEs interviewed employ over 20 people and this group falls within the
medium scale enterprises. A summary of this analysis is provided in Figure 2.
[See Figure 2, end of document]
Recorded interviews (Interviews by the Research Team, 2001) revealed that the number of
people employed has tended to decline from an average of 15-20 employees in the early
1990s to about 5-10 as the years approached 2000. Due to the economic hardships most
enterprises interviewed acknowledged that they had to retrench because they could no longer
afford to maintain high wage bills. This trend affected even the large companies like Delta
and Barclays Bank.
6.4. Nature of Business
Four main sectors were identified prior to the administering of questionnaires. These
are namely manufacturing, transport, service and construction. The majority of respondents
fall under the manufacturing and services sector constituting 90% of the sample, whilst the
remaining 10% was taken up by the construction and transport sectors. None of the
respondents is in the mining sector. This could be attributed to the data bases used for
sampling. As shown in Figure 3, 90% of the companies in the manufacturing sector market
100% of their products whilst the remaining 10% market only up to 50% of their total
output. The remaining 50% of their output could be allocated to their own subsistence.
[See Figure 3, end of document]

29
6.5. Source of Capital for SMEs
The SMEs interviewed used a variety of financial products to either start or expand
their businesses ranging from loans to personal savings. The different responses are analysed
in Figure 4.
[See Figure 4, end of document]
It was established from the survey that 70% of the micro and small enterprises did not use
loans to start their businesses but used other resources such as personal savings and
retrenchment packages. The following are the reasons that they gave.
• They were discouraged from borrowing from commercial banks because of the high interest rates.
• Some enterprises actually applied for loans but they failed to meet the banks’ inflexible and harsh conditions set by the banks, especially the requirements for collateral.
• They did not have enough information.
Medium enterprises interviewed used an assortment of loans, overdrafts and personal
savings to start and/or expand their operations. They faced the same problems in acquiring
loans as their micro and small-scale counterparts. The medium enterprises also constituted
the population, which used overdrafts as a form of finance (especially for expansion). They
mainly did so on the virtue that they already held accounts with their respective banks and
simply had their accounts debited by the amount of the overdraft.
6.6. Sources of Loans and Loan Size
60% of all the enterprises that applied for loans did so through commercial banks
whilst the remaining 40% applied through non-bank institutions. Of the enterprises that
actually succeeded in getting the loans, 60% received them in the form of cash and the

30
remaining in kind. 78% of those who applied for loans did so as individuals and 22%
applied as groups. Loans applied for varied from as little as $10,000 to as much as over
$1million. This is summarized in Figure 5 (see appendix). The survey catered for all SMEs
who applied for loans regardless of whether the applications were successful or not.
[See Figure 5, end of document]
69% of all micro enterprises applied for loans ranging between $1,000 and $100,000. It was
revealed that these amounts were proportionate to their requirements as micro enterprises.
The amount applied for although mostly within the $1,000-$100,000 range, tended to
increase as the year 2000 approached. However 31% applied for loans that would qualify
them as medium scale enterprises. Small enterprises applied for amounts ranging between
$101,000 and up to as much as $500,000. As observed for the micro enterprises, this range
was however defied in some cases, with small enterprises applying for loans well above one
million dollars. This was mainly because of their capital- intensive projects.
The majority of Medium Enterprises applied for loans starting from $500,000 to over
$1,000,000. Only two out of the eleven medium scale enterprises applied for loans below
the five hundred dollars thresh-hold. Generally, the medium scale enterprises applied for
larger amounts compared to those applied for by micro and small enterprises because of their
larger operations and their perceived abilities to service the loans. Like those of the micro
and small enterprises, the amounts applied for by medium scale enterprises tended to
increase with time as the year 2000 approached. The increase in the loan amounts required
by SMEs regardless of their sizes can be attributed to two factors namely inflation and
growth in size.

31
6.7. Success Rate
Forty four applicants responded to the question that sought to know if they received
the loan they had applied for. 40% of applicants were successful whilst the remaining 54%
were turned down. Of those who were successful, 75% were micro enterprises, 15% were
small enterprises, and 10% were medium scale enterprises. The majority of micro and small-
scale enterprises that got loans were those who applied as groups through the CBZ’s
Community Banking Group Guarantee Scheme. Applicants gave a number of reasons for
failing to acquire loans. Amongst these, prominent were:
• Lack of security/collateral • Viability problems and uncertainty in the respective sector • Poorly done proposals • Lack of capacity to service loan due to high interests
58% of the people who received loans did not have problems repaying the loans. High
interest rates and viability problems were the major factors that made it difficult for 42% of
the respondents in repaying their loans. These were mainly those who applied for loans
above $500,000.
6.8. Distance from Lending Institution
Most respondents did not travel more than 20 kilometres between their places of
operation and the lending institutions. This might have been due to the decentralization of
most lending institutions resulting in a number of them having a network of branches
nationwide. Only 5% of all respondents traveled for more than 51 kilometers. These
borrowed money during the late 1980s during which period most banks and other lending
institutions had not yet decentralized.

32
6.9. The Costs of Applying for Loans: Contacts before and after Submission
Before the submission of loan applications, SMEs interviewed visited the lending
institutions mainly for the purposes of inquiring and gathering information on the
requirements and procedures involved in the loan applications. As shown by Table 3 37.8%
of the applicants visited lending institutions at least twice compared to 7.1% who did so the
second time they applied.
Table 3: Contact Before Submission of Application
1st Time 2nd Time Frequency of Contact Percentage Figures Percentage Figures
Once 18.9% 12 7.1% 5 Twice 18.9% 12 0% 0 Three times 27% 16 42.9% 25 Four times 5.4% 4 7.1% 5 Five times or more 27% 16 42.9% 25 TOTAL 100% 60 100% 60
The analysis shows that the majority of applicants visited the lending institutions three or
more times regardless of being first or second time applicants. Further interviews revealed
that this was because the majority of the applicants applied to different institutions the
second time they applied, hence they still needed to go through the rigorous exercise of
inquiries and information search.
After the submission of their applications, the borrowers still needed to visit their
respective lending institutions mainly for the purposes of following up on their applications
as well as furnishing the lending institutions with additional information. The analysis
shown in Table 4 shows that 47.2% of applicants visited the lending institutions at least
twice the first time they applied compared to 30.7% for second time applicants.

33
Table 4: Contact after Submission
1st Time 2nd Time Frequency of Contact Percentage Figures Percentage Figures
Once 27.8% 17 0.6% 3 Twice 19.4% 12 30.1% 18 Three times 13.9% 8 23.1% 14 Four times 13.9% 8 15.4% 9 Five times or more 25% 15 30.8% 16 TOTAL 100% 60 100% 60
There were more second time applicants who visited lending institutions three or more times.
This confirms the fact that applicants who did not have successful first time applications
went on to apply to different institutions. For that reason they were still considered to be first
time applicants.
For example, one respondent in Chitungwiza applied for a loan through Barclays
Bank in 1994. Before submitting his application, the applicant visited the bank four times,
mainly for making inquiries and information gathering. After submitting the applications he
visited the bank a further five times to make follow-ups on the application. After six months
of waiting, the application was turned down and the applicant had to find alternative means
of funding his business. In 1997 the same respondent had to apply for a loan due to an urgent
need for capital to meet an order. This time he made the application through the Commercial
Bank of Zimbabwe. He again had to go through the same process of visiting the bank a
number of times before and after submitting his application. His application was approved
after one and a half months. The aspect of borrowing experience, which could have reduced
the number of visits to the lending institutions when he applied for the second time did not
apply since on both occasions he was considered to be a first time applicant.

34
Second time applicants established a number of other reasons for the high frequency
of visits. These are as summarized below:
• It was revealed from the information gathered from a number of lending institutions interviewed that if the period between two applications exceeded a year, then the applicant would be treated as a first time applicant.
• There was an increase in the demand for loans as the years approached 2000, which made it difficult even for second time borrowers to have their applications “fast tracked”.
• The prevailing economic hardships and high interest rates affected the viability of the majority of businesses in the late 1990s. It made it difficult for many firms that had borrowed from lending institutions to service their loans. This impacted negatively on their credit ratings, making it difficult for them the second time they attempted to access loans.
• In some cases bank managers changed branches. This means that in most cases borrowers had to deal with different managers when they applied for loans for the second time.
• There were also cases in which staff at the banks simply ignored some applications, only to follow up on them when the applicants called.
6.10. Means Used to Contact Lending Institutions by SMEs
Before and after submitting loan applications, applicants contacted the lending
institutions by visiting in person, by telephone or by both visiting in person and telephone.
47% of the applicants visited lending institutions as the only means of contact whilst 3%
used the phone. The rest (50%) used a combination of both means.
The majority of those who contacted the lending institutions by visiting in person
were the micro and small enterprises. According to them, this was mostly because:
• They had not yet fully established their businesses hence did not yet have phones.
• Because of decentralization, most banks are located near the borrowers hence they found it easier and more effective to visit the banks in person.

35
However, those who borrowed from the CBZ’s Community Banking Group Guarantee
Scheme did not have to visit the bank. As part of promoting their Community Banking
initiative the bank actually visited micro and small enterprises in the home industrial areas
and surrounding residential areas.
A combination of personal visits and telephone calls were used by most medium
scale enterprises to contact lending institutions. During the time the applicants visited the
lending institutions, significant amounts of time and money (opportunity cost) were lost.
Some applicants revealed that they lost critical working time, orders through delays, vacation
days and days’ salaries amongst other things. However, most medium scale enterprises
interviewed indicated that they did not lose time during the process of contacting the lending
institutions. They employed accountants/officers who were responsible for contacting the
lending institutions.
6.11. Decision Lag
Applicants had to wait for different periods of time before their loans were either
disbursed or applications were turned down. This difference in the decision lag was
influenced by whether it was a first time application (borrowing experience) or not and the
type of the institution (bank or non-bank). The responses relating to the decision lag are
analysed in Table 5 below:
Table 5: Decision Lag Period 1st Time 2nd Time Less than one month 53.8% 50% One – three months 26.9% 37.5% Three – six months 15.4% 12.5% Six months – 1 year 3.9% 0% More than 1 year 0% 0%
36
The decision lag was longer for those people who applied for funding through the
Commercial bans than it was for those who applied through non-bank institutions. The only
exception however was with those who applied under the CBZ Group Guarantee Scheme
where it took at least two weeks to get loans approved. It was also observed that the firm
and loan size did not have any significant influence on the decision lag.
6.12. Application Requirements
Prominent amongst the application requirements was the prerequisite for paying loan
application fees. 50% of all applicants were required to pay application fees, whilst the other
50% were not required to. Most of the respondents who were exempted from paying the fees
were mainly account holders with the respective lending institutions.
Lending institutions interviewed disclosed that these application fees were for the
purposes of covering a number of costs they faced in processing loan applications. Amongst
these were: site visits; application forms and other stationery requirements; administration
fees, and, training workshops. Those institutions that did not charge application fees
confirmed that they did not mainly because the marketing and operations departments
already budgeted for their costs. An analysis of application fees is given in Table 6.
Table 6: Application Fees
Application Fees 1st Time 2nd Time Less than $1,000 62,5% 40% $1,000 - $2,000 18.8% 20% $2,001 - $4,000 6.3% 20% $4,001 - $5,000 0% 0% More than $5,000 12.5% 20%

37
Fees paid by different applicants to different institutions ranged between less than one
thousand dollars and more than five thousand dollars. The analysis shows that applications
paid even higher fees in their second applications. This was mainly because in most cases
they applied to different lending institutions and were still considered first time applicants.
The other reason might have been the increased demand in loans towards the year 2000.
Inflation might have been another reason for the increase.
Apart from the application fees, there were also other requirements associated with
the loan applications and applicants had to pay to meet these requirements. These included
project proposals, year-end accounts, company registration, copies of certificates and cash
flow projections. Table 7 is an analysis of how much applicants paid for these requirements.
Table 7: Fees for Application Requirements
Application Fees 1st Time 2nd Time Less than $1,000 12.9% 60% $1,000 - $3,000 45.2% 20% $3,001 - $5,000 16.1% 20% More than $5,000 25.8% 0%
In year one more people paid more money towards the application requirements. As shown
by the table above 25.8% of applicants paid more than $5,000 towards the application
requirements whilst none of the applicants paid as much for the requirements the second time
they applied. From the interviews it was observed that a significant part of the money paid
was for the preparation of project proposals. Most applicants did not have another proposal
made the second time they applied for loans because they submitted the same proposal they
would have used the first time. This resulted in them only paying for other requirements that
were not as expensive.

38
6.13. The Estimated Borrowing Transactions Cost Function
In this subsection the relationship between total borrowing transactions cost and the
explanatory variables of loan size, distance, decision lag and borrowing experience is
estimated. The relationship between transactions cost and each of the these identified
variables is examined in a transactions cost model which is specified implicitly as follows:
.)Firmseclag,Dorex,Bistance,D,(LoanfBTC i= (1)
BTC is borrowing transactions cost; Loan is amount of loan obtained by applicant; Distance
is distance of borrower from loan office; Borex is borrowing experience, which is a dummy
variable with a value of unity for experienced borrowers and zero for first-time borrowers;
Declag is loan decision lag, defined as the time interval (days) between the submission of
loan application and the time of application approval or disapproval; Firmsi is firm size.
Two linear models were used. In the first model the variables were expressed in their
natural form.
,µBorexFirmsßDeclagßDistanceßLoanßßBTC 5i ++++++= β43210 (2)
A simple test for goodness of fit of the model resulted in the rejection of the model (see
Appendix for the values of R2 and Adjusted R2 ). The correlation coefficients matrix, also in
the Appendix, indicates no presence of multicolinearity. The correlation coefficients between
the explanatory variables are well below 0.5. In the second model, which was adopted for
this study, a semi structural functional form was used. To estimate the model a log
transformation functional form was adopted using the Ordinary Least Squares (OLS)
technique as follows:

39
,BorexFirms LnDeclagLnDistanceLnLoanLnBTC 5i εαααααα ++++++= 43210 (3)
where, α0 is the constant term, ε is the error term and the αi (i=l to 5) are parameters which
when estimated can be interpreted directly as elasticities. A simple test of goodness of fit
resulted in the acceptance of this second model as shown by both the R2 and the Adjusted R2.
The correlation coefficients between the explanatory variables are well below 0.5 indicating
no presence of multicolinearity. The correlation coefficients matrix is in the Appendix. Also
included in the appendix are values used for estimating the above model.
An elimination technique was used to come up with the most suitable model (in this
case model 4). This process starts with the model containing all the explanatory variables
(model 1). Insignificant variables were eliminated, using indications from the t-statistics,
resulting in models 2,3 and 4. The regressions analysis was interpreted in terms of both
unstandardized and standardized regression coefficients. Unstandardized regression
coefficients express effects in terms of the natural units of the variables. Standardized
regression coefficients express effects in terms of standard deviations. Standard coefficients
which are interpreted in this study are attractive because it is easy to immediately tell how
strong an effect is (how close to –1 or +1) without thinking about the variable units. The
reported estimates are shown in Table 8 below.

40
Table 8: Estimated Borrowing Transactions Cost Functions
Unstandardised Coefficients
Standardized Coefficients
MODEL
A Std. Error
Beta
t-value
p-value
R2
Adj.R2
1. Constant LnLoan Borex LnDistance LnFirmsi
LnDeclag
7.645 -.558. -1.312 .300 -.116 -.110
1.425 .111 .453 .183 .222 .2122
.599 -.329 .186 -.063 -.059
5.266 -5.044 -2.894 1.638 -.523 -.520
.000
.000
.007
.111
.604
.606
.632
.576
2. Constant LnLoan Borex LnDistance LnFirmsi
7.370 -.562 -1.296 .283 -.127
1.337 .109 .447 .178 .218
-.603 -.325 .176 -.068
5.511 -.5145 -2.896 1.587 -.581
.000
.000
.007
.122
.565
.632
.588
3. Constant LnLoan Borex LnDistance
7.384 -.582 -1.319 .264
1.325 .103 .441 .173
-.625 -.331 .164
5.575 -5.678 -2.989 1.522
.000
.000
.005
.137
.612
.586
4. Constant LnLoan Borex
8.038 -.579 -1.245
1.276 .104 .447
-.622 -.312
6.301 -5.552 -2.789
.000
.000
.008
.592
.582
From Table 8, model 4 is acceptable at 5% level of significance. According to this model the
explanatory variables account for 36% of the variation of borrowing transactions cost. Loan
size and borrowing experience are the most significant determinants of total transactions
cost. The results indicate that there was a decrease of 0.312% in the transactions cost due to
borrowing experience. Results also show that a one percent (1%) increase in the loan
amount borrowed is associated with a decrease of 0.622% in the transactions cost.
The significance of this relationship is that the smaller the loan size the higher the
transactions cost in relative terms. This result is consistent with findings from other studies
discussed in the literature review section. In these studies small borrowers incur higher
transactions cost than bigger borrowers. Application requirements made the bulk of the
borrowing transactions cost according to the results from the description statistics analysis in
41
chapter six of this study. As a result the micro and the small enterprises are affected more
negatively than their much larger counterparts.
Borrowing experience reduces the costs associated with the borrowing since the more
the experience one had, the less the borrowing transactions cost. The significance of the
borrower’s experiences implied that the first time borrower and the established ones were
treated differently by the banks. This is consistent with other studies reviewed although
significantly different from the findings by Olomola (1999). The reason for treating the two
sets of borrowers differently is mainly because experienced borrowers are likely to face less
hurdles in negotiating and acquiring the loan than the first time borrowers. The experienced
borrowers would have already established a business relationship as well as some level of
trust with the bank. In this study only ten applicants explicitly indicated that they were
experienced borrowers (see Table on values in the Appendix) and the rest were first time
borrowers who had applied to different banking institutions each time they applied.
The borrower’s distance from the loan office varies directly with the transaction costs
as explained by model 3 but is not statistically significant in this case to be singled out as one
of the determinants of borrowing transactions cost. One of the reasons why distance does not
affect transactions cost as expected in this case is that most the SMEs were established after
1990 and most banks had opened branches in the major towns such as Chitungwiza and
Norton. SMEs were nearer to the loan office to an extent that costs incurred in visiting the
banks were not much of a prohibiting factor. Decision lag has no significant effect on the
transaction cost.

42
7. Conclusion and Recommendations
Section 7 provides brief concluding remarks, discusses the relevance of the findings
to policy and outlines the recommendations suggested in order to minimize transactions cost
to accessing credit by SMEs and the poor in Zimbabwe.
7.1. Conclusion
The analysis in section 6 indicates that most of the interviewees started operating
between 1990 and 2000. This is attributed to retrenchments that followed economic
restructuring and advocacy work by indigenous pressure groups. Judging by the number of
employees, the sample was dominated by micro and small enterprise. The majority of these
used personal savings and retrenchment packages to start their businesses. They could not
meet the conditional requirements from banks such as collateral, initial deposit balance,
statement of accounts, business proposal, etc. This is consistent with literature reviewed in
Section 4. Medium scale enterprises faced similar problems of conditional requirements like
the micro and small-scale enterprises. They however had easier access to overdrafts. This
proved to be costly to these enterprises as they used these overdrafts for long-term
capitalization purposes. This as a result affected their viability and impacted negatively on
loan repayment.
Loan sizes differed according to the size of firms. Forty six percent (46%) of those
who applied were successful. Almost half of those that acquired the loans applied through
the CBZ’s group schemes, while the other 50% comprised mainly of medium enterprises and
micro and small enterprises that applied for more than $500 000.
43
Drawing on results from descriptive statistics and OLS analysis two important
conclusions were made. First, two factors were singled out as determinants of the
transactions cost structure. These are loan size and borrowing experience. Loan size
negatively related to total borrowing costs. Although there was a number of micro and small
scale enterprises that accessed loans through group guarantee and micro finance schemes
(mostly those that disburse the loans in kind), which reduced transactions cost to near zero
levels, the above relationship was influenced by over 50% of the sample that applied for
loans through the normal commercial banking procedures. Although the cost per dollar for
larger loans was reduced, micro, small and medium scale enterprises that did not have
collateral as security had unsuccessful applications.
The micro, small and medium enterprises which succeeded in acquiring loans still
had to operate in a harsh and unstable macro-economic environment characterized by high
inflation, high interest rates, low rates of return on capital etc. Many failed to service their
loans and in the process, their credit worthiness was negatively affected. 6
Borrowing experience is indirectly related to transactions cost according to the OLS
analysis. This is also confirmed by the descriptive statistics analysis results. Although more
than half the borrowers interviewed indicated that they had approached banks more than
once, they remained first time borrowers. The main reason given was that borrowers
approached different banks when they applied for the firsts and second time. Having failed to
secure funds the first time, borrowers sought to increase their chances by applying to a
6 In 2001, inflation averaged around 70%, interest rate ranged from 15% to 20% for the productive sector to a market rate of 41%, an acute shortage of foreign currency and a negative growth rate of –8%.

44
different lending institution. The other reason included the time lapse between the first and
the second application. These two important factors are coupled with the conditional
requirements that screened out the other 50% of applicants. These are issues such as
collateral, final accounts, business proposals and company registration.
Distance was not statically significant. This is confirmed by the fact that only 5% of
the sample indicated that they had traveled distances of over 50km, and this was before
1990. The decentralization of banks to small towns and suburban areas significantly reduced
the importance of this variable in total transactions cost.
7.2. Policy Relevance
In view of the above conclusions, loan applicants sampled in this study possess
different qualities. These are the cost per dollar, collateral and the availability of information
useful for screening bad risks. The implication of this is that any attempt at improving
access by micro and small enterprises has to focus on these three qualities. Results from the
survey indicate that medium scale enterprises were also adversely affected by collateral
requirements and availability of information as well as by macroeconomic fundamentals.
The fact that the study showed that smallness is associated with high transactions cost
should be a building block on which to develop trust between the micro and small enterprises
on one hand and the banks on the other. It is an indication of the importance of Group Credit
Guarantee Scheme (GCGS). GCGS initiated by CBZ reduced the information asymmetry
between the contracting parties, built trust between them and enhanced borrowing experience
on the part of the borrowers. The single most important benefit to micro and small

45
enterprises is that the scheme reduces transactions cost associated with information
asymmetry to near zero levels. Group loans also address the other quality that stands in the
way of small loan applicants: the cost per dollar. Processing one loan instead of ten, the
bank saves on the fixed costs of lending.
Overall, it seems group loan schemes can be a viable medium and long-term tool for
building trust between banks and the micro and small enterprises. Benefits are likely to
accrue to both participants. Banks would in the process tap into a very large and untapped
potential market. With such support, micro and small enterprises might grow into medium
and probably large-scale enterprises generating sustainable demand for the services of the
banking sector that is currently grappling with a dwindling clientele. If the observed
concentration of borrowers at the upper end of their loan bracket towards the year 2000 is a
sign of growth in the operation of these enterprises, then the GCGS initiative must be
supported and developed further. It is however important to also note that the observed
concentration might have been influenced by inflation.
7.3 Recommendations
Building of trust between the formal banking sector and the SMEs reduces
transactions cost that constrain access to credit by the latter. In the case under review two
such costs need attention. These are administrative costs and information asymmetry. Two
recommendations are made for possible intervention by the banking sector:
• Banking institutions can support the formation of credit groups. This practice has several benefits. In forming the groups, the members recognize and acknowledge their joint responsibility, screen each other thus lowering the bank’s screening costs. Moreover, by one loan instead of ten, the banks save on the fixed costs of lending. Members can enforce each other’s repayment in ways that neither the

46
bank nor the legal systems can cheaply duplicate. The group guarantee minimizes the requirements from banks, and in particular collateral. Bank workers who deal closely with the target group help in information gathering, thereby reducing moral hazard and risk. Besides these advantages banks create, in the process, a critical mass of future clients for themselves.
• To accommodate those that graduate from the group scheme to the commercial
credit markets, banks should make use of small loans for short periods of time. The idea is to encourage “repeat borrowing” which tends to overcome the problems of incentives to mislead, and increases borrowing experience on the part of borrowers.
Those that managed to acquire large loans and overdrafts faced a different challenge.
Viability problems come out very strongly. This is a result of the general macro economic
fundamentals such as high inflation, high interest rates, shortage of foreign currency etc,
which affected their capacity to service their loans, making them ineligible as second time
borrowers. Government should work towards stabilizing the macroeconomic environment.

47
References FASID., 1998, Microeconomies and Structural Adjustment in Africa: Experiences and
prospects of Small Business and Farmers. Gonzalez-Vega, 1976, “Interest Rates Restrictions and Income Distribution.”American
Journal of Agricultural Economics. Vol. 59, No. 5, 973-976. Herath, G., 1994, “Rural Credit Markets and Institutional Reform: Developing Countries:
Potential and Problems.” Savings and Development. Quarterly review No. 2 Vol. XVII, 169-191.
Hoff, K., and J.E. Stiglitz, 1990, “Introduction: Imperfect information and rural credit market
– puzzles, policy perspectives.” World Bank Economic Review. Vol. 4, No. 3, 235-250.
Johnson, S., and B. Rogaly,1997, Microfinance and Poverty Reduction. Oxfam UK. Klitgaard, R., 1991, Adjusting to Reality: Beyond “State versus Market” in Economic
Development. International Centre for Economic Growth. Liedholm, C., 1985, “Small scale enterprise credit schemes: administrative costs and the role
of inventory norms.” Working paper No. 25 Department of Agricultural Economics, Michigan State University.
Lin, J.Y., and J. Negent, 1995. “Institutions and Economic Development.” Handbook of
Development Economics. Vol. 3, Chap. XX. Matshalaga, N., 1998, “Institutional Support Services and Economic Policy Environment for
Rural Micro and Small Scale Enterprises: The Case of Shamva.” in Economic Policy Reforms and Meso-Scale Rural Market Changes in Zimbabwe: The Case of Shamva District. L.Masuko ed (Harare: Institute of Development Studies University of Zimbabwe). 293-312.
Mckinnon, R., 1973, Money and Capital in Economic Development. (Washington D.C.). McPherson, M.A., 1998, Zimbabwe: A Third Nationwide Survey of Micro and Small
Enterprises. (USAID Zimbabwe). Moyo, T., 2001, “Financial Sector Liberalisation and the Poor – A Critical Appraisal.”
SAPRI Workshop, Harare International Conference Centre. Nabli, M.K., and J.A. Nudent, 1989, “The New Institutional Economics and its Applicability
to Development.” World Development. Vol. 17, No. 9,1333-47.

48
North, D.C., 1992. “Transactions cost, Institutional and Economic Performance.” ICEG Occasional Papers No. 30. International Centre for Economic Growth.
Olomola, A.S., 1999, “Determinants of Smallholders’ Transaction Cost of Procuring Non
Bank Loans in Nigeria.”Savings and Development. Quarterly Review No. 1 Vol XXIII, 95 – 108.
Rittenberg, L., 1991, “Investment spending and Interest Rate Policy: The Case of Financial
Liberalisation in Turkey.” Journal of Development Studies. Vol 27. No. 2, 151-167. Roe, A.R., 1982, “High Interest Rates: A New Conventional Wisdom for Development
Policy. Some Conclusions from Sri Lanka’s Experience.”World Development. Vol 10. No. 3, 211 – 222
Roman, L., 1994, “Transactions cost and Transition: The Case of Vietnamese Banking
Sector.” Savings and Development. Quarterly Review No. 3, Vol. XVIII. Saito, K., and D. Villaneuva, 1981, “Transactions Cost of Credit to Small Scale Sector in the
Philippines.” Economic Development and Cultural Change. Vol. 29, 631 – 40. Stiglitz, J.E., and A. Weiss, 1981, “Credit Rationing in Markets with Imperfect Information.”
American Economic Review. Vol. 71, No. 3, 393 – 410. Tevera, D., 1998, “Micro and Small-Scale Enterprises in the Shamva District within the
context of an Adjusting National Economy.” In Economic Policy Reforms and Meso-Scale Rural Market Changes in Zimbabwe: The Case of Shamva District. L. Masuko ed. (Harare, Zimbabwe: Institute of Development Studies, University of Zimbabwe). 253-292.
The Government of Zimbabwe, 1991, A Framework for Economic Reform 1991-1995. (Harare, Zimbabwe: Government Printers).

49
APPENDIX
A. Correlation Coefficients of Variables Expressed in their Natural Form
BOREX DESLAG BTC FIRM DIST LOAN BOREX 1 0.0401 -0.1121 0.0235 0.1176 -0.1045 DESLAG 0.0401 1 0.0453 0.1785 -0.0399 0.043 BTC -0.1121 0.0453 1 0.0212 0.2137 0.3913 FIRM 0.0235 0.1785 0.0212 1 0.2741 0.0211 DIST 0.1176 -0.0399 0.2137 0.2741 1 -0.0117 LOAN -0.1045 0.043 0.3913 0.0211 -0.0117 1
B. Correlation Coefficients of Variables Expressed in the Log Transformation Functional Form
LNBTC LNDESLAG LNDIST LNFIRM LNLOAN BOREX LNBTC 1 0.0803 0.245 0.018 0.4456 -0.2751 LNDESLAG 0.0803 1 0.2127 0.1181 0.0929 -0.0167 LNDIST 0.245 0.2127 1 0.1925 0.1024 0.1175 LNFIRM 0.018 0.1181 0.1925 1 0.3319 0.1616 LNLOAN 0.4456 0.0929 0.1024 0.3319 1 0.2212 BOREX -0.2751 -0.0167 0.1175 0.1616 0.2212 1
C. Test of Goodness of Fit for Variables Expressed in their Natural Form Multiple R .39130 R2 .15312 Adj. R2 .13023 Standard Error 12916.24945 Analysis of Variance DF Sum of Squares Mean Square Regression 1 1116033972.05523 1116033972.05523 Residual 37 6172691498.91913 166829499.97079 F = 6.68967 Signif F = .0138

50
D. Values Used to Estimate the Log Transformation Model. BTC Ratio Loan Distance Firms Declag Borex 3160.0 1300.0 528.0 2240.0 1012.0 2516.0 5150.0 1290.0 70000 16216 2096.0 7740.0 4520.0 1000.0 3650.0 20042 18250 7140.0 7540.0 22192 15162 45200 4418.0 6620.0 1324.0 4090.0 2280.0 22770 1860.0 14590 210.0 540.0 1000.0 8700.0 30054 1418.0 12000 1412.0
6.32 2.60 0.07 8.96 20.24 10.06 0.64 0.78 1.75 1.62 2.79 30.35 18.08 4.00 0.73 0.95 7.30 0.07 0.75 0.37 3.03 2.26 1.47 66.20 2.65 5.45 22.80 22.77 4.13 0.97 0.14 0.22 0.20 1.16 2.00 0.10 2.67 1.01
5000.00 5000.00 750000.00 25000.00 5000.00 25000.00 800000.00 16600.00 400000.00 100000.00 75000.00 25500.00 25000.00 25000.00 500000.00 2100000.00 250000.00 10000000.00 1000000.00 6000000.00 500000.00 2000000.00 300000.00 10000.00 50000.00 75000.00 10000.00 100000.00 45000.00 1500000.00 150000.00 250000.00 500000.00 750000.00 1500000.00 1400000.00 450000.00 140000.00
10.00 10.00 10.00 10.00 10.00 10.00 10.00 10.00 2.00 25.00 75.50 21.00 10.00 5.00 10.00 10.00 10.00 10.00 10.00 10.00 50.00 10.00 5.00 4.00 10.00 38.00 42.00 65.00 10.00 30.00 10.00 5.00 10.00 10.00 50.00 18.00 10.00 10.00
6.00 8.00 8.00 8.00 2.00 26.00 3.00 7.00 17.00 8.00 7.00 16.00 16.00 3.00 65.00 3.00 13.00 9.00 120.00 15.00 43.00 5.00 12.00 4.00 8.00 8.00 3.00 2.00 5.00 16.00 23.00 25.00 3.00 15.00 43.00 26.00 8.00 5.00
60.00 60.00 135.00 60.00 15.00 60.00 60.00 15.00 7.00 135.00 15.00 60.00 60.00 15.00 16.00 16.00 15.00 45.00 150.00 90.00 15.00 120.00 15.00 16.00 15.00 30.00 195.00 15.00 15.00 90.00 15.00 15.00 16.00 60.00 60.00 16.00 15.00 16.00
0.00 0.00 0.00 0.00 0.00 0.00 0.00 0.00 0.00 1.00 0.00 0.00 0.00 0.00 0.00 0.00 0.00 0.00 0.00 0.00 0.00 0.00 0.00 0.00 0.00 0.00 0.00 0.00 0.00 0.00 1.00 1.00 1.00 1.00 1.00 1.00 1.00 1.00
BTC: Borrowing transaction cost Ratio: Ration of borrowing transaction cost to the loan size Loan: Amount of loan borrowed Declag: Disbursement lag Borex: Borrowing experience

51
Figure 1: Location.
Figure 2: Labour Force Size
58%
4%
38%
0%
10%
20%
30%
40%
50%
60%
70%
Industrial Area City Centre Residential Area
60%
23%17%
0.0
0.1
0.2
0.3
0.4
0.5
0.6
0.7
One-10 Eleven - 20 More than 20

52
Figure 3: Nature of Business
Figure 4: Source of Start-Up Capital
0
10
20
30
40
50
60
Service Mining Transport
%
0
5
10
15
20
25
30
35
40
Loan Loan Family/friends Retrenchmentpackage
Overdrafts Overdraft andSavings

53
Figure 5: Loan Size
0%
10%
20%
30%
40%
50%
60%
Between $1.000and $50.000
Between $51.000and $100.000
Between$101.000 and
$500.000
Between$501.000 and
$1m
Over $1m