Embed Size (px)
Citation preview
The Determinants of Mutual Fund Performance:
A Cross-Country Study∗
Miguel A. Ferreira†
NOVA School of Business and Economics
Aneel KeswaniCass Business School
António F. MiguelISCTE-IUL
Sofia B. RamosISCTE-IUL
This Version: January 2012
Abstract
We use a new data set to study the determinants of the performance of open-end
actively managed equity mutual funds in 27 countries. We find that mutual funds
underperform the market overall. The results show important differences in the deter-
minants of fund performance in the U.S. and elsewhere in the world. The U.S. evidence
of diminishing returns to scale is not an universal truth as the performance of funds
located outside the U.S. and funds that invest overseas is not negatively affected by
scale. Our findings suggest that the adverse scale effects in the U.S. are related to liq-
uidity constraints faced by funds that, by virtue of their style, have to invest in small
and domestic stocks. Country characteristics also explain fund performance. Funds lo-
cated in countries with liquid stock markets and strong legal institutions display better
performance.
JEL classification: G15; G18; G23
Keywords: Mutual funds; Performance; Economies of scale; Investor protection
∗We thank the editor, Burton Hollifield, an anonymous referee, Janis Berzins, Susan Christoffersen, Mariado Céu Cortez, Nuno Fernandes, Wayne Ferson, Paulo Gama, Jenke Ter Horst, Massimo Massa, Pedro
Matos, David Ng, Richard Payne, Jesper Rangvid, Henri Servaes, Clemens Sialm, Laura Starks, David
Stolin and Russ Wermers; seminar participants at City University of London; and participants at the 2007
Western Finance Association Conference, 2007 Financial Management Association European Conference,
2007 Global Asset Management Conference at McGill, and 2008 ISCTE Annual Finance Conference for
helpful comments. This research is supported by a grant from the Fundação para a Ciência e Tecnologia
(PEst - OE/EGE/UI0315/2011).†Corresponding author. Address: Faculdade de Economia, Campus de Campolide 1099-032 Lisboa,
Portugal. E-mail: [email protected].
1. Introduction
Mutual funds have come to play a dramatically increased role in financial markets in recent
decades. As of the end of 2007, the world mutual fund industry managed financial assets
exceeding $26 trillion (including over $12 trillion in stocks), more than four times the $6
trillion of assets managed at the end of 1996 (Investment Company Institute (2008)). The
number of mutual funds has also grown dramatically, to more than 66,000 funds worldwide
at the end of 2007 (including nearly 27,000 equity funds). Although the growth of the mutual
fund industry started in the U.S., where the industry plays an extremely important role in
financial markets, this trend has spread more recently to other countries around the world
(Khorana, Servaes, and Tufano (2005)). The share of assets under management outside the
U.S. grew from 38% in 1997 to 54% in 2007.
Investors are increasingly interested in mutual fund selection, demanding detailed mutual
fund information and investment advice. Many authors have tried to explain the performance
of mutual funds, which is a critical aspect in investor fund selection. Several fund charac-
teristics have been analyzed as potential determinants of future fund performance, including
fund size, age, fees and expenses, loads, turnover, flows, and returns.1 Most authors conclude
that mutual funds underperform the market, but some others find that managers display
some skill. In particular, there is evidence of short-term persistence in funds’ performance
and that money flows to past good performers. Investors display some fund selection ability
as they tend to invest in funds with subsequent good performance (“smart money” effect).
There is also evidence that fund performance worsens with fund size (Chen et al. (2004)
and fees (Gil-Bazo and Ruiz-Verdu (2009)). Although the literature focuses on the U.S.
mutual fund industry, several authors study fund performance in individual countries. Few,
however, examine cross-country mutual fund performance.2
1See, for example, Jensen (1968), Grinblatt and Titman (1989), Ippolito (1989), Hendricks, Patel, and
Zeckhauser (1993), Brown and Goetzmann (1995), Malkiel (1995), Gruber (1996), Carhart (1997), Chevalier
and Ellison (1997), Sirri and Tufano (1998), and Zheng (1999).2See, for example, studies on Australia by Bird, Chin, and McCrae (1983); France by Dermine and
Roller(1992); Italy by Cesari and Panetta (2002); Japan by Cai, Chan, and Yamada (1997); Sweden by
1
We study how the performance of equity mutual funds relates to fund characteristics
and country characteristics around the world. To the best of our knowledge, we are the
first to study mutual fund performance using a worldwide sample of funds. The sample
consists of 16,316 open-end actively managed equity funds in 27 countries over 1997-2007.
We focus on the sample of funds that invest in their local market (domestic funds), but
we also perform some tests using funds that invest outside their local market or globally
(international funds). We use the Carhart (1997) four-factor model to measure risk-adjusted
performance, but we also consider several alternatives including benchmark-adjusted returns,
market-adjusted returns, and the market model.
We study fund performance using an extensive list of fund characteristics, including fund
and family size, age, fees and expenses, front-end and back-end loads, flows, past returns,
management structure, and number of countries where a fund is sold. There are reasons to
believe that there are important differences in the determinants of mutual fund performance
between the U.S. and the rest of the world. U.S. funds are much larger than elsewhere
in the world, and the U.S. fund industry is older and more developed. Our worldwide
sample of mutual funds allows us to consider several country characteristics, such as economic
development, financial development, quality of legal institutions and law enforcement, and
mutual fund industry structure, as potential determinants of performance.
We first document that equity mutual funds around the world underperform on average
by 20 basis points per quarter after fees and controlling for the Fama and French (1992)
three factors and momentum. We find evidence of important differences in the determinants
of mutual fund performance in the U.S. and elsewhere in the world. The most striking
difference is related to the effects of scale. We find that small funds perform better than
large only in the case of U.S. funds, as large non-U.S. funds perform better than smaller
funds. The negative size effect in the U.S. is economically significant, as a one-standard
Dahlquist, Engström, and Söderlind (2000); or the U.K. by Blake and Timmermann (1998). Grunbichler
and Pleschiutschnig (1999) and Otten and Bams (2002) study European equity mutual funds, but their
findings on performance are narrow because of both a small number of countries and funds.
2
deviation increase in fund size yields a 15 basis point decline in the next quarter’s fund
return. The positive size effect outside the U.S. is also sizable. A one-standard deviation
increase in fund size is associated with an increase in next quarter’s fund net return of 11
basis points. Additionally, fund size does not seem to hurt the performance of funds that
invest overseas. We conclude that the U.S. evidence on diseconomies of scale (Chen et al.
(2004)) is not a universal truth as non-U.S. funds and international funds do not seem to be
affected by diminishing returns to scale.
Of course, U.S. funds are much larger on average than funds elsewhere in the world.
The average U.S. fund is more than five times larger than the average non-U.S. fund.3
This fact, however, does not explain the asymmetric effect of scale on performance as U.S.
funds of similar size to their non-U.S. counterparts also present a statistically significant
negative relation between performance and lagged fund size. Our findings suggest that
liquidity constraints play an important role in explaining the lack of scale-ability of fund
investments as argued by Chen et al. (2004), Pollet and Wilson (2008), and Yan (2008).
U.S. funds that, by virtue of their style, have to invest in small and illiquid stocks are the most
affected by scale, while this is not the case for non-U.S. funds. Moreover, the performance
of international funds is not negatively affected by scale even for those funds located in the
U.S. It is important to note that U.S. international funds’ average total net assets (TNA) is
similar to the U.S. domestic funds’ average TNA. This suggests that the availability of more
investment opportunities in funds that invest overseas mitigates the adverse scale effects. In
other words, international funds are not restricted geographically in investment opportunities
as a fund grows, while domestic funds are restricted geographically.
These findings are informative about the relevance of the Berk and Green (2004) model
around the world. The Berk and Green (2004) model assumes that funds operate in a
decreasing return to scale environment, which means that fund flows harm rather than
improve subsequent fund performance. Our findings that diminishing returns to scale may
3There are only nine non-U.S. funds among the top 100 domestic equity funds in terms of total net assets
(TNA) at the end of 2007 in our sample.
3
not be present outside of the U.S. mutual fund industry suggest that fund flows may not
eliminate performance persistence in the manner predicted by the Berk and Green (2004)
model.
We also consider the effect of the size of the fund family on fund performance around the
world. Many funds belong to large fund families and some of these families manage funds in
several different countries (examples of top fund families are American Funds, Barclays, Fi-
delity, and UBS). Controlling for fund size, we find that fund performance actually improves
with the size of its fund family, as large fund families benefit from substantial economies in
trading commissions and lending fees. Chen et al. (2004) find similar evidence for U.S. funds.
We also test the hypothesis that organizational diseconomies, in particular hierarchy costs
(Aghion and Tirole (1997) and Stein (2002)), erode fund performance. Large organizations
with hierarchies are particularly inefficient in processing soft information, which is pivotal in
the case of mutual funds, as managers may have a hard time convincing others to implement
their ideas. Consistent with this view, we find evidence that solo-managed funds perform
better than team-managed funds in a worldwide sample of funds, which is consistent with
the U.S. evidence in Chen et al. (2004).
Other fund characteristics have a variety of effects on performance. Fund age is negatively
related to fund performance in the sample of non-U.S. funds, but this relation is statistically
insignificant in the sample of U.S. funds. This indicates that younger funds are better able to
detect good investment opportunities outside the U.S. We also examine the effects on fund
performance of past performance and flows. We find evidence of short-run persistence in fund
performance, but only in the case of U.S. funds. The evidence on persistence is consistent
with the U.S. evidence (e.g., Hendricks, Patel, and Zeckhauser (1993) and Grinblatt and
Titman (1994)). Investors outside the U.S. seem to have some ability to select funds, as
money flows to funds with good future performance. We find, however, that the “smart
money” effect is statistically insignificant in the sample of U.S. funds. This is consistent with
the U.S. evidence in Sapp and Tiwari (2004) that the “smart money” effect is explained by
4

momentum.
A unique feature of our study is that we can investigate the effect of country characteris-
tics on fund performance. We find country characteristics to have predictive power beyond
fund characteristics. There is a strong positive relation between the performance of mutual
funds and a country’s level of financial development. In particular, funds perform better
in countries with high trading activity and low trading costs. Finally, we find that funds
domiciled in countries of common-law tradition perform better. Investor protection and law
enforcement have a statistically significant and positive effect on fund performance. Our
findings show that country-level investor protection is a critical determinant of the perfor-
mance of the mutual fund industry across countries in addition to the size and fees of the
industry (Khorana, Servaes, and Tufano (2005) and (2009)).
The remainder of the paper is organized as follows. Section 2 describes the data and
the performance benchmarks. In Section 3 we present our empirical findings. Section 4
concludes.
2. Data and Methodology
In this section, we first describe our sample, then we describe the methods for computing
abnormal performance and finally we present fund and country characteristics.
2.1. SAMPLE DESCRIPTION
Data on equity mutual funds come from the Lipper Hindsight database, which covers many
countries worldwide in the 1997-2007 period. The database is survivorship bias-free, as it
includes data on both active and defunct funds. Although multiple share classes are listed
as separate funds in Lipper, they have the same holdings, the same manager, and the same
returns before expenses and loads. We eliminate multiple classes of the same fund to avoid
multiple counting of returns. We keep the share class that Lipper identifies as the primary
5
one. The initial sample includes 37,910 primary equity funds (both active and dead funds).4
We have checked the coverage of funds by Lipper with the aggregate statistics on mutual
funds (European Fund and Asset Management Association (2008), EFAMA). Total numbers
of equity funds reported by Lipper and the EFAMA are, respectively, 26,800 and 26,950 as of
December 2007. Total net assets of equity funds (sum of all share classes) reported by Lipper
and EFAMA are, respectively, $10.9 trillion and $12.5 trillion as of December 2007. Thus,
our initial sample of equity funds covers 87% of the total net assets of worldwide equity funds.
There is, however, some variation in coverage across countries. While Canada, Germany,
Sweden, the U.K., and the U.S. have coverage above 90%, the coverage in Australia and
France is roughly 60% and in Japan only 40%.5
We exclude off-shore funds (e.g., funds domiciled in Luxembourg or Dublin), closed-
end funds, index-tracking funds, exchange-traded funds, and funds-of-funds. This gives a
sample of 25,110 open-end actively managed equity funds from 34 countries. We require
mutual funds to have data on total net assets (TNA), age, total expense ratios, front-end
and back-end loads, flows, management team, the number of countries a fund is sold, and
monthly total returns. We also require a fund to have at least two years of reported returns
because we need to estimate fund factor loadings based on past fund returns. The final
sample includes 16,316 funds in 27 countries (12,577 active funds and 3,739 dead funds as
of December 2007). We believe this is the most comprehensive data set ever used to study
mutual fund performance in terms of both number of funds and countries. The data set
allows us to investigate the effect of both fund characteristics and country characteristics on
performance.
The Lipper database provides information on a fund’s country of domicile and geographic
investment focus. We use these data to classify funds in terms of their geographic investment
4The primary fund is typically the class with the highest total net assets (TNA). The primary class
represents more than 80% of the total assets across all share classes.5There are 24,050 equity funds with a TNA of $10.2 trillion in Lipper if we exclude closed-end and funds-
of-funds. In this case our initial sample covers 82% of the TNA of equity funds worldwide. The EFAMA
statistics are not entirely consistent across countries whether or not they include these type of funds.
6
style: domestic funds (i.e., funds that invest in their domicile country) and international
funds (i.e., funds that invest in countries or regions different from the one where they are
domiciled, and funds that invest globally). We require a country to have more than ten
funds to be included in the sample. The final sample covers 8,176 domestic funds and 8,140
international funds. Table A.1 in the Appendix lists the top three domestic and international
funds by TNA in each country as of 2007.
Table I presents the number and TNA of the sample of mutual funds by country as of
2007. TNA is given by the sum of all share classes when there are multiple share classes.
There are a total of 12,577 equity funds in the sample in 2007, managing $6.7 trillion of
assets. U.S. funds represent 67% of the sample in terms of TNA, but only 22% of the total
number of funds. Other countries with a large number of funds are Australia and Canada,
which account for 17% and 12% of the total number of funds.
A country’s weight in terms of number of funds is greater than its weight in terms of
fund size for all countries except the U.S., indicating that on average non-U.S. mutual funds
are much smaller than U.S. funds. The average fund in Europe is five times smaller than
the average U.S. fund. This is also the case in Asia, where the average fund is nearly 17
times smaller than in the U.S. Overall, non-U.S. funds are more than seven times smaller
than U.S. funds.
Table I also divides funds by geographic investment style. Domestic funds represent about
half of the sample in terms of the number of funds and 63% in terms of TNA. Domestic funds
are, on average, 1.6 times larger than international funds. The U.S. mutual fund industry is
heavily weighted toward domestic funds, as they account for more than 80% of the number
of the funds and more than 70% of the TNA in the U.S. International funds, however, are
dominant in other countries like Australia, Canada, France, Germany, and the U.K.. For
example, international funds in Australia, Canada, and France represent, respectively, 46%,
60%, and 76% of the number of funds and 39%, 42%, and 70% of the TNA. We conclude
that U.S. investors prefer mutual funds that invest mainly in domestic stocks, while non-U.S.
7
investors exhibit less home bias as they invest a significant part of their stock portfolio in
international funds.
2.2. MEASURING FUND PERFORMANCE
We estimate the mutual funds (risk-adjusted) performance using several benchmark models.
Fama and French (1992) propose a three-factor model that improves average CAPM pricing
errors by including size and book-to-market factors. Carhart (1997) proposes adding a factor
that captures the Jegadeesh and Titman (1993) momentum anomaly. The four-factor model
regression is given by:
= + 0 + 1 + 2 + 3 + (1)
where is the return in U.S. dollars of fund in excess of the one-month U.S. Treasury-bill
in month ; is the excess return in U.S. dollars on the market; (small minus big)
is the average return on the small-capitalization portfolio minus the average return on the
large-capitalization portfolio; (high minus low) is the difference in return between
the portfolio with high book-to-market stocks and the portfolio with low book-to-market
stocks; and (momentum) is the difference in return between the portfolio with the
past-12-month winners and the portfolio with the past-12-month losers.
The benchmark model in equation (1) nests several alternative benchmark models. The
market model assumes 1 = 2 = 3 = 0 and market-adjusted returns further assume
that 0 = 1We also use benchmark-adjusted returns by taking the difference between the
fund return and its benchmark return as listed on Lipper. We present results using these
alternatives in the robustness section.
We construct the monthly benchmark factors for each individual country using all stocks
included in the Datastream/Worldscope database. The market return is computed using
the value-weighted average return in U.S. dollars of all stocks in each country in each month.
To form the size and book-to-market equity portfolios, we follow the procedure described in
8
Fama and French (1992).
We use monthly fund returns (net of expenses) denominated in U.S. dollars from July
1997 through December 2007 to estimate the factor models.6 We also present results using
gross returns in the robustness analysis. First, we estimate the time series regression of the
monthly fund excess returns on the factor portfolios’ returns using the previous 36 months of
data, every quarter (we require a minimum of 24 months of return data).7 We then subtract
the expected return from the realized fund return to estimate the fund abnormal return in
each quarter, or alpha, which is measured as a sum of an intercept of the model and the
residual as in Carhart (1997). Alpha measures the manager’s contribution to performance
due to stock selection or market timing. A positive (negative) alpha indicates that the fund
overperforms (underperforms) the benchmark. Since we use three years of return data to
estimate the factor model, our first estimate of a fund’s alpha is for the first quarter of 2000.
Table II presents the average factor loadings for domestic funds by country and the
associated 2 statistics from these regressions. We see that U.S. funds, on average, load
more on SMB, HML and MOM than non-U.S. funds. So, U.S. funds play more small, value,
and momentum stocks than non-U.S. funds.8 It is well known that the four factor model
works well in explaining the variation in U.S. mutual fund performance and our finding of
an average 2 statistic for U.S. funds of 85% bears this out. Even though the four-factor
model was developed on U.S. data, its 2 outside the U.S. is even higher, at 88%. This
reassures us that the 4-factor model is an appropriate way to evaluate fund performance for
our worldwide sample.
6Our primary findings are not affected when we use fund returns in local currency.7There is look-ahead bias in our sample due to the exclusion of new funds that do not have enough
history for the regression analysis (see Brown at al. 1992).8The comparatively high loading on for U.S. mutual funds might be explained by the historically
poor performance of the size factor outside the U.S. Indeed, across the countries in our sample the average
fund loadings on across countries appear to line up with the magnitude of the average size premia.
9
2.3. FUND CHARACTERISTICS
Table III reports averages of mutual fund returns and alphas for domestic funds by country.
We winsorize returns and alphas at the bottom and top 1% level. The average fund return
is 3.01% per quarter. We report average Carhart four-factor alphas. The fund alphas are
negative for about half of the countries. The countries with the best performance are Den-
mark, Thailand, and Portugal, while the countries with the worst performance are Norway,
Australia, and France. U.S. funds are in the middle of the pack with an average alpha of
-0.30% per quarter, which is consistent with the average alpha in Chen et al. (2004) for U.S.
funds. Thus, there is evidence of underperformance in the worldwide mutual fund industry.
The average alpha is -0.20% per quarter with a standard deviation of 4.18%. Overall, the
figures here are consistent with other studies that find that fund managers do not have the
ability to beat the market (or stay even with it) after fees (e.g., Malkiel (1995) and Gruber
(1996)).
Table III also presents average fund characteristics by country. We winsorize the expense
ratio, total loads, and flows at the bottom and top 1% level. Panel A of Table A.3 in the
Appendix defines fund-level variables.
Fund size is measured by total net assets (TNA) in U.S. dollars. The U.S., the U.K., and
Germany have the largest funds, while Thailand and South Korea have the smallest funds.
U.S. funds have an average TNA of $949 million, followed by the U.K. with $471 million
and Germany with $418 million. Overall, the average TNA in our sample of funds is $558
million. Outside the U.S., the average TNA of funds is only $170 million.
We also examine the effect on performance of the size of a fund’s family. Family size is
measured as the sum of all equity funds under management by a particular company. We use
the parent management company to calculate total equity assets under management. In the
case of transnational fund companies we use the sum of all equity assets worldwide. Funds
domiciled in the U.S., the U.K., Japan, Germany, Australia, and Canada are managed by
the largest fund families. Interestingly, the average family fund size of funds domiciled in
10
Poland and Taiwan is also quite high, despite low individual fund size. This happens because
funds in these two countries are part of large global fund families.
We use a host of other fund characteristics in our analysis of performance. The first
characteristic is fund age as given by the fund launch date. The average fund age is about 11
years. Funds domiciled in Germany, Switzerland, the U.K., and the U.S. tend to be among
the older ones. U.S. funds have an average age of 12.6 years.
The second characteristic is the total expense ratio, defined as total annual expenses
as a fraction of TNA. In some countries where the expense ratio is not available we use
the management fee. The average expense ratio is 1.46%. Expenses vary considerably
across countries despite the global nature of the mutual fund industry. For example, average
expense ratios are the lowest in Belgium (1.05%) and the Netherlands (1.08%), while they
reach maximums of 3.25% in Poland and 2.68% in South Korea. U.S. funds present an
average expense ratio of 1.30%, which is slightly higher than the ratio reported in other
studies. The third characteristic is total loads defined as the sum of front-end and back-end
loads. The average total load is 2.65%. Loads vary considerably across countries, U.S. funds
present total loads similar to the overall average.
The fourth characteristic of interest is flows defined as the percentage growth in total
assets under management (in local currency) between the beginning and the end of quarter
, net of internal growth (assuming reinvestment of dividends and distributions):
= − −1(1 +)
−1(2)
where is total net assets in local currency of fund , and is fund return in local
currency. Funds have an average flow of 0.44% per quarter. The flows are positive in
the majority of the countries (exceptions include, for example, Germany, Italy, Japan, and
Switzerland).
The fifth characteristic is the number of countries where a fund is sold. This variable
11
tells us where fund investors are located. While in some countries like the U.S., funds are
distributed only locally, in Europe it is common for a fund to be sold in more than in one
country. The average number of countries where a fund is sold is 1.1 for domestic funds, but
we can find some countries where it is common that a fund is sold in several countries (e.g.,
Austria, Belgium, Germany, Sweden, and the U.K.).
Finally, we consider management structure as a potential determinant of fund perfor-
mance. Lipper provides a field listing names of managers in charge of a fund. We use a
dummy variable (management team) that takes a value of one if the number of managers is
greater than one or the fund is listed as team-managed or by the name of the management
company, and zero if the fund is managed by a single manager. This variable identifies the
organizational structure influencing the decision-making process of the fund, and it may help
to explain fund performance. Funds tend to be managed by teams in countries such as Aus-
tralia, Canada, France, and Japan. Management by teams is less common in Germany and
the U.K.. In the U.S., 63% of the funds are managed by teams (or more than one person),
which is consistent with figure reported in Massa, Reuter, and Zitzewitz (2010). Overall,
68% of the funds are managed by teams (or more than one person).
2.4. COUNTRY CHARACTERISTICS
Our sample of equity mutual funds includes 27 countries. This large cross-section of coun-
tries allows us to examine the role of the fund’s domicile country characteristics in explaining
fund performance. To our knowledge, this feature is unique to our study of mutual fund per-
formance around the world. We use several country-level variables as explanatory variables
that are classified into five groups: economic development; financial development; investor
protection and quality of legal institutions; mutual fund industry development and concen-
tration. Table IV reports averages for the country-level variables. Panel B of Table A.3 in
the Appendix presents the country-level variables definitions.
We use gross domestic product per capita (GDP per capita) in U.S. dollars from the
12

World Development Indicators (WDI) database as a measure of economic development. An
additional measure of economic development is the ratio between number of internet users
and the population of a particular country, taken from WDI. The intensity of internet usage
is likely to be higher in countries with better informed investors and more sophisticated
investors.
We use two proxies for level of stock market development and liquidity. First, the share
turnover ratio, defined as the ratio of total value of stocks traded to market capitalization.
This variable is from the WDI database. The second variable is country-level trading costs
in basis points. We use the annual average transaction cost (including commissions, fees,
and price impact) from the Global Universe Data-ElkinsMcSherry database. Countries with
less developed markets are countries with higher trading costs (Malaysia, India, Thailand,
South Korea, and Taiwan), while more developed markets like the U.S. and Japan have lower
trading costs.
We consider three variables to proxy for investor protection and quality of legal institu-
tions. The first proxy for investor protection is a dummy variable that equals one if the legal
origin is common law, and zero if the legal origin is civil law. Common law systems provide
better legal protection to investors than civil law systems (see La Porta et al. (1997)). In our
sample we have nine countries with common law legal origin (Australia, Canada, India, Ire-
land, Malaysia, Singapore, Thailand, the U.K., and the U.S.). The second proxy is an index
of minority shareholder protection (anti-director rights) from Djankov et al. (2008). The
final variable is securities regulation, the combination of disclosure requirements, liability
standards, and public enforcement from La Porta, Lopez-de-Silanes, and Shleifer (2006).
Finally, we use variables to proxy for the level of a country’s mutual fund industry
development and concentration. The level of development of the mutual fund industry is
proxied by the age of industry measured in number of years since the first open-end fund
was sold in the country as reported in Khorana, Servaes, and Tufano (2005). To measure
industry concentration we use the Herfindahl Index, defined as the sum of the squared
13
market shares of portfolio management companies for equity funds in each country. The
Herfindahl Index is a common indicator of the level of concentration within an industry.
Higher values of the Herfindahl Index indicate higher industry concentration. Concentration
is higher in Indonesia, Portugal, and Belgium, and lower in the U.K., Australia, Canada,
France, and the U.S. We also use the relative mutual fund industry size as proxied by equity
assets under management scaled by stock market capitalization (mutual fund equity/market
capitalization) per country as an additional explanatory variable. The data on equity assets
under management are obtained from EFAMA and stock market capitalizations are obtained
from WDI.
3. Determinants of Fund Performance
We investigate the determinants of equity mutual fund performance. Following the large
majority of the mutual fund literature, we focus the analysis on domestic mutual funds, but
we also use international funds in some tests. We run separate regressions using U.S. and
non-U.S. funds that allow us to compare the determinants of the performance of funds in
the U.S. versus the rest of the world. All the regressions include time fixed effects (quarter
dummies) to account for cross-sectional dependence, and t-statistics are clustered at the
fund level to account for autocorrelation in fund performance. All explanatory variables are
lagged one-quarter.
3.1. FUND CHARACTERISTICS
Table V reports results of performance regressions using the Carhart four-factor model al-
phas as a measure of risk-adjusted performance. Later, we use alternative measures of per-
formance. Column (1) presents estimates for U.S. funds. Column (2) presents estimates for
non-U.S. funds using fund characteristics and country dummies as regressors. Columns (3)-
(6) present estimates for non-U.S. funds using fund and country characteristics as regressors.
We first discuss the effects of fund characteristics and then of country characteristics.
14
Fund Size. Mutual fund size has been one of the most studied variables in mutual
fund research, and the relation between fund size and performance still puzzles academics
and practitioners. Several studies try to answer questions such as: Does fund size affect
investors’ fund selection ability? Is management skill more pronounced when a fund is
small?
Large mutual funds present several advantages over small ones. First, larger funds are
able to spread fixed expenses over a larger asset base, and have more resources for research.
Managers of large funds can benefit from investment opportunities not available to smaller
funds. Large funds are able to negotiate better spreads, as they have larger positions and
trading volumes. Furthermore, brokerage commissions decline with the size of transactions
(Brennan and Hughes (1991)).
Large funds, however, face some problems and management challenges, and the scale-
ability of investments is a determinant of performance persistence (Gruber (1996) and Berk
and Green (2004)). While small funds can concentrate on a few investment positions, when
funds become large managers must continue to find good investment opportunities, and
the effect of managerial skill becomes diluted implying diseconomies of scale. Cremers and
Petajisto (2009) show that small funds are more active, while a significant fraction of large
active funds are close to index funds. Moreover, larger mutual fund managers must neces-
sarily trade larger volumes of stock, attracting the attention of other market participants
and therefore suffering higher price impact costs. Chen et al. (2004) name this effect the
liquidity constraints hypothesis.
Grinblatt and Titman (1989) and (1994) find mixed evidence on the relationship between
fund returns and fund size. More recently, Chen et al. (2004) find that fund returns decline
with lagged fund size. The results is most pronounced among funds that invest in small
and illiquid stocks, suggesting that adverse scale effects are related to liquidity. They also
suggest that in addition to liquidity, fund size erodes performance because of organizational
diseconomies. Pollet and Wilson (2008) find that the cause of diminishing returns to scale for
15
mutual funds is the inability to scale an investment strategy related to liquidity constraints as
the fund grows. They find that when a fund receives inflows it tends to scale up its positions
instead of diversifying into new assets. Edelen, Evans, and Kadlec (2007) and Yan (2008)
point out trading costs and liquidity as the primary source of diseconomies of scale for U.S.
funds. Outside the U.S., Dahlquist, Engström, and Söderlind (2000) find that larger equity
funds tend to perform more poorly than smaller equity funds in Sweden. Overall, evidence
on the size-performance relation is not unanimous, but recent work seems to support the
presence of diseconomies of scale.
Column (1) of Table V shows that fund size (TNA) is negatively related to fund perfor-
mance in the sample of U.S. funds. The TNA coefficient is negative and statistically signif-
icant for U.S. funds, -0.0675 with a t-statistic of -4.99. Thus, U.S. smaller funds perform
better than larger funds. Since the standard deviation of log of TNA is 2.20, a one-standard
deviation increase to fund size is associated with a decline in performance of 15 basis points
per quarter. These effects are economically significant if we take into consideration the aver-
age fund performance is near zero. This estimate of the diseconomies of scale to U.S. funds
is very close to the one reported in Chen et al. (2004).
There are reasons to believe that the result might be different outside the U.S., because of
the difference in size between U.S. funds and non-U.S. Indeed, the average fund is much bigger
in the U.S. than outside the U.S., as we have documented earlier. The results in column (2)
support a very different relation between performance and TNA for non-U.S. funds. Fund
size has a positive and statistically significant effect (the coefficient is 0.0517 with a t-statistic
of 4.58) on performance in the sample of non-U.S. funds. A one-standard deviation increase
in fund size is associated with an increase in abnormal performance of 11 basis points per
quarter. Larger non-U.S. funds seem to have better risk-adjusted performance than smaller
funds. We further explore the reasons behind this asymmetry on the relation between fund
performance and size in the next subsection. In particular, we test the hypothesis that
economies of scale are exhausted after a fund approaches a certain size in fund assets, as
16
U.S. funds are much bigger than non-U.S. funds.
Fund Family Size. Economies of scale and scope can exist at the fund family level.
Expenses like research and administrative expenses can be shared among funds. Larger fund
families can use the same economic data and experts to interpret data across many funds,
leading to economies of scope and higher returns. Large fund families also benefit from
economies of scale from trading commissions and lending fees (Chen et al. (2004)). Khorana
and Servaes (1999) in studying mutual fund starts find that large families and families that
have more experience in opening funds in the past are more likely to open new funds. This
is likely to happen because the cost of generating a new fund is lower for large companies, as
they can benefit from economies of scale and scope. Chen et al. (2004) find that fund family
size has a positive and statistically significant effect on performance, which they ascribe to
family size capturing economies of scale.9
We find that fund family size has a positive and statistically significant effect on perfor-
mance in the U.S. and elsewhere in the world (see Table V). Funds that perform better are
more likely to be managed by a larger company as family size has a positive effect on fund
abnormal performance. The effect of family size is statistically and economically significant,
and it is of similar magnitude in the U.S. and outside the U.S. Since the standard deviation
of log of family TNA is 2.51, a one-standard deviation increase in family size is associated
with an improvement in performance of 8 basis points per quarter. This estimate of the
economies of scale in fund families is similar to the one reported in Chen et al. (2004) for
U.S. funds. We conclude that the positive effect of family size on performance is pervasive
around the world.
Age. Fund age provides a measure of a fund’s longevity and its manager’s ability. The
effect of age on performance can run in both directions. One might argue that younger
mutual funds will be more agile and committed to achieve better performance to survive.
9Others suggest that larger families transfer performance from low-fee funds to high-fee funds, and they
are committed to create stars that generate inflows to the fund itself and to other funds in the family at the
expense of more poorly performing funds (Nanda, Wang, and Zheng (2004) and Gaspar, Massa, and Matos
(2006)).
17
On the other hand, youth may be a disadvantage, newer funds usually face higher costs
and suffer from lack of experience during the start-up period. Because of their small size,
newer mutual funds’ returns and ratings are also more vulnerable to manipulation. We
find no relation between age and performance of U.S. mutual funds in column (1), which is
consistent with the evidence in Chen et al. (2004) and others. In contrast, we find that newer
funds seem to perform better than older funds outside the U.S. Using the point estimate in
column (2), a one-standard deviation increase in fund age (log) is associated with a drop in
performance of 6 basis points per quarter of non-U.S. funds.
Expenses. The relation between mutual fund returns and expenses (including manage-
ment fees) provides a test of the value of active management. Mutual fund fees can be seen
as the price that uninformed investors pay to managers to invest their money. Expenses vary
considerably around the world. Khorana, Servaes, and Tufano (2009) find that large funds
and families charge lower fees, while funds distributed in more countries charge higher fees.
Furthermore, they find that fees are negatively related to investor protection. Empirical
evidence on the relation between mutual fund performance and fees is mixed. In a sample
of U.S. mutual funds, some authors find a negative relation of fees with net-fee performance
(Carhart (1997)) and even before-fee performance (Gil-Bazo and Ruiz-Verdu (2009)), while
others find no relationship between fees and performance (Chen et al. (2004)). Evidence
for European funds also seems to support a negative relation between fees and performance
(Dahlquist, Engström, and Söderlind (2000) and Otten and Bams (2002)). We find a nega-
tive relation between the expense ratio and net-of-fees performance. This relation, however,
is statistically insignificant for U.S. funds and only significant in some specifications for
non-U.S. funds. Thus, there is not consistent evidence of a statistically significant negative
relation between fees and performance.
Loads. Besides the expense ratio, funds commonly charge a load when investors purchase
(front-end load) or sell (back-end load) shares of the fund. The main goal of the back-end load
is to discourage redemptions. By making redemptions expensive, a mutual fund dissuades
18
investors from redeeming shares, and it is able to invest in a more risky portfolio to enhance
performance. The empirical evidence confirms that loads do dissuade redemptions in open-
ended funds, and that funds hold more cash when there is uncertainty about redemptions
(Chordia (1996)). Authors find no relation between performance and loads (Chen et al.
(2004)) or a negative relation (Carhart (1997) and Pollet and Wilson (2008)). We do not
find a statistically significant relation between performance and loads in our sample of U.S.
and non-U.S. funds.
Flows. According to the “smart money” hypothesis of Gruber (1996), investors can
detect skilled managers and direct their money to them. Therefore, fund flows should have
a positive correlation with future returns. Gruber (1996) and Zheng (1999) show that funds
experiencing net inflows (in the last three months) perform significantly better than funds
that experience outflows. However, Sapp and Tiwari (2004) argue that the “smart money”
effect is explained by momentum. We find no evidence of a statistically significant relation
between flows and subsequent performance in the sample of U.S. funds. Since we are using
the Carhart (1997) model to measure performance, this is consistent with the Sapp and
Tiwari (2004) argument. In contrast, we find that non-U.S. funds that receive more new
money perform better subsequently than those that receive less new money. Flows of the
previous period have a positive and statistically significant coefficient, indicating a “smart
money” effect. Using the specification in column (2), a one-standard deviation increase in
flows is associated with an improvement in subsequent performance of 20 basis points per
quarter. The evidence here supports the idea that investors are able to detect skilled fund
managers outside the U.S.
How robust are our smart money findings outside the U.S.? First, it should be recognised
that as our performance measures are momentum adjusted in our smart money regressions
that these results are not attributable to stock-level momentum. Second, it might be argued
that serial correlation in flows might inflate our t-statistics on lagged flows thereby biasing
us towards accepting the existence of smart money outside the U.S. Ferson, Sarkissian,
19
and Simin (2003) show that autocorrelation in independent variables in return regressions
may lead to spurious inference when levels of first order autocorrelation in the independent
variables are above 90% and when the 2 statistics in the regressions are less than 1%. For
our non-U.S. sample of funds, the average first order autocorrelation of flows across funds
is 0.25. In addition, the goodness of fit statistics for our non-U.S. performance regressions
in Table V are approximately 5%. Adding these findings to the fact that the t-statistics on
lagged flows in our performance regressions are extremely high (between 8.5 and 10) this
suggests that the incorrect inference problem suggested by Ferson, Sarkissian, and Simin
(2003) may not be a problem in our dataset. Our subsequent smart money results using
the Fama-MacBeth approach for the non-U.S. sample below also add credence to this. As
the time dimension is essentially removed when using this technique, our findings that we
still have a smart money effect outside the U.S. when using this approach suggest that our
smart money findings are not due to the persistence of flows. Third, as we are controlling for
lagged performance in these smart money regressions, differences in performance persistence
across countries do not account for our findings.
Past Performance. There is ample evidence of performance persistence in U.S. mutual
funds (Hendricks, Patel, and Zeckhauser (1993), Grinblatt and Titman (1994), Brown and
Goetzmann (1995), and Carhart (1997)). This persistence seems to be stronger among the
most poorly performing funds. Outside the U.S., Dahlquist, Engström, and Söderlind (2000)
do not find performance persistence for a sample of Swedish funds, and Otten and Bams
(2002) find performance persistence only for U.K. funds. We find evidence of persistence
in U.S. funds. The effect of past performance on future performance of U.S. funds is eco-
nomically meaningful. A one-standard deviation increase in past performance is associated
with an increase in subsequent performance of 27 basis points per quarter in the sample of
U.S. funds. Outside the U.S., persistence seems to be much weaker or even inexistent (the
coefficient is statistically insignificant in column (2) when the regression includes country
dummies).
20
Management Structure. While individual managers are free from group politics dif-
ficulties, teams of decision-makers have more resources and connections, which can help to
boost performance. Accordingly, funds managed by a team might perform better than funds
managed by an individual manager. On the other hand, small funds can easily be run by
a single manager, while a large fund usually cannot. Chen et al. (2004) suggest that larger
funds experience organizational diseconomies, especially hierarchy costs, as funds deal mainly
in soft-information. When a fund is co-managed, there is more competition to implement an
idea and managers may end up expending too much effort to convince others to implement
their ideas than they would if they controlled their own funds (Aghion and Tirole (1997)
and Stein (2002)). Chen et al. (2004) provide some evidence that size erodes fund perfor-
mance because of the interaction of liquidity and organizational diseconomies of scale. While
team management may have become increasingly popular in the mutual fund industry, U.S.
evidence shows that team-managed funds perform either no differently from (Bliss, Potter,
and Schwarz (2008)) or more poorly (Chen et al. (2004) and Massa, Reuter, and Zitzewitz
(2010)) than funds managed by a single manager. We find that funds managed by teams
(or more than one individual) show significantly worse performance than funds managed by
a single person. The difference in performance is also economically significant at roughly 14
basis points for U.S. funds and 11 basis points for non-U.S. funds using the specification in
column (2).
Number of Countries Where a Fund is Sold. We also analyze whether the number
of countries where a fund is sold helps to predict performance. There are two main reasons
why the number of countries where a fund is distributed can affect performance. First, selling
a fund in several countries should make the fund less sensitive to shocks in domestic flows.
If investors’ flows from different countries are not perfectly correlated, distributing the fund
in several countries makes the fund less cash flow volatile, reducing the cash position, and
enhancing performance. Second, it is well known that top-performing funds can originate a
substantial amount of inflows for a fund family (Nanda, Wang, and Zheng (2004)). Therefore,
21
fund families are likely to make star funds available in more countries in order to gain market
share and increase revenues. We find that the coefficient of number of countries where a fund
is sold is statistically insignificant for U.S. and non-U.S. funds (the effect is only significant
when we include country-level variables as regressors instead of country dummies). Thus,
there is weak evidence that funds distributed in several countries display better performance.
3.2. COUNTRY CHARACTERISTICS
We do not know of any study so far that documents the effects of country characteristics on
fund performance. Our sample covering a large cross-section of countries allows estimation of
the specifications using country-level variables (Table V, columns (3)-(6)). We do not include
U.S. funds in these regressions as they would represent a large fraction of the sample, but
we obtain similar results when we include them.
Economic Development. Economic development is associated with higher per capita
income and better education and skills, as well as with more developed industries and more
incentives for innovation and for new investments. Better financially educated and more
sophisticated investors are likely to evaluate fund performance and follow it more closely,
exerting some pressure on management for performance. Furthermore, managers are likely
to be more skilled in more developed countries, as populations are better educated and have
access to more learning opportunities. Developed countries also tend to attract high hu-
man capital individuals. Christoffersen and Sarkissian (2009) find that managers located
in financial centers in the U.S. display better performance. Therefore, a country’s level of
economic development might influence the performance of the mutual fund industry. We
find no evidence that a country’s level of economic development as measured by GDP per
capita is positively linked to fund performance. The relation is even negative and statisti-
cally significant sometimes. We conclude that broad economic development is not positively
associated with the performance of domestic mutual funds once we control for other aspects
of a country’s level of development. In contrast, we find that the intensity of internet usage
22

has a positive and statistically significant coefficient. This finding is consistent with the
idea that funds display better performance in countries where investors are better informed
and better educated and money managers have better skills and greater access to learning
opportunities.
Financial Development. A more developed financial market can have some advantages
for fund performance because of higher liquidity and lower transaction costs. Trading costs
are important in evaluating fund performance as they provide valuable information about
the extent of deterioration in performance from active trading. Clearly, actively managed
funds involve substantially higher trading costs (Kleim and Madhavan (1997)), and trading
costs are also related to fund size. As funds become larger, they will necessarily trade
larger volumes. Khorana, Servaes, and Tufano (2005) find that trading costs have a negative
impact on the development of the mutual funds industry. We find strong evidence of a
positive relation between trading activity and fund performance and a negative relation
between trading costs and fund performance. A one-standard deviation increase in share
turnover is associated with an improvement in performance of 38 basis points per quarter,
while a one-standard deviation reduction in trading costs is associated with an improvement
in performance of 26 basis points per quarter. Thus, the evidence indicates that the liquidity
of the local stock market plays a prominent role in improving the performance of funds that
invest in local stocks.
Investor Protection and Quality of Legal Institutions. Differences in laws and
regulations can affect investor behavior. Investors will be reluctant to invest in markets
where their rights are not properly protected. La Porta et al. (1997) note that countries
with poor investor protection have significantly smaller debt and equity markets. They also
observe that the quality of the legal system is important for the enforcement of contracts
and also captures the government’s general attitude toward business. Accordingly, we expect
to find that mutual fund performance is positively related to investor protection and the
quality of a country’s legal institutions. We use three different variables to proxy for investor
23

protection and the quality of legal institutions. We first use a country’s legal origin, which
has been linked to the quality of legal institutions and investor protection. The common law
dummy variable has a positive and statistically significant coefficient in column (3). Thus,
there is evidence that domestic mutual funds perform better when investor protection is
stronger. The effect of legal origin is economically strong. Funds domiciled in countries with
a common law legal origin outperform funds domiciled in countries with civil legal origin by
63 basis points per quarter. In columns (4)-(6), we use the anti-director rights index and the
securities regulation index to capture other aspects of a country’s legal environment such as
protection of minority shareholder interests and the quality of securities market regulations.
In every case, we find evidence of a positive effect on fund performance. For example, an
increase in the number of shareholder protection mechanisms from three to five enhances
fund performance by approximately 60 basis points per quarter.
Mutual Fund Industry Development and Concentration. Mutual funds have been
one of the fastest growing types of financial intermediary. This is a relatively recent trend
in a significant number of countries vis-à-vis the U.S. The older the industry, the greater
the investors’ experience, and the more investment there will be in mutual funds (Khorana,
Servaes, and Tufano (2005)). Mutual fund managers will also be more experienced. We
hypothesize that the older the industry, the more efficient the fund industry will be, and
this may lead to better performance. We do not find empirical support for the hypothesis
that older industries display better performance. In a competitive industry, mutual fund
firms might feel pressure for their funds to perform well. One might also argue that in a
more competitive industry it is harder to achieve abnormal performance. We find a positive
relation between mutual fund industry concentration and the performance of domestic funds.
Overall, we do not find evidence that industry development and lack of concentration enhance
the performance of domestic funds.
Finally, we take into account the size of the equity mutual fund industry relative to
the pool of underlying assets (proxied by equity assets under management scaled by stock
24
market capitalization per country). The coefficient on the relative mutual fund industry size
(mutual fund equity/market capitalization) is negative and statistically significant. This is
consistent with the notion that in countries where the relative equity mutual fund industry
size is greater there are fewer unexploited arbitrage opportunities. It is worth noting that
the coefficient on lagged fund TNA remains positive and statistically significant for non-U.S.
funds after controlling for relative equity mutual fund industry size. This indicates that a
less competitive capital allocation in the mutual fund industry is not responsible for the lack
of diminishing returns to scale outside of the U.S.
What do these findings tell us about how fund growth affects fund performance outside
the U.S.? When funds increase in size, the impact of that growth on their performance
depends on a fund-level and an industry-level effect. If funds grow at the expense of their
rivals so that relative industry size is unchanged, we need only worry about the fund-level
effect. The coefficient on individual fund size tells us that growth is likely to lead to improved
performance for small funds, and unlikely to do so for larger ones. However, if funds grow
by bringing new money into the fund sector, thus increasing relative fund industry size,
then the industry-level effect will also come into play. In this case, the impact of their
growth on performance will depend on the relative magnitudes of the diminished arbitrage
opportunities (the industry-level effect) versus the potential cost reductions from being a
larger fund (the fund-level effect).
In summary, our research suggests that mutual fund performance is related to both fund
and country characteristics. There is evidence that funds from larger fund families and
solo-managed funds have higher risk-adjusted returns around the world. These findings are
consistent with the evidence for U.S. funds. There are, however, important distinctions
between the determinants of performance in the U.S. and elsewhere in the world. There is
evidence of diseconomies of scale only in the U.S., while there is evidence of economies of
scale outside the U.S. We find that the “smart money” effect is only present outside the
U.S., while performance persistence is a characteristic specific of the U.S. fund industry. In
25
terms of country characteristics, local stock market liquidity, investor protection and law
enforcement, and industry concentration have a positive effect on the performance of funds
that invest in local stocks.
3.3. WHY ARE THERE DISECONOMIES OF SCALE IN THE U.S. MUTUAL FUND
INDUSTRY?
We have documented the existence of diseconomies of scale in the U.S. mutual fund industry,
while there is evidence of economies of scale outside the U.S. In this section, we aim to
understand the reasons behind this asymmetry. We leave other differences in terms of return
persistence and “smart money” effect for future research.
We test two main hypothesis to explain the asymmetry in the relation between perfor-
mance and size between U.S. and non-U.S. domestic funds. A first hypothesis comes from
the fact that U.S. funds are much larger than elsewhere in the world (the average U.S. do-
mestic fund is more than five times larger than the average non-U.S. domestic fund in our
sample; see Table III). The difference in size between U.S. and non-U.S. domiciled funds is
striking if we look at the top 100 funds in terms of total net assets (TNA) at the end of 2007.
There are only nine non-U.S. funds among the top 100 domestic funds. The largest fund in
our sample is the American Growth Fund of America with a TNA of $194 billion, while the
largest non-U.S. fund is the Invesco Perpetual High Income with a TNA of $19 billion and
a rank of 26th.
We sort mutual funds in each quarter based on the quintile rankings of their TNA. We
perform the sort not only for domestic funds, but also for international funds as we use these
funds in this section to better understand the asymmetry between the U.S. and the rest of the
world in terms of the relation between fund performance and size. Table VI presents number
of funds and mean TNA for each fund size quintile separately for domestic funds (Panel A)
and international funds (Panel B) and within each of these groups separately for U.S. and
non-U.S. funds. Notice that the size quintile rankings are solely based on funds within each
26
subgroup (e.g., U.S. domestic funds). In each quarter, there are on average about 400 U.S.
and non-U.S. domestic funds in each fund size quintile. There is a substantial spread in TNA
between the bottom and top size quintiles. Domestic funds in the bottom quintile have an
average TNA of $13 million in the U.S., whereas the ones in the top quintile have an average
TNA of over $4 billion. There is also a significant spread for non-U.S. domestic funds.
Funds in the bottom quintile have an average TNA of $2 million and in the top quintile
$726 million. We can also see that there is a dramatic difference between the average TNA
of U.S. and non-U.S. funds across all quintiles. The U.S. fund size quintiles have an average
TNA more than five times larger than the corresponding non-U.S. fund size quintiles. The
fund size quintiles of international funds in Panel B shows no significant differences between
the average TNAs of domestic and international funds in the U.S. as well as outside the U.S.
Thus, domestic and international funds have comparable scale of operations.
A second hypothesis suggests that liquidity constraints play an important role in explain-
ing the lack of scale-ability of fund investments in the U.S. mutual fund industry (Chen et al.
(2004) and Pollet and Wilson (2008)). This hypothesis is supported by the fact that large
U.S. domestic funds that have to invest, by virtue of their style, in small and illiquid stocks
are the most affected by scale, and the inability to scale an investment strategy as the fund
grows due liquidity constraints. This hypothesis is consistent with the arguments of Berk
and Green (2004) that small funds can concentrate on a few investment positions, but when
funds become large managers must continue to find good investment opportunities, and the
effect of managerial skill becomes diluted. We have documented that U.S. domestic funds
play more small and illiquid stock than funds located elsewhere in the world (see Table II).
This could contribute to hurt performance as the scale of the fund increases. Thus, liquidity
constraints are put forward as a plausible explanation to the different relation between fund
performance and size in the U.S. and outside the U.S.
Table VII presents the results of the regression tests similar to the ones in Table V but
designed to test our hypotheses. We focus the analysis on the fund size coefficient, but
27
the regressions in Table VII include the explanatory variables (coefficients not shown) used
in Table V. In columns (1)-(5) we test the hypothesis that the asymmetry is explained by
the fact that U.S. funds are much larger than non-U.S. funds. In columns (6) and (7) we
test the liquidity constraints hypothesis. Finally, in columns (8)-(9) we use the sample of
international funds as an experimental ground to test the hypotheses.
Columns (1) and (2) present the results for the samples of U.S. and non-U.S. domestic
funds excluding funds in the bottom fund size quintile. Therefore, we focus the analysis in
the subsamples of funds in fund size quintiles two through five. This subsample addresses the
concern that there is a systematic upward bias in the reported returns of small funds (e.g.,
Elton, Gruber, and Blake (2001)). This bias is potentially problematic for the analysis of the
relation between size and performance, especially given the U.S. evidence of diseconomies of
scale. In column (1) the coefficient on TNA is negative and statistically significant in the
sample of U.S. funds, which is consistent with the evidence for the sample of all funds. In
column (2) we can see that the positive relation between fund performance and size outside
the U.S. is explained by the funds in the bottom fund size quintile. Indeed, there is a
statistically insignificant relation between fund performance and size when we exclude the
non-U.S. funds in the bottom size quintile. It is important to note that even in this case we
do not find evidence of diminishing returns to scale outside the U.S.
Columns (3)-(5) present results for the sample of U.S. domestic funds excluding the largest
funds. The goal is to evaluate the relation between performance and size for a sample of U.S.
funds that is comparable with non-U.S. funds in terms of size. We perform this test using
three alternative procedures. In column (3) we estimate the performance regression using a
subsample that excludes the funds in the top fund size quintile (i.e., subsample of funds in
size quintiles one through four). In column (4) we estimate the performance regression using
a subsample that excludes funds in the top fund size quintile but with the TNA breakpoint
given by non-U.S. funds (i.e., subsample of funds with TNA below the TNA of the non-
U.S. funds in the top fund quintile). In column (5) we restrict the sample of U.S. funds to
28
only contain funds with TNA below the TNA of the largest non-U.S. fund in each quarter.
The results in columns (3)-(5) still show evidence of diseconomies of scale in the U.S. fund
industry. Thus, the evidence does not support the hypothesis that diseconomies of scale are
driven by the fact that U.S. funds are much larger than their non-U.S. counterparts.
In columns (6) and (7) we directly test the liquidity constraints hypothesis. We identify
funds in our sample that invest more in large stocks (large cap fund) and funds that invest
more in small stocks (small cap funds). We define a large cap fund dummy that takes the
value of one if a fund is below the median factor loading, and takes the value of
zero if a fund is above the median factor loading in each quarter. We define this
dummy separately for U.S. and non-U.S. funds. We augment the regressions specification
by including the large cap fund dummy and an interaction term (TNA × Large cap fund)
that measures the difference between large cap and small cap funds in terms of the relation
between performance and TNA. The liquidity hypothesis predicts the sign of the interaction
term to be positive since in large cap funds there should be less of an adverse effect of
fund size on performance than in small cap funds. The results in column (6) for U.S. funds
support this hypothesis as the interaction term is positive and statistically significant. The
TNA coefficient, which registers the effect of size on performance for small cap funds, is
negative and statistically significant. In column (7) we can see that there is not similar
evidence in the sample of non-U.S. funds. The interaction term is statistically insignificant
for non-U.S. funds as they load less in small stocks and therefore they are not as much
affected by liquidity constraints when they grow. We conclude that the evidence from our
worldwide sample of funds supports the liquidity constraints hypothesis, which is consistent
with the U.S. evidence in Chen et al. (2004).
It could be argued that the liquidity of U.S. small stocks might not be that low particularly
when compared to the liquidity of the average stock from less liquid stock markets. How
does the liquidity of U.S. small stocks compare to average stock liquidity across the countries
in our sample? We address this question using two commonly used measures of liquidity
29
namely effective spreads and share turnover.
The Securities and Exchange Commission (2001) (SEC) stock exchange liquidity report
presents effective trading spreads for small-cap stocks that trade on the NYSE and Nasdaq
(defined to have a market capitalization of less than $200 million) using data from June
2000 (the start of our sample period).10 The study reports that small-cap stocks have
effective trading spreads of 0.85% for NYSE stocks and 1.67% for Nasdaq stocks. Jain
(2003) presents statistics on effective trading spreads on stock markets around the world
estimated at approximately the same time in 2000. Based on these figures, in our sample of
countries, 15 countries have lower average effective trading spreads than U.S. small stocks
traded on the NYSE and 26 countries have average effective trading spreads lower than U.S.
small stocks traded on the Nasdaq. The countries with the higher average liquidity than
U.S. small cap stocks also turn out to be the countries with the largest fund management
industries. Even if we take the NYSE alone as our U.S. small stock liquidity benchmark, it
turns out that 88% of fund assets under management (based on Table I) outside the U.S.
come from countries where average liquidity is higher than U.S. small stock liquidity, which
is explained by the fact that the largest fund industries outside the U.S. are also the most
liquid.
As a cross-check we also compare the share turnover per country used in our regressions
with the share turnover of U.S. small stocks. We again define “a small stock” as having a
market capitalization of less than $200 million following the SEC definition above. Using
CRSP share volume data, the average share turnover for U.S. small stocks during our sample
period (2000-2007) is 94% per year. Comparing this figure with our share turnover figures
for other countries in Table IV, we find that 12 countries have average share turnover that
is higher than that of U.S. small stocks and that these 12 countries manage the majority of
assets under management outside the U.S. based on the TNA data presented in Table I.
10Effective trading spreads are often argued to be more relevant than liquidity measures calculated from
quotes as they measure liquidity by calculating how far away transaction prices are from quoted mid-point
prices.
30
These liquidity comparisons suggest that a substantial number of countries in our sample
have higher liquidity than U.S. small stocks. These countries account for the lion’s share of
assets under management of the non-U.S. mutual fund industry. Although there are some
countries with lower liquidity than U.S. small stocks, these countries are the ones with the
smallest mutual fund industries.
We next test the hypotheses using as a laboratory international funds. These funds face a
diverse trading environment and investor clientele. In particular, liquidity constraints, which
seem to be the reason for diminishing returns to scale observed in U.S. domestic funds, are
likely to be less severe for international funds that can invest in a broader geographic region
(or even anywhere in the world in the case of global funds). One particular acute liquidity
constraint that can negatively affect fund performance is the lack of new investment oppor-
tunities. When current investment opportunities have been fully exploited, fund managers
need to “go down their list” to the next-best stock (Pollet and Wilson (2008)). We argue
that this constraint is less severe in international funds. Thus, we expect to find weaker
evidence of diseconomies of scale (or even no relation between fund performance and size) in
the sample of international funds. Furthermore, international funds can provide new insights
about the hypothesis that U.S. funds are too large. U.S. international funds’ average TNA
is similar to the average U.S. domestic funds’ TNA, and this is also true across all fund
size quintiles (see Table VI). If the reason behind the diminishing returns to scale in U.S.
domestic funds is that they are too big, then we should also find evidence of diminishing
returns to scale in U.S. international funds.
Columns (8) and (9) present the results of the international funds performance regressions
for U.S.-domiciled funds and non-U.S.-domiciled funds. To examine the determinants of the
performance of funds that invest overseas, we use both domestic and foreign benchmarks
(Griffin (2002)). Thus, we expand the four-factor Carhart (1997) model to include foreign
, and factors. The foreign factors are value-weighted averages of all
31
countries’s factors excluding the fund domicile country.11
We find that fund size is insignificantly related to performance in the sample of interna-
tional U.S. funds. In the sample of non-U.S. funds, fund size is also insignificantly related to
performance. This is an interesting finding since U.S. international funds size quintiles are
also similar to the ones of U.S. domestic funds (see Table VI). Furthermore, there are some
countries where international funds are as large as domestic funds or even larger on average
(e.g., the Netherlands). We therefore again conclude that the hypothesis that diminishing
returns to scale is due to the fact that U.S. domestic funds are too big is not supported by the
data. U.S. international fund are as big as their domestic counterparts and they do not face
diminishing returns to scale. Our findings suggest that U.S. international funds seem to face
less severe liquidity constraints, as managers have more investment opportunities available
as they can invest anywhere in the world. U.S. domestic funds by contrast seem to face more
severe liquidity constraints as they can invest only in domestic stocks. The different relation
between fund size and performance for funds with different geographic style supports the
idea that liquidity constraints play an important role in explaining the diseconomies of scale
in U.S. domestic mutual funds.
Our empirical findings are informative about the relevance of the Berk and Green (2004)
model around the world. The central mechanism in their model is the negative feedback loop
between past and future fund performance. Past performance affects fund flows as investors
chase performance, which affects fund size. This change in fund size then adversely affects
subsequent performance as the model assumes decreasing returns to scale. As we find that
U.S. funds have decreasing returns to scale, we might expect the Berk and Green (2004)
mechanism to be relevant in the U.S. context.
As regards the relevance of the model outside the U.S., our results demonstrate that
whether the Berk and Green (2004) mechanism fails or not depends on the origins of inflows
11Alternatives to an international benchmark model include world factor model (factors are aggregated
across all countries), regional factors model (factors are aggregated by geographic regions), or only foreign
factors model. We obtain consistent results using these variations to adjust performance for risk.
32
resulting from past fund performance. If inflows are the result of money being moved out
of other funds, then funds will get larger individually but (relative) industry size will be
unaffected. In this case, fund performance will not decline following flows and may even
improve meaning that the Berk and Green (2004) mechanism will fail to work; favorable
past fund performance will not adversely affect subsequent performance. However, if funds
grow by bringing new money into the fund sector increasing relative fund industry size,
then the impact of this on their performance will depend on the impact of fewer arbitrage
opportunities (the industry-level effect) versus the potential cost reductions from being a
larger fund (the fund-level effect). In this case, the relative magnitudes of these effects will
determine if there are decreasing returns to scale and whether the Berk and Green (2004)
mechanism will fail to work or not.
3.4. ROBUSTNESS CHECKS
We provide several robustness checks of our main findings. Table VIII reports the results of
robustness checks of the domestic funds performance regressions in Table V. Columns (1)-(5)
present the results for U.S. funds and columns (6)-(11) present the results for non-U.S. funds.
We first consider several alternative models to estimate abnormal performance in columns
(1) and (2) and columns (6) and (7). Here we use benchmark-adjusted returns, and alphas
estimated using the market model.12 The results are consistent with the results using the
Carhart four-factor model except for the “smart money” effect in non-U.S. funds that is no
longer statistically significant. There is evidence of diseconomies of scale in U.S. funds, while
the performance of non-U.S. funds does not deteriorate with the size of the fund. Family
size, past performance, and number of countries sold are positively related to performance.
Management by teams negatively affects fund performance.
Columns (3) and (8) report results of tests using before-fee performance (gross returns)
rather than after-fee performance. Monthly gross fund returns are calculated by adding back
12Results (untabulated) using market-adjusted returns are similar to those using market model alphas.
33
expenses to net fund returns; we take the annual expense ratio and divide it by 12, and add
it to monthly returns during the year. The results are consistent with our primary findings
except for one notable difference. The relation between fees and before-fee performance
is now positive and statistically significant, while the relation between fees and after-fee
performance is negative. This suggests that higher-priced management, as measured by the
expense ratio, can generate higher gross returns, but returns are not high enough to cover
the fees. Our finding indicates that funds with higher fees are expected to have superior
performance. Thus, we do not confirm the evidence in Gil-Bazo and Ruiz-Verdu (2009) for
U.S. funds using a worldwide sample of domestic funds.
Columns (4) and (9) report results using the Fama-MacBeth estimation procedure to
further address concerns on cross-sectional dependence. Columns (5) and (10) present esti-
mates including two lags of quarterly fund flows and performance as explanatory variables to
address concerns that performance and flows persistence could bias the coefficients. Finally,
column (11) presents estimates with t-statistics clustered by country to address concerns
that residuals are correlated within a country. Overall, the results confirm an asymmetric
relation between fund size and performance between the U.S. and elsewhere in the world.
There is also consistent evidence concerning return persistence and team-managed funds,
while there is no evidence of a statistically significant negative effect of fees on performance.
Moreover, there is evidence of a “smart money” effect in non-U.S. funds, while this is not the
case in U.S. funds. In particular, differences in performance and flows persistence between
the U.S. and elsewhere in the world do not explain the differences in the “smart money”
effect.
4. Conclusion
This study investigates the determinants of mutual fund performance around the world using
a large sample of open-end actively managed equity funds in 27 countries over the 1997-2007
period. We find that equity mutual funds around the world underperform the market. There
34
are common determinants of the performance of mutual funds in the U.S. and elsewhere in
the world, but there are also some important differences.
The U.S. evidence of diminishing returns to scale is not an universal truth. We find that
fund size is negatively related to fund performance only in the sample of U.S. funds; for non-
U.S. funds, we find that fund size is associated with better performance. The asymmetry
in the fund performance-size relation between U.S. and non-U.S. funds is not explained
by the fact that U.S. funds are too big vis-à-vis non-U.S. funds. The evidence supports
the hypothesis that liquidity constraints explain why U.S. domestic funds are affected by
diminishing returns to scale. Indeed, U.S. funds that invest in small and illiquid stocks
are the most negatively affected by scale, while this is not the case with non-U.S. funds.
Moreover, the performance of international funds does not deteriorate with scale, although
the scale of operations of these funds is similar to the one of domestic funds. We argue that
international funds are less affected by a lack of new investment opportunities as the fund
grows, as they are not restricted to invest in their local market. We conclude that diminishing
returns to scale in the U.S. mutual fund industry are related to liquidity constraints faced
by funds that, by virtue of their style, have to invest in small and domestic stocks.
Other fund characteristics are also important in explaining performance. The effects
of the organization of the mutual fund industry on performance are pervasive around the
world. Mutual funds managed by large fund families display superior performance and
therefore scale is not necessarily bad for performance. Solo-managed mutual funds tend to
perform better, which indicates that the possible benefits associated with team-managed
funds are exceeded by the costs, in particular hierarchy costs associated with processing soft
information. Additionally, we find evidence of short-run persistence in fund performance,
but only in the sample of U.S. funds. Investors outside the U.S. seem to have some ability
to select funds, as money flows to funds with good future performance, but this does not
hold true in the sample of U.S. funds.
Country characteristics are able to explain mutual fund performance beyond fund charac-
35

teristics. There is a positive relation between mutual fund performance and a country’s level
of financial development, especially stock market liquidity. Furthermore, domestic funds
located in countries with stronger legal institutions, better investor protection, and more
rigorous law enforcement tend to perform better. We conclude that the home trading en-
vironment and the legal environment are important in explaining mutual fund performance
across countries.
36
References
Aghion, P. and Tirole, J. (1997) Formal and real authority in organizations, Journal of
Political Economy 105, 1-29.
Berk, J. and Green R. (2004) Mutual fund flows and performance in rational markets, Journal
of Political Economy 112, 1269-1295.
Bird, R., Chin, H., and McCrae, M. (1983) The performance of Australian superannuation
funds, Australian Journal of Management 8, 49-69.
Blake, D. and Timmermann, A. (1998) Mutual fund performance: Evidence for the UK,
European Finance Review 2, 57-77.
Bliss, R., Potter, M., and Schwarz, C. (2008) Performance characteristics of individual versus
team-managed mutual funds, Journal of Portfolio Management 34, 110-119.
Brennan, M. and Hughes, P. (1991) Stock prices and the supply of information, Journal of
Finance 46, 1665-1691.
Brown, S. and Goetzmann, W. (1995) Performance persistence, Journal of Finance 50,
679-698.
Brown, S., Goetzmann, W., Ibbotson, R., and Ross, S. (1992) Survivorship bias in perfor-
mance studies, Review of Financial Studies 5, 553-580.
Cai, J., Chan, K. C., and Yamada, T. (1997) The performance of Japanese mutual funds,
Review of Financial Studies 10, 237-273.
Carhart, M., (1997) On persistence in mutual fund performance, Journal of Finance 52,
57-82.
Chen, J., Hong, H., Huang, M., and Kubik, J. (2004) Does fund size erode performance? Liq-
uidity, organizational diseconomies, and active money management, American Economic
Review 94, 1276-1302.
37
Chevalier, J. and Ellison, G. (1997) Risk taking by mutual funds as a response to incentives,
Journal of Political Economy 105, 1167-1200.
Chordia, T. (1996) The structure of mutual fund charges, Journal of Financial Economics
41, 3-39.
Christoffersen, S. and Sarkissian, S. (2009) City size and fund performance, Journal of
Financial Economics 92, 252-275.
Cremers, M. and Petajisto, A. (2009) How active is your fund manager? A new measure
that predicts performance, Review of Financial Studies 22, 3329-3365.
Dahlquist, M., Engström, S., and Söderlind, P. (2000) Performance and characteristics of
Swedish mutual funds, Journal of Financial and Quantitative Analysis 35, 409-423.
Dermine, J. and Roller, L.H. (1992) Economies of scale and scope in French mutual funds,
Journal of Financial Intermediation 2, 83-93.
Djankov, S., La Porta, R., Lopez-de-Silanes, F., and Shleifer, A. (2008) The law and eco-
nomics of self-dealing, Journal of Financial Economics 88, 430-465.
Edelen, R., Evans, R., and Kadlec G. (2007) Scale effects in mutual fund performance: The
role of trading costs, working paper, Boston College.
Elton, E., Gruber, M., and Blake, C. (2001) A first look at the accuracy of the CRSP mutual
database and a comparison of the CRSP and morningstar mutual fund databases, Journal
of Finance 56, 2415-2430.
European Fund and Asset Management Association (2008) International Statistical Release.
Fama, E. and French, K. (1992) The cross-section of expected stock returns, Journal of
Finance 47, 427-465.
Ferson, W., Sarkissian, S., and Simin, T. (2003) Spurious regressions in financial economics,
Journal of Finance 58, 1393-1413.
38

Gaspar, J. M., Massa, M., andMatos, P. (2006) Favoritism in mutual fund families? Evidence
on strategic cross-fund subsidization, Journal of Finance 61, 73-104.
Gil-Bazo, J. and Ruiz-Verdu, P. (2009) Yet another puzzle? The relation between price and
performance in the mutual fund industry, Journal of Finance 64, 2153-2183.
Griffin, J. (2002) Are the Fama and French factors global or country specific?, Review of
Financial Studies 15, 783-803.
Grinblatt, M. and Titman, S. (1989) Mutual fund performance: An analysis of quarterly
portfolio holdings, Journal of Business 62, 393-416.
Grinblatt, M. and Titman, S. (1994) A study of monthly mutual fund returns and portfolio
performance evaluation techniques, Journal of Financial and Quantitative Analysis 29,
419-444.
Gruber, M. (1996) Another puzzle: The growth in actively managed mutual funds, Journal
of Finance 51, 783-807.
Grunbichler, A. and Pleschiutschnig, U. (1999) Performance persistence: Evidence for the
european mutual funds market, working paper, University of St. Gallen.
Hendricks, D., Patel, J., and Zeckhauser, R. (1993) Hot hands in mutual funds: Short-run
persistence of relative performance 1974-1988, Journal of Finance 48, 93-130.
Ippolito, R. (1989) Efficiency with costly information: A study of mutual fund performance,
Quarterly Journal of Economics 104, 1-23.
Investment Company Institute (2008) Factbook.
Jain, P. (2003) Institutional design and liquidity at stock exchanges around the world, work-
ing paper, University of Memphis.
Jegadeesh, N. and Titman, S. (1993) Returns to buying winner and selling losers: Implica-
tions for stock market efficiency, Journal of Finance 48, 65-91.
39
Jensen, M. (1968) The performance of mutual funds in the period 1945-1964, Journal of
Finance 23, 389-416.
Keim, D. and Madhavan, A. (1997) Transaction costs and investment style: An inter-
exchange analysis of institutional equity trades, Journal of Financial Economics 46,
265-292.
Khorana, A. and Servaes, H. (1999) The determinants of mutual fund starts, Review of
Financial Studies 12, 1043-1074.
Khorana, A., Servaes, H., and Tufano, P. (2005) Explaining the size of the mutual fund
industry around the world, Journal of Financial Economics 78, 145-185.
Khorana, A., Servaes, H., and Tufano, P. (2009) Mutual fund fees around the world, Review
of Financial Studies 22, 1279-1310.
La Porta, R., Lopez-de-Silanes, F., and Shleifer, A. (2006) What works in securities laws?,
Journal of Finance 61, 1-32.
La Porta, R., Lopez-de-Silanes, F., Shleifer, A., and Vishny, R. (1997) Legal determinants
of external finance, Journal of Finance 52, 1131-1150.
Malkiel, B. (1995) Returns from investing in equity mutual funds, 1971-1991, Journal of
Finance 50, 549-573.
Massa, M., Reuter, J., and Zitzewitz, E. (2010) When should firms share credit with employ-
ees? Evidence from anonymously managedmutual funds, Journal of Financial Economics
95, 400-424.
Nanda, V., Wang, J., and Zheng, L. (2004) Family values and the star phenomenon: Strate-
gies of mutual fund families, Review of Financial Studies 17, 667-698.
Otten, R. and Bams, D. (2002) European mutual fund performance, European Financial
Management 8, 75-101.
40
Panetta, F. and Cesari, R. (2002) The performance of Italian equity funds, Journal of Bank-
ing and Finance 26, 99-126.
Pollet, J. and Wilson, M. (2008) How does size affect mutual fund behavior?, Journal of
Finance 63, 2941-2969.
Sapp, T. and Tiwari, A. (2004) Does stock return momentum explain the "smart money"
effect?, Journal of Finance 59, 2605-2622.
Sirri, E. and Tufano, P. (1998) Costly search and mutual fund flows, Journal of Finance 53,
1589-1622.
Stein, J. (2002) Information production and capital allocation: Decentralized versus hierar-
chical firms, Journal of Finance 57, 1891-1921.
Securities and Exchange Commission (2001) Report on the comparison of order executions
across equity market structures.
Yan, X. (2008) Liquidity, investment style, and the relation between fund size and fund
performance, Journal of Financial and Quantitative Analysis 43, 741-768.
Zheng, L. (1999) Is money smart? A study of mutual fund investors’ fund selection ability,
Journal of Finance 54, 901-933.
41
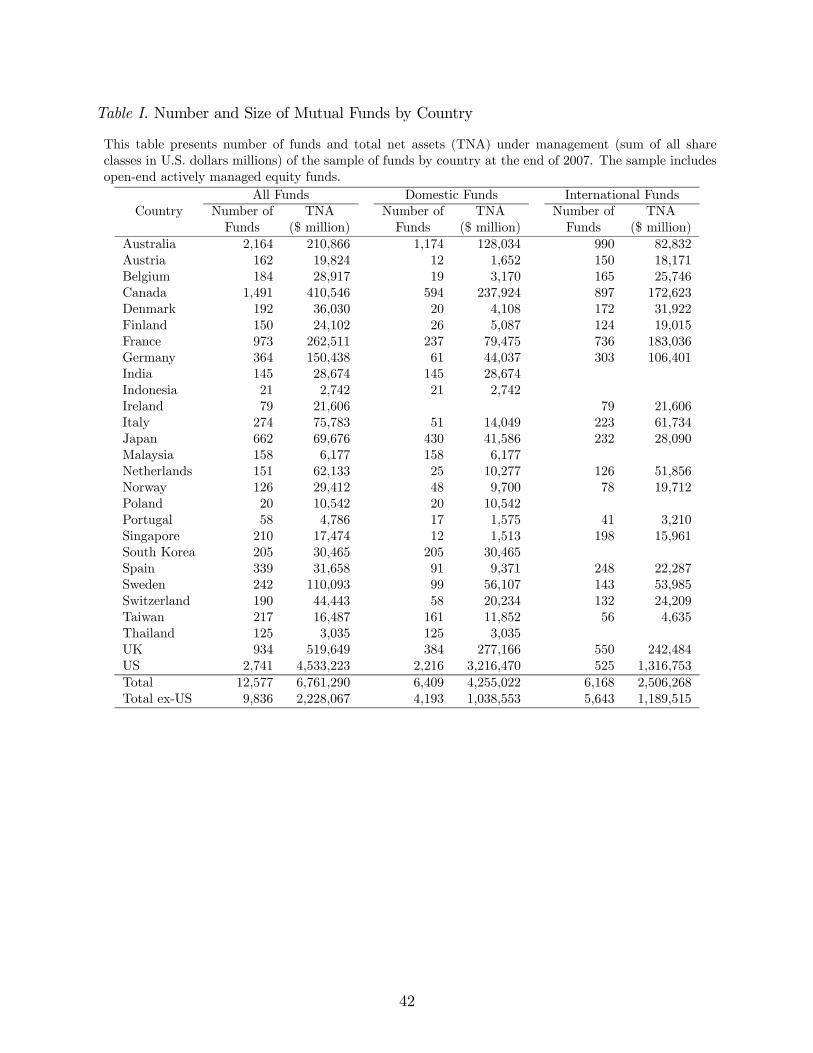
Table I. Number and Size of Mutual Funds by Country
This table presents number of funds and total net assets (TNA) under management (sum of all share
classes in U.S. dollars millions) of the sample of funds by country at the end of 2007. The sample includes
open-end actively managed equity funds.
All Funds Domestic Funds International Funds
Country Number of TNA Number of TNA Number of TNA
Funds ($ million) Funds ($ million) Funds ($ million)
Australia 2,164 210,866 1,174 128,034 990 82,832
Austria 162 19,824 12 1,652 150 18,171
Belgium 184 28,917 19 3,170 165 25,746
Canada 1,491 410,546 594 237,924 897 172,623
Denmark 192 36,030 20 4,108 172 31,922
Finland 150 24,102 26 5,087 124 19,015
France 973 262,511 237 79,475 736 183,036
Germany 364 150,438 61 44,037 303 106,401
India 145 28,674 145 28,674
Indonesia 21 2,742 21 2,742
Ireland 79 21,606 79 21,606
Italy 274 75,783 51 14,049 223 61,734
Japan 662 69,676 430 41,586 232 28,090
Malaysia 158 6,177 158 6,177
Netherlands 151 62,133 25 10,277 126 51,856
Norway 126 29,412 48 9,700 78 19,712
Poland 20 10,542 20 10,542
Portugal 58 4,786 17 1,575 41 3,210
Singapore 210 17,474 12 1,513 198 15,961
South Korea 205 30,465 205 30,465
Spain 339 31,658 91 9,371 248 22,287
Sweden 242 110,093 99 56,107 143 53,985
Switzerland 190 44,443 58 20,234 132 24,209
Taiwan 217 16,487 161 11,852 56 4,635
Thailand 125 3,035 125 3,035
UK 934 519,649 384 277,166 550 242,484
US 2,741 4,533,223 2,216 3,216,470 525 1,316,753
Total 12,577 6,761,290 6,409 4,255,022 6,168 2,506,268
Total ex-US 9,836 2,228,067 4,193 1,038,553 5,643 1,189,515
42
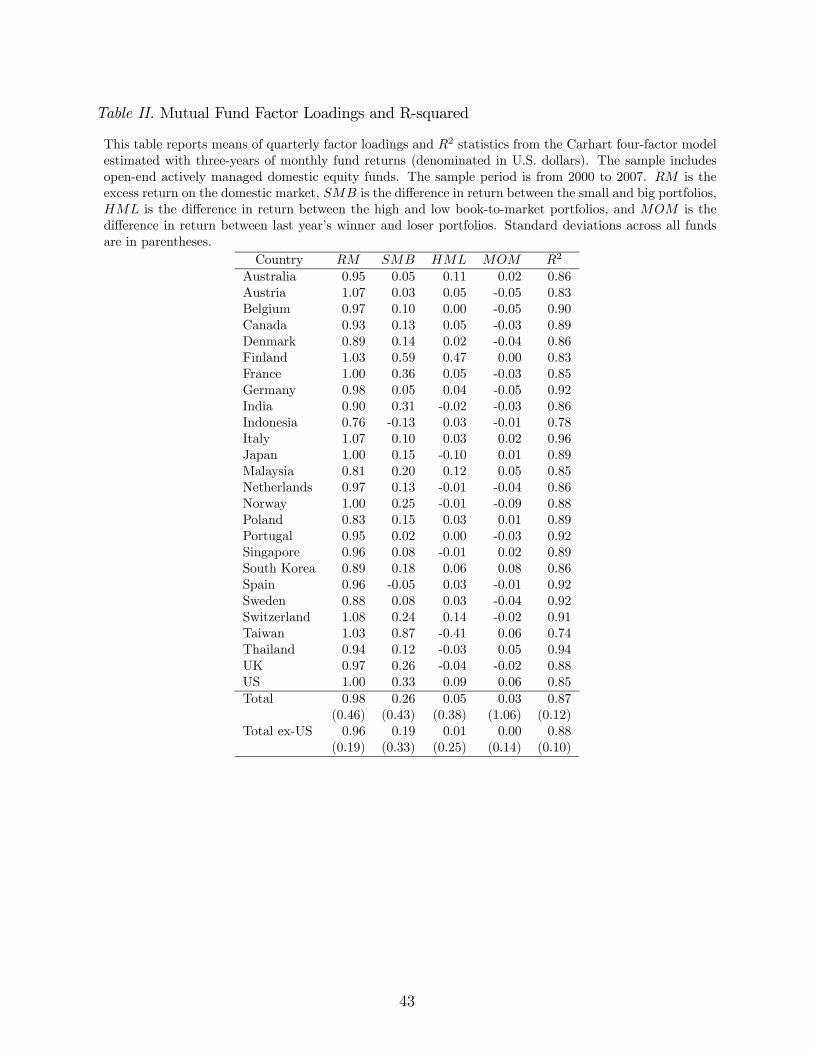
Table II. Mutual Fund Factor Loadings and R-squared
This table reports means of quarterly factor loadings and 2 statistics from the Carhart four-factor model
estimated with three-years of monthly fund returns (denominated in U.S. dollars). The sample includes
open-end actively managed domestic equity funds. The sample period is from 2000 to 2007. is the
excess return on the domestic market, is the difference in return between the small and big portfolios,
is the difference in return between the high and low book-to-market portfolios, and is the
difference in return between last year’s winner and loser portfolios. Standard deviations across all funds
are in parentheses.
Country 2
Australia 0.95 0.05 0.11 0.02 0.86
Austria 1.07 0.03 0.05 -0.05 0.83
Belgium 0.97 0.10 0.00 -0.05 0.90
Canada 0.93 0.13 0.05 -0.03 0.89
Denmark 0.89 0.14 0.02 -0.04 0.86
Finland 1.03 0.59 0.47 0.00 0.83
France 1.00 0.36 0.05 -0.03 0.85
Germany 0.98 0.05 0.04 -0.05 0.92
India 0.90 0.31 -0.02 -0.03 0.86
Indonesia 0.76 -0.13 0.03 -0.01 0.78
Italy 1.07 0.10 0.03 0.02 0.96
Japan 1.00 0.15 -0.10 0.01 0.89
Malaysia 0.81 0.20 0.12 0.05 0.85
Netherlands 0.97 0.13 -0.01 -0.04 0.86
Norway 1.00 0.25 -0.01 -0.09 0.88
Poland 0.83 0.15 0.03 0.01 0.89
Portugal 0.95 0.02 0.00 -0.03 0.92
Singapore 0.96 0.08 -0.01 0.02 0.89
South Korea 0.89 0.18 0.06 0.08 0.86
Spain 0.96 -0.05 0.03 -0.01 0.92
Sweden 0.88 0.08 0.03 -0.04 0.92
Switzerland 1.08 0.24 0.14 -0.02 0.91
Taiwan 1.03 0.87 -0.41 0.06 0.74
Thailand 0.94 0.12 -0.03 0.05 0.94
UK 0.97 0.26 -0.04 -0.02 0.88
US 1.00 0.33 0.09 0.06 0.85
Total 0.98 0.26 0.05 0.03 0.87
(0.46) (0.43) (0.38) (1.06) (0.12)
Total ex-US 0.96 0.19 0.01 0.00 0.88
(0.19) (0.33) (0.25) (0.14) (0.10)
43
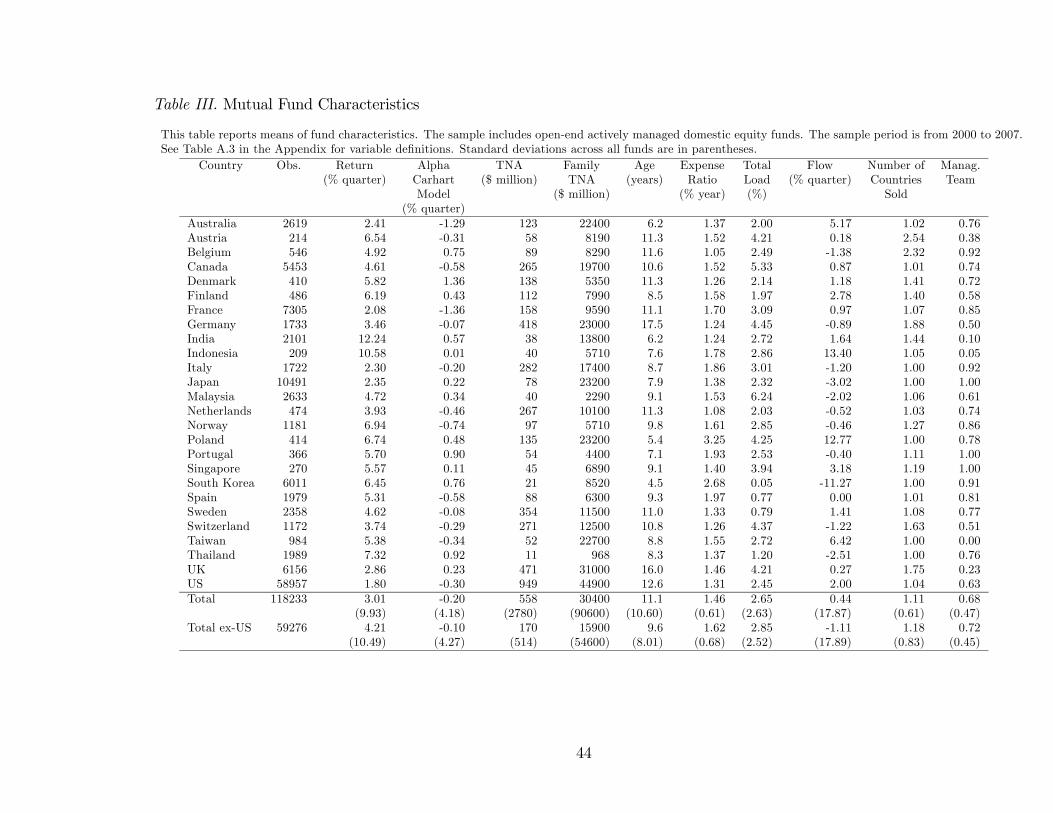
Table III. Mutual Fund Characteristics
This table reports means of fund characteristics. The sample includes open-end actively managed domestic equity funds. The sample period is from 2000 to 2007.
See Table A.3 in the Appendix for variable definitions. Standard deviations across all funds are in parentheses.
Country Obs. Return Alpha TNA Family Age Expense Total Flow Number of Manag.
(% quarter) Carhart ($ million) TNA (years) Ratio Load (% quarter) Countries Team
Model ($ million) (% year) (%) Sold
(% quarter)
Australia 2619 2.41 -1.29 123 22400 6.2 1.37 2.00 5.17 1.02 0.76
Austria 214 6.54 -0.31 58 8190 11.3 1.52 4.21 0.18 2.54 0.38
Belgium 546 4.92 0.75 89 8290 11.6 1.05 2.49 -1.38 2.32 0.92
Canada 5453 4.61 -0.58 265 19700 10.6 1.52 5.33 0.87 1.01 0.74
Denmark 410 5.82 1.36 138 5350 11.3 1.26 2.14 1.18 1.41 0.72
Finland 486 6.19 0.43 112 7990 8.5 1.58 1.97 2.78 1.40 0.58
France 7305 2.08 -1.36 158 9590 11.1 1.70 3.09 0.97 1.07 0.85
Germany 1733 3.46 -0.07 418 23000 17.5 1.24 4.45 -0.89 1.88 0.50
India 2101 12.24 0.57 38 13800 6.2 1.24 2.72 1.64 1.44 0.10
Indonesia 209 10.58 0.01 40 5710 7.6 1.78 2.86 13.40 1.05 0.05
Italy 1722 2.30 -0.20 282 17400 8.7 1.86 3.01 -1.20 1.00 0.92
Japan 10491 2.35 0.22 78 23200 7.9 1.38 2.32 -3.02 1.00 1.00
Malaysia 2633 4.72 0.34 40 2290 9.1 1.53 6.24 -2.02 1.06 0.61
Netherlands 474 3.93 -0.46 267 10100 11.3 1.08 2.03 -0.52 1.03 0.74
Norway 1181 6.94 -0.74 97 5710 9.8 1.61 2.85 -0.46 1.27 0.86
Poland 414 6.74 0.48 135 23200 5.4 3.25 4.25 12.77 1.00 0.78
Portugal 366 5.70 0.90 54 4400 7.1 1.93 2.53 -0.40 1.11 1.00
Singapore 270 5.57 0.11 45 6890 9.1 1.40 3.94 3.18 1.19 1.00
South Korea 6011 6.45 0.76 21 8520 4.5 2.68 0.05 -11.27 1.00 0.91
Spain 1979 5.31 -0.58 88 6300 9.3 1.97 0.77 0.00 1.01 0.81
Sweden 2358 4.62 -0.08 354 11500 11.0 1.33 0.79 1.41 1.08 0.77
Switzerland 1172 3.74 -0.29 271 12500 10.8 1.26 4.37 -1.22 1.63 0.51
Taiwan 984 5.38 -0.34 52 22700 8.8 1.55 2.72 6.42 1.00 0.00
Thailand 1989 7.32 0.92 11 968 8.3 1.37 1.20 -2.51 1.00 0.76
UK 6156 2.86 0.23 471 31000 16.0 1.46 4.21 0.27 1.75 0.23
US 58957 1.80 -0.30 949 44900 12.6 1.31 2.45 2.00 1.04 0.63
Total 118233 3.01 -0.20 558 30400 11.1 1.46 2.65 0.44 1.11 0.68
(9.93) (4.18) (2780) (90600) (10.60) (0.61) (2.63) (17.87) (0.61) (0.47)
Total ex-US 59276 4.21 -0.10 170 15900 9.6 1.62 2.85 -1.11 1.18 0.72
(10.49) (4.27) (514) (54600) (8.01) (0.68) (2.52) (17.89) (0.83) (0.45)
44
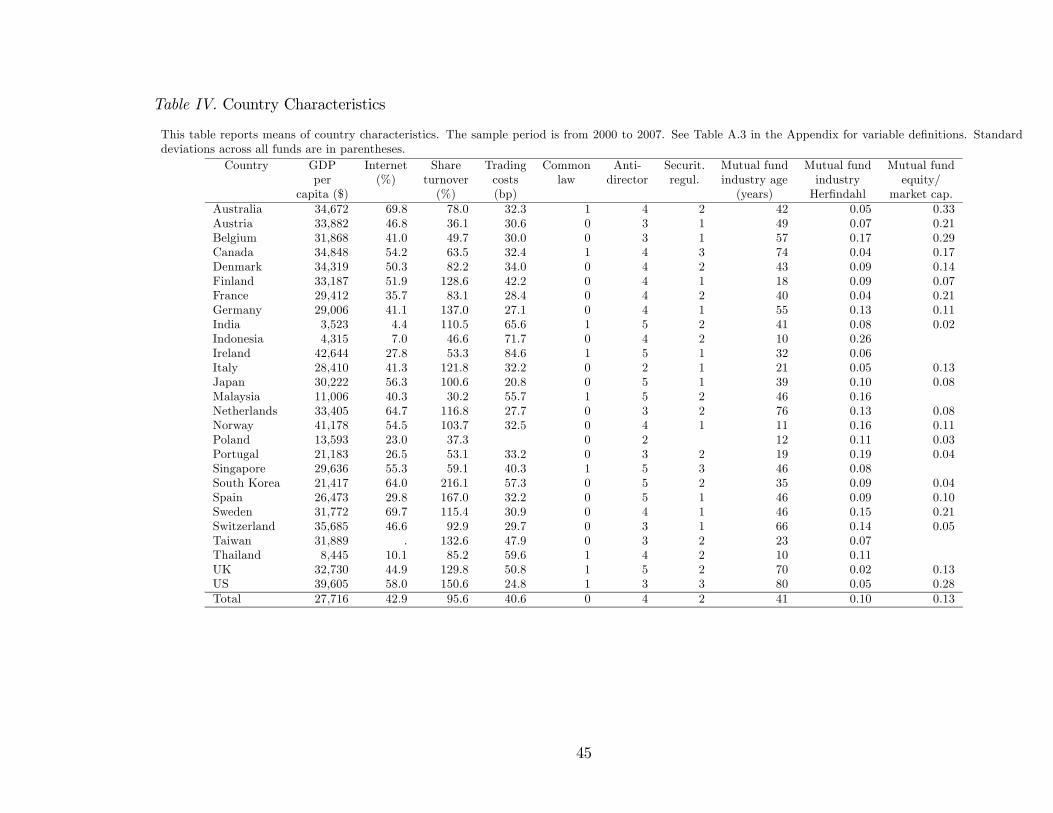
Table IV. Country Characteristics
This table reports means of country characteristics. The sample period is from 2000 to 2007. See Table A.3 in the Appendix for variable definitions. Standard
deviations across all funds are in parentheses.
Country GDP Internet Share Trading Common Anti- Securit. Mutual fund Mutual fund Mutual fund
per (%) turnover costs law director regul. industry age industry equity/
capita ($) (%) (bp) (years) Herfindahl market cap.
Australia 34,672 69.8 78.0 32.3 1 4 2 42 0.05 0.33
Austria 33,882 46.8 36.1 30.6 0 3 1 49 0.07 0.21
Belgium 31,868 41.0 49.7 30.0 0 3 1 57 0.17 0.29
Canada 34,848 54.2 63.5 32.4 1 4 3 74 0.04 0.17
Denmark 34,319 50.3 82.2 34.0 0 4 2 43 0.09 0.14
Finland 33,187 51.9 128.6 42.2 0 4 1 18 0.09 0.07
France 29,412 35.7 83.1 28.4 0 4 2 40 0.04 0.21
Germany 29,006 41.1 137.0 27.1 0 4 1 55 0.13 0.11
India 3,523 4.4 110.5 65.6 1 5 2 41 0.08 0.02
Indonesia 4,315 7.0 46.6 71.7 0 4 2 10 0.26
Ireland 42,644 27.8 53.3 84.6 1 5 1 32 0.06
Italy 28,410 41.3 121.8 32.2 0 2 1 21 0.05 0.13
Japan 30,222 56.3 100.6 20.8 0 5 1 39 0.10 0.08
Malaysia 11,006 40.3 30.2 55.7 1 5 2 46 0.16
Netherlands 33,405 64.7 116.8 27.7 0 3 2 76 0.13 0.08
Norway 41,178 54.5 103.7 32.5 0 4 1 11 0.16 0.11
Poland 13,593 23.0 37.3 0 2 12 0.11 0.03
Portugal 21,183 26.5 53.1 33.2 0 3 2 19 0.19 0.04
Singapore 29,636 55.3 59.1 40.3 1 5 3 46 0.08
South Korea 21,417 64.0 216.1 57.3 0 5 2 35 0.09 0.04
Spain 26,473 29.8 167.0 32.2 0 5 1 46 0.09 0.10
Sweden 31,772 69.7 115.4 30.9 0 4 1 46 0.15 0.21
Switzerland 35,685 46.6 92.9 29.7 0 3 1 66 0.14 0.05
Taiwan 31,889 . 132.6 47.9 0 3 2 23 0.07
Thailand 8,445 10.1 85.2 59.6 1 4 2 10 0.11
UK 32,730 44.9 129.8 50.8 1 5 2 70 0.02 0.13
US 39,605 58.0 150.6 24.8 1 3 3 80 0.05 0.28
Total 27,716 42.9 95.6 40.6 0 4 2 41 0.10 0.13
45
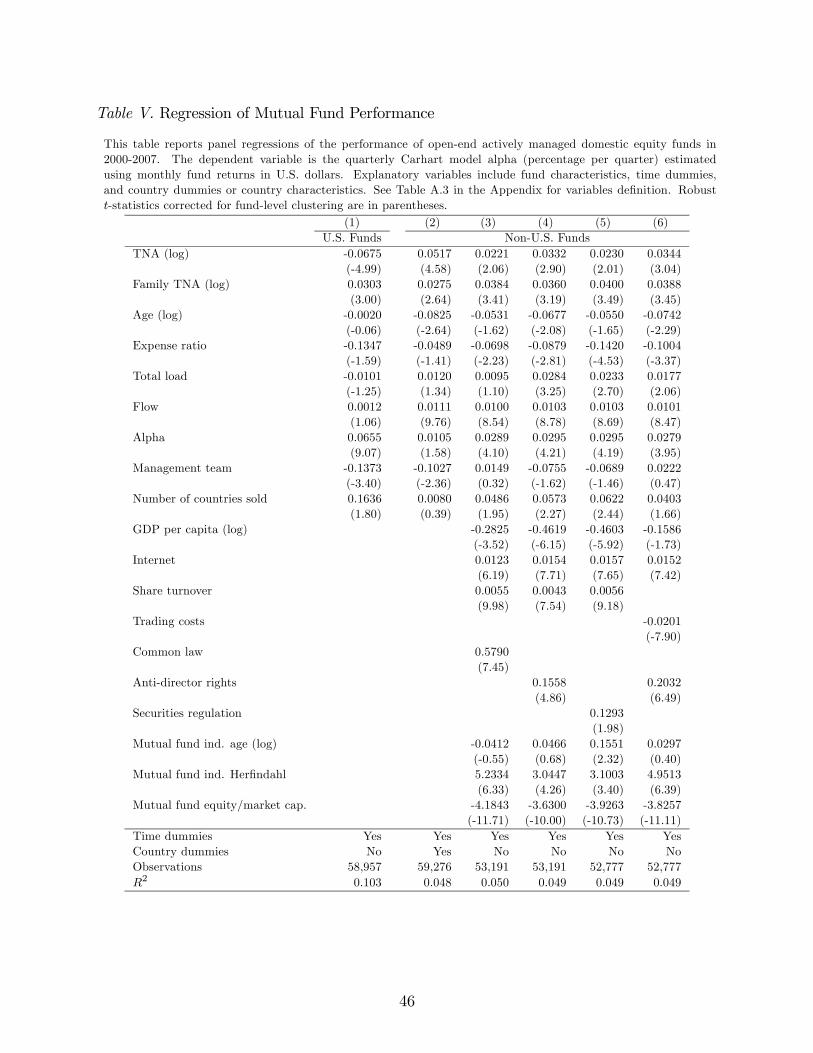
Table V. Regression of Mutual Fund Performance
This table reports panel regressions of the performance of open-end actively managed domestic equity funds in
2000-2007. The dependent variable is the quarterly Carhart model alpha (percentage per quarter) estimated
using monthly fund returns in U.S. dollars. Explanatory variables include fund characteristics, time dummies,
and country dummies or country characteristics. See Table A.3 in the Appendix for variables definition. Robust
-statistics corrected for fund-level clustering are in parentheses.
(1) (2) (3) (4) (5) (6)
U.S. Funds Non-U.S. Funds
TNA (log) -0.0675 0.0517 0.0221 0.0332 0.0230 0.0344
(-4.99) (4.58) (2.06) (2.90) (2.01) (3.04)
Family TNA (log) 0.0303 0.0275 0.0384 0.0360 0.0400 0.0388
(3.00) (2.64) (3.41) (3.19) (3.49) (3.45)
Age (log) -0.0020 -0.0825 -0.0531 -0.0677 -0.0550 -0.0742
(-0.06) (-2.64) (-1.62) (-2.08) (-1.65) (-2.29)
Expense ratio -0.1347 -0.0489 -0.0698 -0.0879 -0.1420 -0.1004
(-1.59) (-1.41) (-2.23) (-2.81) (-4.53) (-3.37)
Total load -0.0101 0.0120 0.0095 0.0284 0.0233 0.0177
(-1.25) (1.34) (1.10) (3.25) (2.70) (2.06)
Flow 0.0012 0.0111 0.0100 0.0103 0.0103 0.0101
(1.06) (9.76) (8.54) (8.78) (8.69) (8.47)
Alpha 0.0655 0.0105 0.0289 0.0295 0.0295 0.0279
(9.07) (1.58) (4.10) (4.21) (4.19) (3.95)
Management team -0.1373 -0.1027 0.0149 -0.0755 -0.0689 0.0222
(-3.40) (-2.36) (0.32) (-1.62) (-1.46) (0.47)
Number of countries sold 0.1636 0.0080 0.0486 0.0573 0.0622 0.0403
(1.80) (0.39) (1.95) (2.27) (2.44) (1.66)
GDP per capita (log) -0.2825 -0.4619 -0.4603 -0.1586
(-3.52) (-6.15) (-5.92) (-1.73)
Internet 0.0123 0.0154 0.0157 0.0152
(6.19) (7.71) (7.65) (7.42)
Share turnover 0.0055 0.0043 0.0056
(9.98) (7.54) (9.18)
Trading costs -0.0201
(-7.90)
Common law 0.5790
(7.45)
Anti-director rights 0.1558 0.2032
(4.86) (6.49)
Securities regulation 0.1293
(1.98)
Mutual fund ind. age (log) -0.0412 0.0466 0.1551 0.0297
(-0.55) (0.68) (2.32) (0.40)
Mutual fund ind. Herfindahl 5.2334 3.0447 3.1003 4.9513
(6.33) (4.26) (3.40) (6.39)
Mutual fund equity/market cap. -4.1843 -3.6300 -3.9263 -3.8257
(-11.71) (-10.00) (-10.73) (-11.11)
Time dummies Yes Yes Yes Yes Yes Yes
Country dummies No Yes No No No No
Observations 58,957 59,276 53,191 53,191 52,777 52,777
2 0.103 0.048 0.050 0.049 0.049 0.049
46
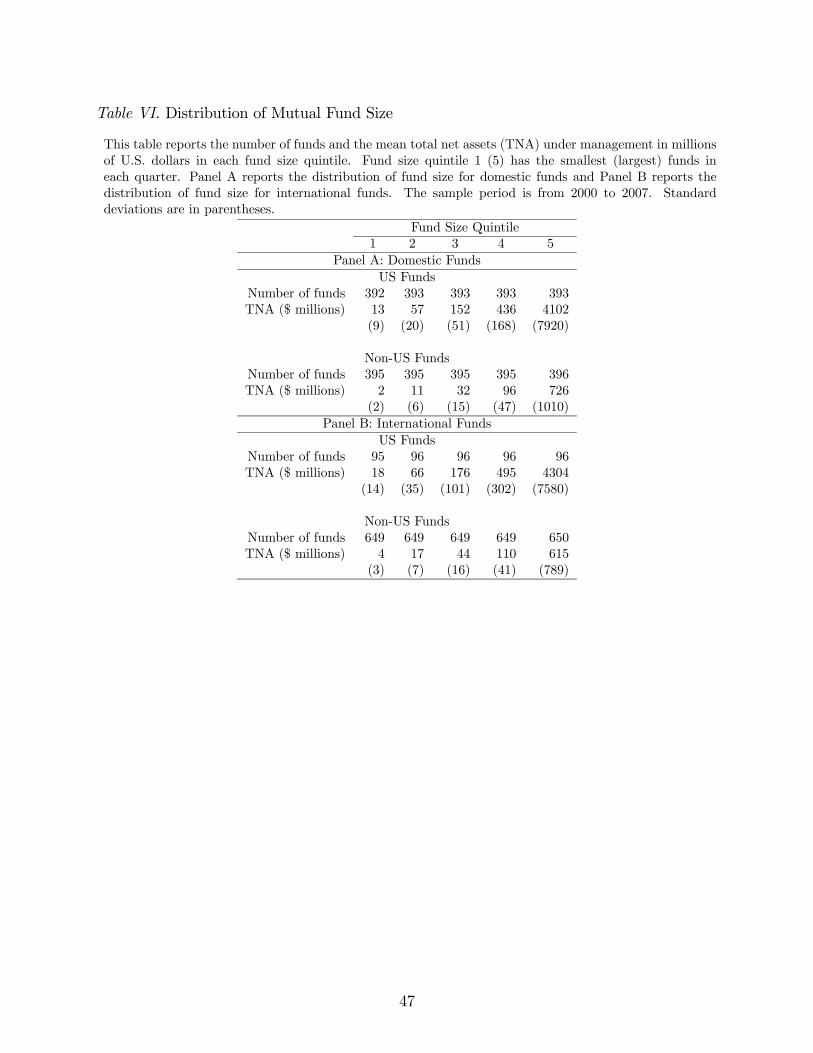
Table VI. Distribution of Mutual Fund Size
This table reports the number of funds and the mean total net assets (TNA) under management in millions
of U.S. dollars in each fund size quintile. Fund size quintile 1 (5) has the smallest (largest) funds in
each quarter. Panel A reports the distribution of fund size for domestic funds and Panel B reports the
distribution of fund size for international funds. The sample period is from 2000 to 2007. Standard
deviations are in parentheses.
Fund Size Quintile
1 2 3 4 5
Panel A: Domestic Funds
US Funds
Number of funds 392 393 393 393 393
TNA ($ millions) 13 57 152 436 4102
(9) (20) (51) (168) (7920)
Non-US Funds
Number of funds 395 395 395 395 396
TNA ($ millions) 2 11 32 96 726
(2) (6) (15) (47) (1010)
Panel B: International Funds
US Funds
Number of funds 95 96 96 96 96
TNA ($ millions) 18 66 176 495 4304
(14) (35) (101) (302) (7580)
Non-US Funds
Number of funds 649 649 649 649 650
TNA ($ millions) 4 17 44 110 615
(3) (7) (16) (41) (789)
47
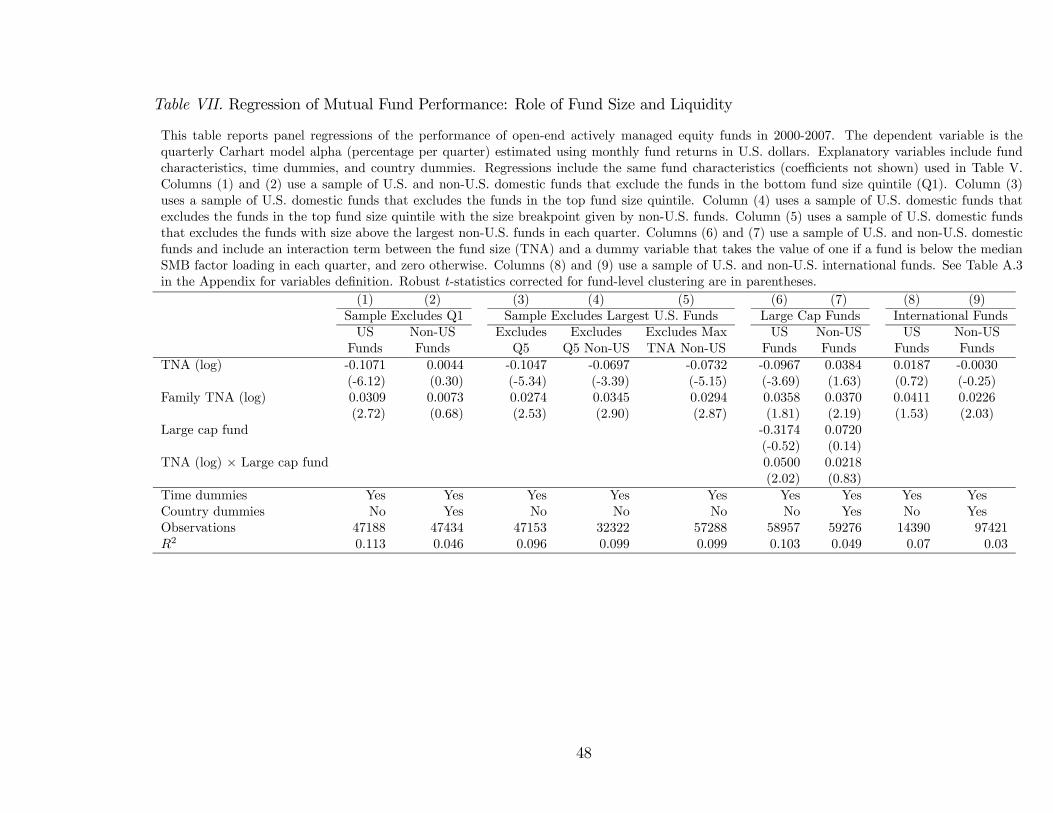
Table VII. Regression of Mutual Fund Performance: Role of Fund Size and Liquidity
This table reports panel regressions of the performance of open-end actively managed equity funds in 2000-2007. The dependent variable is the
quarterly Carhart model alpha (percentage per quarter) estimated using monthly fund returns in U.S. dollars. Explanatory variables include fund
characteristics, time dummies, and country dummies. Regressions include the same fund characteristics (coefficients not shown) used in Table V.
Columns (1) and (2) use a sample of U.S. and non-U.S. domestic funds that exclude the funds in the bottom fund size quintile (Q1). Column (3)
uses a sample of U.S. domestic funds that excludes the funds in the top fund size quintile. Column (4) uses a sample of U.S. domestic funds that
excludes the funds in the top fund size quintile with the size breakpoint given by non-U.S. funds. Column (5) uses a sample of U.S. domestic funds
that excludes the funds with size above the largest non-U.S. funds in each quarter. Columns (6) and (7) use a sample of U.S. and non-U.S. domestic
funds and include an interaction term between the fund size (TNA) and a dummy variable that takes the value of one if a fund is below the median
SMB factor loading in each quarter, and zero otherwise. Columns (8) and (9) use a sample of U.S. and non-U.S. international funds. See Table A.3
in the Appendix for variables definition. Robust -statistics corrected for fund-level clustering are in parentheses.
(1) (2) (3) (4) (5) (6) (7) (8) (9)
Sample Excludes Q1 Sample Excludes Largest U.S. Funds Large Cap Funds International Funds
US Non-US Excludes Excludes Excludes Max US Non-US US Non-US
Funds Funds Q5 Q5 Non-US TNA Non-US Funds Funds Funds Funds
TNA (log) -0.1071 0.0044 -0.1047 -0.0697 -0.0732 -0.0967 0.0384 0.0187 -0.0030
(-6.12) (0.30) (-5.34) (-3.39) (-5.15) (-3.69) (1.63) (0.72) (-0.25)
Family TNA (log) 0.0309 0.0073 0.0274 0.0345 0.0294 0.0358 0.0370 0.0411 0.0226
(2.72) (0.68) (2.53) (2.90) (2.87) (1.81) (2.19) (1.53) (2.03)
Large cap fund -0.3174 0.0720
(-0.52) (0.14)
TNA (log) × Large cap fund 0.0500 0.0218
(2.02) (0.83)
Time dummies Yes Yes Yes Yes Yes Yes Yes Yes Yes
Country dummies No Yes No No No No Yes No Yes
Observations 47188 47434 47153 32322 57288 58957 59276 14390 97421
2 0.113 0.046 0.096 0.099 0.099 0.103 0.049 0.07 0.03
48
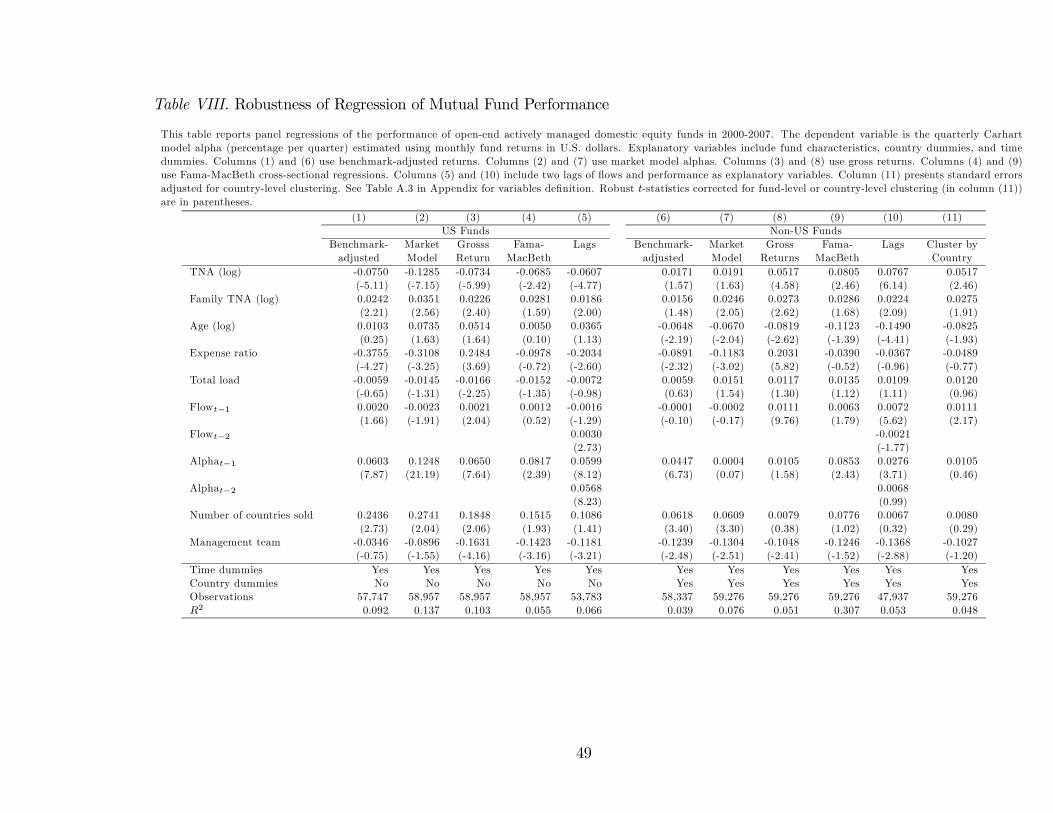
Table VIII. Robustness of Regression of Mutual Fund Performance
This table reports panel regressions of the performance of open-end actively managed domestic equity funds in 2000-2007. The dependent variable is the quarterly Carhart
model alpha (percentage per quarter) estimated using monthly fund returns in U.S. dollars. Explanatory variables include fund characteristics, country dummies, and time
dummies. Columns (1) and (6) use benchmark-adjusted returns. Columns (2) and (7) use market model alphas. Columns (3) and (8) use gross returns. Columns (4) and (9)
use Fama-MacBeth cross-sectional regressions. Columns (5) and (10) include two lags of flows and performance as explanatory variables. Column (11) presents standard errors
adjusted for country-level clustering. See Table A.3 in Appendix for variables definition. Robust -statistics corrected for fund-level or country-level clustering (in column (11))
are in parentheses.
(1) (2) (3) (4) (5) (6) (7) (8) (9) (10) (11)
US Funds Non-US Funds
Benchmark- Market Grosss Fama- Lags Benchmark- Market Gross Fama- Lags Cluster by
adjusted Model Return MacBeth adjusted Model Returns MacBeth Country
TNA (log) -0.0750 -0.1285 -0.0734 -0.0685 -0.0607 0.0171 0.0191 0.0517 0.0805 0.0767 0.0517
(-5.11) (-7.15) (-5.99) (-2.42) (-4.77) (1.57) (1.63) (4.58) (2.46) (6.14) (2.46)
Family TNA (log) 0.0242 0.0351 0.0226 0.0281 0.0186 0.0156 0.0246 0.0273 0.0286 0.0224 0.0275
(2.21) (2.56) (2.40) (1.59) (2.00) (1.48) (2.05) (2.62) (1.68) (2.09) (1.91)
Age (log) 0.0103 0.0735 0.0514 0.0050 0.0365 -0.0648 -0.0670 -0.0819 -0.1123 -0.1490 -0.0825
(0.25) (1.63) (1.64) (0.10) (1.13) (-2.19) (-2.04) (-2.62) (-1.39) (-4.41) (-1.93)
Expense ratio -0.3755 -0.3108 0.2484 -0.0978 -0.2034 -0.0891 -0.1183 0.2031 -0.0390 -0.0367 -0.0489
(-4.27) (-3.25) (3.69) (-0.72) (-2.60) (-2.32) (-3.02) (5.82) (-0.52) (-0.96) (-0.77)
Total load -0.0059 -0.0145 -0.0166 -0.0152 -0.0072 0.0059 0.0151 0.0117 0.0135 0.0109 0.0120
(-0.65) (-1.31) (-2.25) (-1.35) (-0.98) (0.63) (1.54) (1.30) (1.12) (1.11) (0.96)
Flow−1 0.0020 -0.0023 0.0021 0.0012 -0.0016 -0.0001 -0.0002 0.0111 0.0063 0.0072 0.0111
(1.66) (-1.91) (2.04) (0.52) (-1.29) (-0.10) (-0.17) (9.76) (1.79) (5.62) (2.17)
Flow−2 0.0030 -0.0021
(2.73) (-1.77)
Alpha−1 0.0603 0.1248 0.0650 0.0817 0.0599 0.0447 0.0004 0.0105 0.0853 0.0276 0.0105
(7.87) (21.19) (7.64) (2.39) (8.12) (6.73) (0.07) (1.58) (2.43) (3.71) (0.46)
Alpha−2 0.0568 0.0068
(8.23) (0.99)
Number of countries sold 0.2436 0.2741 0.1848 0.1515 0.1086 0.0618 0.0609 0.0079 0.0776 0.0067 0.0080
(2.73) (2.04) (2.06) (1.93) (1.41) (3.40) (3.30) (0.38) (1.02) (0.32) (0.29)
Management team -0.0346 -0.0896 -0.1631 -0.1423 -0.1181 -0.1239 -0.1304 -0.1048 -0.1246 -0.1368 -0.1027
(-0.75) (-1.55) (-4.16) (-3.16) (-3.21) (-2.48) (-2.51) (-2.41) (-1.52) (-2.88) (-1.20)
Time dummies Yes Yes Yes Yes Yes Yes Yes Yes Yes Yes Yes
Country dummies No No No No No Yes Yes Yes Yes Yes Yes
Observations 57,747 58,957 58,957 58,957 53,783 58,337 59,276 59,276 59,276 47,937 59,276
2 0.092 0.137 0.103 0.055 0.066 0.039 0.076 0.051 0.307 0.053 0.048
49
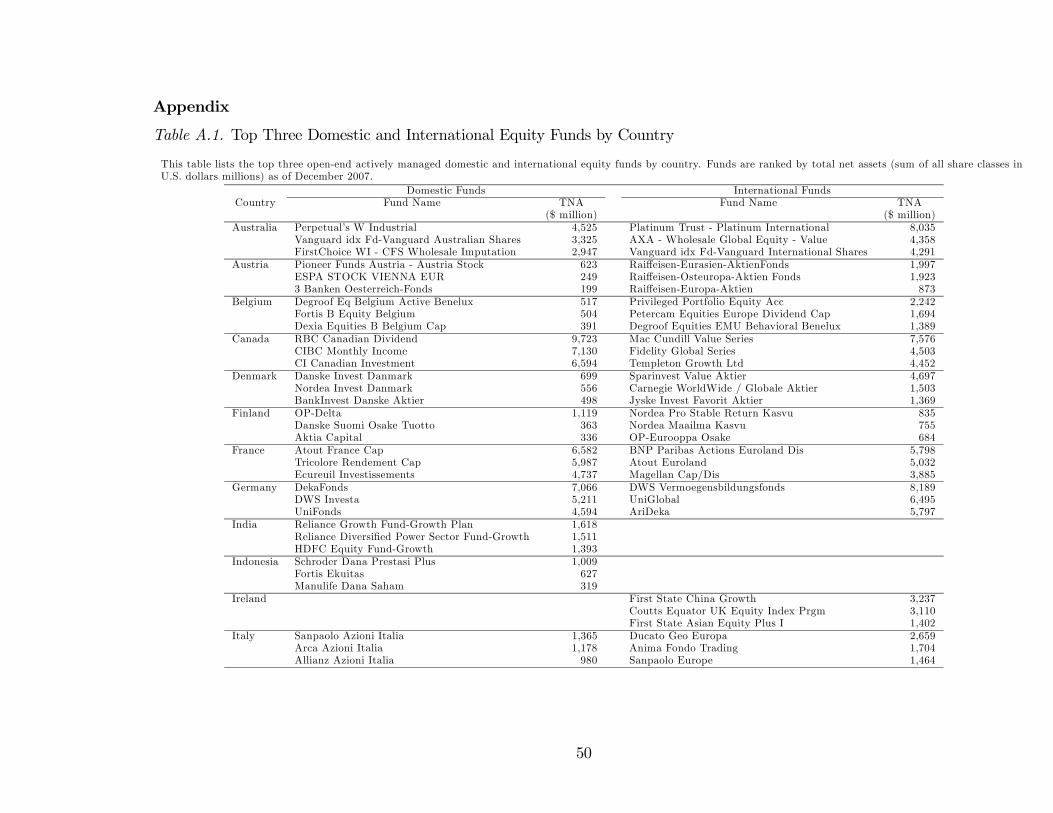
Appendix
Table A.1. Top Three Domestic and International Equity Funds by Country
This table lists the top three open-end actively managed domestic and international equity funds by country. Funds are ranked by total net assets (sum of all share classes inU.S. dollars millions) as of December 2007.
Domestic Funds International FundsCountry Fund Name TNA Fund Name TNA
($ million) ($ million)
Australia Perpetual’s W Industrial 4,525 Platinum Trust - Platinum International 8,035Vanguard idx Fd-Vanguard Australian Shares 3,325 AXA - Wholesale Global Equity - Value 4,358FirstChoice WI - CFS Wholesale Imputation 2,947 Vanguard idx Fd-Vanguard International Shares 4,291
Austria Pioneer Funds Austria - Austria Stock 623 Raiffeisen-Eurasien-AktienFonds 1,997ESPA STOCK VIENNA EUR 249 Raiffeisen-Osteuropa-Aktien Fonds 1,9233 Banken Oesterreich-Fonds 199 Raiffeisen-Europa-Aktien 873
Belgium Degroof Eq Belgium Active Benelux 517 Privileged Portfolio Equity Acc 2,242Fortis B Equity Belgium 504 Petercam Equities Europe Dividend Cap 1,694Dexia Equities B Belgium Cap 391 Degroof Equities EMU Behavioral Benelux 1,389
Canada RBC Canadian Dividend 9,723 Mac Cundill Value Series 7,576CIBC Monthly Income 7,130 Fidelity Global Series 4,503CI Canadian Investment 6,594 Templeton Growth Ltd 4,452
Denmark Danske Invest Danmark 699 Sparinvest Value Aktier 4,697Nordea Invest Danmark 556 Carnegie WorldWide / Globale Aktier 1,503BankInvest Danske Aktier 498 Jyske Invest Favorit Aktier 1,369
Finland OP-Delta 1,119 Nordea Pro Stable Return Kasvu 835Danske Suomi Osake Tuotto 363 Nordea Maailma Kasvu 755Aktia Capital 336 OP-Eurooppa Osake 684
France Atout France Cap 6,582 BNP Paribas Actions Euroland Dis 5,798Tricolore Rendement Cap 5,987 Atout Euroland 5,032Ecureuil Investissements 4,737 Magellan Cap/Dis 3,885
Germany DekaFonds 7,066 DWS Vermoegensbildungsfonds 8,189DWS Investa 5,211 UniGlobal 6,495UniFonds 4,594 AriDeka 5,797
India Reliance Growth Fund-Growth Plan 1,618Reliance Diversified Power Sector Fund-Growth 1,511HDFC Equity Fund-Growth 1,393
Indonesia Schroder Dana Prestasi Plus 1,009Fortis Ekuitas 627Manulife Dana Saham 319
Ireland First State China Growth 3,237Coutts Equator UK Equity Index Prgm 3,110First State Asian Equity Plus I 1,402
Italy Sanpaolo Azioni Italia 1,365 Ducato Geo Europa 2,659Arca Azioni Italia 1,178 Anima Fondo Trading 1,704Allianz Azioni Italia 980 Sanpaolo Europe 1,464
50
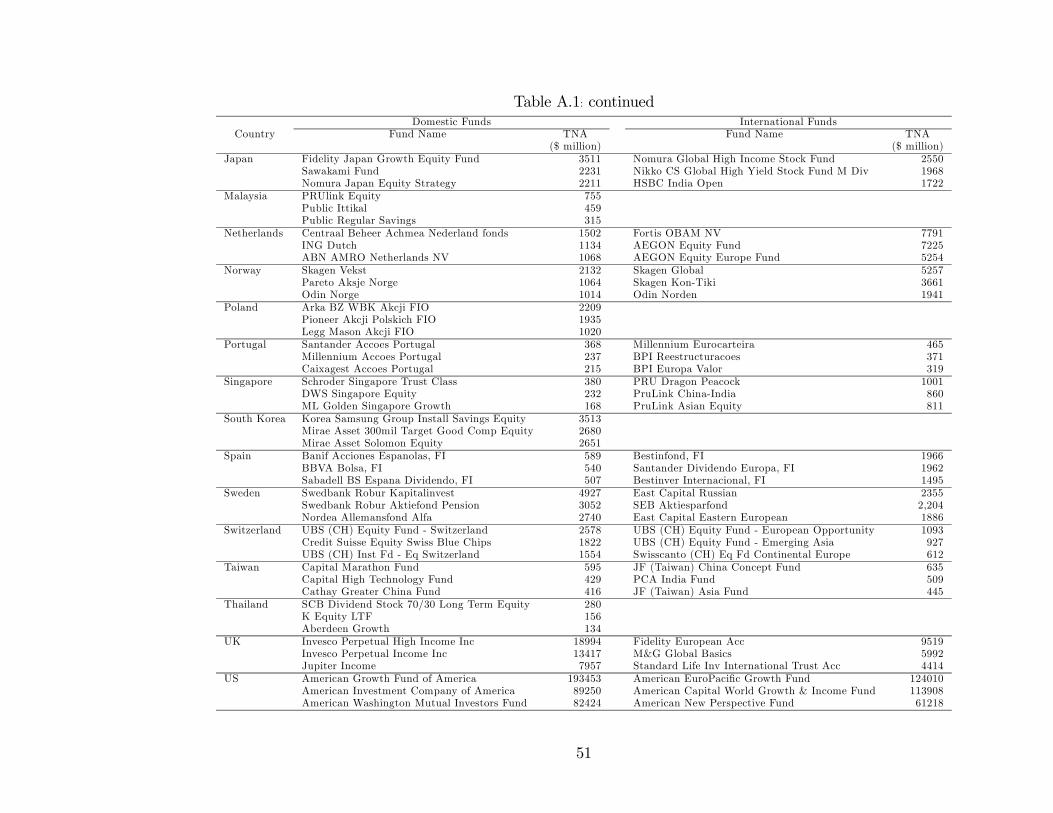
Table A.1: continuedDomestic Funds International Funds
Country Fund Name TNA Fund Name TNA($ million) ($ million)
Japan Fidelity Japan Growth Equity Fund 3511 Nomura Global High Income Stock Fund 2550Sawakami Fund 2231 Nikko CS Global High Yield Stock Fund M Div 1968Nomura Japan Equity Strategy 2211 HSBC India Open 1722
Malaysia PRUlink Equity 755Public Ittikal 459Public Regular Savings 315
Netherlands Centraal Beheer Achmea Nederland fonds 1502 Fortis OBAM NV 7791ING Dutch 1134 AEGON Equity Fund 7225ABN AMRO Netherlands NV 1068 AEGON Equity Europe Fund 5254
Norway Skagen Vekst 2132 Skagen Global 5257Pareto Aksje Norge 1064 Skagen Kon-Tiki 3661Odin Norge 1014 Odin Norden 1941
Poland Arka BZ WBK Akcji FIO 2209Pioneer Akcji Polskich FIO 1935Legg Mason Akcji FIO 1020
Portugal Santander Accoes Portugal 368 Millennium Eurocarteira 465Millennium Accoes Portugal 237 BPI Reestructuracoes 371Caixagest Accoes Portugal 215 BPI Europa Valor 319
Singapore Schroder Singapore Trust Class 380 PRU Dragon Peacock 1001DWS Singapore Equity 232 PruLink China-India 860ML Golden Singapore Growth 168 PruLink Asian Equity 811
South Korea Korea Samsung Group Install Savings Equity 3513Mirae Asset 300mil Target Good Comp Equity 2680Mirae Asset Solomon Equity 2651
Spain Banif Acciones Espanolas, FI 589 Bestinfond, FI 1966BBVA Bolsa, FI 540 Santander Dividendo Europa, FI 1962Sabadell BS Espana Dividendo, FI 507 Bestinver Internacional, FI 1495
Sweden Swedbank Robur Kapitalinvest 4927 East Capital Russian 2355Swedbank Robur Aktiefond Pension 3052 SEB Aktiesparfond 2,204Nordea Allemansfond Alfa 2740 East Capital Eastern European 1886
Switzerland UBS (CH) Equity Fund - Switzerland 2578 UBS (CH) Equity Fund - European Opportunity 1093Credit Suisse Equity Swiss Blue Chips 1822 UBS (CH) Equity Fund - Emerging Asia 927UBS (CH) Inst Fd - Eq Switzerland 1554 Swisscanto (CH) Eq Fd Continental Europe 612
Taiwan Capital Marathon Fund 595 JF (Taiwan) China Concept Fund 635Capital High Technology Fund 429 PCA India Fund 509Cathay Greater China Fund 416 JF (Taiwan) Asia Fund 445
Thailand SCB Dividend Stock 70/30 Long Term Equity 280K Equity LTF 156Aberdeen Growth 134
UK Invesco Perpetual High Income Inc 18994 Fidelity European Acc 9519Invesco Perpetual Income Inc 13417 M&G Global Basics 5992Jupiter Income 7957 Standard Life Inv International Trust Acc 4414
US American Growth Fund of America 193453 American EuroPacific Growth Fund 124010American Investment Company of America 89250 American Capital World Growth & Income Fund 113908American Washington Mutual Investors Fund 82424 American New Perspective Fund 61218
51
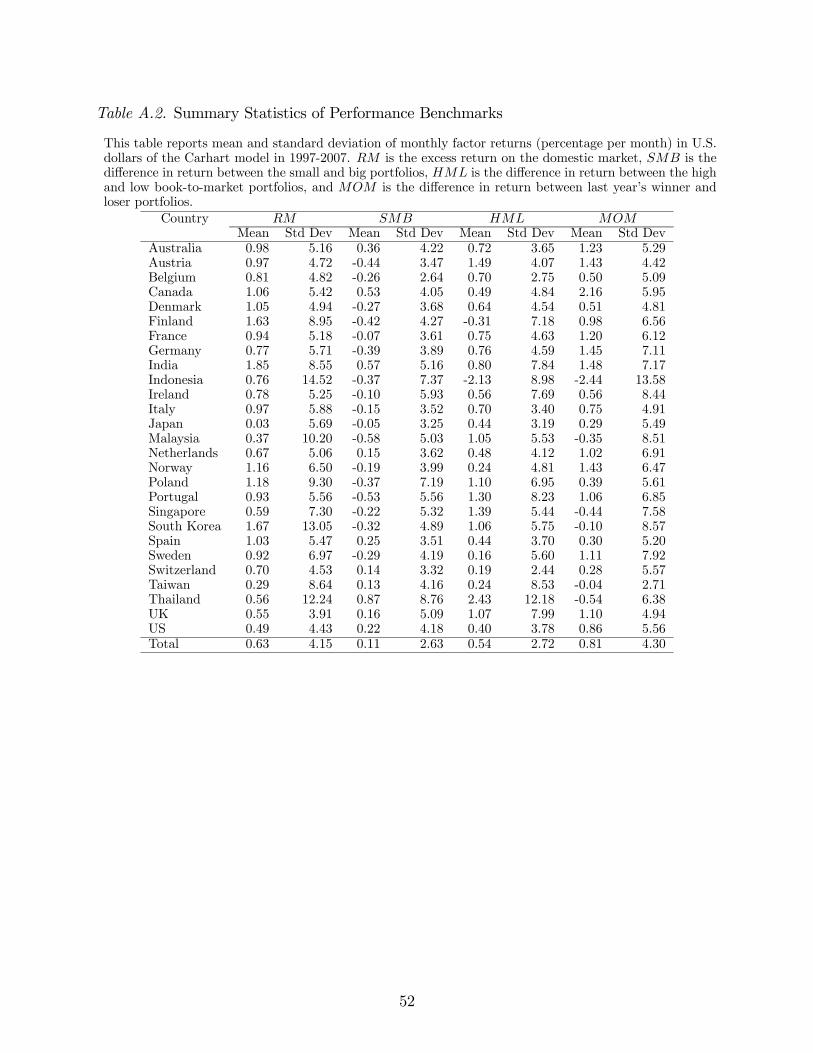
Table A.2. Summary Statistics of Performance Benchmarks
This table reports mean and standard deviation of monthly factor returns (percentage per month) in U.S.dollars of the Carhart model in 1997-2007. is the excess return on the domestic market, is thedifference in return between the small and big portfolios, is the difference in return between the highand low book-to-market portfolios, and is the difference in return between last year’s winner andloser portfolios.
Country Mean Std Dev Mean Std Dev Mean Std Dev Mean Std Dev
Australia 0.98 5.16 0.36 4.22 0.72 3.65 1.23 5.29Austria 0.97 4.72 -0.44 3.47 1.49 4.07 1.43 4.42Belgium 0.81 4.82 -0.26 2.64 0.70 2.75 0.50 5.09Canada 1.06 5.42 0.53 4.05 0.49 4.84 2.16 5.95Denmark 1.05 4.94 -0.27 3.68 0.64 4.54 0.51 4.81Finland 1.63 8.95 -0.42 4.27 -0.31 7.18 0.98 6.56France 0.94 5.18 -0.07 3.61 0.75 4.63 1.20 6.12Germany 0.77 5.71 -0.39 3.89 0.76 4.59 1.45 7.11India 1.85 8.55 0.57 5.16 0.80 7.84 1.48 7.17Indonesia 0.76 14.52 -0.37 7.37 -2.13 8.98 -2.44 13.58Ireland 0.78 5.25 -0.10 5.93 0.56 7.69 0.56 8.44Italy 0.97 5.88 -0.15 3.52 0.70 3.40 0.75 4.91Japan 0.03 5.69 -0.05 3.25 0.44 3.19 0.29 5.49Malaysia 0.37 10.20 -0.58 5.03 1.05 5.53 -0.35 8.51Netherlands 0.67 5.06 0.15 3.62 0.48 4.12 1.02 6.91Norway 1.16 6.50 -0.19 3.99 0.24 4.81 1.43 6.47Poland 1.18 9.30 -0.37 7.19 1.10 6.95 0.39 5.61Portugal 0.93 5.56 -0.53 5.56 1.30 8.23 1.06 6.85Singapore 0.59 7.30 -0.22 5.32 1.39 5.44 -0.44 7.58South Korea 1.67 13.05 -0.32 4.89 1.06 5.75 -0.10 8.57Spain 1.03 5.47 0.25 3.51 0.44 3.70 0.30 5.20Sweden 0.92 6.97 -0.29 4.19 0.16 5.60 1.11 7.92Switzerland 0.70 4.53 0.14 3.32 0.19 2.44 0.28 5.57Taiwan 0.29 8.64 0.13 4.16 0.24 8.53 -0.04 2.71Thailand 0.56 12.24 0.87 8.76 2.43 12.18 -0.54 6.38UK 0.55 3.91 0.16 5.09 1.07 7.99 1.10 4.94US 0.49 4.43 0.22 4.18 0.40 3.78 0.86 5.56Total 0.63 4.15 0.11 2.63 0.54 2.72 0.81 4.30
52
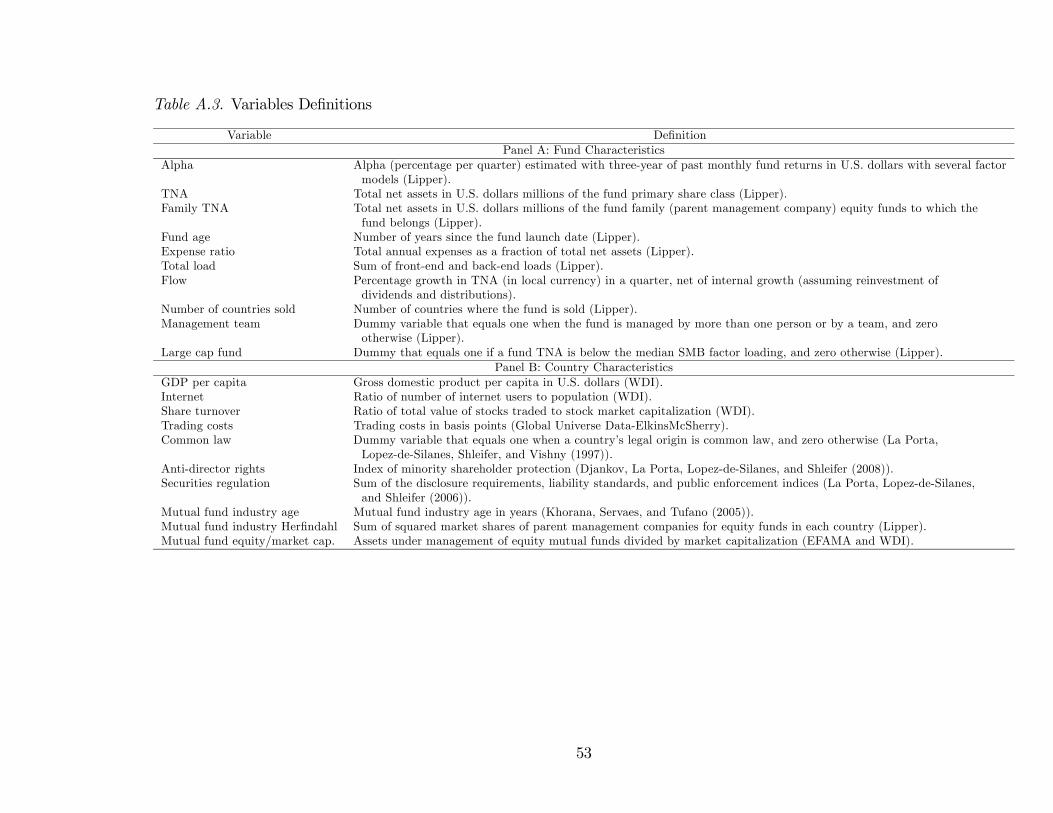
Table A.3. Variables Definitions
Variable Definition
Panel A: Fund Characteristics
Alpha Alpha (percentage per quarter) estimated with three-year of past monthly fund returns in U.S. dollars with several factor
models (Lipper).
TNA Total net assets in U.S. dollars millions of the fund primary share class (Lipper).
Family TNA Total net assets in U.S. dollars millions of the fund family (parent management company) equity funds to which the
fund belongs (Lipper).
Fund age Number of years since the fund launch date (Lipper).
Expense ratio Total annual expenses as a fraction of total net assets (Lipper).
Total load Sum of front-end and back-end loads (Lipper).
Flow Percentage growth in TNA (in local currency) in a quarter, net of internal growth (assuming reinvestment of
dividends and distributions).
Number of countries sold Number of countries where the fund is sold (Lipper).
Management team Dummy variable that equals one when the fund is managed by more than one person or by a team, and zero
otherwise (Lipper).
Large cap fund Dummy that equals one if a fund TNA is below the median SMB factor loading, and zero otherwise (Lipper).
Panel B: Country Characteristics
GDP per capita Gross domestic product per capita in U.S. dollars (WDI).
Internet Ratio of number of internet users to population (WDI).
Share turnover Ratio of total value of stocks traded to stock market capitalization (WDI).
Trading costs Trading costs in basis points (Global Universe Data-ElkinsMcSherry).
Common law Dummy variable that equals one when a country’s legal origin is common law, and zero otherwise (La Porta,
Lopez-de-Silanes, Shleifer, and Vishny (1997)).
Anti-director rights Index of minority shareholder protection (Djankov, La Porta, Lopez-de-Silanes, and Shleifer (2008)).
Securities regulation Sum of the disclosure requirements, liability standards, and public enforcement indices (La Porta, Lopez-de-Silanes,
and Shleifer (2006)).
Mutual fund industry age Mutual fund industry age in years (Khorana, Servaes, and Tufano (2005)).
Mutual fund industry Herfindahl Sum of squared market shares of parent management companies for equity funds in each country (Lipper).
Mutual fund equity/market cap. Assets under management of equity mutual funds divided by market capitalization (EFAMA and WDI).
53