Embed Size (px)
Citation preview

Proceedings of the 12th Asia-Pacific Conference on Global Business, Economics, Finance
and Social Sciences (AP17Indonesia Conference) ISBN: 978-1-943579-47-1
Jakarta-Indonesia. May 18-20, 2017. Paper ID: J735
1 www.globalbizresearch.org
The Determinants of Foreign Direct Investment (FDI) in Singapore
Holy Pondicherry,
Faculty of Economics,
Universitas Pelita Harapan,
Tangerang, Indonesia.
E-mail: [email protected]
Pauline Henriette P. Tan,
Faculty of Economics,
Universitas Pelita Harapan, Indonesia.
E-mail: [email protected]
___________________________________________________________________________
Abstract
For the past few years, foreign direct investment (FDI) has become the indicator to economic
growth, especially in emerging economies. Nonetheless, statistics have shown that Singapore
has been receiving 50% of the total FDI inflows coming to Southeast Asia each year. As a small
yet developed country, this fact has raised a big question mark and led to many discussions on
FDI determinants in Singapore. This research used an autoregressive distributed-lag
regression (ARDL) model on 25-year quarterly data for the period of 1990-2014 to find the
empirical evidence of some economic determinants toward FDI inflows in Singapore. This
research used interest rate as the proxy of local government's monetary policy, GDP as the
proxy of country's market size, and trade openness as the proxy of economic liberalization. The
use of ARDL estimation is caused by the stationarity statuses of variables. The results shown
that interest rate has no significance - yet positively affect the FDI inflows, while GDP and
trade openness have positive significant impact toward the FDI inflows. Thus, this research
accepted the alternative hypotheses of the relationship’s existence between FDI inflows and
interest rate, GDP, and trade openness. This research has provided better understanding on
the nature of FDI in Singapore and its correlation with economic factors and helped foreign
investors to make investment decision.
___________________________________________________________________________
Key Words: determinants of FDI, Singapore, foreign direct investment, FDI, interest rate,
gross domestic product, GDP, trade openness, trade liberalization, ARDL time-series
econometrics
JEL Classification: C 19, G13, G 14

Proceedings of the 12th Asia-Pacific Conference on Global Business, Economics, Finance
and Social Sciences (AP17Indonesia Conference) ISBN: 978-1-943579-47-1
Jakarta-Indonesia. May 18-20, 2017. Paper ID: J735
2 www.globalbizresearch.org
1. Introduction
1.1 Background
Foreign direct investment has been the measurement of one economy’s economic growth
and economic openness, as it promotes the ability to receive other country’s participation in its
economy (Organisation for Economic Cooperation and Development, 2002). The developed
countries had been the main recipients of FDI, but studies have shown that for the past decade,
developing countries has been receiving more than the developed ones (Hansen, 1939).
Southeast Asia consists of a lot of developing countries that have been receiving lots of FDI
inflows and growing in its economy. Interestingly, Singapore – as the only developed economy
amongst the other emerging economies – has been holding roughly 50% of Southeast Asia’s
FDI inflows’ share since 1979 (United Nations, 2015). Referring to the fact that developing
countries receive more that developed countries, Singapore is an exception. For the past 25
years, its FDI has been focused on particular sectors, which are in financial and insurance,
wholesale and retail trade, manufacturing, professional and administrative, and transportation
and storage sectors (Central Intelligence Agency, 2016). There are a lot of determinants of FDI
and the magnitude of each determinant might influence the FDI inflows differently, depending
on the condition of the host country (United Nations Conference on Trade and Development,
2009).
1.2 Problem Statement and Objective
This research assumes that the FDI inflows coming into the developing countries should be
larger than the inflows coming into the developed counties. In contrast, as a developed country,
Singapore has been receiving more FDI inflows compared to the other developing countries in
Southeast Asia. This has raised big and arguable questions of how and why Singapore is very
attractive compared to all other emerging countries in Southeast Asia. The objective of this
research is to identify which determinants that play as major driver of high FDI inflows in
Singapore. It is expected to help foreign investors to obtain better understanding in the nature
of FDI and help the investment decision. The study is conducted to find the relationship
between FDI inflows and some economic determinants in Singapore. The economic
determinants that are taken as the independent variables are interest rate, GDP, and trade
openness.
2. Theoretical Background
2.1 Theoretical Framework
FDI is a real direct investment in equity capital in which the foreign investor retains control
over its capital and management. A 10-percent or more ownership is required to be considered
as a withholding status in the investment (Daniels, Radebaugh, & Sullivan, 2013). As the global
economic activities emerged, international trade and investment have contributed and played a

Proceedings of the 12th Asia-Pacific Conference on Global Business, Economics, Finance
and Social Sciences (AP17Indonesia Conference) ISBN: 978-1-943579-47-1
Jakarta-Indonesia. May 18-20, 2017. Paper ID: J735
3 www.globalbizresearch.org
major role in global economy. The impact of the international trade and investment have come
from a comparative advantage theory proposed by David Ricardo and later followed by
Hecksher and Ohlin on factor abundant theory. A country should produce and export goods that
are using its relatively abundant-factors, while on the other hand import goods that are using its
relatively scarce-factors in its country (Pugel, 2015). This trading activity expanded to a foreign
investment, which is classified into two categories; international portfolio investment (IPI) and
FDI. In IPI, the foreign investor does not retain any direct control toward the business, while
FDI has control over its management and decision-making. There are a lot of motives underlie
behind the investment decision. The main motive is to earn more profits out of the business,
either by maximizing revenues or minimizing costs. Incentives such as higher growth rates and
returns in a country, lower prices for factors of production and transportation, strong
infrastructure, and lower taxes attract more foreign investors (Salvatore, 1995). Also,
multinational corporations (MNCs) claimed that the reason they existed is to pursue global
strategy. MNCs gain new market access abroad and obtain economies of scale and scope
(Daniels, Radebaugh, & Sullivan, 2013). These various motives are summarized into five main
drivers by Hymer in 1976. The five main drivers are the access of patented non-existent
technology, learning the ‘know-how’ or the management skills, obtaining economies of scale,
learning certain marketing capabilities and strategies, and owning certain brand reputation and
equity (Eiteman, Stonehill, & Moffett, 2013).
Many researchers all over the world have tried to explain the theory of FDI and came up
with different concepts of FDI. The oldest theory was proposed by Raymond Vernon in 1966
and called as the production cycle theory. He proposed that there are four stages of production,
which are innovation, growth, maturity, and decline. FDI occurs in growth phase to maintain
the market share abroad (Vernon, 1966). Another theory tries to explain FDI in different types
of market. In a perfect market, FDI is claimed to never happen because of its perfectly
competitive characteristics. The characteristics are large number of sellers and buyers
participated in the market, symmetrical knowledge, homogeneous product, no government
intervention, and all parties are both price takers and price setters. With equal opportunities and
rate of returns, no investors would like to invest in the economy (Kindleberger, 1969). In
contrary, in an imperfect market, where monopoly and oligopoly could exist, FDI is very likely
to happen (Nayak & Choudhury, 2014). In 1993, John Harry Dunning postulated an eclectic
theory called the OLI Paradigm. Ownership-specific advantages come from the ownership of
limited natural resources, patents, trademarks, and technology of innovation. Location-specific
advantages come from the economic factors of production and transportation, political factors
of common and specific policies regarding FDI, and social factors of distance between home
and host country. Internalization-specific advantage come from the execution of transactions
within the organization (Dunning, 1993).

Proceedings of the 12th Asia-Pacific Conference on Global Business, Economics, Finance
and Social Sciences (AP17Indonesia Conference) ISBN: 978-1-943579-47-1
Jakarta-Indonesia. May 18-20, 2017. Paper ID: J735
4 www.globalbizresearch.org
Based on the various motives and concepts, three economic variables are suspected to be
the determinants of FDI in Singapore, which are interest rate, GDP, and trade openness. First,
the relationship between interest rate and FDI is explained in the theory of loanable funds
market and basic investment theory. According to the loanable funds theory, if the government
increases the interest rate, more people will invest to get higher returns which makes the supply
of loanable funds increases. Higher interest rate increases supply of loans. In investment theory,
when there is no risk and barriers of capital movement, investors will move the funds from
countries with lower interest rates to countries with higher interest rates. The higher the interest
rates, the higher the FDI inflows coming into the country (Parkin, 2014). Second, the
relationship between GDP and FDI inflows is also positive. As GDP catches the ability of a
country to produce goods as a whole, it perceives the ability of a country to consume goods as
well. The higher the GDP, the bigger the market size and ability to produce, purchase, and
consume, the more attractive a country to investors. FDI that seeks new market to expand its
business will see this variable to be highly attractive to its investing decision (Chawla & Rohra,
2015). Third, the relationship between trade openness and FDI inflows exists as the
international trade between countries emerged. The higher the trade volume of the host country,
the more liberalized its economy to outside participation, the easier foreign investors to
penetrate the market. Furthermore, the more active the host country is engaged in free trade
agreements or partnership, the more likely foreign investors to make business in the country. It
enhances both exports and imports of goods, and firms that run its business can sell its goods
to the host country’s free trade partners, which widen the market scope of its business.
Therefore, the more open a country to trade and investment, the higher the FDI inflows coming
into the country (United Nations Conference on Trade and Development, 1999).
2.2 Literature Review
A research by Eicher, Helfman, and Lenkoski in 2012 proved that some determinants of FDI
are actually not affecting the behavior of FDI although it has been proven for a long time ago.
The research was conducted in 36 OECD countries. They deducted that these behaviors or
characteristics may have changed as time goes by. Then they concluded that among many
determinants of FDI, only few turned out to be significant in their research. These determinants
are from the perspective of the host country, which are: the currency union used; preferential
trade agreement (PTA) membership (to measure the openness and the partnership of trade and
investments); market size; tax rates; productivity rate; and economic growth, which measured
by the GDP growth (Eicher, Helfman, & Lenkoski, 2012). Another study proved that the
determinants of FDI inflows are trade openness and exchange rates. The researcher found that
other economic variables, such as inflation, GDP, and interest rate were insignificant to be
called as the determinants of FDI inflows (Faroh & Shen, 2015). In another study, it was proven
that the exchange rates, trade openness, and inflation significantly affect the FDI inflows
Proceedings of the 12th Asia-Pacific Conference on Global Business, Economics, Finance
and Social Sciences (AP17Indonesia Conference) ISBN: 978-1-943579-47-1
Jakarta-Indonesia. May 18-20, 2017. Paper ID: J735
5 www.globalbizresearch.org
(Kizilkaya, Ucler, & Ay, 2015). Other study has shown that trade openness, investment climate
(the previous or past behavior of the FDI), and political factor (in this research the researchers
used democracy as the measurement) are the determinants of FDI. Other variables, such as the
market size, potential growth, policy distortions (measured by exchange rate) have no impact
to FDI inflows (Nyarko, Nketiah-Amponsah, & Barnor, 2011). A Japanese researcher
conducted a study in India and proved that FDI in India is related positively with its GDP and
other market size variables, service sector variables, and infrastructure measured by telephone
lines per population (Tsuchiya, 2015). In one of Routledge’s publication, Handbook of
Southeast Asian Economics, the research shown that the economic stability and geographical
factors of the host country has been playing as major factors of FDI inflows. The economic
stability refers to the economic risk, such as exchange rates fluctuations and inflation (Sjoholm,
2015). In addition, another research proved that the main determinants of FDI inflows are the
market size and supportive infrastructure of the host country (Rehman, Ilyas, Alam, & Akram,
2011). A research was once conducted towards Association of Southeast Asian Nations
(ASEAN) top five countries, which are Indonesia, Malaysia, Singapore, the Philippines, and
Thailand. The research found that exchange rates, interest rates and GDP have significant
impact on FDI inflows in Thailand, Malaysia, and Indonesia. Inflation significantly affected
the FDI inflows in Thailand, Indonesia, and Singapore (Siddiqui & Aumeboonsuke, 2014).
2.3 Hypotheses
H0: There is no relationship between economic variable and FDI inflows
H1: There is a positive relationship between interest rate and FDI inflows
H2: There is a positive relationship between GDP and FDI inflows
H3: There is a positive relationship between trade openness and FDI inflows
3. Methodology
3.1 Data
The research used a set of time-series quarterly data from 1990 to 2014. The data for FDI
inflows are converted from yearly data to quarterly data using quadratic average-matched
technique, considering that FDI inflows data are reported annually (EViews, 2016). The
population of the data is Singapore, where the unit analysis is the country itself. This research
was using economic secondary data that were previously collected by professional
organizations and local government. The resources include: The World Bank Development,
International Monetary Fund (IMF), Department of Statistics Singapore, World Fact Book CIA,
and United Nations Conference on Trade and Development Statistics. The data for FDI inflows
are taken from The World Bank Development; the data for interest rates are taken from IMF;
and the data for GDP and trade openness are taken from Department of Statistics Singapore.
The functional form for both FDI inflows and GDP are changed into logarithmic form. The

Proceedings of the 12th Asia-Pacific Conference on Global Business, Economics, Finance
and Social Sciences (AP17Indonesia Conference) ISBN: 978-1-943579-47-1
Jakarta-Indonesia. May 18-20, 2017. Paper ID: J735
6 www.globalbizresearch.org
logarithmic form used is the natural log, which means log to the base of e, where e equals to
2.718. For all hypothesis testing, this research used 5% level of significance as the critical value
of rejection area. Diagnostic tests are performed with econometrics method by using EViews.
3.2 Empirical Model
The model for FDI inflows in Singapore is formulated from the three independent variables
of interest rate, GDP, and trade openness. The mathematical function is shown as follows:
FDI = ƒ (IR, GDP, TO)
After several econometrics treatment for data analysis, the model is transformed into an
autoregressive distributed lag (ARDL) model, where the dependent variable’s lagged values
are accounted in the model as additional regressors. The model is shown below:
LFDIt = β0 + β1LFDIt-1 + β2LFDIt-2 + β3LFDIt-3 + β4IRt + β5LGDPt + β6TOt + εt
where t-1 is variable’s lagged value by one period, t-2 is variable’s lagged value by two period,
and t-3 is variable’s lagged value by three period. The lag length was determined automatically
by Akaike Information Criterion (AIC).
Foreign Direct Investment (FDI) – the data used for FDI inflows are interpolated from
yearly data to quarterly data. Due to the reason of large amount of its value compared to interest
rate and trade openness, the data are transformed into its logarithmic value. Denoted as LFDI,
the FDI net inflows are measured in constant 2010 US dollar (USD).
Interest Rate (IR) – the variable is used as a proxy of government’s effort to attract FDI.
Higher interest rates lead to higher attraction of foreign investors to invest in the country. Since
a higher rate will lead to higher returns for investment, which increases the FDI inflows, the
relation is expected to be positive. Denoted as IR, the interest rate used in the research is the
real interest rate of lending money and measured in percentage.
Gross Domestic Product (GDP) – the variable is used as a proxy of market size and
economic growth of the country. Increasing FDI flows to countries with increasing GDP leads
to an increase in the economic activity. Growth rates are positively related to foreign capital
stocks. Therefore, the expected relationship is positive. Denoted as LGDP, the type of GDP
used in this research is the constant GDP measured in constant 2010 SGD. Again, note that the
use logarithmic function is to lessen the distance between the large values and small values.
Trade Openness (TO) - the variable is used as a proxy of liberalization or openness to
factors coming from outside the country. The openness to trade enhances the attraction of
foreign investors to invest in the country. Foreign firms that operate its business in the country
could freely sell their goods and services to other countries. It means broader target market is
becoming accessible to foreign firms. Also, the more membership of bilateral agreements or
regional FTAs that a country engaged in, the wider the access of other countries to the traded
goods and services. Denoted as TO, trade openness is calculated as the percentage of net trade
volume (net trade = exports – imports) divided by the real or constant GDP (Faroh & Shen,
Proceedings of the 12th Asia-Pacific Conference on Global Business, Economics, Finance
and Social Sciences (AP17Indonesia Conference) ISBN: 978-1-943579-47-1
Jakarta-Indonesia. May 18-20, 2017. Paper ID: J735
7 www.globalbizresearch.org
2015). The data for GDP used is the same data used for variable LGDP. The data for net trade
volume used are taken from its constant value.
3.3 Data Analysis
There are seven types of diagnostic test, which are: test for structural break; test for data
stationarity; ARDL estimation; test for optimum lag length; test for heteroscedasticity; test for
autocorrelation; and test for long-run relationship (Gujarati, 2003).
1. Structural Break: a set of time-series data that has a long-time period tend to have a structural
change in between. The structural break test is used to test the stability of parameters overtime
to determine point of break. The test conducted is multiple breakpoint test that uses Schwarz
Information Criterion (SIC).
2. Stationarity: stationarity is one unique characteristic of time-series dataset. The test is
performed to avoid indication of spurious regression and estimation. Sometimes the data should
involve differencing or detrending technique (I(1)). Augmented Dickey-Fuller (ADF) multiple
breakpoint unit root test is performed to test the stationarity. This test measures the stationarity
of data in multiple breakpoints exist. All data in all breakpoints should be stationary either in
level I(0) or I(1) (EViews, 2016).
3. ARDL Estimation: the ARDL estimation technique is used because the level of stationarity
of the model is a combination between I(0) and I(1). The inclusion of lagged values is
considered necessary because some economic variables need time to show its impact toward
other variables. The regression result is used as a short-run estimation.
4. Optimum Lag Length: as the result of inclusion of lagged values, the model needs to establish
the optimum lag length. The model selection criterion is used to choose the best number of lag
length. This research used Akaike Information Criterion (AIC) because it has the least harsh
penalty or error. The lower the AIC, the better the model.
5. Heteroscedasticity: heteroscedasticity is a phenomenon where the spread of variance is not
equal over time. The presence of heteroscedasticity could increase standard errors and increase
bias of the research. Due to the presence of lagged values, this research used autoregressive
conditional heteroscedasticity (ARCH) test. It accounts the unequal weight of observations and
increase preciseness (Engle, GARCH 101: The Use of ARCH/GARCH Models in Applied
Econometrics, 2001).
6. Autocorrelation: autocorrelation is the relationship exist in the residual members of series of
observation. It shows a systematic pattern within residuals that should not be existed. The
presence of autocorrelation increase bias and mislead the research. The research used Breusch-
Godfrey / Lagrange Multiplier (BG / LM) test. It needs a pre-specified lag length that was
obtained in optimum lag length test (Gujarati, 2003).
7. Long-Run Relationship: an ARDL model estimates the dynamic relationship between
variables. It is possible to transform the model into a long-run form even if the model has
Proceedings of the 12th Asia-Pacific Conference on Global Business, Economics, Finance
and Social Sciences (AP17Indonesia Conference) ISBN: 978-1-943579-47-1
Jakarta-Indonesia. May 18-20, 2017. Paper ID: J735
8 www.globalbizresearch.org
different level of integration (cointegration). To test the existence of long-run relationship of
an ARDL model, bounds test is conducted. If long-run relationship exists, it should proceed to
long-run estimation (Engle & Granger, Co-Integration and Error Correction: Representation,
Estimation, and Testing, 1987).
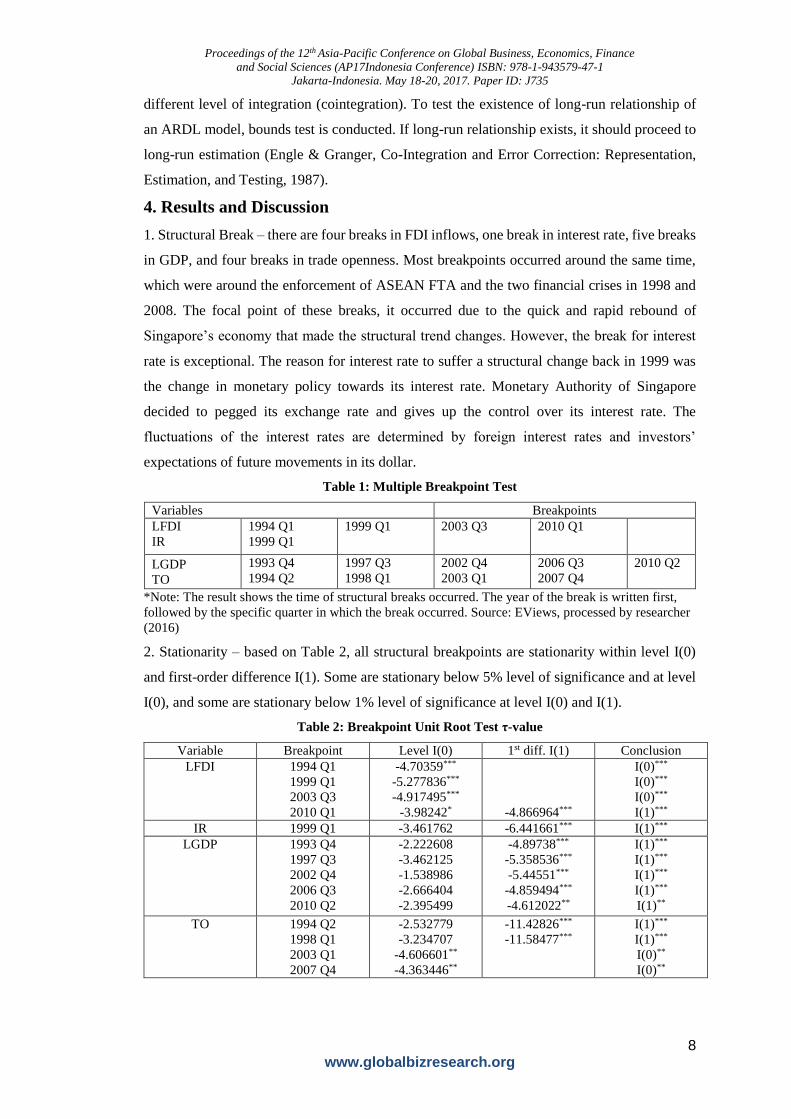
4. Results and Discussion
1. Structural Break – there are four breaks in FDI inflows, one break in interest rate, five breaks
in GDP, and four breaks in trade openness. Most breakpoints occurred around the same time,
which were around the enforcement of ASEAN FTA and the two financial crises in 1998 and
2008. The focal point of these breaks, it occurred due to the quick and rapid rebound of
Singapore’s economy that made the structural trend changes. However, the break for interest
rate is exceptional. The reason for interest rate to suffer a structural change back in 1999 was
the change in monetary policy towards its interest rate. Monetary Authority of Singapore
decided to pegged its exchange rate and gives up the control over its interest rate. The
fluctuations of the interest rates are determined by foreign interest rates and investors’
expectations of future movements in its dollar.
Table 1: Multiple Breakpoint Test
Variables Breakpoints
LFDI
IR
1994 Q1
1999 Q1
1999 Q1 2003 Q3 2010 Q1
LGDP
TO
1993 Q4
1994 Q2
1997 Q3
1998 Q1
2002 Q4
2003 Q1
2006 Q3
2007 Q4
2010 Q2
*Note: The result shows the time of structural breaks occurred. The year of the break is written first,
followed by the specific quarter in which the break occurred. Source: EViews, processed by researcher
(2016)
2. Stationarity – based on Table 2, all structural breakpoints are stationarity within level I(0)
and first-order difference I(1). Some are stationary below 5% level of significance and at level
I(0), and some are stationary below 1% level of significance at level I(0) and I(1).
Table 2: Breakpoint Unit Root Test τ-value
Variable Breakpoint Level I(0) 1st diff. I(1) Conclusion
LFDI 1994 Q1
1999 Q1
2003 Q3
2010 Q1
-4.70359***
-5.277836***
-4.917495***
-3.98242* -4.866964***
I(0)***
I(0)***
I(0)***
I(1)***
IR 1999 Q1 -3.461762 -6.441661*** I(1)***
LGDP 1993 Q4
1997 Q3
2002 Q4
2006 Q3
2010 Q2
-2.222608
-3.462125
-1.538986
-2.666404
-2.395499
-4.89738***
-5.358536***
-5.44551***
-4.859494***
-4.612022**
I(1)***
I(1)***
I(1)***
I(1)***
I(1)**
TO 1994 Q2
1998 Q1
2003 Q1
2007 Q4
-2.532779
-3.234707
-4.606601**
-4.363446**
-11.42826***
-11.58477***
I(1)***
I(1)***
I(0)**
I(0)**

Proceedings of the 12th Asia-Pacific Conference on Global Business, Economics, Finance
and Social Sciences (AP17Indonesia Conference) ISBN: 978-1-943579-47-1
Jakarta-Indonesia. May 18-20, 2017. Paper ID: J735
9 www.globalbizresearch.org
*Note: Table 4.3 summarizes the τ-value for each stationarity, followed with * indicator. The indicator
shows that the computed τ-value exceeds the critical τ-value. ***, **, * are 1%, 5% and 10% respectively.
Source: EViews, processed by researcher (2016)
3. ARDL Estimation – Table 3 shows the components of the model with its variables’
coefficients and probability. Based on the result, the lagged values are applied only to the
dependent variable, LFDI, with the lag of three time periods. The three independent variables,
IR, LGDP, and TO, have no lagged values. The Probability of t-statistic column shows that in
this ARDL estimation, interest rate is highly insignificant to the model. The second lagged
value of FDI is nearly significant at 10% level of significance. The rest of the regressors are
significant below 5% and 1%. First, in the short run, the lagged values of FDI inflows give
significant contribution toward the current FDI inflows. It shows that the decision of current
investment is affected by the past behavior of previous investment. Second, interest rate barely
affects FDI inflows, with coefficient of 0.0206 and insignificant probability of 0.5667. Third,
GDP and trade openness are proved to affect FDI inflows significantly, where GDP has a
coefficient of 0.4439 and probability of nearly 0, and trade openness with coefficient of 0.4351
and probability of 0.03980. As the explanation of structural breaks existence explain how the
change in trade affected the economic growth and its GDP, it also explains how GDP and trade
openness is closely related to the growth of foreign investment. The adjusted R2 is 0.9593,
which suggest that the variability in the dependent variable is explained 95.93% by the
variability of its regressors. The Durbin-Watson statistic is 2.0435, which suggest that the
model contains no serial correlation between disturbances.
Table 3: ARDL Estimation
Variables Coefficient t-statistic Probability of t-statistic
LFDI (-1) 1.178535 11.45765 0.00000***
LFDI (-2) -0.258412 -1.623832 0.10790
LFDI (-3) -0.252095 -2.474089 0.01520**
IR 0.020617 0.575043 0.56670
LGDP 0.443864 4.309043 0.00000***
TO 0.43514 2.085559 0.03980**
C -3.552466 -1.992763 0.04930**
�̅�2 = 0.959268 Prob. (F-stat) = 0.000 Durbin-Watson stat = 2.043463
*Note: ***, **, * are 1%, 5% and 10% respectively. Source: EViews, processed by researcher (2016)
4. Optimum Lag Length – The maximum lag length inserted was 4 lags for both dependent and
independent variables. The result shows the 20 best model with lowest AIC values. As seen in
Figure 1, the lowest AIC value shows that the optimum lag length is ARDL(3,0,0,0). It means
that the dependent variable has 3 lags, and the three independent variables have 0 lag. With
AIC value of -0.5954, the optimum lag length is 3 lags for LFDI and 0 lag for IR, LGDP, and
TO.

Proceedings of the 12th Asia-Pacific Conference on Global Business, Economics, Finance
and Social Sciences (AP17Indonesia Conference) ISBN: 978-1-943579-47-1
Jakarta-Indonesia. May 18-20, 2017. Paper ID: J735
10 www.globalbizresearch.org
Figure 1: AIC Criteria Graph
Source: EViews, processed by researcher (2016)
5. Heteroscedasticity – Table 4 shows that the probability of ARCH value has failed to reject
the null hypothesis. With the computed χ2 value (ARCH value) of 2.03263 and its probability
of 0.5657, the value is not statistically significant to reject the null hypothesis. Thus, the null
hypothesis is failed to reject. In other words, the ARCH components are not present and the
model is homoscedastic.
Table 4: Summary of Heteroscedasticity and Autocorrelation Test
Test Lag order χ2 Probability of χ2 Result
ARCH 3 2.03263 0.5657 Fail to reject H0
BG / LM 3 3.448664 0.3275 Fail to reject H0
Source: EViews, processed by researcher (2016)
6. Autocorrelation – Table 4 shows that the probability of BG-value has failed to reject the null
hypothesis. With the number of lag order of 3, which were specified using the AIC, the
computed χ2 value (BG-value) of 3.448664, and its probability of 0.3275, the value is not
statistically significant to reject the null hypothesis. Thus, the null hypothesis is failed to reject.
In other words, there is no serial correlation up to lag order 3.
Table 5: ARDL Bounds Test for Cointegration
Test Statistic Value Relationship
F-statistic 8.944848*** Long-run
Critical Value I(0) / Lower Bound I(1) / Upper Bound
10% 2.72 3.77
5% 3.23 4.35
2.5% 3.69 4.89
1% 4.29 5.61
Source: EViews, processed by researcher (2016)
Table 6: ARDL Cointegrating and Long-Run Form
Cointegrating Form
Variables Coefficient t-statistic Probability of t-
statistic
D(LFDI (-1)) 0.510507 5.69899 0.0000***
D(LFDI (-2)) 0.252095 2.474089 0.0152**
D(IR) 0.020617 0.575043 0.5667
D(LGDP) 0.443864 4.309043 0.0000***
TO 0.43514 2.085559 0.0398**

Proceedings of the 12th Asia-Pacific Conference on Global Business, Economics, Finance
and Social Sciences (AP17Indonesia Conference) ISBN: 978-1-943579-47-1
Jakarta-Indonesia. May 18-20, 2017. Paper ID: J735
11 www.globalbizresearch.org
CointEq (-1) -0.331972 -5.966825 0.0000***
Long-Run Coefficient
Variables Coefficient t-statistic Probability of t-
statistic
IR 0.062105 0.591119 0.5559
LGDP 1.337053 7.298841 0.0000***
TO 1.310774 2.182625 0.0317**
C -10.701107 -2.249445 0.0269**
Cointegration Equation = LFDI – (0.0621 IR + 1.3371 LGDP + 1.3108 TO – 10.7011)
Note: ***, **, * are 1%, 5% and 10% respectively. The upper part of Table 4.7 presents the cointegrating
form of dependent variable and independent variables. The lower part presents the coefficient that forms
a long-run relationship. Source: EViews, processed by researcher (2016)
7. Long-Run Relationship – based on Table 5, the result has shown that there is level and long-
run relationship between dependent and independent variables. With the computed F-statistic
of 8.944848 and the probability of F-statistic is smaller than 0.01, it passes both lower and upper
bound of 1% level of significance. Table 6 has the focus of regressor CointEq (-1). This variable
represents the error-correction coefficient. The coefficient should be significant below 5% level
of significance and negative in value to be said that cointegration exists. With the value of error-
correction coefficient of -0.331972 and its probability of t-statistic of 0.0000, the coefficient is
highly significant. The lower part of Table 6 presents the coefficient of the long-run relationship
between FDI inflows, interest rate, GDP, and trade openness. Interest rate is not statistically
significant, while GDP and trade openness are still statistically significant in the long-run. The
cointegration equation is presented at the very bottom of the table. Although interest rate’s
coefficient increases by 310% from the short-run ARDL estimation, the probability of t-statistic
shows that both in long-run and short run, the FDI inflows is not affected by the interest rate.
In contrast, GDP and trade openness impact Singapore’s FDI inflows significantly. Both
coefficient show that if 1 unit change in each variable changes FDI inflows for around 0.44
unit, which is considered to be high. This could be explained by the fact that Singapore has
been attracting its investor with other measures that include GDP and trade openness. The three
variables’ significance toward FDI inflows are explained together in one discussion as follows:
a. Singapore has been attracting its foreign investors with tax incentives. Low corporate
tax, tax exemptions for all foreign-sourced income in several industries, enhance more tax
incentives specifically for firms operating in financial services and other industries that it tries
to grow, extend the maximum incentive duration for pioneer that has its business activities in
Singapore, engaged in double taxation treaties (DTTs) with more than 70 countries, tax
dividend of 0%, and the highest tax applied to the income is only 17% (World Trade
Organization, 2008). Therefore, interest rates are no longer important in foreign investors eyes,
for its tax incentives has saved them a lot of money. The yield that was expected from the
interest rates are offsetted by the fact that Singapore has been very active in trading.

Proceedings of the 12th Asia-Pacific Conference on Global Business, Economics, Finance
and Social Sciences (AP17Indonesia Conference) ISBN: 978-1-943579-47-1
Jakarta-Indonesia. May 18-20, 2017. Paper ID: J735
12 www.globalbizresearch.org
b. Singapore has been engaging itself into many bilateral and regional FTAs. Trade
relations is one of the motives in explaining FDI (Salvatore, 1995). By engaging in many FTAs,
Singapore increases its openness, both trade and investment sectors, therefore enlarging the
connections for trading and investing partners. By investing in Singapore that increases its trade
volume over time, it is expected that the firms operating inside the country will be able to access
new market abroad through trading.
c. The increase in trading volume increases the country’s GDP. Higher GDP leads to
higher economic growth of the country. From the previous explanation, it could be seen that
the economic growth is significantly affect the decision of FDI inflows. Higher economic
growth implies higher contribution and economically active in the global market, higher
consumption, and greater market size and spending. Therefore, investors are expecting more
revenue from businesses in Singapore (World Trade Organization, 2008).
d. Singapore liberalized the financial and legal sectors to enhance the growth in its
economy. It planned to turn the city into a financial hub, where Singapore is a focal point for
the financial services industry. It has becoming the home for financial services, especially in
finance (banks) and insurance sector (World Trade Organization, 2008).
5. Conclusions and Recommendations
5.1 Conclusion
The research studied the relationship of FDI inflows and some of its economic determinants
in Singapore. The purpose is to establish the relationship and magnitude of interest rate, GDP,
and trade openness toward the FDI inflows. The findings have shown that interest rate has no
significant impact toward FDI inflows in Singapore for both short-term and long-term. It does
have a positive impact toward FDI inflows, but the significance is nowhere to be found. This
result has been found to be in contrast with any other previous literatures which stated that
interest rate has a positive significant influence toward FDI inflows in other countries. As the
interest rates in Singapore have gone only minor fluctuations over time, the FDI inflows kept
increasing and reached its peak disregarding the growth of interest rates. In addition, the usage
of secondary data could increase the possibility of variable’s insignificance. It frequently
contains numbers of errors due to erroneous transcription and faulty rounding-offs, making it
less dependable for the research accuracy. Nonetheless, the result supported H1 with minor
importance in impacting FDI inflows to change. Also, the findings have shown that both GDP
and trade openness have significant impact toward FDI inflows in short-term and long-term.
Both have shown positive relationship with FDI inflows for around the same magnitude. These
results correspond with other previous literatures which stated that GDP and trade openness
enhance FDI inflows in a country. The FDI inflows kept increasing in accordance of its market
size and trade liberalization’s growth. The result supported both H2 and H3, which stated that
Proceedings of the 12th Asia-Pacific Conference on Global Business, Economics, Finance
and Social Sciences (AP17Indonesia Conference) ISBN: 978-1-943579-47-1
Jakarta-Indonesia. May 18-20, 2017. Paper ID: J735
13 www.globalbizresearch.org
GDP and trade openness have positive impact toward the FDI inflows in Singapore. Thus, the
research has answered the research questions where interest rate insignificantly impacted the
FDI inflows, while GDP and trade openness significantly impacted the FDI inflows in
Singapore.
5.2 Research Limitation
The limitation of this research is data availability. The availability for all variables are vary.
The quarterly data of FDI inflows were not available and needed to be interpolated. If the
research could use the real quarterly data for FDI inflows, it could decrease the standard errors
and increase precision of estimation.
5.3 Future Research Recommendation
Hence, this research has a suggestion for the future research. Due to its unique economic
conditions, there should be more studies conducted about particular sectors of FDI in
Singapore, especially in financial & insurance sector and manufacturing sector. Investment
decisions may vary according to the nature of each sector. Financial & insurance sector and
manufacturing sector have been holding 50% and 15% of Singapore’s FDI inflows shares
respectively. Moreover, the manufacturing sector is now growing its share in Singapore.
References
Central Intelligence Agency, 2016. World FactBook CIA. [Online]
Available at: https://www.cia.gov/library/publications/the-world-factbook/rankorder/2198rank.html
[Accessed 27 August 2016].
Chawla, K. & Rohra, N., 2015. Determinants of FDI: A Literature Review. The International Journal
of Business & Management, pp. 227-250.
Daniels, J. D., Radebaugh, L. H. & Sullivan, D. P., 2013. Globalization and International Business. In:
International Business: Environment and Operations. Harlow: Pearson Education, pp. 45-87.
Dunning, J. H., 1993. Global Strategy and the Theory of International Production. In: The
Globalization of Business: The Challenge of the 1990s. London: Routledge Revivals, pp. 78-97.
EViews, 2016. EViews Help. [Online]
Available at: http://www.eviews.com/help/helpintro.html
EViews, 2016. EViews Tutorial: Frequency Conversion Part A. [Online]
Available at: http://www.eviews.com/Learning/freqconv_a.html
Eicher, T. S., Helfman, L. & Lenkoski, A., 2012. Robust FDI Determinants: Bayesian Model -
Averaging in the Presence of Selection Bias. Journal of Macroeconomics, pp. 637-651.
Eiteman, D. K., Stonehill, A. I. & Moffett, M. H., 2013. Foreign Direct Investment: Return and Risks.
In: Multinational Business Finance. Harlow: Pearson Education, pp. 482-509.
Engle, R. F., 2001. GARCH 101: The Use of ARCH/GARCH Models in Applied Econometrics. The
Journal of Economic Perspectives, pp. 157-168.
Engle, R. F. & Granger, C. W. J., 1987. Co-Integration and Error Correction: Representation,
Estimation, and Testing. Econometrica, pp. 251-276.
Faroh, A. & Shen, H., 2015. Impact of Interest Rates on Foreign Direct Investment: Case Study Sierra
Leone Economy. International Journal of Business Management and Economic Research (IJBMER),
pp. 124-132.
Gujarati, D. N., 2003. Basic Econometrics, Fourth Edition. New York: Mc-Graw Hill.
Proceedings of the 12th Asia-Pacific Conference on Global Business, Economics, Finance
and Social Sciences (AP17Indonesia Conference) ISBN: 978-1-943579-47-1
Jakarta-Indonesia. May 18-20, 2017. Paper ID: J735
14 www.globalbizresearch.org
Hansen, A. H., 1939. Economic Progress and Declining Population Growth. The American Economic
Review, pp. 1-15.
Kindleberger, C. P., 1969. American Business Abroad: Six Lectures on Direct Investment. New
Haven(CT): Yale University Press.
Kizilkaya, O., Ucler, G. & Ay, A., 2015. The Interaction between Exchange Rate and Foreign Direct
Investments: Evidence from Turkey. Journal of Business and Economics, pp. 337-347.
Nayak, D. & Choudhury, R. N., 2014. A Selective Review of Foreign Direct Investment Theories,
Bangkok: Asia - Pacific Research and Training Network on Trade.
Nyarko, P. A., Nketiah-Amponsah, E. & Barnor, C., 2011. Effects of Exchange Rate Regimes on FDI
Inflows in Ghana. International Journal of Economics and Finance, pp. 277-286.
Organisation for Economic Cooperation and Development, 2002. Foreign Direct Investment for
Development: Maximising Benefits, Minimising Costs, France: OECD Publications Service.
Parkin, M., 2014. Monetary Policy. In: Economics, Eleventh Edition. Harlow: Pearson Education
Limited, pp. 753-778.
Pugel, T. A., 2015. Why Everybody Trades: Comparative Advantage. In: International Economics.
New York: McGraw-Hill, pp. 31-46.
Rehman, A., Ilyas, M., Alam, H. M. & Akram, M., 2011. The Impact of Infrastructure on Foreign
Direct Investment: The Case of Pakistan. International Journal of Business and Management, pp. 268-
276.
Salvatore, D., 1995. International Resource Movements and Multinational Corporations. In:
International Economics. Englewood Cliffs: Prentice Hall, pp. 367-395.
Siddiqui, H. A. A. & Aumeboonsuke, V., 2014. Role of Interest Rate in Attracting the FDI: Study on
ASEAN 5 Economy. International Journal of Technical Research and Applications, pp. 59-70.
Sjoholm, F., 2015. Foreign Direct Investment in Southeast Asia. s.l., Routledge, pp. 1-36.
Tsuchiya, Y., 2015. Determinants of Foreign Direct Investment in India: Region Sector Wise Analysis,
Tokyo: Tokyo University of Foreign Studies.
United Nations Conference on Trade and Development, 1999. Foreign Direct Investment, Trade and
Development: Policy Issues. In: Foreign Direct Investment and Development. Geneva: United Nations
Publication, pp. 45-52.
United Nations Conference on Trade and Development, 2009. Host Country Determinants of FDI. In:
The Role of International Investment Agreements in Attracting Foreign Direct Investment to
Developing Countries. New York; Geneva: United Nations Publication, pp. 5-28.
United Nations, 2015. Foreign direct investment: Inward and Outward flows and stock, annual, 1980-
2014. [Online]
Available at: http://unctadstat.unctad.org/wds/TableViewer/tableView.aspx
Vernon, R., 1966. International Investment and International Trade in The Product Cycle. Quarterly
Journal of Economics, pp. 190-207.
World Trade Organization, 2008. [Online]
Available at: https://www.wto.org/english/tratop_e/tpr_e/s202-01_e.doc