Embed Size (px)
Citation preview
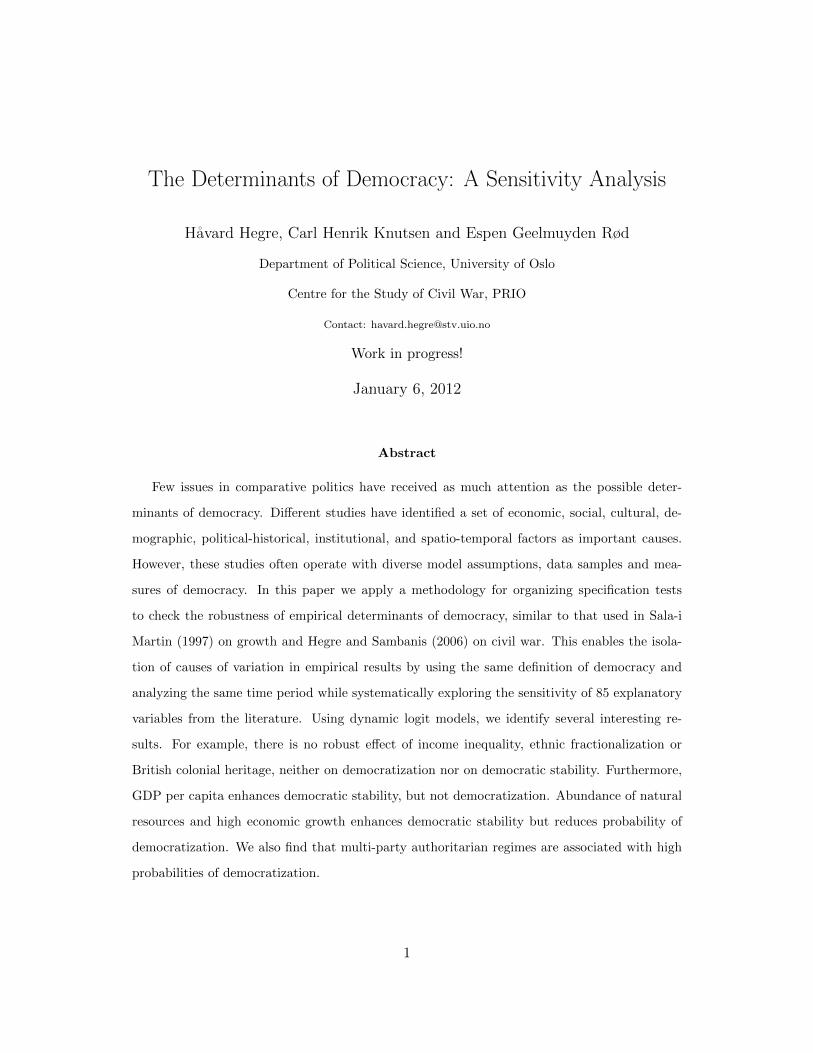
The Determinants of Democracy: A Sensitivity Analysis
Havard Hegre, Carl Henrik Knutsen and Espen Geelmuyden Rød
Department of Political Science, University of Oslo
Centre for the Study of Civil War, PRIO
Contact: [email protected]
Work in progress!
January 6, 2012
Abstract
Few issues in comparative politics have received as much attention as the possible deter-
minants of democracy. Different studies have identified a set of economic, social, cultural, de-
mographic, political-historical, institutional, and spatio-temporal factors as important causes.
However, these studies often operate with diverse model assumptions, data samples and mea-
sures of democracy. In this paper we apply a methodology for organizing specification tests
to check the robustness of empirical determinants of democracy, similar to that used in Sala-i
Martin (1997) on growth and Hegre and Sambanis (2006) on civil war. This enables the isola-
tion of causes of variation in empirical results by using the same definition of democracy and
analyzing the same time period while systematically exploring the sensitivity of 85 explanatory
variables from the literature. Using dynamic logit models, we identify several interesting re-
sults. For example, there is no robust effect of income inequality, ethnic fractionalization or
British colonial heritage, neither on democratization nor on democratic stability. Furthermore,
GDP per capita enhances democratic stability, but not democratization. Abundance of natural
resources and high economic growth enhances democratic stability but reduces probability of
democratization. We also find that multi-party authoritarian regimes are associated with high
probabilities of democratization.
1
1 Introduction
The recent wave of revolutions and revolutionary attempts in North Africa and the Middle East
have not only been important political events, they have also re-sparked old academic debates. The
calls for democracy in these countries have made some authors declare Huntington’s argument on
the incompatibility of Islam and democracy for dead. Others have, particularly in relation with the
Tunisian revolution, brushed off Lipset’s classic modernization argument, pointing to the relatively
high income level and the size of the middle class in that country. Many observers and political
scientists have, however, expressed their surprise at calls for democracy in countries such as Yemen
and Libya, and questioned the sincerity of such calls and scepticism regarding the future prospects
of democratization efforts.
This situation is not dissimilar from the surprise and scepticism raised about 20 years earlier
when old dictatorships where challenged in Sub-Saharan Africa (e.g. Bratton and van de Walle
1997). African countries were, according to prevalent political science theories, never supposed
to democratize and particularly not experience consolidation of their democracies, with their low
income and education levels, their resource-based economies, their deep ethnic cleavages, their
problematic political history with colonial rule, and other characteristics supposedly hostile to
democracy. Nevertheless, electoral democracy has survived in many countries on that continent,
and there are even signs of gradually improving democratic quality and improved protection of
civil liberties (Lindberg 2006). Hence, the political developments in Sub-Saharan Africa, and
later in North Africa, have challenged political scientists and their theories of democratization and
democratic consolidation.
Indeed, this discrepancy between the empirical implications from prominent political science
theories and empirical events should not be surprising to those having scrutinized the statistical
literature on the determinants of democracy. The lack of robust results is perhaps the most notable
characteristic of this relatively large literature. Strong theoretical claims have been made on the
importance of various factors, from income level and income inequality to religion. However, em-
pirical studies often find only weak results that are not robust to changes in model specifications.
This paper attempts to clarify and establish how robust the various determinants of democracy
are, and thus contribute to mitigate the existing confusion at the center of the democratization
literature.
2 Literature review
As noted above, the literature on determinants of democracy is large, and points to a vast set of
quite different potential explanatory factors. We do not take aim to review the entire literature,
but rather focus on some particularly important proposed explanatory factors and debates from
the literature.
2
Economic factors are among the most studied potential determinants of democracy, and a
country’s level of GDP per capita has received particular focus. Lipset (1959) famously argued
that a high GDP per capita increased the probability of a country being democratic, and several
later studies corroborated this result (e.g. Diamond 1992; Arat 1991; Hadenius 1992; Przeworski
and Limongi 1997; Przeworski et al. 2000; Boix and Stokes 2003; Hadenius and Teorell 2005;
Inglehart and Welzel 2006). Hence, the notion that “the richer a country is, the more likely
it is to be democratic” was for a long time considered relatively well established. However, a
possible relationship between democracy and income level may be due to richer countries having
a higher probability of democratizing, but also to democracies becoming increasingly more stable
than dictatorships as countries get richer. If only the latter effect is present, the relationship
between income and probability of being a democracy is only due to the fact that rich democracies
survive longer than rich dictatorships. Indeed, Przeworski and Limongi (1997) find that democracy
is not related with income because of rich countries being more prone to democratization, but
rather because rich democracies are exceptionally stable.1 This result has been contested by later
studies. For example, Hadenius and Teorell (2005) show that the relationship between income and
democratization changes when one substitutes the dichotomous ACLP measure, used by Przeworski
and Limongi (1997), with other measures, and Boix and Stokes (2003) find that probability of
democratization increases with income, when the sample is extended back into the 19th century,
and when one accounts for oil-rich countries.
When it comes oil income and income from other natural resources, there is a large theoretical
and empirical literature on how such income may affect political institutions differently than income
stemming from other sources (e.g. Bueno de Mesquita et al. 2003; Bueno de Mesquita and Smith
2009; Ross 2001). More specifically, the literature has highlighted the potential existence of a
“political resource curse”, particularly focusing on the stabilizing effects on dictatorship, and hence
reduced probability of democratization, resulting from high natural resource income. This further
points to a more nuanced understanding of the roles of high income levels and sustained income
growth for democracy.
Indeed, the modernization literature and other contributions point to a set of variables related
to economic development (or modernization), other than income level, that may be of particular
relevance for democracy. First, as noted by Lipset (1959) a high level of education in the population
may increase both citizens’ desire and capacity to establish democracy and participate in democratic
processes (see also Almond and Verba 1963; Diamond 1992). Second, industrialization, with the
1See also Przeworski et al. (2000). Furthermore, the positive effect of income on level of democracy may verywell be due to misspecification bias in the statistical models used, more particularly omitted variable bias: Acemogluet al. (2008) find no effect of income on democracy when using fixed-effects models (see also Robinson 2006). Thecorrelation between income and democracy is according to this analysis most likely due to prior variables that arecountry- or history specific. However, later statistical studies incorporating country-fixed effects have questionedthis result, “re-establishing” a positive effect of income on level of democracy (Moral-Benito and Bartolucci 2011;Benhabib, Corvalan and M. 2011).
3
complementary transformation of a society from an agrarian to a manufacturing and trading one,
generates social differentiation. Lipset (1959) highlighted the important role of the middle class for
establishing and stabilizing a democracy. Moore Jr (1966), with a somewhat different argument,
also points to the importance of the bourgeoisie dominating society, economy and politics for the
probability of democratization. Rueschemeyer, Stephens and Stephens (1992), on the other hand,
argues that industrialization is conducive to democratization, but that this is rather due to the
emergence of an organized industrial working-class. O’Donnell (1973) even argues that the middle
class can be detrimental to democratization, drawing on evidence from Latin America. Nevertheless,
many contributions to the literature argue that rural, agrarian societies are not as conducive to
democracy urban, industrializing ones. Other potentially important ‘modernization variables’ are
related to communications infrastructure, which allows for rapid diffusion of ideas and information
across and within borders, perhaps enhancing the prospects democratization (see, e.g. Diamond
2008)
Also short-term economic developments may impact on a country’s regime type. Przeworski
and Limongi (1997) find that economic crises increase the probability of regime breakdown in
general. Regimes that experienced a decreasing GDP per capita in the previous year were much
more likely to fall than those experiencing positive economic growth. This was true for both
democracies and dictatorships. However, especially poor democracies were vulnerable to economic
crises. Richer democracies, however, are extremely resistant to crises. When it comes to poor
and rich dictatorships, there were smaller differences in regime life expectancy; both rich and poor
dictatorships are threatened by economic crises. Also other measures of economic performance,
and even particular economic policies, may impact on the stability of democratic and autocratic
regimes, for example because they may impact on popular grievances directed towards the regime
(e.g. Gurr 1970; Ponticelli and Voth 2011)
Income inequality may also affect regime change and stability. Lipset (1959) argued that democ-
racy was less tenable in societies with high levels of social conflict, and economic inequality is widely
assumed to increase social conflict. Inequality-induced social grievances may lead to demands for
revolution and left-wing dictatorship (Boix 2003; Acemoglu and Robinson 2006). Also, the well-
off in unequal societies may particularly fear democracy because of high redistributive costs, and
rather favor an elite-controlled authoritarian regime. Boix (2003) argues that a decrease in eco-
nomic inequality leads to a higher probability of democratization, since the rich will have less to
lose from taxation in relatively equal societies. They will thus more easily agree to the poor’s de-
mands without risking a fight. However, a low degree of inequality may also reduce the likelihood
of democratization, as the poor are less eager to fight for democracy if they are already relatively
well-off and therefore have little to gain economically from democratization. In unequal societies,
on the other hand, the poor have much to gain from democratization, and the rich are not able to
credibly commit to redistribution in the future under dictatorship (Acemoglu and Robinson 2000).
4
Indeed, empirical studies on income inequality and democracy have produced quite mixed results
(e.g. Muller 1988; Bollen and Jackman 1995). The relatively recent study by Houle (2009) finds no
clear effect of inequality on the probability of democratization, but does find evidence indicating
that low inequality stabilizes existing democracies.
Also different types of non-economic factors have been put forth as important determinants
of democracy. One group of explanations are related to particular values, or other cultural traits,
having important impact on democratization and democratic consolidation (e.g. Almond and Verba
1963; Inglehart and Welzel 2006). Furthermore, values, attitudes and other cultural variables with
proposed implications for the sustainability of democracy are often been linked to factors such as
religion and geographic region. Huntington (1996), for example, argues that Islamic countries are
less susceptible to democracy. Some decades ago, Catholicism was argued to reduce the probability
of having a democratic regime, especially when compared with the effect of Protestantism (see,
e.g. Lipset and Lakin 2004). Furthermore, several academics and politicians have argued that
so-called “Asian Values”, often linked to Confucianism, promotes hierarchical and authoritarian
government, and provides bad conditions for democracy (see the discussion in Sen 1999). Lipset
(1959) also discusses how particular values are conducive to democracy, but this argument points
out that values and attitudes are endogenous, and that they are systematically changed by economic
development processes. Inglehart (1997) and Inglehart and Welzel (2006) find that liberal, freedom-
oriented values become more preponderant in richer and more developed societies, and that these
values in turn are important determinants of democracy.
The ethnic fractionalization structure of a country may also impact on the country’s regime type.
Theoretical and empirical studies indicate that a heterogenous population may make it more difficult
to solve various coordination problems that are vital for ensuring efficiency-enhancing public goods
provision (Alesina, Baquir and Easterly 1999; Baldwin and Huber 2010). Furthermore, various
types of heterogeneity in the population, among them ethnic, lingustic and religious heterogeneity,
may impact on the design of political institutions and regime type (see, e.g. Lijphart 1999). For
example, there may be stronger incentives for various groups of citizens to capture and monopolize
power if there is a high degree of ethnic heterogeneity (e.g. Miquel 2007). The size of the population
could also affect the probability of democratization and democratic stability. However, although
some arguments point out that democracy could operate more smoothly in smaller communities
(e.g. Dahl and Tufte 1973), the net effect of population size is quite unclear.
Particular variables related to historical experiences have also been identified as potential deter-
minants of democracy. For example, it has been argued that former British colonies are more likely
to be democratic than other former colonies (see e.g. Lipset and Lakin 2004, 173–178). Legal struc-
tures are strongly correlated with former colonial power, as the type of legal structure in a country
often stems from a particular inherited legal tradition, like British Common Law or French Civil
Law (Djankov et al. 2003), and legal origin may impact on various institutional aspects (La Porta
5
et al. 1999). The more general point is that political-historical variables are often correlated with
present institutional characteristics. Institutions were often formed in a particular historic context,
for example the under influence of a colonizing power with particular institutional preferences, and
institutions show a great deal of inertia. This implies that the institutional structure of the past
often strongly resembles that of the present (e.g. North 1990; Acemoglu, Johnson and Robinson
2001). Hence, one of the potentially most important historical variable when it comes to explaining
democracy is a country’s past experiences with democracy (see, e.g. Helliwell 1994).
However, also other political-institutional variables, for example related to type of dictator-
ship that has ruled historically or current constitutional characteristics may impact on probability
of democratization or democratic stability (e.g. Linz 1990; Cheibub and Limongi 2002; Cheibub
2007; Hadenius and Teorell 2007). Furthermore, economic-institutional aspects related to property
rights systems and other market-regulating institutions and institutions those affect the control of
corruption may impact on probability of transitions to and from democracy (see, e.g. Feng 2005;
North, Wallis and Weingast 2009). Also more spontaneous, non-institutionalized political processes
may impact on regime transitions. Although regime type may also influence various measures of
political stability (Feng 2005), various such measures, like revolutions and politically motivated
assassinations, are likely to negatively affect the survival of both democracies and dictatorships
quite directly. There is also evidence indicating that the probability of regime survival increases
quite a lot as a regime ages (Clague et al. 2003).
The list of factors above does not exhaust the potential factors those may determine democ-
ratization and democratic stability. For example, spill-over effects from neighbors and the specific
identity and strength of regional or global powers in a particular region may be relevant for regime
stability and change (e.g. Starr 1991; Gleditsch 1996; Gleditsch and Ward 2006). More generally,
the probability of democratization and the stability of democratic regimes is likely correlated with
spatial and temporal factors because of various reasons (e.g. Huntington 1991).
For the empirical analysis below, we have gathered and classified proposed explanatory vari-
ables from the literature on the determinants of democracy. We operate with 15 “concepts” that
are identifiable from the review in this section, and each concept includes a set of indicators (85
in total). In accordance with the discussion on structural economic factors, we include Resource
curse, Industrialization and Urbanization, Modernization indicators, Health, Education and Income
Inequality among our concepts. Also in accordance with the discussion above, we include Economic
performance and policy. In order to investigate the discussed cultural and demographic factors, we
also include Ethnicity and religion and Population. Furthermore, the review indicated the impor-
tance of historical, institutional and political factors. This leads us to include Colonial heritage,
Regime type, Institutional characteristics and Political Stability. Finally, we add Region and Time
to address spatial and temporal factors potentially affecting regime type.
6
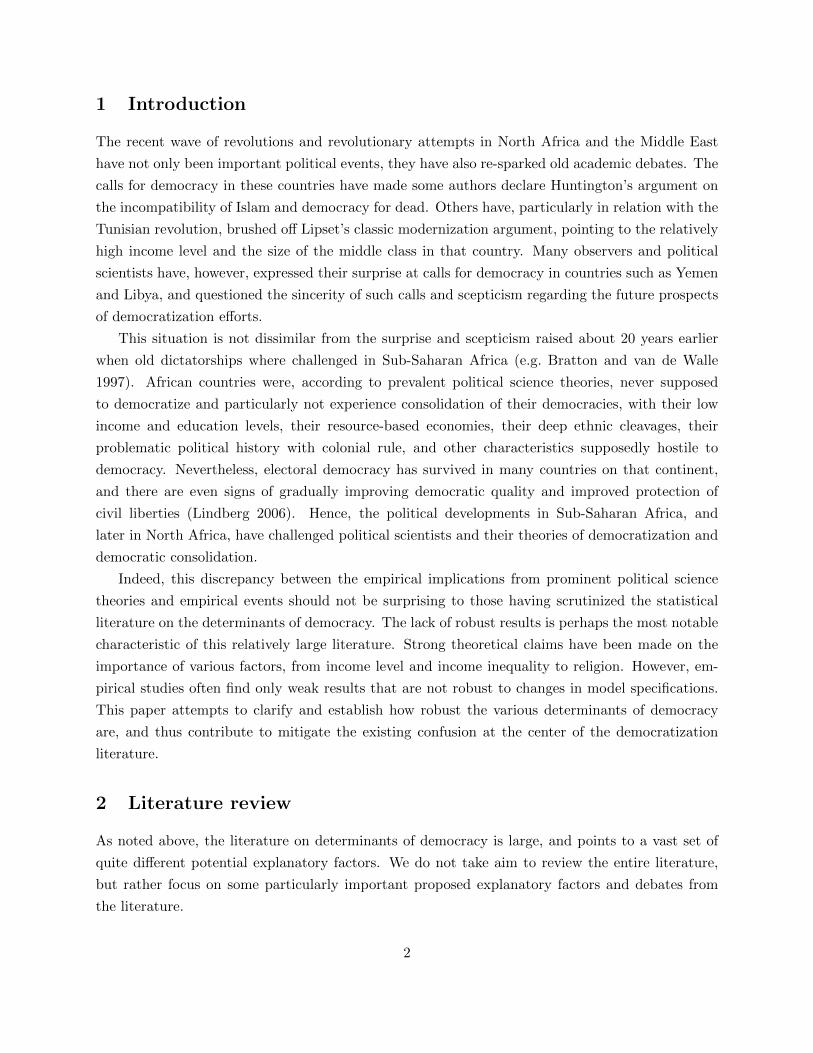
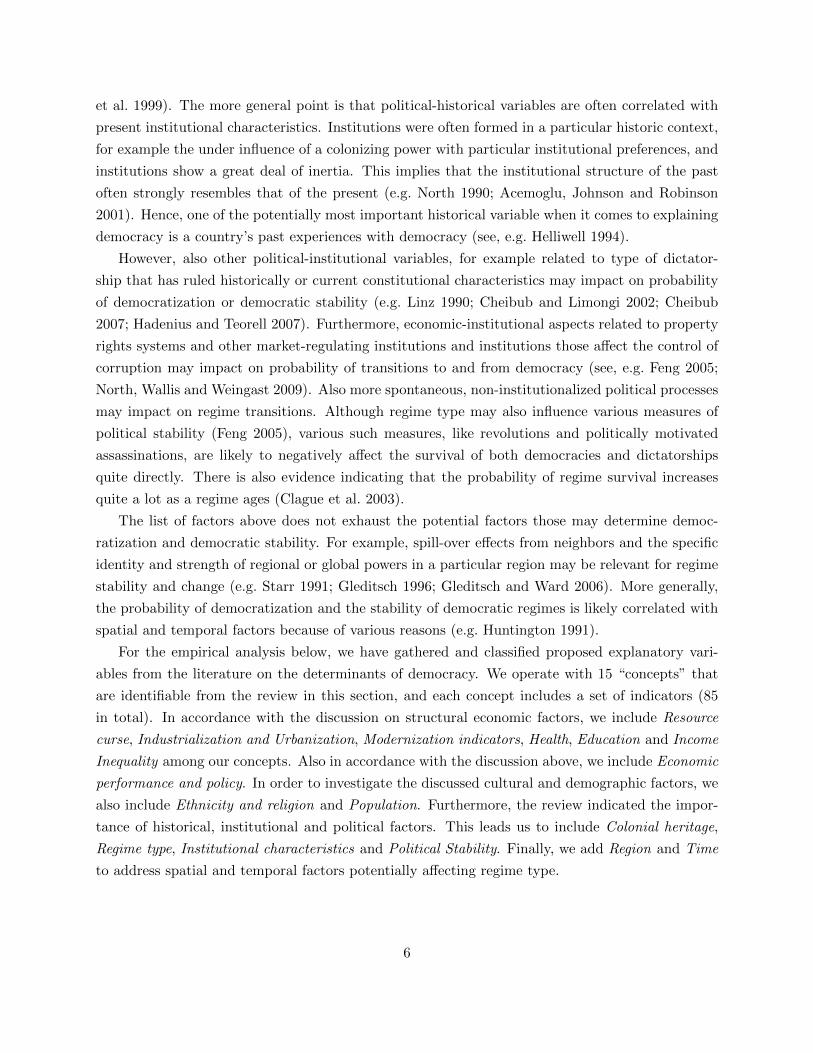
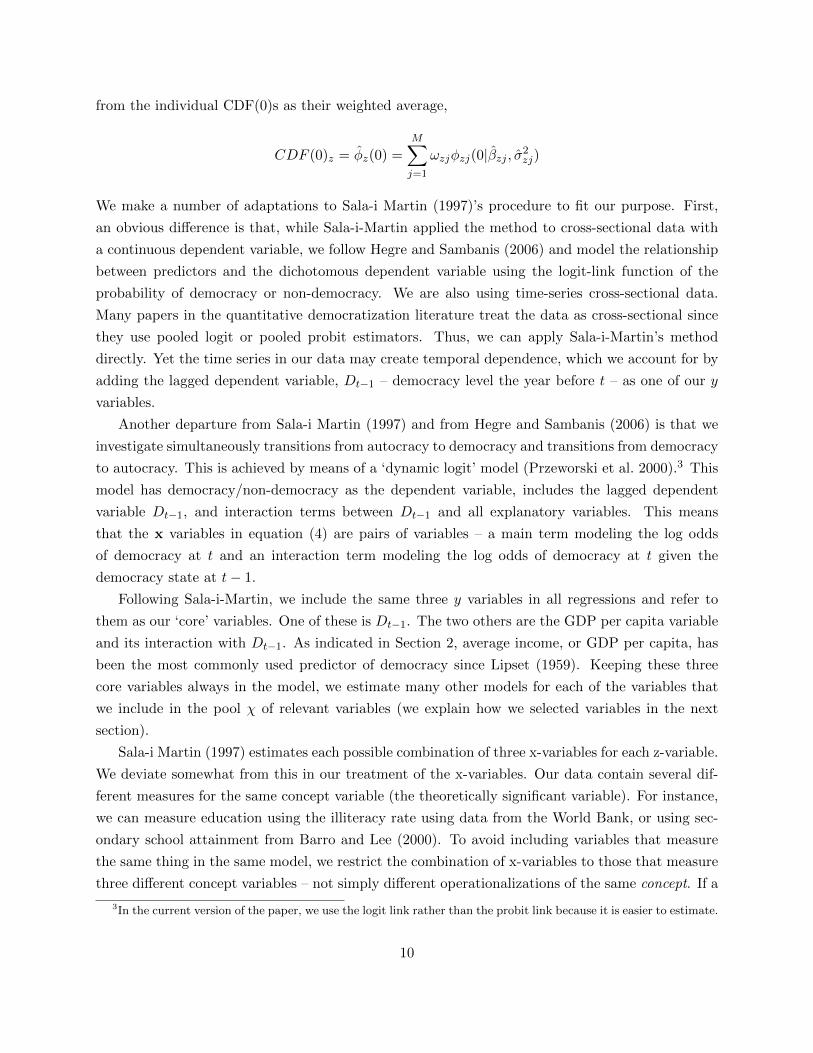
Figure 1: Polity Score Histogram
3 Classifying regimes
As noted above, important contributions to the literature have provided strong indications that
the factors affecting democratization may not be the same as those affecting democratic stability
(e.g. Przeworski and Limongi 1997; Houle 2009); a dichotomous measure conveniently allows us
to take this into account through simultaneously investigate the robustness of the determinants of
democratization and democratic stability by using dynamic probit or logit models. More specif-
ically, to perform the analysis we utilize a dichotomous measure of democracy constructed from
the PolityIV index. As illustrated by Figure 1, showing that the majority of polities are clearly
concentrated at the ends of the Polity scale. The bimodal nature of the distribution combined
with clear endpoints (-10/10) violates basic assumptions for OLS regression, and provides another
justification for dichotomizing the Polity variable and subsequently using probit or logit models. In
accordance with other scholars (e.g. Milner and Kubota 2005; Li 2005; Hadenius and Teorell 2007),
we set the bar for being classified as a democracy at a relatively high level, requiring a Polity score
of 6 or higher to be considered a democracy. Although the cutoff point is arbitrary and therefore
may be critique-worthy (Cheibub, Gandhi and Vreeland 2010; Bogaards 2011), the dichotomiza-
tion has two notable advantages in addition to those mentioned above. First off, it classifies the
more ambiguous and often controversial cases in the middle of the scale as autocracies. Secondly,
by dichotomizing the Polity scale as opposed to utilizing the classification provided by Przeworski
et al. (2000), we can stick to a measure of regimes that incorporates other vital aspects in addition
to whether elite selection is contested, such as participation aspects (see, e.g. Munck and Verkuilen
2002).
7
4 Methodology of sensitivity analysis
2 Leamer (1985) referred to the largest possible set of inferences that can be drawn from a given
data set as ‘extreme bounds.’ The size of these ‘extreme bounds’ depends on the number of models
that can be estimated (i.e., variations in model specifications) within the limits of the data set.
These variations must be theoretically consistent and aim to show how minor changes in the list
of variables alter the conclusions of estimation. In Bayesian terms, the extreme bounds approach
(EBA) suggests that the analyst explores the range of posterior distributions that result from
specification changes to the prior distribution of a variable. To credibly identify the range of
inferences that may be drawn from a model, a ‘global sensitivity analysis’ should be applied, ‘large
numbers of variables should be included, as should different functional forms, different distributions,
different serial correlation assumptions, different measurement error processes, etcetera, etcetera’
(Leamer 1985, 311). Given the severe computational burden of such an approach, a reasonable
compromise is to focus on selected dimensions of the model and regression coefficients in particular.
Levine and Renelt (1992) used a variant of Leamer (1985)’s EBA to check the sensitivity of
cross-country regression estimates on the determinants of economic growth. They were motivated
by what they perceived as frequently contradicting empirical linkages between long-run growth
rates and a wide array of explanatory variables. The EBA used by Levine and Renelt specifies
equations of the following form:
Y = βιI + βµM + βζZ + u
where Y is the dependent variable, I is a set of variables always included in the regression, M is the
‘focus’ variable (i.e., the one whose behavior we are interested in observing as we change the model
specification), and Z is a subset of control variables selected among several potentially significant
explanatory variables. They first estimate a model that includes only the I-variables and the focus
variable and then estimate regressions for ‘all possible combinations of up to three Z-variables
and identify the highest and lowest values for the coefficient on the variable of interest, βµ, that
cannot be rejected at the 0.05 significance level’ (Levine and Renelt 1992, 944). The design tries to
reduce multicollinearity problems by restricting the total number of explanatory variables to ‘eight
or fewer,’ choosing a ‘small pool of variables from which the extreme bounds procedure selected
Z-variables,’ and ‘excluding variables that, a priori, might measure the same phenomenon’ (Levine
and Renelt 1992, 944–5). This specification design minimizes the risk of underspecified models
while also minimizing the computer power needed to estimate the models, as well as problems
associated with multicollinearity. The extreme bounds on the coefficient βµ denote the confidence
that we can have in the partial correlation between Y and M. The upper extreme bound is defined
as the maximum value of βµ plus two standard deviations, and the lower extreme bound is βµ
2This section draws heavily on text in Hegre and Sambanis (2006).
8
minus two standard deviations of the estimate. Coefficient βµ is considered robust if it ‘remains
significant and of the same sign at the extreme bounds’ (Levine and Renelt 1992, 944).
Levine and Renelt (1992, 959)’s analysis leads them to conclude that ‘very few economic vari-
ables are robustly correlated with cross-country growth rates.’ But this extreme result may suggest
that their analysis sets too high a hurdle for robustness. According to Sala-i Martin (1997, 179), ‘If
the distribution of the estimators of βµ has some positive and some negative support, then one is
bound to find one regression for which the estimated coefficient changes signs if enough regressions
are run. Thus, giving the label of nonrobust to all variables is all but guaranteed.’ This argument
is reasonable, so to assess the robustness of empirical results in the literature on democratization,
we apply Sala-i-Martin’s less stringent test, which involves looking at the entire distribution of
parameter estimates to determine the level of confidence in each of the explanatory variables.
Sala-i Martin (1997) estimates M models of the following form:
γj = αj + βyjy + βzjzj + βxjxj + ε
where γ is the dependent variable and the subscript j refers to the model or specification, y is a
vector of three variables that always appear in the regressions, z is the variable of interest, and x
is a vector of up to three variables taken from a pool χ of available variables. He then uses these
estimates of the βzj to compute the cumulative distribution function – CDF(0) – the proportion
of estimates that are larger or smaller than zero, selecting the largest of the two. The distribution
function is computed under two different assumptions: the first aggregation assumes that their
distribution across models is normal. The average estimate is computed as
βz =
M∑j=1
ωzjβzj
where the weights ωzj are proportional to the integrated likelihoods ωzj =Lzj∑Mi=1 Lzi
(Sala-i Martin
1997, 179). The weights ensure that models with better fit contribute more to the estimate, and
the fact that the same number of variables is always included in the regression implies that we do
not get ‘artificially’ better fit by increasing the number of variables. Similarly, Sala-i Martin (1997)
computes the average variance of the estimates as
σ2z =
M∑j=1
ωzjσ2zj
If the assumption that the βzj are normally distributed holds, the probabilities that β < 0 and
β > 0 can be computed from βzj and σ2z as functions of the average t-ratioβzjσ2z
as in standard
statistical inference. We will refer to the smallest of these two probabilities as the ‘average p-value.’
If the assumption of normality does not hold, then Sala-i-Martin computes the aggregate CDF(0)
9
from the individual CDF(0)s as their weighted average,
CDF (0)z = φz(0) =M∑j=1
ωzjφzj(0|βzj , σ2zj)
We make a number of adaptations to Sala-i Martin (1997)’s procedure to fit our purpose. First,
an obvious difference is that, while Sala-i-Martin applied the method to cross-sectional data with
a continuous dependent variable, we follow Hegre and Sambanis (2006) and model the relationship
between predictors and the dichotomous dependent variable using the logit-link function of the
probability of democracy or non-democracy. We are also using time-series cross-sectional data.
Many papers in the quantitative democratization literature treat the data as cross-sectional since
they use pooled logit or pooled probit estimators. Thus, we can apply Sala-i-Martin’s method
directly. Yet the time series in our data may create temporal dependence, which we account for by
adding the lagged dependent variable, Dt−1 – democracy level the year before t – as one of our y
variables.
Another departure from Sala-i Martin (1997) and from Hegre and Sambanis (2006) is that we
investigate simultaneously transitions from autocracy to democracy and transitions from democracy
to autocracy. This is achieved by means of a ‘dynamic logit’ model (Przeworski et al. 2000).3 This
model has democracy/non-democracy as the dependent variable, includes the lagged dependent
variable Dt−1, and interaction terms between Dt−1 and all explanatory variables. This means
that the x variables in equation (4) are pairs of variables – a main term modeling the log odds
of democracy at t and an interaction term modeling the log odds of democracy at t given the
democracy state at t− 1.
Following Sala-i-Martin, we include the same three y variables in all regressions and refer to
them as our ‘core’ variables. One of these is Dt−1. The two others are the GDP per capita variable
and its interaction with Dt−1. As indicated in Section 2, average income, or GDP per capita, has
been the most commonly used predictor of democracy since Lipset (1959). Keeping these three
core variables always in the model, we estimate many other models for each of the variables that
we include in the pool χ of relevant variables (we explain how we selected variables in the next
section).
Sala-i Martin (1997) estimates each possible combination of three x-variables for each z-variable.
We deviate somewhat from this in our treatment of the x-variables. Our data contain several dif-
ferent measures for the same concept variable (the theoretically significant variable). For instance,
we can measure education using the illiteracy rate using data from the World Bank, or using sec-
ondary school attainment from Barro and Lee (2000). To avoid including variables that measure
the same thing in the same model, we restrict the combination of x-variables to those that measure
three different concept variables – not simply different operationalizations of the same concept. If a
3In the current version of the paper, we use the logit link rather than the probit link because it is easier to estimate.
10
control is an alternative operationalization of the same concept as the focus variable, this is likely
to diminish the effect of the focus variable. This might not be an insurmountable problem if all
concepts had the same number of alternative operationalizations since any bias would be roughly
equal for each focus variable. However, the number of alternative operationalizations for each con-
cept varies (see next section). Allowing more than one operationalization for each concept then
would tend to hurt variables belonging to concepts with many operationalizations.4
Another difference from Sala-i Martin (1997) procedure is that we have to allow for the fact
that several variables in our data set have missing data, and the number of missing observations
is different for different variables. In Sala-i-Martin’s model, parameter estimates are weighted
by the model’s log-likelihood to ensure that models with better fit to the data are given greater
weight. The log-likelihood, however, is dependent on the number of observations that are included
in the estimation. Hence, we calculate weights based on the likelihood ratio index (LRI), which is
analogous to the R2. It is given as
1− LLmLL0
, where LL0 is the log-likelihood with only the constant term, and LLm is the log-likelihood of
the model having just been estimated. This statistic has the advantage that it is less dependent
on sample size, and this is important for us as some of our variables are missing observations and
sample size varies across models.
The fact that we perform extensive specification tests implies that we do not know the true
model.5 We only know that three variables should be in the model: Dt−1, GDP per capita, and
the interaction between GDP per capita and Dt−1 . While most scholars would agree that such
a model is underspecified, they would disagree over which other variables to add.6 This is clearly
illustrated by the fact that very few existing studies on determinants of democracy utilize similar
sets of independent variables. The method that we apply here could help provide some information
on what is a better specified regression equation for democratization by testing the fit of several
theoretically relevant variables. But it certainly does not replace the need for theorizing about
democratization and democratic stability, and the main usefulness of our approach is to give us a
4These could be concept variables of great interest in the literature, such as ethnic heterogeneity, which explainswhy we have many different ways of measuring them. For example, ethnic heterogeneity is measured by Vanhanen(1999)’s racial, linguistic, and religious heterogeneity index, or ehet; Fearon (2003)’s ef index; and the widely usedethnolinguistic fractionalization index, elfo.
5In the presence of theoretical ambiguity, others have proposed a very different approach, which prefers parsimonyto empirical exploration. Achen (2002), for example, proposes using no more than three independent variables inregression analyses in the absence of a formal model that justifies the inclusion of more controls. We do not sharethis view and agree more with much of the literature in development and labor economics, which is now movingaway from an emphasis on formal models as a motivation for empirical analysis. While we certainly see the value ofmathematical models in political science, we do not think they represent the only way to theorize about politics orto identify hypotheses for empirical testing. For a related, useful methodological and applied discussion of this point,see Oneal and Russett (2005).
6Scholars often add controls to avoid the risk of omitted variable bias, even though their theory does not call foradditional variables. For a useful methodological perspective on this issue, see Clarke (2005).
11
sense of the distribution of empirical estimates for all potentially relevant variables.
A concern with our approach is that some of the variables included may be endogenous. We
cannot deal with this problem while trying to explore empirically the robustness of different model
specifications here, and we assume exogeneity for all variables. To deal with endogeneity, we would
have to switch estimators for those models where we suspected endogeneity as a result of the
variable combinations in the model. We could not simply use instrumental variables estimation for
all models since, if exogeneity cannot be rejected, this would reduce the efficiency of the estimates.
And we could not hope to identify valid instrumental variables for all model specifications. Since
quite few of the papers in the literature on democratization deal with endogeneity, we also ignore
it and simply try to reduce the risk by lagging independent variables.7
Finally, there is some concern with how missing data could influence the results of this exercise.
Many of the variables in our data set have missing observations. Some of the variables of interest,
such as most income inequality measures, have very limited coverage. Faced with such problems,
we have three alternatives. One, we could have added all variables independent of their number
of missing observations to the pool of variables used in the analysis. One serious problem with
this approach is that we aim to isolate the degree to which individual parameter estimates are
sensitive to changes in the model specification. Varying the model specification, however, leads
to changes in the sample when variables are missing data for different observations. Two, we
could have left out variables with many missing observations, but this has the obvious drawback
of excluding substantially interesting explanatory variables. Furthermore, these variables may also
be systematically correlated with particular sets of other variables, and leaving some variables out
may thus affect the results for the variables included. We opted for the third alternative, namely
to utilize multiple imputation in order to generate predictions for missing values. In addition to
expanding the number of variables that may be included in the analysis, this procedure mitigates
selection biases that could otherwise have been generated if characteristics that affect the probability
of missing data are correlated with the dependent variable.
More specifically, we use the multiple imputation techniques for cross sectional – time series
data incorporated in the AMELIA II software (see Honaker and King 2010; Honaker, King and
Blackwell 2011). Indeed, Honaker and King (2010) convincingly argue that listwise deletion of cases
is preferable to using the imputation procedure only under a very stringent set of assumptions.
Therefore, generating imputed data sets to mitigate various biases is an important operation. The
imputation procedure generates predicted values for all missing values on the variables included
7Endogeneity may result in artificially good fit between models; hence, weighting by log-likelihood or the LRIcould result in weighting the wrong models more. This problem is limited in magnitude, however. Ninety percentof the LRIs fall between .XXX and .XX, and the largest weight given is .XX. In addition, some combinations ofvariables may present more problems than others. For example, the inclusion of both economic growth and trademay violate the exogeneity assumption since both trade and growth are affected by conflict or the expectation ofconflict. Variables that measure the degree of militarization (e.g., military expenditures; size of the government army)may also be endogenous to the expectation of political violence or, certainly, to ongoing war.
12
in the imputation model, and are based on algorithms that take into account the cross sectional
– time series structure of the data. We added all the 85 variables used in the analysis below to
the imputation model. Following the advice of Honaker and King (2010), we also incorporated 41
additional variables to increase the predictive power of the imputation model. We set the minimum
and maximum values as bounds for indexes with a specified range and for other restricted variables
such as fractions. Furthermore, to increase the precision of the predictions, we set the empirically
observed minimum and maximum as bounds for all other variables. The imputation models are
computed using a second-order polynomial of time, and the time trends are interacted with the
cross section units in order to allow for country-specific trends (see Honaker, King and Blackwell
2011).
5 Data
In order to investigate the determinants of democracy, and how robust these are, we draw on
data used in a set of important empirical contributions to the literature. As indicated by the
literature review various indicators related to structural economic factors, economic performance,
distributional and class-structure indicators, cultural indicators, political-historical indicators, and
spatio-temporal transmission indicators are among those that often appear in the literature. As
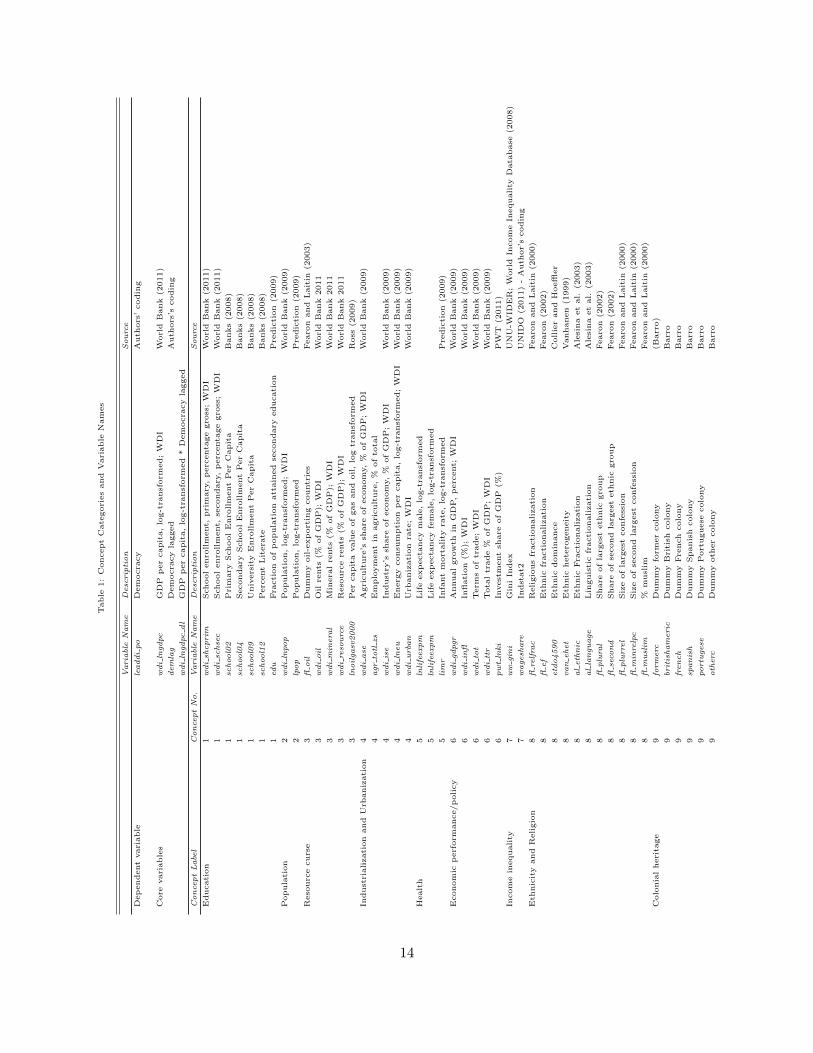
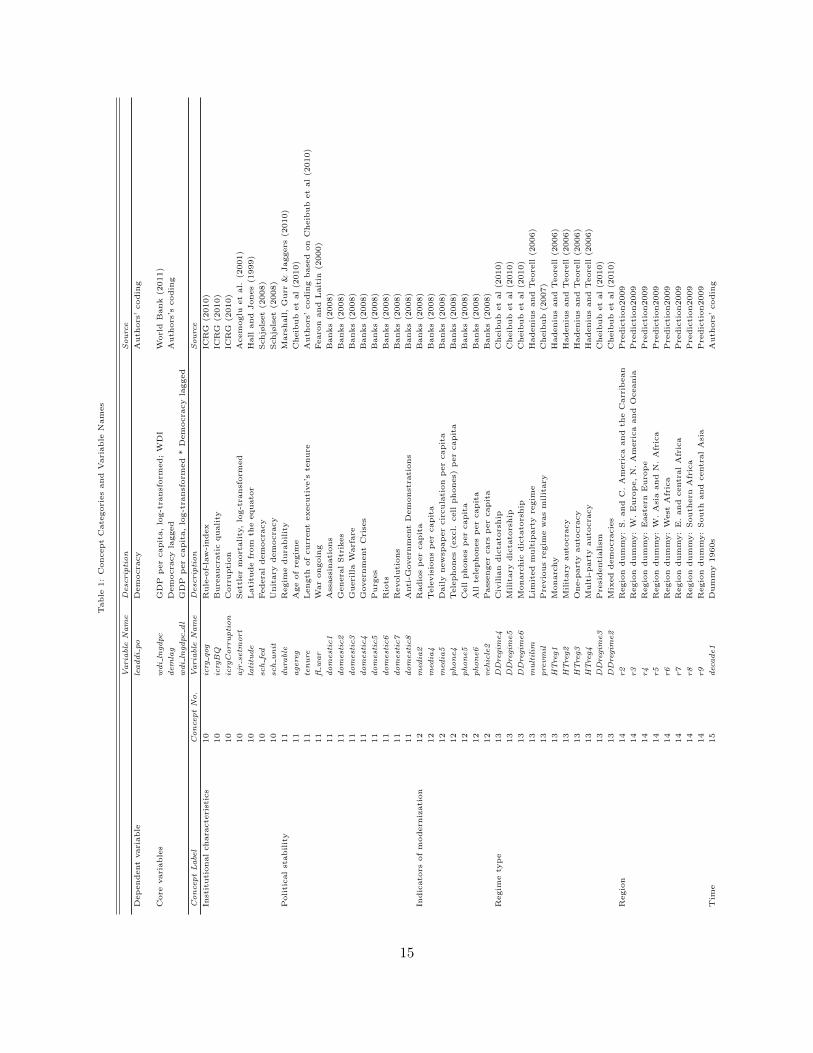
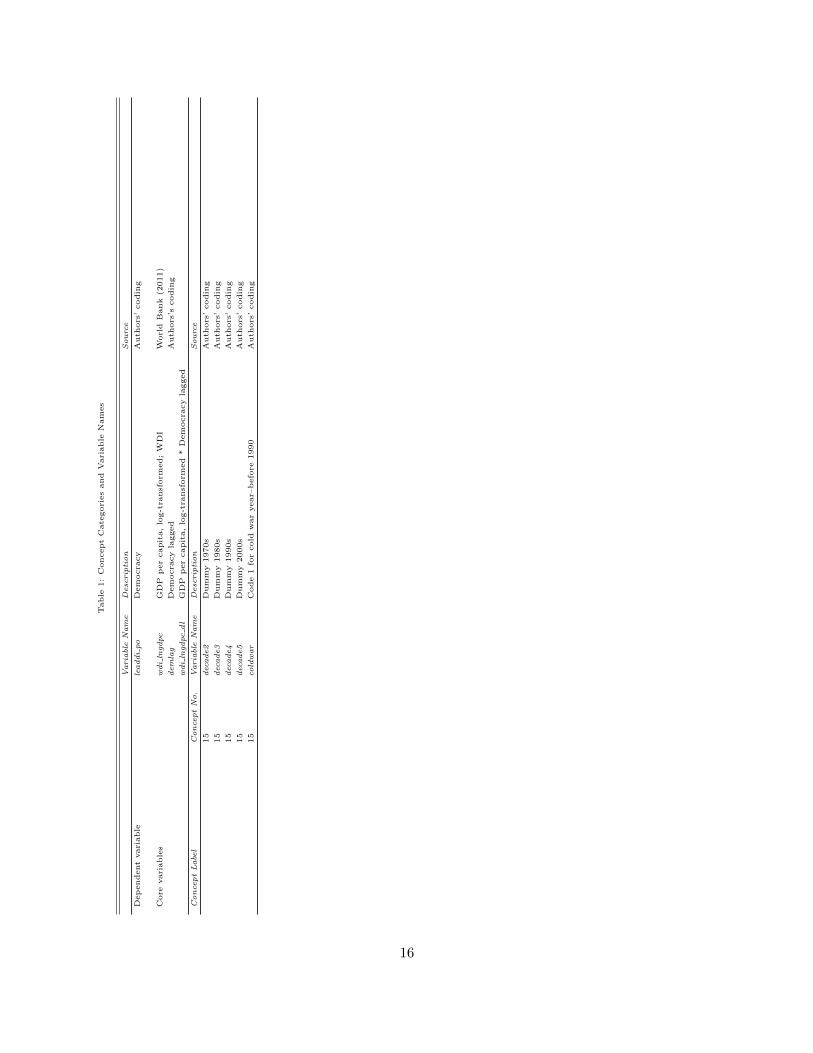
noted in Section 2, we further subdivide the indicators into 15 concept categories. All indicators are
listed in Table 1, sorted according to the concept they belong to, and data sources for the various
indicators are also listed.
6 Results of sensitivity analysis
As noted above, empirical studies have indicated that there may be large differences in the effect
of a variable on democratization on the one hand and democratic consolidation on the other. This
applies, for instance, to income level (Przeworski and Limongi 1997), and to income inequality
(Houle 2009). Hence, we will present results simultaneously for the main term for each variable
and its interaction with lagged democracy.
We analyse the sensitivity to changes in control variable specifications for the 85 variables
included in Table 1, organized by concept category. We cover most countries over the 1960–2008
period. We standardized all variables to make estimates easily comparable, and log-transformed
many variables to minimize the effect of extreme values. The combinations of 85 variables, following
the method presented in Section 4, total about 3.6 million logistic regressions.
13
Table
1:
Concept
Cate
gori
es
and
Vari
able
Nam
es
Varia
ble
Nam
eD
esc
rip
tion
Sou
rce
Dep
endent
vari
able
leaddi
po
Dem
ocra
cy
Auth
ors
’codin
g
Core
vari
able
sw
di
lngdpc
GD
Pp
er
capit
a,
log-t
ransf
orm
ed;
WD
IW
orl
dB
ank
(2011)
dem
lag
Dem
ocra
cy
lagged
Auth
ors
’scodin
g
wdi
lngdpc
dl
GD
Pp
er
capit
a,
log-t
ransf
orm
ed
*D
em
ocra
cy
lagged
Con
cept
Labe
lC
on
cept
No.
Varia
ble
Nam
eD
esc
rip
tion
Sou
rce
Educati
on
1w
di
shcprim
School
enro
llm
ent,
pri
mary
,p
erc
enta
ge
gro
ss;
WD
IW
orl
dB
ank
(2011)
1w
di
schse
cSchool
enro
llm
ent,
secondary
,p
erc
enta
ge
gro
ss;
WD
IW
orl
dB
ank
(2011)
1sc
hool0
2P
rim
ary
School
Enro
llm
ent
Per
Capit
aB
anks
(2008)
1sc
hool0
4Secondary
School
Enro
llm
ent
Per
Capit
aB
anks
(2008)
1sc
hool0
9U
niv
ers
ity
Enro
llm
ent
Per
Capit
aB
anks
(2008)
1sc
hool1
2P
erc
ent
Lit
era
teB
anks
(2008)
1ed
uFra
cti
on
of
popula
tion
att
ain
ed
secondary
educati
on
Pre
dic
tion
(2009)
Popula
tion
2w
di
lnpop
Popula
tion,
log-t
ransf
orm
ed;
WD
IW
orl
dB
ank
(2009)
2lp
op
Popula
tion,
log-t
ransf
orm
ed
Pre
dic
tion
(2009)
Reso
urc
ecurs
e3
floil
Dum
my
oil-e
xp
ort
ing
countr
ies
Fearo
nand
Lait
in(2
003)
3w
di
oil
Oil
rents
(%of
GD
P);
WD
IW
orl
dB
ank
2011
3w
di
min
era
lM
inera
lre
nts
(%of
GD
P);
WD
IW
orl
dB
ank
2011
3w
di
reso
urc
eR
eso
urc
ere
nts
(%of
GD
P);
WD
IW
orl
dB
ank
2011
3ln
oil
gasv
2000
Per
capit
avalu
eof
gas
and
oil,
log
transf
orm
ed
Ross
(2009)
Indust
rializati
on
and
Urb
aniz
ati
on
4w
di
ase
Agri
cult
ure
’ssh
are
of
econom
y,
%of
GD
P;
WD
IW
orl
dB
ank
(2009)
4agr
totl
zsE
mplo
ym
ent
inagri
cult
ure
,%
of
tota
l
4w
di
ise
Indust
ry’s
share
of
econom
y,
%of
GD
P;
WD
IW
orl
dB
ank
(2009)
4w
di
lneu
Energ
yconsu
mpti
on
per
capit
a,
log-t
ransf
orm
ed;
WD
IW
orl
dB
ank
(2009)
4w
di
urba
nU
rbaniz
ati
on
rate
;W
DI
Worl
dB
ank
(2009)
Healt
h5
lnli
feexpm
Lif
eexp
ecta
ncy
male
,lo
g-t
ransf
orm
ed
5ln
life
expm
Lif
eexp
ecta
ncy
fem
ale
,lo
g-t
ransf
orm
ed
5li
mr
Infa
nt
mort
ality
rate
,lo
g-t
ransf
orm
ed
Pre
dic
tion
(2009)
Econom
icp
erf
orm
ance/p
oli
cy
6w
di
gdpgr
Annual
gro
wth
inG
DP
,p
erc
ent;
WD
IW
orl
dB
ank
(2009)
6w
di
infl
Infl
ati
on
(%);
WD
IW
orl
dB
ank
(2009)
6w
di
tot
Term
sof
trade;
WD
IW
orl
dB
ank
(2009)
6w
di
ttr
Tota
ltr
ade
%of
GD
P;
WD
IW
orl
dB
ank
(2009)
6pw
tln
ki
Invest
ment
share
of
GD
P(%
)P
WT
(2011)
Incom
ein
equality
7u
wgin
iG
ini
Index
UN
U-W
IDE
R;
Worl
dIn
com
eIn
equality
Data
base
(2008)
7w
agesh
are
Indst
at2
UN
IDO
(2011)
-A
uth
or’
scodin
g
Eth
nic
ity
and
Religio
n8
flre
lfra
cR
eligio
us
fracti
onalizati
on
Fearo
nand
Lait
in(2
000)
8fl
ef
Eth
nic
fracti
onalizati
on
Fearo
n(2
002)
8etd
o4590
Eth
nic
dom
inance
Collie
rand
Hoeffl
er
8van
ehet
Eth
nic
hete
rogeneit
yV
anhanen
(1999)
8al
eth
nic
Eth
nic
Fra
cti
onali
zati
on
Ale
sina
et
al.
(2003)
8al
lan
gu
age
Lin
guis
tic
fracti
onalizati
on
Ale
sina
et
al.
(2003)
8fl
plu
ral
Share
of
larg
est
eth
nic
gro
up
Fearo
n(2
002)
8fl
seco
nd
Share
of
second
larg
est
eth
nic
gro
up
Fearo
n(2
002)
8fl
plu
rre
lSiz
eof
larg
est
confe
ssio
nFearo
nand
Lait
in(2
000)
8fl
min
relp
cSiz
eof
second
larg
est
confe
ssio
nFearo
nand
Lait
in(2
000)
8fl
mu
slim
%m
usl
imFearo
nand
Lait
in(2
000)
Colo
nia
lheri
tage
9fo
rm
erc
Dum
my
form
er
colo
ny
(Barr
o)
9brit
isham
eric
Dum
my
Bri
tish
colo
ny
Barr
o
9fr
en
ch
Dum
my
Fre
nch
colo
ny
Barr
o
9sp
an
ish
Dum
my
Spanis
hcolo
ny
Barr
o
9portu
gese
Dum
my
Port
uguese
colo
ny
Barr
o
9oth
erc
Dum
my
oth
er
colo
ny
Barr
o
14
Table
1:
Concept
Cate
gori
es
and
Vari
able
Nam
es
Varia
ble
Nam
eD
esc
rip
tion
Sou
rce
Dep
endent
vari
able
leaddi
po
Dem
ocra
cy
Auth
ors
’codin
g
Core
vari
able
sw
di
lngdpc
GD
Pp
er
capit
a,
log-t
ransf
orm
ed;
WD
IW
orl
dB
ank
(2011)
dem
lag
Dem
ocra
cy
lagged
Auth
ors
’scodin
g
wdi
lngdpc
dl
GD
Pp
er
capit
a,
log-t
ransf
orm
ed
*D
em
ocra
cy
lagged
Con
cept
Labe
lC
on
cept
No.
Varia
ble
Nam
eD
esc
rip
tion
Sou
rce
Inst
ituti
onal
chara
cte
rist
ics
10
icrg
qog
Rule
-of-
law
-index
ICR
G(2
010)
10
icrg
BQ
Bure
aucra
tic
quality
ICR
G(2
010)
10
icrg
Corru
pti
on
Corr
upti
on
ICR
G(2
010)
10
ajr
setm
ort
Sett
ler
mort
ality
,lo
g-t
ransf
orm
ed
Acem
oglu
et
al.
(2001)
10
lati
tude
Lati
tude
from
the
equato
rH
all
and
Jones
(1999)
10
sch
fed
Federa
ldem
ocra
cy
Schjø
lset
(2008)
10
sch
un
itU
nit
ary
dem
ocra
cy
Schjø
lset
(2008)
Politi
cal
stabilit
y11
du
rable
Regim
edura
bilit
yM
ars
hall,
Gurr
&Jaggers
(2010)
11
agere
gA
ge
of
regim
eC
heib
ub
et
al
(2010)
11
ten
ure
Length
of
curr
ent
executi
ve’s
tenure
Auth
ors
’codin
gbase
don
Cheib
ub
et
al
(2010)
11
flw
ar
War
ongoin
gFearo
nand
Lait
in(2
000)
11
dom
est
ic1
Ass
ass
inati
ons
Banks
(2008)
11
dom
est
ic2
Genera
lStr
ikes
Banks
(2008)
11
dom
est
ic3
Gueri
lla
Warf
are
Banks
(2008)
11
dom
est
ic4
Govern
ment
Cri
ses
Banks
(2008)
11
dom
est
ic5
Purg
es
Banks
(2008)
11
dom
est
ic6
Rio
tsB
anks
(2008)
11
dom
est
ic7
Revolu
tions
Banks
(2008)
11
dom
est
ic8
Anti
-Govern
ment
Dem
onst
rati
ons
Banks
(2008)
Indic
ato
rsof
modern
izati
on
12
med
ia2
Radio
sp
er
capit
aB
anks
(2008)
12
med
ia4
Tele
vis
ions
per
capit
aB
anks
(2008)
12
med
ia5
Daily
new
spap
er
cir
cula
tion
per
capit
aB
anks
(2008)
12
phon
e4
Tele
phones
(excl.
cell
phones)
per
capit
aB
anks
(2008)
12
phon
e5
Cell
phones
per
capit
aB
anks
(2008)
12
phon
e6
All
tele
phones
per
capit
aB
anks
(2008)
12
vehic
le2
Pass
enger
cars
per
capit
aB
anks
(2008)
Regim
ety
pe
13
DD
regim
e4
Civ
ilia
ndic
tato
rship
Cheib
ub
et
al
(2010)
13
DD
regim
e5
Milit
ary
dic
tato
rship
Cheib
ub
et
al
(2010)
13
DD
regim
e6
Monarc
hic
dic
tato
rship
Cheib
ub
et
al
(2010)
13
mu
ltil
imL
imit
ed
mult
ipart
yre
gim
eH
adeniu
sand
Teore
ll(2
006)
13
pre
vm
ilP
revio
us
regim
ew
as
mil
itary
Cheib
ub
(2007)
13
HT
reg1
Monarc
hy
Hadeniu
sand
Teore
ll(2
006)
13
HT
reg2
Milit
ary
auto
cra
cy
Hadeniu
sand
Teore
ll(2
006)
13
HT
reg3
One-p
art
yauto
cra
cy
Hadeniu
sand
Teore
ll(2
006)
13
HT
reg4
Mult
i-part
yauto
cra
cy
Hadeniu
sand
Teore
ll(2
006)
13
DD
regim
e3
Pre
sidenti
alism
Cheib
ub
et
al
(2010)
13
DD
regim
e2
Mix
ed
dem
ocra
cie
sC
heib
ub
et
al
(2010)
Regio
n14
r2
Regio
ndum
my:
S.
and
C.
Am
eri
ca
and
the
Carr
ibean
Pre
dic
tion2009
14
r3
Regio
ndum
my:
W.
Euro
pe,
N.
Am
eri
ca
and
Oceania
Pre
dic
tion2009
14
r4
Regio
ndum
my:
East
ern
Euro
pe
Pre
dic
tion2009
14
r5
Regio
ndum
my:
W.
Asi
aand
N.
Afr
ica
Pre
dic
tion2009
14
r6
Regio
ndum
my:
West
Afr
ica
Pre
dic
tion2009
14
r7
Regio
ndum
my:
E.
and
centr
al
Afr
ica
Pre
dic
tion2009
14
r8
Regio
ndum
my:
South
ern
Afr
ica
Pre
dic
tion2009
14
r9
Regio
ndum
my:
South
and
centr
al
Asi
aP
redic
tion2009
Tim
e15
dec
ade1
Dum
my
1960s
Auth
ors
’codin
g
15
Table
1:
Concept
Cate
gori
es
and
Vari
able
Nam
es
Varia
ble
Nam
eD
esc
rip
tion
Sou
rce
Dep
endent
vari
able
leaddi
po
Dem
ocra
cy
Auth
ors
’codin
g
Core
vari
able
sw
di
lngdpc
GD
Pp
er
capit
a,
log-t
ransf
orm
ed;
WD
IW
orl
dB
ank
(2011)
dem
lag
Dem
ocra
cy
lagged
Auth
ors
’scodin
g
wdi
lngdpc
dl
GD
Pp
er
capit
a,
log-t
ransf
orm
ed
*D
em
ocra
cy
lagged
Con
cept
Labe
lC
on
cept
No.
Varia
ble
Nam
eD
esc
rip
tion
Sou
rce
15
dec
ade2
Dum
my
1970s
Auth
ors
’codin
g
15
dec
ade3
Dum
my
1980s
Auth
ors
’codin
g
15
dec
ade4
Dum
my
1990s
Auth
ors
’codin
g
15
dec
ade5
Dum
my
2000s
Auth
ors
’codin
g
15
cold
war
Code
1fo
rcold
war
year–
befo
re1990
Auth
ors
’codin
g
16
6.1 Core variables
Table 2: Results for core variables
Variable Mean Std. Dev.
GDP per capita: Beta -0.015 0.222GDP per capita: Standard error 0.131 0.026GDP per capita: t-value -0.026 1.662GDP per capita: maximum beta 0.841 0GDP per capita: minimum beta -0.807 0GDP per capita: CDF(0), normal 0.484 0GDP per capita: CDF(0), generalized 0.158 0Lagged democracy: Beta 1.043 1.968Lagged democracy: Standard error 1.873 0.498Lagged democracy: t-value 0.615 1.105Lagged democracy: maximum beta 9.917 0Lagged democracy: minimum beta -5.618 0Lagged democracy: CDF(0), normal 0.222 0Lagged democracy: CDF(0), generalized 0.219 0Interaction: Beta 0.828 0.23Interaction: Standard error 0.232 0.059Interaction: t-value 3.766 1.306Interaction: maximum beta 1.636 0Interaction: minimum beta -0.157 0Interaction: CDF(0), normal 0.043 0Interaction: CDF(0), generalized 0.007 0
N 3574786
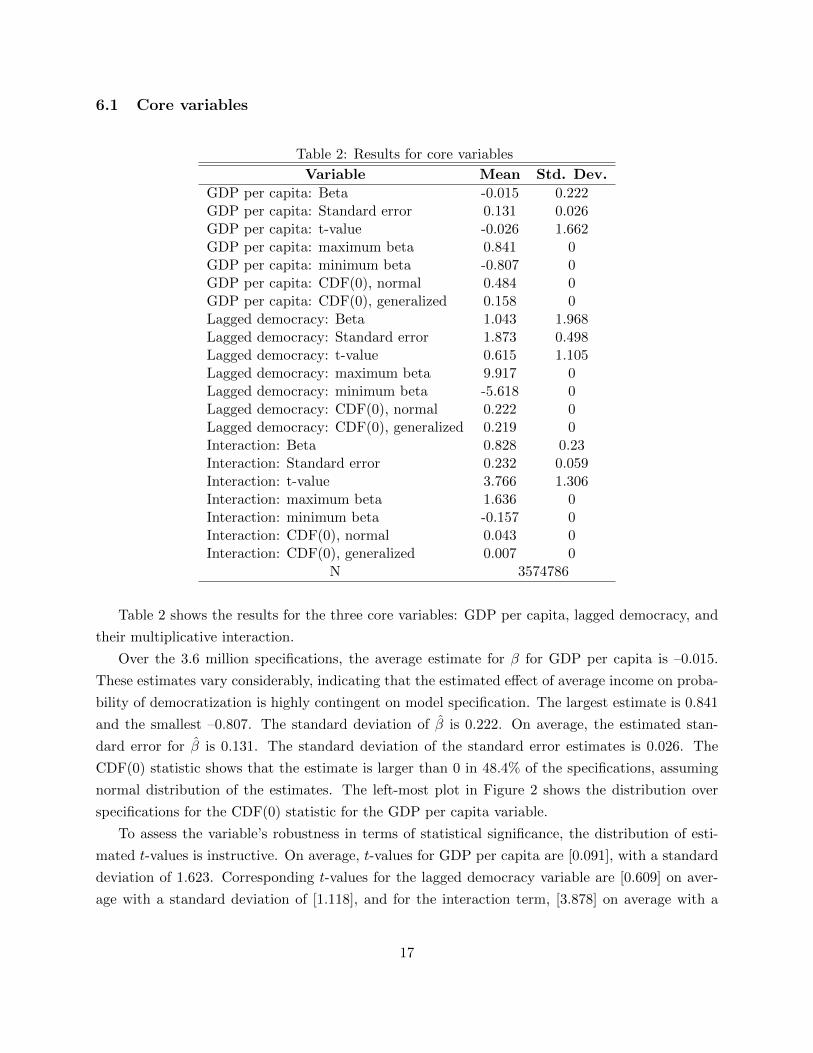
Table 2 shows the results for the three core variables: GDP per capita, lagged democracy, and
their multiplicative interaction.
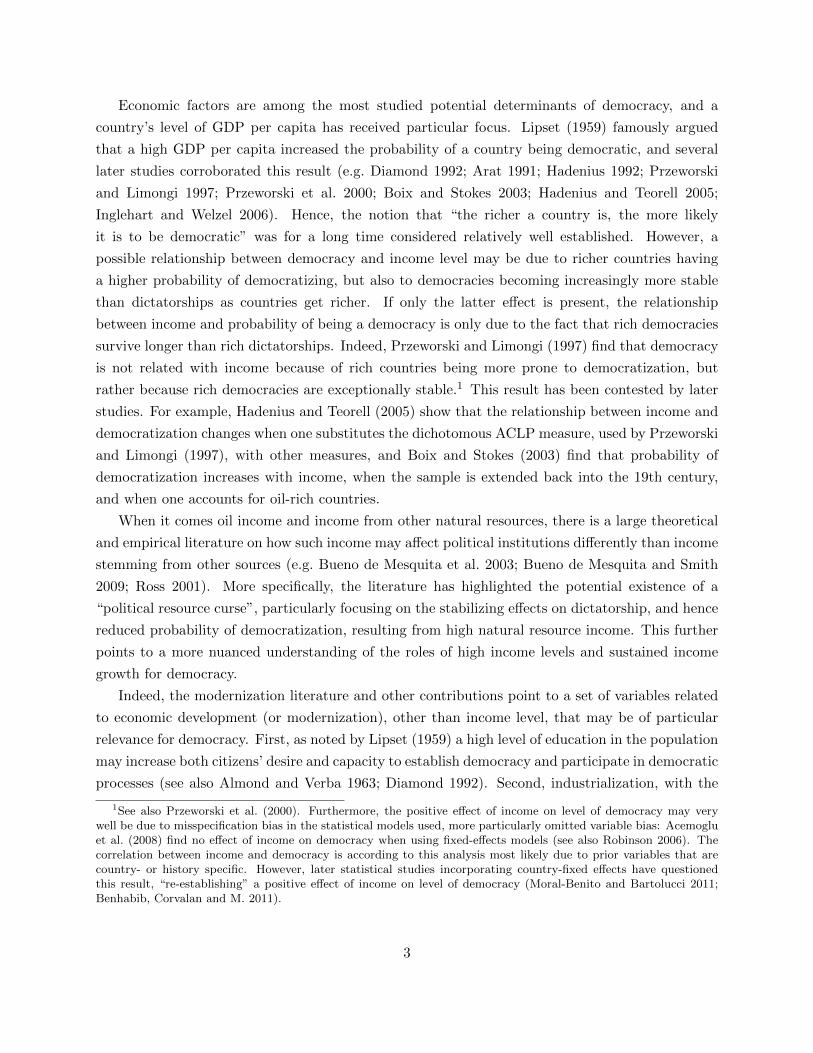
Over the 3.6 million specifications, the average estimate for β for GDP per capita is –0.015.
These estimates vary considerably, indicating that the estimated effect of average income on proba-
bility of democratization is highly contingent on model specification. The largest estimate is 0.841
and the smallest –0.807. The standard deviation of β is 0.222. On average, the estimated stan-
dard error for β is 0.131. The standard deviation of the standard error estimates is 0.026. The
CDF(0) statistic shows that the estimate is larger than 0 in 48.4% of the specifications, assuming
normal distribution of the estimates. The left-most plot in Figure 2 shows the distribution over
specifications for the CDF(0) statistic for the GDP per capita variable.
To assess the variable’s robustness in terms of statistical significance, the distribution of esti-
mated t-values is instructive. On average, t-values for GDP per capita are [0.091], with a standard
deviation of 1.623. Corresponding t-values for the lagged democracy variable are [0.609] on aver-
age with a standard deviation of [1.118], and for the interaction term, [3.878] on average with a
17
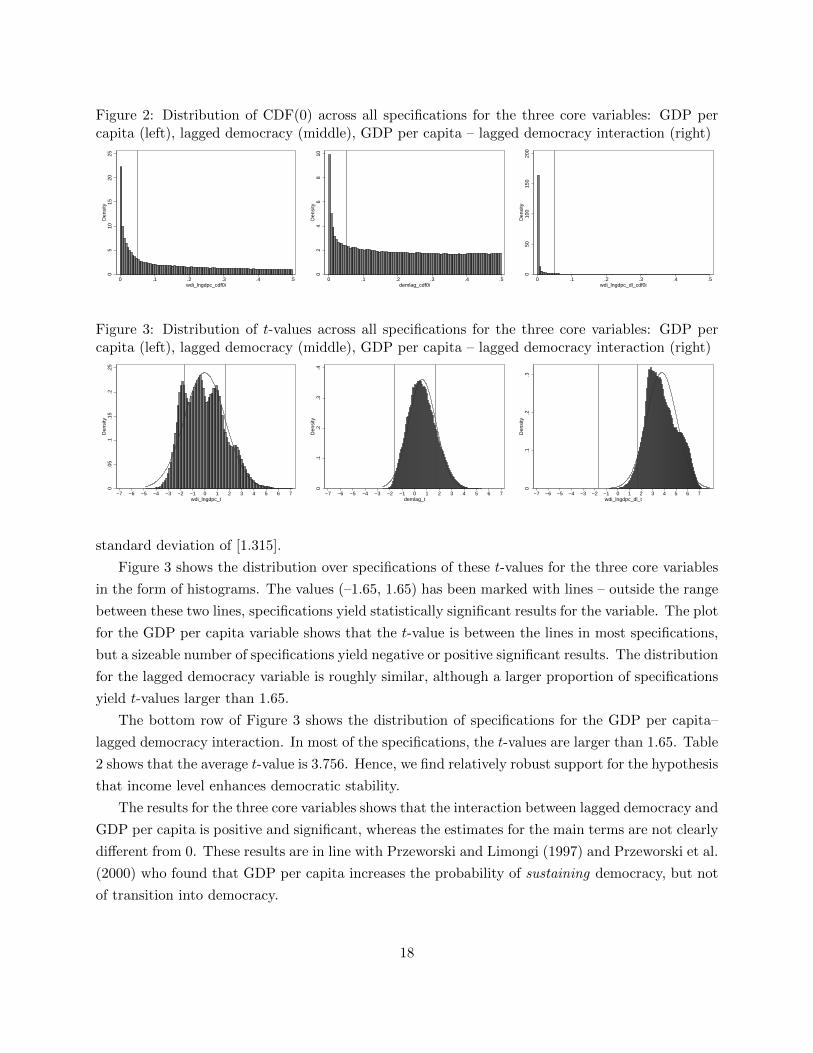
Figure 2: Distribution of CDF(0) across all specifications for the three core variables: GDP percapita (left), lagged democracy (middle), GDP per capita – lagged democracy interaction (right)
05
1015
2025
Den
sity
0 .1 .2 .3 .4 .5wdi_lngdpc_cdf0i
02
46
810
Den
sity
0 .1 .2 .3 .4 .5demlag_cdf0i
050
100
150
200
Den
sity
0 .1 .2 .3 .4 .5wdi_lngdpc_dl_cdf0i
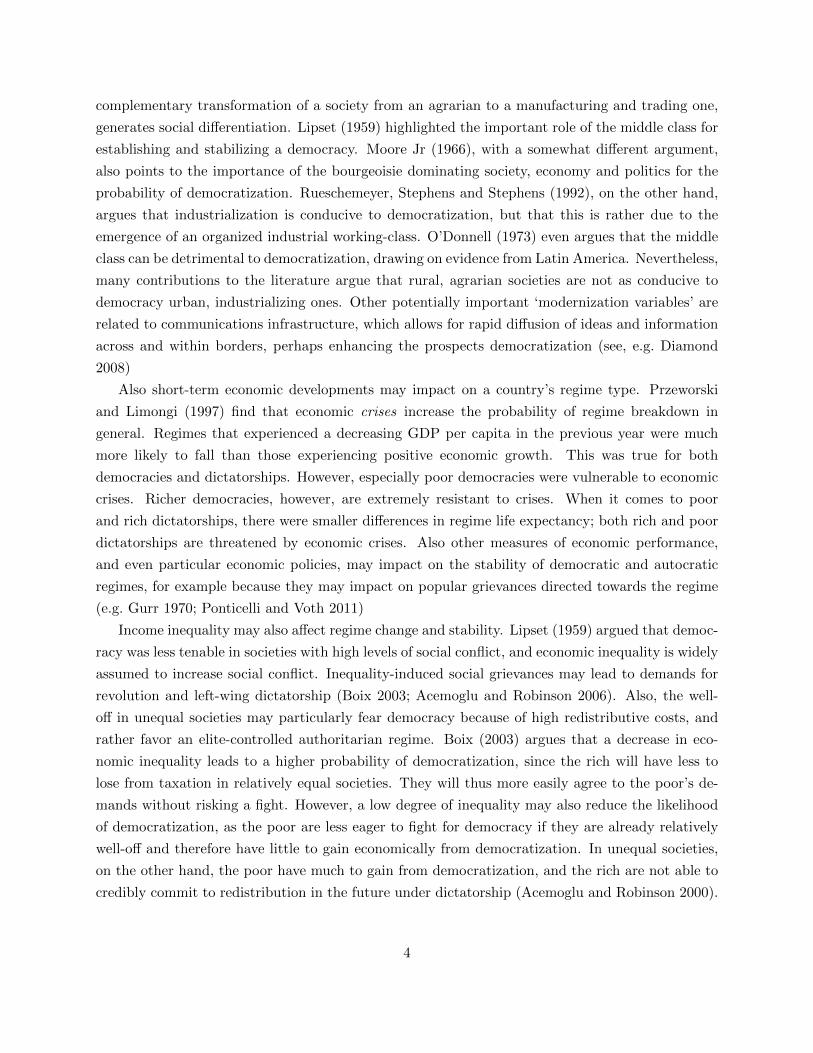
Figure 3: Distribution of t-values across all specifications for the three core variables: GDP percapita (left), lagged democracy (middle), GDP per capita – lagged democracy interaction (right)
0.0
5.1
.15
.2.2
5D
ensi
ty
−7 −6 −5 −4 −3 −2 −1 0 1 2 3 4 5 6 7wdi_lngdpc_t
0.1
.2.3
.4D
ensi
ty
−7 −6 −5 −4 −3 −2 −1 0 1 2 3 4 5 6 7demlag_t
0.1
.2.3
Den
sity
−7 −6 −5 −4 −3 −2 −1 0 1 2 3 4 5 6 7wdi_lngdpc_dl_t
standard deviation of [1.315].
Figure 3 shows the distribution over specifications of these t-values for the three core variables
in the form of histograms. The values (–1.65, 1.65) has been marked with lines – outside the range
between these two lines, specifications yield statistically significant results for the variable. The plot
for the GDP per capita variable shows that the t-value is between the lines in most specifications,
but a sizeable number of specifications yield negative or positive significant results. The distribution
for the lagged democracy variable is roughly similar, although a larger proportion of specifications
yield t-values larger than 1.65.
The bottom row of Figure 3 shows the distribution of specifications for the GDP per capita–
lagged democracy interaction. In most of the specifications, the t-values are larger than 1.65. Table
2 shows that the average t-value is 3.756. Hence, we find relatively robust support for the hypothesis
that income level enhances democratic stability.
The results for the three core variables shows that the interaction between lagged democracy and
GDP per capita is positive and significant, whereas the estimates for the main terms are not clearly
different from 0. These results are in line with Przeworski and Limongi (1997) and Przeworski et al.
(2000) who found that GDP per capita increases the probability of sustaining democracy, but not
of transition into democracy.
18
6.2 Other variables
Table 3 summarizes the average statistics for the main terms for the 85 variables in the study. Main
term coefficients are interpreted as the change in log odds of democracy at t for observations that
were non-democratic at t− 1, i.e. log odds of democratization.
More than half of the variables included in our analysis are robustly associated with a change
in log odds of democratization. Quite a few of the political and institutional explanatory variables
are for example robust: Most of the ‘regime type’ variables (concept 13) are robust (perhaps
reflecting a certain degree of tautology in this context). In general, regime types that are partly
democratic are more likely to democratize than regime types that are more consistent. This is
seen in the finding that limited multi-party and multi-party autocratic regimes (multilim and
HTreg4) are robustly positive, as are the presidential and mixed system variables (DDregime3
and DDregime2)8. This fits nicely with the results in Hadenius and Teorell (2007), who found that
“the majority of transitions from nondominant-party (that is, more competitive) limited multiparty
regimes result in democracy” (p. 152). Civilian, one-party, and monarchic autocracies (DDregime4,
HTreg3, DDregime6, HTreg1) are robustly negatively associated with democratization, on the other
hand (compared to all other regime types). In contrast, only the unitary democracy (sch unit)
and corruption (icrgCorruption) indicators are robust, both negative, among the ‘institutional
characteristics’ indicators (concept 10).
As expected, our measures of ‘political stability’ (concept 11) – or rather of instability – are ro-
bustly associated with democratization. Anti-government demonstrations (domestic8), government
crises (domestic4), riots (domestic6), assassinations (domestic1), revolutions (domestic7), general
strikes (domestic2), and civil wars (fl war) are robustly positive, increasing the risk of democra-
tization, whereas the length of the current executive’s tenure (tenure), and the age of the regime
(agereg, durable) are robustly negative.
Despite the non-robust result for GDP per capita and democratization, several other economic
factors are quite robust determinants of democratization probability. The resource curse variables
(concept 3) are for example robust. The resource rent (wdi resource), oil exporter (wdi oil, fl oil)
are negative and robust. The minerals variable (wdi mineral) is not robust, however.9 Hence,
these results corroborate the much-discussed stabilizing effects of natural resources on authoritarian
regimes (e.g. Bueno de Mesquita et al. 2003; Bueno de Mesquita and Smith 2009; Ross 2001), at least
when considering threats to such regimes emanating from democratization. Among the indicators
of ‘economic performance’ included in the analysis, the annual GDP growth variable is negative
and robust (wdi gdpgr), whereas the inflation and trade indicators (wdi tot, wdi ttr, wdi inf) are
not robust.
8Note that discrepancies in the operationalization of democracy between Hadenius and Teorell (2007), Cheibubet al (2010) and the authors may distort the results of the regime typologies. The results may also indicate a highcorrelation between the ACLP classification and that of the authors.
9The two remaining resource variables were omitted from this version of the analysis.
19
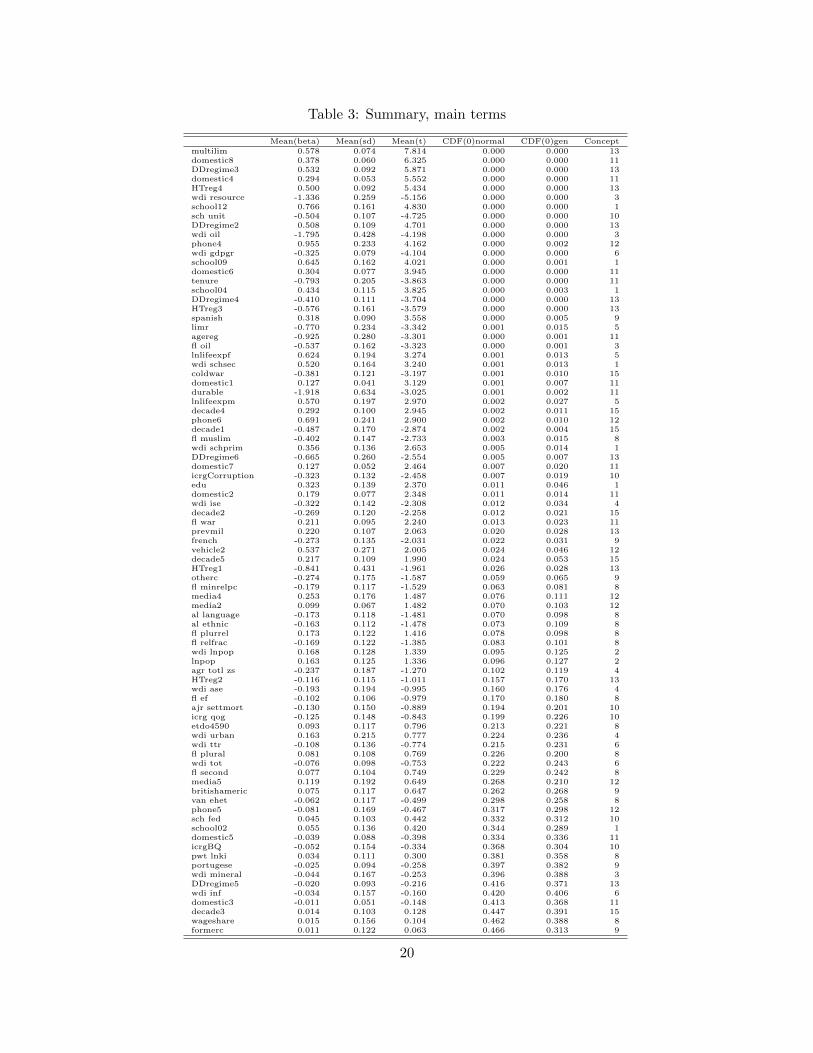
Table 3: Summary, main terms
Mean(beta) Mean(sd) Mean(t) CDF(0)normal CDF(0)gen Conceptmultilim 0.578 0.074 7.814 0.000 0.000 13domestic8 0.378 0.060 6.325 0.000 0.000 11DDregime3 0.532 0.092 5.871 0.000 0.000 13domestic4 0.294 0.053 5.552 0.000 0.000 11HTreg4 0.500 0.092 5.434 0.000 0.000 13wdi resource -1.336 0.259 -5.156 0.000 0.000 3school12 0.766 0.161 4.830 0.000 0.000 1sch unit -0.504 0.107 -4.725 0.000 0.000 10DDregime2 0.508 0.109 4.701 0.000 0.000 13wdi oil -1.795 0.428 -4.198 0.000 0.000 3phone4 0.955 0.233 4.162 0.000 0.002 12wdi gdpgr -0.325 0.079 -4.104 0.000 0.000 6school09 0.645 0.162 4.021 0.000 0.001 1domestic6 0.304 0.077 3.945 0.000 0.000 11tenure -0.793 0.205 -3.863 0.000 0.000 11school04 0.434 0.115 3.825 0.000 0.003 1DDregime4 -0.410 0.111 -3.704 0.000 0.000 13HTreg3 -0.576 0.161 -3.579 0.000 0.000 13spanish 0.318 0.090 3.558 0.000 0.005 9limr -0.770 0.234 -3.342 0.001 0.015 5agereg -0.925 0.280 -3.301 0.000 0.001 11fl oil -0.537 0.162 -3.323 0.000 0.001 3lnlifeexpf 0.624 0.194 3.274 0.001 0.013 5wdi schsec 0.520 0.164 3.240 0.001 0.013 1coldwar -0.381 0.121 -3.197 0.001 0.010 15domestic1 0.127 0.041 3.129 0.001 0.007 11durable -1.918 0.634 -3.025 0.001 0.002 11lnlifeexpm 0.570 0.197 2.970 0.002 0.027 5decade4 0.292 0.100 2.945 0.002 0.011 15phone6 0.691 0.241 2.900 0.002 0.010 12decade1 -0.487 0.170 -2.874 0.002 0.004 15fl muslim -0.402 0.147 -2.733 0.003 0.015 8wdi schprim 0.356 0.136 2.653 0.005 0.014 1DDregime6 -0.665 0.260 -2.554 0.005 0.007 13domestic7 0.127 0.052 2.464 0.007 0.020 11icrgCorruption -0.323 0.132 -2.458 0.007 0.019 10edu 0.323 0.139 2.370 0.011 0.046 1domestic2 0.179 0.077 2.348 0.011 0.014 11wdi ise -0.322 0.142 -2.308 0.012 0.034 4decade2 -0.269 0.120 -2.258 0.012 0.021 15fl war 0.211 0.095 2.240 0.013 0.023 11prevmil 0.220 0.107 2.063 0.020 0.028 13french -0.273 0.135 -2.031 0.022 0.031 9vehicle2 0.537 0.271 2.005 0.024 0.046 12decade5 0.217 0.109 1.990 0.024 0.053 15HTreg1 -0.841 0.431 -1.961 0.026 0.028 13otherc -0.274 0.175 -1.587 0.059 0.065 9fl minrelpc -0.179 0.117 -1.529 0.063 0.081 8media4 0.253 0.176 1.487 0.076 0.111 12media2 0.099 0.067 1.482 0.070 0.103 12al language -0.173 0.118 -1.481 0.070 0.098 8al ethnic -0.163 0.112 -1.478 0.073 0.109 8fl plurrel 0.173 0.122 1.416 0.078 0.098 8fl relfrac -0.169 0.122 -1.385 0.083 0.101 8wdi lnpop 0.168 0.128 1.339 0.095 0.125 2lnpop 0.163 0.125 1.336 0.096 0.127 2agr totl zs -0.237 0.187 -1.270 0.102 0.119 4HTreg2 -0.116 0.115 -1.011 0.157 0.170 13wdi ase -0.193 0.194 -0.995 0.160 0.176 4fl ef -0.102 0.106 -0.979 0.170 0.180 8ajr settmort -0.130 0.150 -0.889 0.194 0.201 10icrg qog -0.125 0.148 -0.843 0.199 0.226 10etdo4590 0.093 0.117 0.796 0.213 0.221 8wdi urban 0.163 0.215 0.777 0.224 0.236 4wdi ttr -0.108 0.136 -0.774 0.215 0.231 6fl plural 0.081 0.108 0.769 0.226 0.200 8wdi tot -0.076 0.098 -0.753 0.222 0.243 6fl second 0.077 0.104 0.749 0.229 0.242 8media5 0.119 0.192 0.649 0.268 0.210 12britishameric 0.075 0.117 0.647 0.262 0.268 9van ehet -0.062 0.117 -0.499 0.298 0.258 8phone5 -0.081 0.169 -0.467 0.317 0.298 12sch fed 0.045 0.103 0.442 0.332 0.312 10school02 0.055 0.136 0.420 0.344 0.289 1domestic5 -0.039 0.088 -0.398 0.334 0.336 11icrgBQ -0.052 0.154 -0.334 0.368 0.304 10pwt lnki 0.034 0.111 0.300 0.381 0.358 8portugese -0.025 0.094 -0.258 0.397 0.382 9wdi mineral -0.044 0.167 -0.253 0.396 0.388 3DDregime5 -0.020 0.093 -0.216 0.416 0.371 13wdi inf -0.034 0.157 -0.160 0.420 0.406 6domestic3 -0.011 0.051 -0.148 0.413 0.368 11decade3 0.014 0.103 0.128 0.447 0.391 15wageshare 0.015 0.156 0.104 0.462 0.388 8formerc 0.011 0.122 0.063 0.466 0.313 9
20
Another concept with robust estimates is that of education (concept 1). Five of the six education
measures are robustly positive – education has a positive effect on the probability of democrati-
zation over and beyond that of GDP per capita (which, as a core variable, is controlled for in
all specifications). Only Banks’ primary school indicator (school02) is not robust despite the fact
that the WDI indicator for the same is (wdi schprim). All three ‘health’ variables (concept 5)
are also robust. Controlling for GDP per capita, low infant mortality rates (limr) and high life
expectancy (lnlifeexpf, lnlifeexpm) have clear positive association with the probability of democ-
ratization. Furthermore, the ‘modernization indicators’ (concept 12) are all positive (controlling
for GDP per capita), and in particular the telephone indicators are robust. Interestingly, some
of the modernization theory literature has argued that a set of variables, other than income level
per se, those accompany broader socioeconomic transformation and development, were vital for
democratization. The combination of a non-robust effect of GDP per capita and relatively robust
effects of the education and modernization concepts provide further indications that the type of
economic transformation processes, rather than whether income increases on aggregate or not, is
what matters for democratization. Further indications of this proposition were of course given
above, where it was noted that increased income from natural resources deter rather than spur
democratization.
Furthermore, two of the ‘colonial heritage’ variables (concept 9) are robust – spanish ex-colonies
are robustly positive and french robustly negative. The others (british, portuguese, others) are
not robust. Several of the time dummies (concept 15) are robust. The 1960s, 1970s, and cold
war period dummies (decade1, decade2, coldwar) are robustly negative, and the 1990s and 2000s
(decade4, decade5) robustly positive, with the 1980s in between. Among the ‘ethnicity and religion’
variables (concept 8), only the percentage muslim variable (muslim) is robust, with a negative sign.
Table 4 summarizes the average statistics for the interaction terms between the 85 variables
and the lagged democracy variable. These coefficients are interpreted as the change in log odds of
democracy at t for observations that were democratic at t−1, i.e. log odds of continued democracy
or democratic stability.
Considerably fewer of the interaction coefficients are robust. However, several regime type indi-
cators are robust also when it comes to affecting democratic stability, e.g. those indicating ‘limited
multi-party regimes’ or ‘multiparty autocracies’ (multilim, HTreg4). Furthermore, we find that
presidential, and mixed democracies (DDregime2, DDregime3) have consistent negative signs. The
latter results provide support for the hypothesis proposed by Linz (1990) that parliamentary regimes
are generally more stable than presidential. Additionally, the results are also barely negatively ro-
bust for regimes that succeeded military autocracies (prevmil), indicating the destabilizing effect of
military intervention in politics (see Cheibub 2007). Moreover, the ‘political stability’ indicators are
robust (concept 11). As for autocracies, government crises, riots, and anti-government demonstra-
tions (domestic4, domestic6, domestic8) increase the risk of regime type change – they are robustly
21
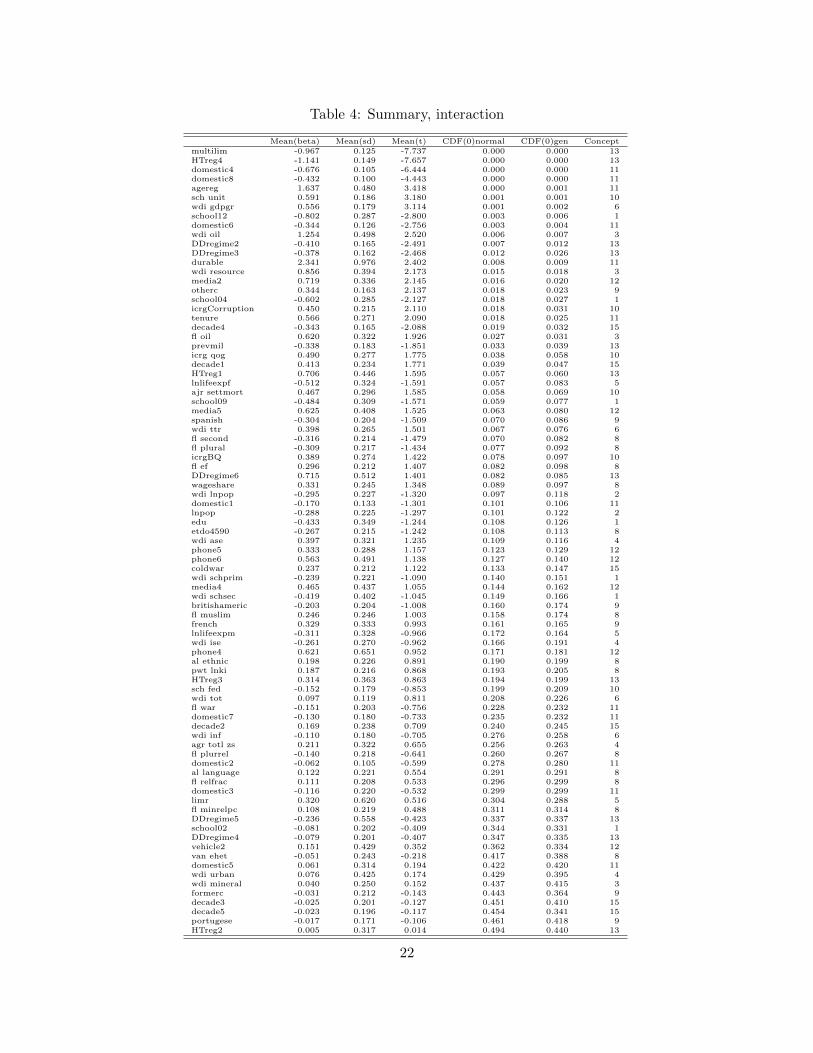
Table 4: Summary, interaction
Mean(beta) Mean(sd) Mean(t) CDF(0)normal CDF(0)gen Conceptmultilim -0.967 0.125 -7.737 0.000 0.000 13HTreg4 -1.141 0.149 -7.657 0.000 0.000 13domestic4 -0.676 0.105 -6.444 0.000 0.000 11domestic8 -0.432 0.100 -4.443 0.000 0.000 11agereg 1.637 0.480 3.418 0.000 0.001 11sch unit 0.591 0.186 3.180 0.001 0.001 10wdi gdpgr 0.556 0.179 3.114 0.001 0.002 6school12 -0.802 0.287 -2.800 0.003 0.006 1domestic6 -0.344 0.126 -2.756 0.003 0.004 11wdi oil 1.254 0.498 2.520 0.006 0.007 3DDregime2 -0.410 0.165 -2.491 0.007 0.012 13DDregime3 -0.378 0.162 -2.468 0.012 0.026 13durable 2.341 0.976 2.402 0.008 0.009 11wdi resource 0.856 0.394 2.173 0.015 0.018 3media2 0.719 0.336 2.145 0.016 0.020 12otherc 0.344 0.163 2.137 0.018 0.023 9school04 -0.602 0.285 -2.127 0.018 0.027 1icrgCorruption 0.450 0.215 2.110 0.018 0.031 10tenure 0.566 0.271 2.090 0.018 0.025 11decade4 -0.343 0.165 -2.088 0.019 0.032 15fl oil 0.620 0.322 1.926 0.027 0.031 3prevmil -0.338 0.183 -1.851 0.033 0.039 13icrg qog 0.490 0.277 1.775 0.038 0.058 10decade1 0.413 0.234 1.771 0.039 0.047 15HTreg1 0.706 0.446 1.595 0.057 0.060 13lnlifeexpf -0.512 0.324 -1.591 0.057 0.083 5ajr settmort 0.467 0.296 1.585 0.058 0.069 10school09 -0.484 0.309 -1.571 0.059 0.077 1media5 0.625 0.408 1.525 0.063 0.080 12spanish -0.304 0.204 -1.509 0.070 0.086 9wdi ttr 0.398 0.265 1.501 0.067 0.076 6fl second -0.316 0.214 -1.479 0.070 0.082 8fl plural -0.309 0.217 -1.434 0.077 0.092 8icrgBQ 0.389 0.274 1.422 0.078 0.097 10fl ef 0.296 0.212 1.407 0.082 0.098 8DDregime6 0.715 0.512 1.401 0.082 0.085 13wageshare 0.331 0.245 1.348 0.089 0.097 8wdi lnpop -0.295 0.227 -1.320 0.097 0.118 2domestic1 -0.170 0.133 -1.301 0.101 0.106 11lnpop -0.288 0.225 -1.297 0.101 0.122 2edu -0.433 0.349 -1.244 0.108 0.126 1etdo4590 -0.267 0.215 -1.242 0.108 0.113 8wdi ase 0.397 0.321 1.235 0.109 0.116 4phone5 0.333 0.288 1.157 0.123 0.129 12phone6 0.563 0.491 1.138 0.127 0.140 12coldwar 0.237 0.212 1.122 0.133 0.147 15wdi schprim -0.239 0.221 -1.090 0.140 0.151 1media4 0.465 0.437 1.055 0.144 0.162 12wdi schsec -0.419 0.402 -1.045 0.149 0.166 1britishameric -0.203 0.204 -1.008 0.160 0.174 9fl muslim 0.246 0.246 1.003 0.158 0.174 8french 0.329 0.333 0.993 0.161 0.165 9lnlifeexpm -0.311 0.328 -0.966 0.172 0.164 5wdi ise -0.261 0.270 -0.962 0.166 0.191 4phone4 0.621 0.651 0.952 0.171 0.181 12al ethnic 0.198 0.226 0.891 0.190 0.199 8pwt lnki 0.187 0.216 0.868 0.193 0.205 8HTreg3 0.314 0.363 0.863 0.194 0.199 13sch fed -0.152 0.179 -0.853 0.199 0.209 10wdi tot 0.097 0.119 0.811 0.208 0.226 6fl war -0.151 0.203 -0.756 0.228 0.232 11domestic7 -0.130 0.180 -0.733 0.235 0.232 11decade2 0.169 0.238 0.709 0.240 0.245 15wdi inf -0.110 0.180 -0.705 0.276 0.258 6agr totl zs 0.211 0.322 0.655 0.256 0.263 4fl plurrel -0.140 0.218 -0.641 0.260 0.267 8domestic2 -0.062 0.105 -0.599 0.278 0.280 11al language 0.122 0.221 0.554 0.291 0.291 8fl relfrac 0.111 0.208 0.533 0.296 0.299 8domestic3 -0.116 0.220 -0.532 0.299 0.299 11limr 0.320 0.620 0.516 0.304 0.288 5fl minrelpc 0.108 0.219 0.488 0.311 0.314 8DDregime5 -0.236 0.558 -0.423 0.337 0.337 13school02 -0.081 0.202 -0.409 0.344 0.331 1DDregime4 -0.079 0.201 -0.407 0.347 0.335 13vehicle2 0.151 0.429 0.352 0.362 0.334 12van ehet -0.051 0.243 -0.218 0.417 0.388 8domestic5 0.061 0.314 0.194 0.422 0.420 11wdi urban 0.076 0.425 0.174 0.429 0.395 4wdi mineral 0.040 0.250 0.152 0.437 0.415 3formerc -0.031 0.212 -0.143 0.443 0.364 9decade3 -0.025 0.201 -0.127 0.451 0.410 15decade5 -0.023 0.196 -0.117 0.454 0.341 15portugese -0.017 0.171 -0.106 0.461 0.418 9HTreg2 0.005 0.317 0.014 0.494 0.440 13
22
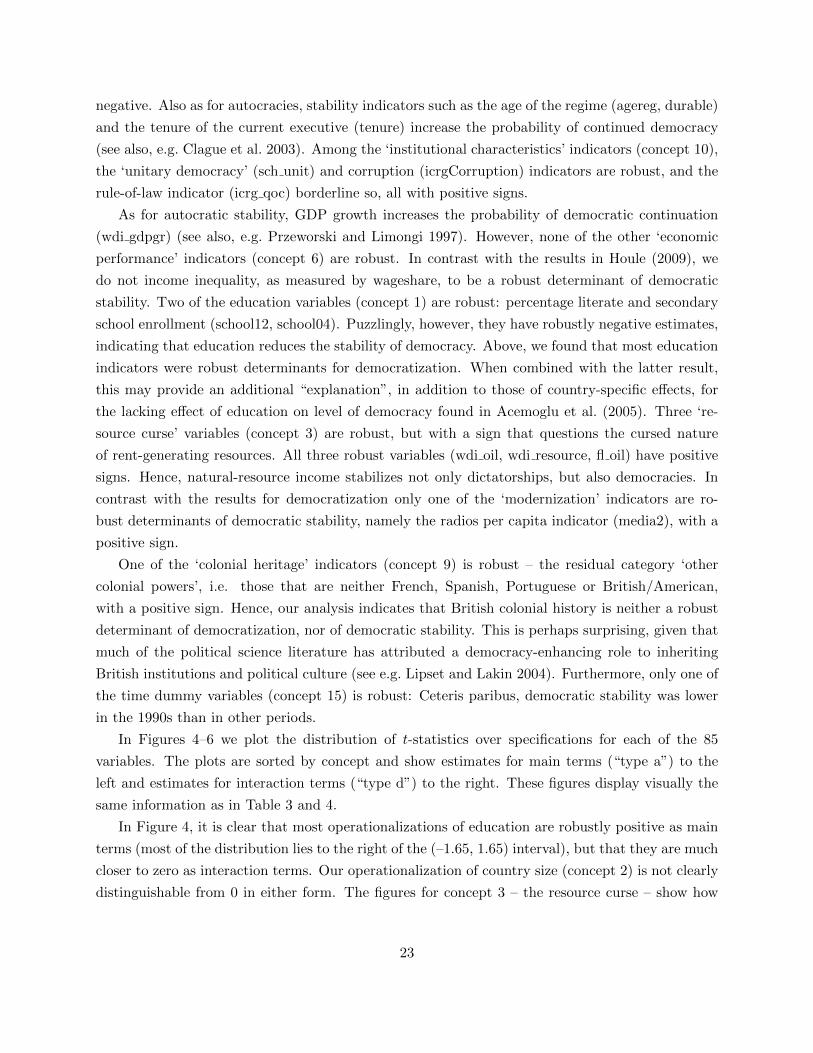
negative. Also as for autocracies, stability indicators such as the age of the regime (agereg, durable)
and the tenure of the current executive (tenure) increase the probability of continued democracy
(see also, e.g. Clague et al. 2003). Among the ‘institutional characteristics’ indicators (concept 10),
the ‘unitary democracy’ (sch unit) and corruption (icrgCorruption) indicators are robust, and the
rule-of-law indicator (icrg qoc) borderline so, all with positive signs.
As for autocratic stability, GDP growth increases the probability of democratic continuation
(wdi gdpgr) (see also, e.g. Przeworski and Limongi 1997). However, none of the other ‘economic
performance’ indicators (concept 6) are robust. In contrast with the results in Houle (2009), we
do not income inequality, as measured by wageshare, to be a robust determinant of democratic
stability. Two of the education variables (concept 1) are robust: percentage literate and secondary
school enrollment (school12, school04). Puzzlingly, however, they have robustly negative estimates,
indicating that education reduces the stability of democracy. Above, we found that most education
indicators were robust determinants for democratization. When combined with the latter result,
this may provide an additional “explanation”, in addition to those of country-specific effects, for
the lacking effect of education on level of democracy found in Acemoglu et al. (2005). Three ‘re-
source curse’ variables (concept 3) are robust, but with a sign that questions the cursed nature
of rent-generating resources. All three robust variables (wdi oil, wdi resource, fl oil) have positive
signs. Hence, natural-resource income stabilizes not only dictatorships, but also democracies. In
contrast with the results for democratization only one of the ‘modernization’ indicators are ro-
bust determinants of democratic stability, namely the radios per capita indicator (media2), with a
positive sign.
One of the ‘colonial heritage’ indicators (concept 9) is robust – the residual category ‘other
colonial powers’, i.e. those that are neither French, Spanish, Portuguese or British/American,
with a positive sign. Hence, our analysis indicates that British colonial history is neither a robust
determinant of democratization, nor of democratic stability. This is perhaps surprising, given that
much of the political science literature has attributed a democracy-enhancing role to inheriting
British institutions and political culture (see e.g. Lipset and Lakin 2004). Furthermore, only one of
the time dummy variables (concept 15) is robust: Ceteris paribus, democratic stability was lower
in the 1990s than in other periods.
In Figures 4–6 we plot the distribution of t-statistics over specifications for each of the 85
variables. The plots are sorted by concept and show estimates for main terms (“type a”) to the
left and estimates for interaction terms (“type d”) to the right. These figures display visually the
same information as in Table 3 and 4.
In Figure 4, it is clear that most operationalizations of education are robustly positive as main
terms (most of the distribution lies to the right of the (–1.65, 1.65) interval), but that they are much
closer to zero as interaction terms. Our operationalization of country size (concept 2) is not clearly
distinguishable from 0 in either form. The figures for concept 3 – the resource curse – show how
23
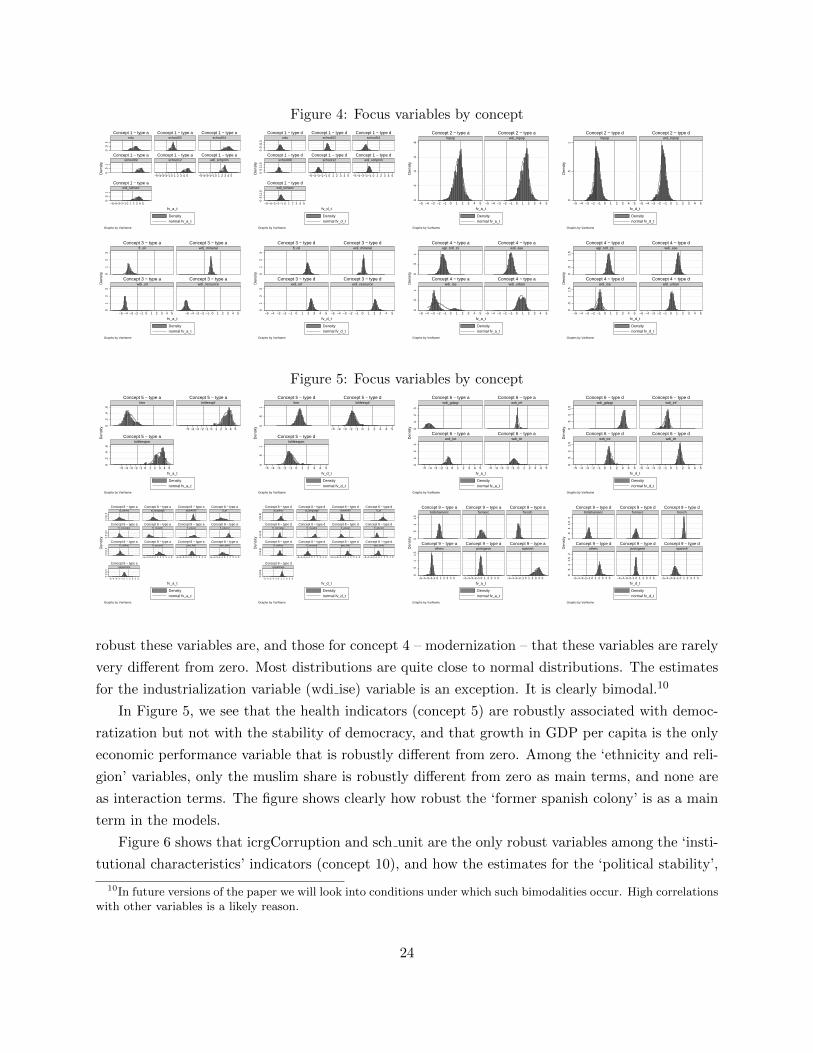
Figure 4: Focus variables by concept0
.51
0.5
10
.51
−5−4−3−2−1 0 1 2 3 4 5 −5−4−3−2−1 0 1 2 3 4 5
−5−4−3−2−1 0 1 2 3 4 5
edu school02 school04
school09 school12 wdi_schprim
wdi_schsec
Concept 1 − type a Concept 1 − type a Concept 1 − type a
Concept 1 − type a Concept 1 − type a Concept 1 − type a
Concept 1 − type a
Densitynormal fv_a_t
Den
sity
fv_a_t
Graphs by VarName
0.5
11.5
0.5
11.5
0.5
11.5
−5−4−3−2−1 0 1 2 3 4 5 −5−4−3−2−1 0 1 2 3 4 5
−5−4−3−2−1 0 1 2 3 4 5
edu school02 school04
school09 school12 wdi_schprim
wdi_schsec
Concept 1 − type d Concept 1 − type d Concept 1 − type d
Concept 1 − type d Concept 1 − type d Concept 1 − type d
Concept 1 − type d
Densitynormal fv_d_t
Den
sity
fv_d_t
Graphs by VarName
0.2
.4.6
.8
−5 −4 −3 −2 −1 0 1 2 3 4 5 −5 −4 −3 −2 −1 0 1 2 3 4 5
lnpop wdi_lnpopConcept 2 − type a Concept 2 − type a
Densitynormal fv_a_t
Den
sity
fv_a_t
Graphs by VarName
0.5
1
−5 −4 −3 −2 −1 0 1 2 3 4 5 −5 −4 −3 −2 −1 0 1 2 3 4 5
lnpop wdi_lnpopConcept 2 − type d Concept 2 − type d
Densitynormal fv_d_t
Den
sity
fv_d_t
Graphs by VarName
01
23
01
23
−5 −4 −3 −2 −1 0 1 2 3 4 5 −5 −4 −3 −2 −1 0 1 2 3 4 5
fl_oil wdi_mineral
wdi_oil wdi_resource
Concept 3 − type a Concept 3 − type a
Concept 3 − type a Concept 3 − type a
Densitynormal fv_a_t
Den
sity
fv_a_t
Graphs by VarName
01
23
01
23
−5 −4 −3 −2 −1 0 1 2 3 4 5 −5 −4 −3 −2 −1 0 1 2 3 4 5
fl_oil wdi_mineral
wdi_oil wdi_resource
Concept 3 − type d Concept 3 − type d
Concept 3 − type d Concept 3 − type d
Densitynormal fv_d_t
Den
sity
fv_d_t
Graphs by VarName
0.5
10
.51
−5 −4 −3 −2 −1 0 1 2 3 4 5 −5 −4 −3 −2 −1 0 1 2 3 4 5
agr_totl_zs wdi_ase
wdi_ise wdi_urban
Concept 4 − type a Concept 4 − type a
Concept 4 − type a Concept 4 − type a
Densitynormal fv_a_t
Den
sity
fv_a_t
Graphs by VarName
0.5
11.
50
.51
1.5
−5 −4 −3 −2 −1 0 1 2 3 4 5 −5 −4 −3 −2 −1 0 1 2 3 4 5
agr_totl_zs wdi_ase
wdi_ise wdi_urban
Concept 4 − type d Concept 4 − type d
Concept 4 − type d Concept 4 − type d
Densitynormal fv_d_t
Den
sity
fv_d_t
Graphs by VarName
Figure 5: Focus variables by concept
0.2
.4.6
0.2
.4.6
−5 −4 −3 −2 −1 0 1 2 3 4 5
−5 −4 −3 −2 −1 0 1 2 3 4 5
limr lnlifeexpf
lnlifeexpm
Concept 5 − type a Concept 5 − type a
Concept 5 − type a
Densitynormal fv_a_t
Den
sity
fv_a_t
Graphs by VarName
0.5
10
.51
−5 −4 −3 −2 −1 0 1 2 3 4 5
−5 −4 −3 −2 −1 0 1 2 3 4 5
limr lnlifeexpf
lnlifeexpm
Concept 5 − type d Concept 5 − type d
Concept 5 − type d
Densitynormal fv_d_t
Den
sity
fv_d_t
Graphs by VarName
01
23
01
23
−5 −4 −3 −2 −1 0 1 2 3 4 5 −5 −4 −3 −2 −1 0 1 2 3 4 5
wdi_gdpgr wdi_inf
wdi_tot wdi_ttr
Concept 6 − type a Concept 6 − type a
Concept 6 − type a Concept 6 − type a
Densitynormal fv_a_t
Den
sity
fv_a_t
Graphs by VarName
0.5
11.
50
.51
1.5
−5 −4 −3 −2 −1 0 1 2 3 4 5 −5 −4 −3 −2 −1 0 1 2 3 4 5
wdi_gdpgr wdi_inf
wdi_tot wdi_ttr
Concept 6 − type d Concept 6 − type d
Concept 6 − type d Concept 6 − type d
Densitynormal fv_d_t
Den
sity
fv_d_t
Graphs by VarName
0.5
11.5
0.5
11.5
0.5
11.5
0.5
11.5
−5−4−3−2−1 0 1 2 3 4 5 −5−4−3−2−1 0 1 2 3 4 5 −5−4−3−2−1 0 1 2 3 4 5
−5−4−3−2−1 0 1 2 3 4 5
al_ethnic al_language etdo4590 fl_ef
fl_minrelpc fl_muslim fl_plural fl_plurrel
fl_relfrac fl_second pwt_lnki van_ehet
wageshare
Concept 8 − type a Concept 8 − type a Concept 8 − type a Concept 8 − type a
Concept 8 − type a Concept 8 − type a Concept 8 − type a Concept 8 − type a
Concept 8 − type a Concept 8 − type a Concept 8 − type a Concept 8 − type a
Concept 8 − type a
Densitynormal fv_a_t
Den
sity
fv_a_t
Graphs by VarName
0.51
1.52
0.51
1.52
0.51
1.52
0.51
1.52
−5−4−3−2−1 0 1 2 3 4 5 −5−4−3−2−1 0 1 2 3 4 5 −5−4−3−2−1 0 1 2 3 4 5
−5−4−3−2−1 0 1 2 3 4 5
al_ethnic al_language etdo4590 fl_ef
fl_minrelpc fl_muslim fl_plural fl_plurrel
fl_relfrac fl_second pwt_lnki van_ehet
wageshare
Concept 8 − type d Concept 8 − type d Concept 8 − type d Concept 8 − type d
Concept 8 − type d Concept 8 − type d Concept 8 − type d Concept 8 − type d
Concept 8 − type d Concept 8 − type d Concept 8 − type d Concept 8 − type d
Concept 8 − type d
Densitynormal fv_d_t
Den
sity
fv_d_t
Graphs by VarName
0.5
11.
50
.51
1.5
−5−4−3−2−1 0 1 2 3 4 5 −5−4−3−2−1 0 1 2 3 4 5 −5−4−3−2−1 0 1 2 3 4 5
britishameric formerc french
otherc portugese spanish
Concept 9 − type a Concept 9 − type a Concept 9 − type a
Concept 9 − type a Concept 9 − type a Concept 9 − type a
Densitynormal fv_a_t
Den
sity
fv_a_t
Graphs by VarName
0.5
11.
52
0.5
11.
52
−5−4−3−2−1 0 1 2 3 4 5 −5−4−3−2−1 0 1 2 3 4 5 −5−4−3−2−1 0 1 2 3 4 5
britishameric formerc french
otherc portugese spanish
Concept 9 − type d Concept 9 − type d Concept 9 − type d
Concept 9 − type d Concept 9 − type d Concept 9 − type d
Densitynormal fv_d_t
Den
sity
fv_d_t
Graphs by VarName
robust these variables are, and those for concept 4 – modernization – that these variables are rarely
very different from zero. Most distributions are quite close to normal distributions. The estimates
for the industrialization variable (wdi ise) variable is an exception. It is clearly bimodal.10
In Figure 5, we see that the health indicators (concept 5) are robustly associated with democ-
ratization but not with the stability of democracy, and that growth in GDP per capita is the only
economic performance variable that is robustly different from zero. Among the ‘ethnicity and reli-
gion’ variables, only the muslim share is robustly different from zero as main terms, and none are
as interaction terms. The figure shows clearly how robust the ‘former spanish colony’ is as a main
term in the models.
Figure 6 shows that icrgCorruption and sch unit are the only robust variables among the ‘insti-
tutional characteristics’ indicators (concept 10), and how the estimates for the ‘political stability’,
10In future versions of the paper we will look into conditions under which such bimodalities occur. High correlationswith other variables is a likely reason.
24
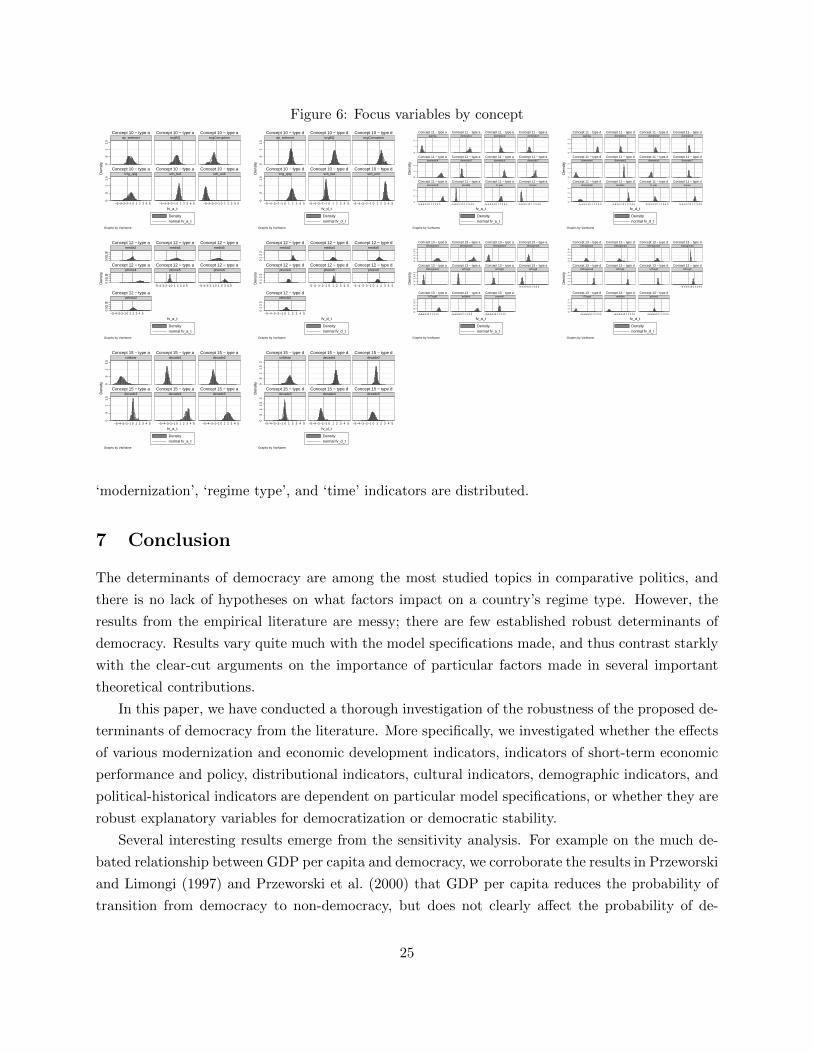
Figure 6: Focus variables by concept0
.51
1.5
0.5
11.
5
−5−4−3−2−1 0 1 2 3 4 5 −5−4−3−2−1 0 1 2 3 4 5 −5−4−3−2−1 0 1 2 3 4 5
ajr_settmort icrgBQ icrgCorruption
icrg_qog sch_fed sch_unit
Concept 10 − type a Concept 10 − type a Concept 10 − type a
Concept 10 − type a Concept 10 − type a Concept 10 − type a
Densitynormal fv_a_t
Den
sity
fv_a_t
Graphs by VarName
0.5
11.
50
.51
1.5
−5−4−3−2−1 0 1 2 3 4 5 −5−4−3−2−1 0 1 2 3 4 5 −5−4−3−2−1 0 1 2 3 4 5
ajr_settmort icrgBQ icrgCorruption
icrg_qog sch_fed sch_unit
Concept 10 − type d Concept 10 − type d Concept 10 − type d
Concept 10 − type d Concept 10 − type d Concept 10 − type d
Densitynormal fv_d_t
Den
sity
fv_d_t
Graphs by VarName
01
20
12
01
2
−5−4−3−2−10 1 2 3 4 5 −5−4−3−2−10 1 2 3 4 5 −5−4−3−2−10 1 2 3 4 5 −5−4−3−2−10 1 2 3 4 5
agereg domestic1 domestic2 domestic3
domestic4 domestic5 domestic6 domestic7
domestic8 durable fl_war tenure
Concept 11 − type a Concept 11 − type a Concept 11 − type a Concept 11 − type a
Concept 11 − type a Concept 11 − type a Concept 11 − type a Concept 11 − type a
Concept 11 − type a Concept 11 − type a Concept 11 − type a Concept 11 − type a
Densitynormal fv_a_t
Den
sity
fv_a_t
Graphs by VarName
01
23
01
23
01
23
−5−4−3−2−10 1 2 3 4 5 −5−4−3−2−10 1 2 3 4 5 −5−4−3−2−10 1 2 3 4 5 −5−4−3−2−10 1 2 3 4 5
agereg domestic1 domestic2 domestic3
domestic4 domestic5 domestic6 domestic7
domestic8 durable fl_war tenure
Concept 11 − type d Concept 11 − type d Concept 11 − type d Concept 11 − type d
Concept 11 − type d Concept 11 − type d Concept 11 − type d Concept 11 − type d
Concept 11 − type d Concept 11 − type d Concept 11 − type d Concept 11 − type d
Densitynormal fv_d_t
Den
sity
fv_d_t
Graphs by VarName
0.51
1.52
0.51
1.52
0.51
1.52
−5−4−3−2−1 0 1 2 3 4 5 −5−4−3−2−1 0 1 2 3 4 5
−5−4−3−2−1 0 1 2 3 4 5
media2 media4 media5
phone4 phone5 phone6
vehicle2
Concept 12 − type a Concept 12 − type a Concept 12 − type a
Concept 12 − type a Concept 12 − type a Concept 12 − type a
Concept 12 − type a
Densitynormal fv_a_t
Den
sity
fv_a_t
Graphs by VarName
01
23
01
23
01
23
−5−4−3−2−1 0 1 2 3 4 5 −5−4−3−2−1 0 1 2 3 4 5
−5−4−3−2−1 0 1 2 3 4 5
media2 media4 media5
phone4 phone5 phone6
vehicle2
Concept 12 − type d Concept 12 − type d Concept 12 − type d
Concept 12 − type d Concept 12 − type d Concept 12 − type d
Concept 12 − type d
Densitynormal fv_d_t
Den
sity
fv_d_t
Graphs by VarName
0.5
11.
52
0.5
11.
52
0.5
11.
52
−5−4−3−2−10 1 2 3 4 5
−5−4−3−2−10 1 2 3 4 5 −5−4−3−2−10 1 2 3 4 5 −5−4−3−2−10 1 2 3 4 5
DDregime2 DDregime3 DDregime4 DDregime5
DDregime6 HTreg1 HTreg2 HTreg3
HTreg4 multilim prevmil
Concept 13 − type a Concept 13 − type a Concept 13 − type a Concept 13 − type a
Concept 13 − type a Concept 13 − type a Concept 13 − type a Concept 13 − type a
Concept 13 − type a Concept 13 − type a Concept 13 − type a
Densitynormal fv_a_t
Den
sity
fv_a_t
Graphs by VarName
01
23
40
12
34
01
23
4
−5−4−3−2−10 1 2 3 4 5
−5−4−3−2−10 1 2 3 4 5 −5−4−3−2−10 1 2 3 4 5 −5−4−3−2−10 1 2 3 4 5
DDregime2 DDregime3 DDregime4 DDregime5
DDregime6 HTreg1 HTreg2 HTreg3
HTreg4 multilim prevmil
Concept 13 − type d Concept 13 − type d Concept 13 − type d Concept 13 − type d
Concept 13 − type d Concept 13 − type d Concept 13 − type d Concept 13 − type d
Concept 13 − type d Concept 13 − type d Concept 13 − type d
Densitynormal fv_d_t
Den
sity
fv_d_t
Graphs by VarName
0.5
11.
50
.51
1.5
−5−4−3−2−1 0 1 2 3 4 5 −5−4−3−2−1 0 1 2 3 4 5 −5−4−3−2−1 0 1 2 3 4 5
coldwar decade1 decade2
decade3 decade4 decade5
Concept 15 − type a Concept 15 − type a Concept 15 − type a
Concept 15 − type a Concept 15 − type a Concept 15 − type a
Densitynormal fv_a_t
Den
sity
fv_a_t
Graphs by VarName
0.5
11.
52
0.5
11.
52
−5−4−3−2−1 0 1 2 3 4 5 −5−4−3−2−1 0 1 2 3 4 5 −5−4−3−2−1 0 1 2 3 4 5
coldwar decade1 decade2
decade3 decade4 decade5
Concept 15 − type d Concept 15 − type d Concept 15 − type d
Concept 15 − type d Concept 15 − type d Concept 15 − type d
Densitynormal fv_d_t
Den
sity
fv_d_t
Graphs by VarName
‘modernization’, ‘regime type’, and ‘time’ indicators are distributed.
7 Conclusion
The determinants of democracy are among the most studied topics in comparative politics, and
there is no lack of hypotheses on what factors impact on a country’s regime type. However, the
results from the empirical literature are messy; there are few established robust determinants of
democracy. Results vary quite much with the model specifications made, and thus contrast starkly
with the clear-cut arguments on the importance of particular factors made in several important
theoretical contributions.
In this paper, we have conducted a thorough investigation of the robustness of the proposed de-
terminants of democracy from the literature. More specifically, we investigated whether the effects
of various modernization and economic development indicators, indicators of short-term economic
performance and policy, distributional indicators, cultural indicators, demographic indicators, and
political-historical indicators are dependent on particular model specifications, or whether they are
robust explanatory variables for democratization or democratic stability.
Several interesting results emerge from the sensitivity analysis. For example on the much de-
bated relationship between GDP per capita and democracy, we corroborate the results in Przeworski
and Limongi (1997) and Przeworski et al. (2000) that GDP per capita reduces the probability of
transition from democracy to non-democracy, but does not clearly affect the probability of de-
25
mocratization. Furthermore, we find that various health and education indicators have a robust
relationship with probability of democratization, but surprisingly do not seem to contribute to
democratic stability.
We also find robust relationships between several concept operationalizations and the probability
of transition between democracy and non-democracy, in both directions. As in Gates et al. (2006),
indicators that identify institutions that fall between consistent democracy or consistent autocracy
are associated with a high probability of democratization and of autocratization. Several measures
of political stability are also robustly associated with both types of transition – stabilities predicts
non-transition well, as one would expect. Economic growth also stabilizes both regime types. We
also find ‘resource curse’ variables, and oil in particular, to reduce the risk of transitions in both
directions.
Several variables have no robust relationship with either democratization nor autocratization.
For example, we do not find any robust relationship with British colonial history. Neither do we
find any significant relationship with income inequality. Furthermore, only one of our ethnicity and
religion variable is robust: The share of the population that is muslim is a robust negative predictor
of democratization. It is not a robust predictor of change from democracy toward non-democracy,
however, and this result may be more due to historical contingencies than to a real effect of a
particular religion.
26
References
Acemoglu, Daron and James A. Robinson. 2000. “Why Did the West Extend the Franchise?
Democracy, Inequality, and Growth in Historical Perspective.” Quarterly Journal of Economics
115(4):1167–1199.
Acemoglu, Daron and James A. Robinson. 2006. Economic Origins of Dictatorship and Democracy.
New York: Cambridge University Press.
Acemoglu, Daron, Simon Johnson and James A. Robinson. 2001. “The Colonial Origins of Compar-
ative Development: An Empirical Investigation.” American Economic Review 91(5):1369–1401.
Acemoglu, Daron, Simon Johnson, James A. Robinson and Pierre Yared. 2005. “From Education
to Democracy.” Washington D.C.: NBER. NBER Working Paper No. w11204.
Acemoglu, Daron, Simon Johnson, James A. Robinson and Pierre Yared. 2008. “Income and
Democracy.” American Economic Review 98(3):808–842.
Alesina, Alberto, Reza Baquir and William Easterly. 1999. “Public Goods and Ethnic Divisions.”
The Quarterly Journal of Economics 114(4):1243–1284.
Almond, Gabriel and Sidney Verba. 1963. The Civic Culture: Political Attitudes and Democracy
in Five Nations. Princeton: Princeton University Press.
Arat, Zehra F. 1991. Democracy and Human Rights in Developing Countries. Boulder: Lynne
Rienner.
Baldwin, Kate and John D. Huber. 2010. “Economic versus Cultural Differences: Forms of Ethnic
Diversity and Public Goods Provision.” American Political Science Review 104(4):644–662.
Benhabib, Jess, Alejandro Corvalan and Spiegel Mark M. 2011. “Reestablishing the Income-
Democracy Nexus.” Working Paper .
Bogaards, Matthijs. 2011. “Where to draw the line? From degree to dichotomy in measures of
democracy.” Democratization 0(0):1–23.
URL: http://www.tandfonline.com/doi/abs/10.1080/13510347.2011.613563
Boix, Carles. 2003. Democracy and Redistribution. Cambridge: Cambridge University Press.
Boix, Carles and Susan C. Stokes. 2003. “Endogenous Democratization.” World Politics 55(4):517–
549.
Bollen, Kenneth A. and Robert W. Jackman. 1995. “Income Inequality and Democratization
Revisited: Comment on Muller.” American Sociological Review Vol. 60, No. 6:pp. 983–989.
27
Bratton, Michael and Nicholas van de Walle. 1997. Democratic Experiments in Africa: Regime
Transitions in Comparative Perspective. Cambridge Studies in Comparative Politics Cambridge
University Press.
Bueno de Mesquita, Bruce and Alastair Smith. 2009. “Political Survival and Endogenous Institu-
tional Change.” Comparative Political Studies 42:167–197.
Bueno de Mesquita, Bruce, Alistair Smith, Randolph M. Siverson and James D. Morrow. 2003.
The Logic of Political Survival. Cambridge, Massachusetts: MIT Press.
Cheibub, Jose Antonio. 2007. Presidentialism, Parliamentarism and Democracy. Cambridge: Cam-
bridge University Press.
Cheibub, Jose Antonio and Fernando Limongi. 2002. “Democratic Institutions and Regime Survival:
Parliamentary and Presidential Democracies Reconsidered.” Annual Review of Political Science
5:151–179.
Cheibub, Jose Antonio, Jennifer Gandhi and James Vreeland. 2010. “Democracy and dictatorship
revisited.” Public Choice 143:67–101. 10.1007/s11127-009-9491-2.
URL: http://dx.doi.org/10.1007/s11127-009-9491-2
Clague, Christopher, Philip Keefer, Stephen Knack and Mancur Olson. 2003. Property and Contract
Rights in Autocracies and Democracies. In Democracy, Governance and Growth, ed. Stephen
Knack. Ann Arbor: The University of Michigan Press pp. 78–109.
Dahl, Robert A. and Edward R. Tufte. 1973. Size and Democracy. Stanford: Stanford University
Press.
Diamond, Larry. 1992. “Economic Development and Democracy Reconsidered.” American Behav-
ioral Scientist 35(4):450–499.
Diamond, Larry. 2008. The Spirit of Democracy. New York: Times Books.
Djankov, Simeon, Rafael La Porta, Florencio Lopez-de Silanes and Andrei Shleifer. 2003. “Courts.”
The Quarterly Journal of Economics 118(2):453–517.
Fearon, James D. 2003. “Ethnic and cultural diversity by country.” Journal of Economic Growth
8:195–222.
Feng, Yi. 2005. Democracy, Governance and Economic Performance. Cambridge, MA.: The MIT
Press.
Gates, Scott, Havard Hegre, Mark P. Jones and Havard Strand. 2006. “Institutional Inconsistency
and Political Instability: Polity Duration, 1800–2000.” American Journal of Political Science
50(4):893–908.
28
Gleditsch, Kristian Skrede. 1996. Aspects of Democratization: Economic Development, Spatial
Autocorrelation, and Persistence in Time. In Norwegian National Political Science Conference.
Geilo: January 8–9.
Gleditsch, Kristian Skrede and Michael D. Ward. 2006. “Diffusion and the International Context
of Democratization.” International Organization 60(4):911–933.
Gurr, Ted Robert. 1970. Why Men Rebel. Princeton, NJ: Princeton University Press.
Hadenius, Axel. 1992. Democracy and Development. Cambridge: Cambridge University Press.
Hadenius, Axel and Jan Teorell. 2005. “Cultural and Economic Prerequisites of Democracy: Re-
assessing Recent Evidence.” Studies in Comparative International Development 39(4):87–106.
Hadenius, Axel and Jan Teorell. 2007. “Pathways from Authoritarianism.” Journal of Democracy
18(1):143 –156.
Hegre, Havard and Nicholas Sambanis. 2006. “Sensitivity Analysis of Empirical Results on Civil
War Onset.” Journal of Conflict Resolution 50(4):508–535.
Helliwell, John F. 1994. “Empirical Linkages between Democracy and Economic Growth.” British
Journal of Political Science 24(2):225–248.
Honaker, James and Gary King. 2010. “What to Do about Missing Values in Time-Series Cross-
Section Data.” American Journal of Political Science 54:561–581.
Honaker, James, Gary King and Michael Blackwell. 2011. “Amelia II: A Program for Missing
Data.” Journal of Statistical Software 45:1–47.
Houle, Christian. 2009. “Inequality and Democracy: Why Inequality Harms Consolidation but
Does Not Affect Democratization.” World Politics 61(4):589–622.
Huntington, Samuel P. 1991. The Third Wave: Democratization in the Late Twentieth Century.
Norman, OK and London: University of Oklahoma Press.
Huntington, Samuel P. 1996. The Clash of Civilizations and the Remaking of World Order. New
York: Simon & Schuster.
Inglehart, Ronald. 1997. Modernization and Postmodernization. Princeton University Press.
Inglehart, Ronald and Christian Welzel. 2006. Modernization, Cultural Change and Democracy
–The Human Development Sequence. Cambridge: Cambridge University Press.
La Porta, R, F Lopez-de Silanes, A Shleifer and R Vishny. 1999. “The Quality of Government.” J
Law Econ Organ 15(1):222–279.
29
Leamer, Edwar. 1985. “Sensitivity analyses would help.” American Economic Review 75:308–313.
Levine, Ross and David Renelt. 1992. “A sensitivity analysis of cross-country growth regressions.”
American E 82:942–963.
Li, Quan. 2005. “Does Democracy Promote or Reduce Transnational Terrorist Incidents?” Journal
of Conflict Resolution 49:278.
Lijphart, Arend. 1999. Patterns of Democracy. New Haven: Yale University Press.
Lindberg, Staffan I. 2006. Democracy and Elections in Africa. Baltimore, MD: John Hopkins
University Press.
Linz, Juan J. 1990. “The Perils of Presidentialism.” Journal of Democracy 1(1):51–69.
Lipset, Seymor Martin and Jason M. Lakin. 2004. The Democratic Century. Oklahoma: The
University of Oklahoma Press.
Lipset, Seymour Martin. 1959. “Some Social Requisites of Democracy: Economic Development and
Political Legitimacy.” American Political Science Review 53(1):69–105.
Milner, Helen and Keibo Kubota. 2005. “Why the Move to Free Trade? Democracy and Trade
Policy in the Developing Countries.” International Organization 59:107.
Miquel, Gerard Padrı¿12 . 2007. “The Control of Politicians in Divided Societies: The Politics of
Fear.” Review of Economic Studies 74:1253–1274.
Moore Jr, Barrington. 1966. Social Origins of Democracy and Dictatorship: Lord and Peasant in
the Making of the Modern World. Boston: Beacon Press.
Moral-Benito, Enrique and Cristian Bartolucci. 2011. “Income and Democracy: Revisiting the
Evidence.” Working Paper .
Muller, Edward N. 1988. “Democracy, Economic Development, and Income Inequality.” American
Sociological Review 53(1):50–68.
Munck, Gerardo L. and Jay Verkuilen. 2002. “Conceptualizing and Measuring Democracy: Evalu-
ating Alternative Indices.” Comparative Political Studies 35(1):5–34.
North, Douglass C. 1990. Institutions, Institutional Change and Economic Performance. Cam-
bridge: Cambridge University Press.
North, Douglass C., John Joseph Wallis and Barry R. Weingast. 2009. Violence and Social Orders:
A Conceptual Framework for Interpreting Recorded Human History. Cambridge: Cambridge
University Press.
30
O’Donnell, Guillermo. 1973. Modernization and Bureaucratic-Authorianism: Studies in South
American Politics. Politics of Modernization Theories Berkeley, CA: Institute of International
Studies, University of California.
Oneal, John R. and Bruce Russett. 2005. “Rule of Three, Let It Be? When More Really Is Better.”
Conflict Management and Peace Science 22:293–310.
Ponticelli, Jacopo and Hans-Joachim Voth. 2011. “Austerity and Anarchy: Budget Cuts and Social
Unrest in Europe, 1919-2009.” Working Paper .
Przeworski, Adam and Fernando Limongi. 1997. “Modernization: Theory and Facts.” World Pol-
itics 49(2):155–183. file://R:
Przeworski, Adam, Michael E. Alvarez, Jose Antonio Cheibub and Fernando Limongi. 2000. Democ-
racy and Development. Political Institutions and Well-Being in the World, 1950–1990. Cam-
bridge: Cambridge University Press.
Robinson, James. 2006. “Economic Development and Democracy.” Annual Review of Political
Science (9):503–527.
Ross, Michael. 2001. “Extractive Sectors and the Poor.” An Oxfam America Report. Boston, MA:
Oxfam America.
Rueschemeyer, Dietrich, Evelyne Huber Stephens and John D. Stephens. 1992. Capitalist Devel-
opment and Democracy. Chicago, IL: University of Chicago Press.
Sala-i Martin, Xavier X. 1997. “I just ran two million regressions.” American Economic Review
87:178–183.
Sen, Amartya. 1999. Development as Freedom. New York: Anchor Books.
Starr, Harvey. 1991. “Democratic Dominoes: Diffusion Approaches to the Spread of Democracy in
the International System.” Journal of Conflict Resolution 35(2):356–81.
Vanhanen, Tatu. 1999. “Domestic Ethnic Conflict and Ethnic Nepotism.” Journal of Peace Research
36(1):55–79.
31