Embed Size (px)
Citation preview
The Determinants of Corporate Board Size and Composition:
An Empirical Analysis
Audra L. Boone
Laura Casares Field
Jonathan M. Karpoff
Charu G. Raheja
This draft: August 20, 2004
Version 2-15-1
We thank participants at the University of Arkansas, University of Houston, and the 2004 Batten Young Scholars Conference at the College of William & Mary for their valuable comments. Contact information: [email protected]; [email protected]; [email protected]; [email protected].
The Determinants of Corporate Board Size and Composition:
An Empirical Analysis
Abstract
Several theories have been proposed to explain how corporate boards are
structured. This paper groups these theories into four hypotheses and tests them
empirically. We utilize a unique panel dataset that tracks corporate board development
from the time of a firm's IPO through 10 years later. The data support three distinct but
mutually compatible hypotheses of board development: (i) board size and independence
increase as firms grow in size and diversify over time; (ii) board independence is
negatively related to the manager's influence and positively related to constraints on such
influence; and (iii) board size reflects a trade-off between the firm-specific benefits of
monitoring and the costs of such monitoring. The data do not support the view that
boards are structured inefficiently or to facilitate managers' consumption of value-
decreasing private benefits. These results indicate that board structure does not result
from a mechanical process that can easily be improved by uniform rules on board size
and composition, but rather, reflects a dynamic process involving the particular and
changing nature of the firm’s competitive environment and managerial team.

3
The Determinants of Corporate Board Size and Composition:
An Empirical Analysis
1. Introduction
Corporate boards are the focus of many attempts to improve corporate governance.
Shareholder advocates such as Institutional Shareholders Services, Inc. and the Council of
Institutional Investors have called for smaller boards with greater outside representation among
U.S. corporations, sentiments that are echoed by the National Association of Corporate Directors
and The Business Roundtable.1 Institutional investors such as TIAA-CREF have issued specific
recommendations for how boards should be structured and run. Some of these recommendations
were codified into law via the Sarbanes-Oxley Act of 2002. This Act establishes rules for
several board functions, for example, a requirement that boards have audit committees that
consist only of independent outside directors. This movement toward specific board guidelines,
typically calling for greater outside representation, is also a characteristic of the Codes of Best
Practice issued in many countries (see Denis and McConnell 2003).
Yet despite the importance of corporate boards and the widespread call for their reform,
financial economists have reached few firm conclusions about the forces that drive board size
and composition. This paper examines these forces empirically. To structure our tests, we group
existing theories about corporate boards into four testable hypotheses. These hypotheses are
summarized in Table 1. The first hypothesis, which reflects the views of Fama and Jensen
(1983), Coles et al. (2004), and Lehn et al. (2003), implies that board structure is driven by the
scope and complexity of the firm's operations. We call this the scope of operations hypothesis.
The second hypothesis, reflecting the work by Hermalin and Weisbach (1998) and Baker and
1 See The Business Roundtable (1997), National Association of Corporate Directors, 2001, and Institutional Shareholders Services, Inc. (2003).
4
Gompers (2003), implies that board composition results from a negotiation between the firm's
CEO and its outside board members. We call this the negotiation hypothesis. The third
hypothesis is that board size and composition are determined by the specific business and
information environment in which the firm operates. We call this view – which borrows from
ideas expressed by Demsetz and Lehn (1985) and Gillan et al. (2003), and is modeled by Raheja
(2004) – the monitoring hypothesis. The fourth hypothesis – the inefficient board hypothesis – is
that corporate boards are structured either haphazardly or perversely to yield inefficiently large
private benefits to managers. This is the view that underlies attempts to impose external rules to
regulate the board's size and composition.
As illustrated in Table 1 and developed further in section 2, each of these hypotheses
yields testable predictions about the forces that shape board size, composition, or both. We test
these predictions using hand-collected data from a panel of 1,019 firms that went public between
1988 and 1992, which we track for periods of up to ten years. Our tests exploit the panel nature
of the data, and control for the endogeneity of board size and composition.
Our dataset offers several advantages over previous empirical investigations into
corporate boards. First, by focusing on young companies, the data address a concern voiced by
Hermalin and Weisbach (2003) that most research on corporate boards has been limited to large,
established companies. Second, the 10-year period of the data allows us to measure the
evolution of corporate boards as firms mature. And third, the time surrounding the initial pub lic
offering offers a particularly rich setting for studying board issues. This is because, as Baker and
Gompers (2003) argue, the IPO typically is a time of significant change in the firm's governance.
Also, as Gertner and Kaplan (1996) point out, firms undertaking a public offering are likely to
choose value-maximizing governance features because the selling insiders directly bear the
financial effects of such features.

5
The results provide support for the first three hypotheses. In particular:
(i) Measures of the scope and complexity of the firm's operations – including firm size,
firm age, and the number of the firm's business segments – are positively related to both board
size and the fraction of independent outsiders on the board. This indicates that boards grow in
response to the increasing net benefits of monitoring and specialization by board members that
accompany a firm's growth.
(ii) The fraction of independent outsiders is negatively related to measures of the CEO's
influence – including the CEO's share ownership and job tenure – and positively related to
constraints on such influence, including the ownership of outside directors, the presence of a
venture capitalist, and the reputation of the firm's investment bank at the time of its IPO. This
supports Hermalin and Weisbach's (1998) theory that corporate boards reflect the outcome of a
negotiation between the CEO and outside board members. Furthermore, the evidence indicates a
significant degree in persistence in the bargaining outcome, as the CEO's bargaining power at the
time of the IPO helps explain board composition even several years after the IPO.
(iii) Board size is positively related to measures of the private benefits available to
insiders – including the industry concentration and the presence of takeover defenses – and
negatively related to measures of the cost of monitoring insiders such as the market-to-book
ratio, the R&D expenditure in the firm, and the return variance. This is consistent with
arguments forwarded by Gillan et al. (2003) and Raheja (2004) that board size reflects a trade-off
between the firm-specific benefits of increased monitoring and the costs of such monitoring.
In contrast, the results do not support the inefficient board hypothesis. These results
indicate that it is useful to view the evolution of corporate boards as endogenously molded by the
firm's unique business and managerial characteristics. That is, board size and composition vary
across firms, and change over time, to accommodate the specific growth, managerial, and

6
monitoring characteristics of the firm. This implies that any single reform imposed through
political means, such as the addition of independent outsiders, is unlikely to be a value-
increasing policy for all firms, or even very many firms.
The rest of this paper is organized as follows. In section 2 we discuss related research on
corporate boards and develop the four hypotheses that coalesce the views of prior researchers.
Section 3 describes the characteristics of corporate boards at the time of the IPO for our sample
of 1,019 firms going public from 1988-1992, and describes the evolution of these firms' boards
and ownership structures over the next ten years. In section 4 we report the tests of our four
main hypotheses. Section 5 reports the results of several sensitivity tests, and section 6 examines
the economic importance of the effects we measure. Section 7 concludes.
2. Hypotheses of the determinants of corporate boards
2.A. The scope of operations hypothesis
Fama and Jensen (1983) propose that the way a firm is organized depends on the scope
and complexity of its production process: larger or more complex processes lead to larger and
more hierarchical firms. The firm's board, in turn, has the job of ratifying and monitoring senior
managers' decisions. It follows that the information requirements of more complex operations
tend to require larger boards.
This view, which we call the scope of operations hypothesis, is consistent with arguments
made by Lehn et al. (2003) and Coles et al. (2004). It implies that a firm growing into new
product lines or new geographical territory will seek new board members to help oversee
managers' performance. As a firm grows, or simply survives as a public entity, its demands for
specialized board services also are likely to grow. As Bhagat and Black (1999) and Agrawal and
Knoeber (2001) argue, new directors may have specialized knowledge that applies to the new

7
growth areas. Boards of larger or more diverse firms also may increase their demands for new
board members as such tasks as succession planning, compensation, and auditing are assigned to
committees rather than handled by the board as a whole. The scope of operations hypothesis is
also consistent with results reported by Denis and Sarin (1999) and Yermack (1996), which
suggest that board size is positively related to firm size.
In addition to affecting board size, the scope and complexity of a firm's operations can
affect the board's composition. Lehn et al. (2003) and Clutchley et al. (2004) both argue that
larger firms demand more outside directors because their large size gives rise to more significant
agency problems. Coles et al. (2004) argue that diversified firms deploy more independent
directors to monitor their wider scope of operations.
Thus, as shown in Table 1, the views that we summarize as the scope of operations
hypothesis predict that board size and the fraction of independent outsiders on the board are both
positively related to the scope and complexity of the firm's operations. In our empirical tests, we
use three measures of the firm's scope and complexity: firm size, firm age, and the firm's number
of business segments. The scope of operations hypothesis implies that all three measures will be
positively related to board size and the fraction of independent outsiders.
2.b. The negotiation hypothesis
Hermalin and Weisbach (1998) propose a model in which board structure is the outcome
of a negotiation between the CEO and outside directors. In this model, CEOs that generate
surpluses for their firms – that is, for whom good substitutes are unavailable – wield influence
with their outside directors. CEOs use their influence to capture some of these surpluses by
placing insiders and affiliated outsiders in open board positions. We refer to this argument as the

8
negotiation hypothesis. Notice that the hypothesis does not imply that the resulting board is
inefficient. Rather, board composition is simply one component of the CEO's compensation.
Kieschnick and Moussawi (2004) introduce a variation of the negotiation hypothesis, and
argue that board independence shrinks with managers' influence and grows with institutional
investor influence. Stated more generally, the negotiation hypothesis implies that the fraction of
outsiders on the board will be negatively related to the CEO's influence and positively related to
constraints on the CEO's influence. As shown in Table 1, we use two measures of the CEO's
influence in our empirical tests: the CEO's stock ownership and the CEO's job tenure. Measures
of constraints on this influence include outsider directors' stock ownership, a dummy variable
that represents the presence of a venture capital investor at the time of the IPO, and the Carter-
Manaster (1990) ranking of the reputation of the firm's investment banker at the time of its IPO.
In our tests, we examine whether the CEO's influence affects the board's composition both at the
IPO and afterwards.
2.c. The monitoring hypothesis
A third view is that boards develop in response to the specific monitoring requirements of
the firm's business activity. We call this the monitoring hypothesis. Partial versions of the
monitoring hypothesis are expressed in several papers on board and ownership structure.
Demsetz and Lehn (1985) propose that the noisiness of a firm's operating environment will affect
monitoring costs, a notion that Gillan et al. (2003) use to argue that boards will monitor less in
noisy environments. Lehn et al. (2003) argue that high growth firms will have relatively smaller
board size and a higher proportion of insiders on the board because the cost of monitoring such
firms is relatively high. Coles et al. (2004) argue that the fraction of independent outsiders will
be negatively related to the firm's R&D expenditures, because outside board members are

9
ineffective in monitoring firms with high growth potential. And Yang, Linck and Netter (2004)
argue that firms facing greater information asymmetry will have smaller and less independent
boards because of the higher costs of monitoring.
These ideas are formalized and expanded in a theoretical model of board structure
developed by Raheja (2004). In this model, the net benefits of external monitoring increase with
managers' opportunities to consume private benefits, but decrease with the cost of monitoring.
Thus, optimal boards will employ large numbers of outside directors, and be larger in overall
size, when managers' private benefits are high and the cost of monitoring is low. That is, both
board size and the fraction of outside directors are positively related to managers' private benefits
and negatively related to the cost of monitoring.
In our tests, we use three measures of managers' potential private benefits: the firm's free
cash flow, a Herfindahl measure of industry concentration, and a variation of Gompers, Iishi, and
Metrick's (2003) G- index of the extent to which managers are insulated from the market for
control by firm and state- level takeover defenses. We reason that managers' opportunities to
extract private benefits increase with all three of these measures, increasing the net benefits of
increased board monitoring.
To measure the cost of monitoring, we use the firm's market-to-book ratio, its R&D
intensity, and the variance of the firm's daily stock return. We presume that the cost of
monitoring increases with all three measures, implying that board size and the fraction of
independent outsiders should be negatively related to all three. Our rationale is that growth
opportunities are relatively costly for outsiders to monitor. Firms whose values reflect high
growth opportunities, or which have high research and development expenses, tend to have
significant growth opportunities. Similarly, the cost of monitoring managers is likely to increase
with the volatility of the firm's stock price, because volatility reflects background uncertainty

10
about the firm's prospects and performance, and increases the difficulty of judging managers'
performance. Similar measures of monitoring costs have been used by Klein (1998), Coles et al.
(2004), and Lehn et al (2003).
2.d. The inefficient board hypothesis
The previous hypotheses regard board size and composition as adjusting to facilitate firm
success by decreasing the net costs of the agency relationship between directors and managers.
Implicit in these arguments is Alchian's (1950) notion that firm characteristics that do not
facilitate success tend to be weeded out in the competitive process. An alternate view is that
competitive pressures are insufficient to encourage such efficient adaptation in board structures.
According to this view, board structure cannot be viewed as generally increasing firm value.
Instead, boards may be structured inefficiently unless regulations force them to a more efficient
size and composition.
We call this the inefficient board hypothesis. This is the view that underlies attempts to
impose changes in board structure through regulation. It is reflected in the NYSE and
NASDAQ's 2003 governance rules, which require listed companies to have a majority of
independent directors (see www.nyse.com/pdfs/finalcorpgovrules.pdf and
http://www.nasdaq.com/about/RecentRuleChanges.stm). The hypothesis is also reflected in the
board requirements of the 2002 Sarbanes-Oxley Act, and in such defenses of this act as voiced
by Paul Volcker and Arthur Levitt Jr. (Volcker and Levitt, 2004). (Chaochharia and Grinstein
(2004) investigate changes in board characteristics as a result of the new regulations).
If boards are structured inefficiently, they may be structured either haphazardly or
perversely. If haphazard, then none of the other three hypotheses will be able to explain the
cross-section or time-series variation in board size and composition. To the extent that the data

11
are consistent with the scope of operations, negotiation, or monitoring hypotheses, we can infer
that boards are not structured haphazardly. If boards are perversely inefficient, they will be
structured not to increase firm value, but to facilitate managers' extraction of private benefits at
shareholders' expense. This implies that board monitoring will be low when the possibility of
private benefits is high – precisely the opposite prediction as that of the monitoring hypothesis.
As summarized in Table 1, this version of the inefficient board hypothesis implies that measures
of managers' opportunities to consume private benefits will be negatively related to board size
and independence.
3. Description of the data
Our sample is based on all industrial firms that went public in U.S. markets from 1988
through 1992. To be included in the sample, the IPO must involve common stock offered at a
minimum price of $1.00 per share and issued through a firm commitment underwriting
agreement. In addition, the firm must be incorporated in the United States at the offer date and
be identified on the CRSP daily tape as having been listed within three months of the offer date.
These criteria yield a sample of 1,019 IPOs, which explicitly excludes IPOs by financial
institutions, real estate investment trusts, and closed-end mutual funds. We then collect board
and ownership data on all sample firms at the IPO and at one year, four years, seven years, and
ten years after the IPO. Data at the IPO come from the offering prospectuses, and data for
subsequent years come from proxy statements. These data allow us to track the evolution in
board structure and ownership over time.
Panel A of Table 2 reports on the sample size from the time of the IPO until 10 years
later. Many of the 1,019 IPO firms from the 1988-1992 period were delisted over time, such that
only 422 remain as independent publicly-traded firms 10 years after their IPOs. The annual

12
number of firms going public increased during the 1988-1992 period, although the percentage of
firms that were delisted is roughly equal across each year's cohort of IPO firms.
The reasons for the delistings are summarized in Panel B of Table 2. Very few – only 0.6
percent – are delisted within one year of the IPO. Greater proportions are delisted by year 4
relative to the IPO year. But the majority of delistings (67 percent) occur after year 4. Most of
the delisted firms (64 percent) were acquired by other firms. An additional 36 percent were
delisted because they no longer met listing requirements. Only two firms are classified by CRSP
as liquidated.
In the tables that follow we use data from all surviving firms in any given year relative to
the IPO. We also re-calculated our tests using data only from the 422 firms that survived
through year 10. The results of such tests are virtually identical to those reported below in the
tables. Thus, the changes over time that we report below do not reflect a change in the
composition of the sample, but rather, the general trends in ownership and board structure as
firms mature from the IPO stage.
3.a. Board characteristics and ownership at the time of the IPO
Table 3 reports on the board and ownership characteristics of the 1,019 firms at the times
of their IPOs. Panel A indicates that the IPO firms are small, averaging $150.22 million in
equity value. As a basis of comparison, the mean equity value in Denis and Sarin's (1999)
sample of seasoned firms is $434.61 million. Compared to Denis and Sarin's sample, the IPO
firms also have a lower mean debt-to-total assets ratio (35 percent vs. 56 percent) and a higher
expenditure on research and development compared to total assets (11 percent vs. 1.58 percent).
These averages are consistent with the stereotype of many firms at the IPO stage: they are

13
relatively small, financed significantly by equity capital, and actively engaged in research and
development activities.
Panel B of Table 3 reports on characteristics of these firms' ownership and board
structures immediately after the IPO. We follow the convention in the literature of labeling
directors as insiders if they are cur rently employees of the firm, as affiliated outsiders if they
have substantial business relations with the firm, are related to insiders or are former employees,
and as independent outsiders if they are neither insiders nor affiliated outsiders. CEOs owned a
mean of 16 percent of their firms' stock, and all officers and directors owned 52 percent of the
stock, on average. The corresponding averages from Denis and Sarin's sample are 7 percent and
16 percent, respectively. The mean number of directors for the IPO firms is 6.2. Of these,
38 percent are insiders, 5.3 percent are affiliated outsiders, and 56.5 percent are independent
outsiders. The corresponding averages from Denis and Sarin’s sample are 9.35 directors, of
which 39 percent are insiders, 20 percent are affiliated outsiders, and 40 percent are independent
outsiders. (Consistent with these findings, Gillan, Hartzell and Starks (2003) report that the
mean percentage of independent outsiders in their sample of large firms from 1997-2000 is
59 percent. The mean board size in their sample is 9.44 persons.)
Thus, CEO and insider stock ownership tends to be much greater for firms at the time of
the IPO than for seasoned corporations. IPO firms also have much smaller boards, on average,
than seasoned firms. The fraction of insiders is roughly equal across the two samples, but firms
at the time of their IPOs have a significantly greater percentage of independent outsiders.
Given that firms at the IPO stage have great incentive to maximize firm value, these
results indicate that small boards with a majority of independent outside directors tend to be
optimal for these firms. This holds despite the fact that inside ownership in these firms is
relatively high. Thus, even though agency problems in the IPO firms may be relatively small

14
because managers own large amounts of stock, these firms rely heavily upon independent outside
directors.
3.b. Changes in board characteristics and ownership over time
Panel A of Table 4 reports on the evolution of ownership for the IPO firms. Ownership
by officers and directors declines steadily over the period, declining by half in the first 10 years
after going public, from 52 percent at the IPO to 25 percent ten years later. Average CEO
ownership is 16 percent immediately after the IPO and drops steadily over time, to an average of
seven percent ten years later (which is similar to the seven percent found by Denis and Sarin for
seasoned firms). Ownership by officers follows a similar decline, from 26 percent after the IPO
to 14 percent at year 10 (the comparable number from Denis and Sarin is 16 percent).
Ownership by outside directors also declines steadily over the period, from 26 percent to
11 percent. Interestingly, ownership by five percent blockholders remains fairly steady over
time at about 30 percent, as does the number of blockholders (an average of roughly three
blockholders per firm). These patterns can be seen graphically in Figure 1.
Panel B of Table 4 reports on characteristics of the CEOs using data on all surviving
firms at each year of the analysis. The average CEO is 48 years old at the IPO, with eight years
of tenure with the firm. For 43 percent of firms conducting IPOs, the CEO is also the founder.
By year 10 only 21 percent of the CEOs are firm founders. The fraction of CEOs who also serve
as Chairman of the Board is fairly constant over time, ranging from 60 percent to 64 percent of
firms. CEO turnover ranges from six percent in the first public year to almost 10 percent per
year in later years (30 percent of all firms experienced CEO turnover between year 1 and year 4,
with 25% between year 4 and year 7, and 30% between year 7 and year 10, for an average of
almost 10 percent of firms experiencing CEO turnover per year over these periods).

15
Panel C of Table 4 reports on the board structure for firms at the IPO and afterwards,
while Figure 2 shows this evolution graphically. The average number of directors increases
steadily after the IPO, starting at 6.21 in the year of the IPO and ris ing to 7.52 by year 10. Even
after 10 years, however, the mean number of directors remains smaller than the mean of 9.35
reported by Denis and Sarin or the 9.44 reported by Gillan, Hartzell and Starks (2003), both
using samples of generally more seasoned firms. This suggests that corporate boards continue to
grow as a firm ages beyond 10 years.
The increase in board size reflects primarily the addition of independent outside board
members, the fraction of which grows steadily until it reaches 69 percent by year 10. The
fraction of affiliated outsiders, stays roughly constant over time, while the fraction of insiders
decreases steadily, to reach 26 percent by year 10. Thus, the proportion of outside representation
on these firms' boards increases as they age. The table also provides data on the fraction of
original board members remaining with the firm. In the first year, 90 percent of the original
board members remain with the firm. This figure declines to 67 percent by year 4, 51 percent by
year 7, and 42 percent by year 10. These patterns can be seen graphically in Figure 2.
To summarize, several patterns emerge about the evolution of leadership structure in the
10 years following a firm's IPO. Ownership by officers and directors falls, presumably as share
ownership becomes more widely diffused. The number of directors increases, although not to as
high a level as observed in older, seasoned firms. Firms at the IPO stage have a higher fraction
of independent outsiders on their boards than do the typical seasoned corporation, and this
fraction increases over time.

16
4. Empirical tests of the determinants of board structure
4.1. Empirical methods
Our data comprise a panel over the years 1, 4, 7, and 10 relative to the IPO. To test the
four hypotheses of board structure, we estimate multivariate regressions using panel data
methods. The tests reported in the tables are robust regressions with clusters, in which
observations are clustered by firm and the covariance matrix is estimated using the Huber (1964)
or White (1980) estimator. This allows us to exploit information in both the cross-section and
time-series nature of the data, while still controlling for the serial correlation that is observed for
each firm's time series of observations. The results of a number of sensitivity tests are reported
in section 5. For example, random effects GLS models yield results that are qualitatively
identical to those reported here.
We deploy two strategies to control for the fact that board size and composition are
endogenous to the firm's competitive environment. First, we include industry fixed effects in all
regression models. Industry controls make sense if the underlying forces that simultaneously
drive board size and composition are similar for all firms in the same industry. We assume this
is the case, because firms in the same industry face similar production technologies and market
conditions – the very things that give rise to the endogeneity problem in the first place. By
controlling for industry fixed effects, our tests measure how deviations from the industry mean in
a firm's board characteristics are related to deviations in the regressors from their industry means.
That is, industry fixed effects control for the source of the endogenous nature of the firm's board
and other characteristics. In the tests reported here, we use Fama-French (1997) industry
groupings, although the results are not substantially affected when we use alternative industry
definitions (e.g., as examined by Kahle and Walkling (1996)), or when we omit the industry
controls altogether.

17
Our second strategy to control for the endogeneity problem is to introduce instrumental
variables for board size and the fraction of independent outsiders. In the tests reported here, our
instrumental variables are these variables' lagged values. For example, for firm j's observation at
year 10 relative to the IPO, the instrumental variable for board size is firm j's board size at year 7
(because we have data for years 0, 1, 4, 7, and 10). In the tests reported below, we include
instrumental variables for board size in our tests for board independence, and for board
independence in our tests for board size. It turns out, however, that including these instruments,
or additional instruments for other variables that plausibly could be endogenous, does not affect
the results substantially.2
4.b. The scope of operations hypothesis
As summarized in Table 1, we use firm size, firm age, and diversification as measures of
the scope and complexity of the firm's operations. The scope of operations hypothesis predicts
that board size and the fraction of independent directors are positively related to all three
measures. Firm size is measured as the natural log of the market value of equity calculated at the
end of the firm's fiscal year. Age is calculated as the number of years since the firm's IPO.3 The
number of business segments reported by the firm, as carried by Compustat, is used to measure
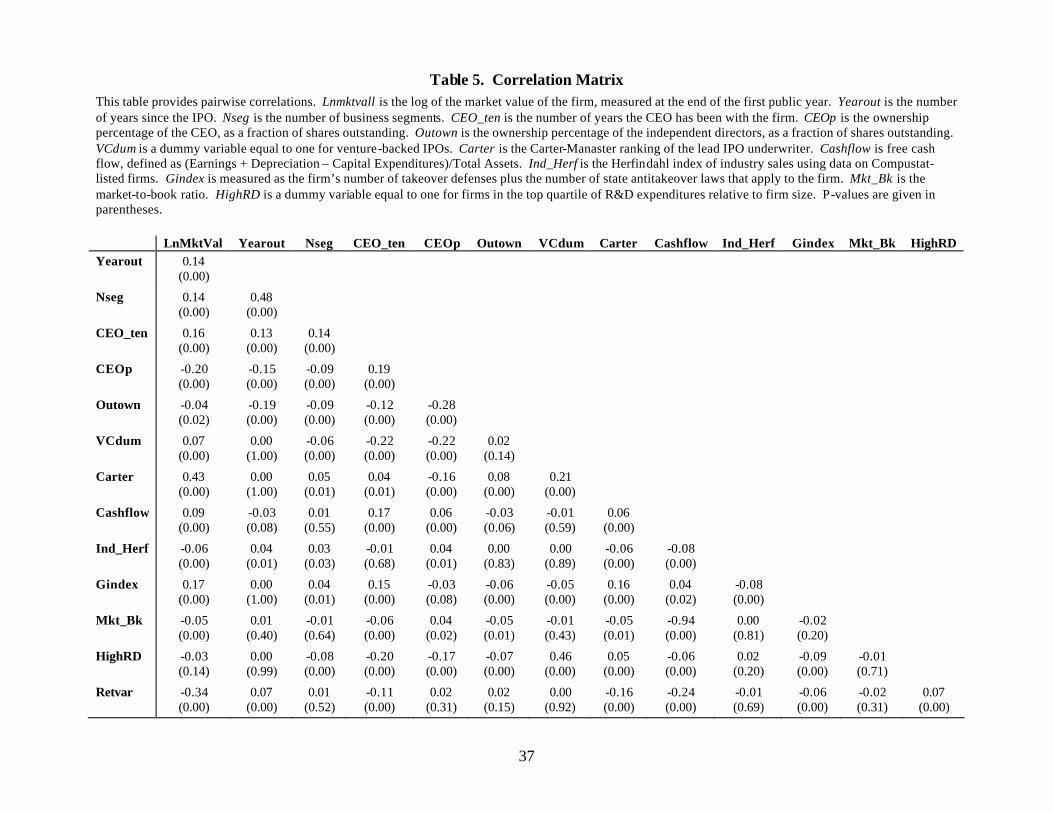
diversification. As reported in Table 5, all three measures of firm scope and complexity are
2 Other commo n procedures to control for endogeneity include orthogonalizing the endogenous variables, as in Denis and Sarin (1999), and specifying a structural model of simultaneous equations, as in Agrawal and Knoeber (1996). We are convinced, however, that the orthogonalizing approach does not address the endogeneity issue. If anything, the orthogonal component of the endogenous variable that is used in such tests is likely to be the component that is driven by the underlying competitive environment. Simultaneous equation methods, while conceptually rigorous, tend to yield results that are highly sensitive to the specified model and the identifying assumptions (see Bhagat and Jefferis, 2002). 3 Many firms in the sample have long operating histories before they issued stock to the public. When age is calculated as the current year minus the year of incorporation ("total firm age"), the empirical results are similar to those reported in Table 6. When both total firm age and the years since the IPO are included together, the coef-ficient for the years since the IPO remains positive and statistically significant, while that for total firm age does not.

18
positively correlated. The pairwise correlation between firm size and the number of years since
the IPO is 0.14, as is the correlation between firm size and the number of business segments.
The correlation between the number of segments and the years since the IPO is 0.48. All are
significant at the 1% level.
As additional controls, we include dummy variables for firms that went public in reverse
leveraged buyouts and as equity carveouts, and firms with dual-class shares. The results are not
significantly affected, however, when reverse LBOs, equity carveouts, and dual-class share firms
are excluded from the sample.
The results of the regressions testing the scope of operations hypothesis are reported in
Table 6. In Panel A, the number of directors on the board is the dependent variable, and the
lagged value of the fraction of independent outsiders is included as an instrumental variable to
control for endogeneity. In Models 1-3, each of the measures of firm scope is entered separately,
and all three are positively and significantly related to board size. This provides strong support
for the scope of operations hypothesis.
In Model 4, all three measures are included together. As noted, the three variables are
positively correlated, so including all in the same model introduces multicollinearity.
Nonetheless, all three measures in Model 4 are positively related to board size, and firm size and
the number of business segments both remain statistically significant at the 1% level. We
interpret these results as indicating that board size is indeed shaped by the scope and complexity
of the firm's operations.
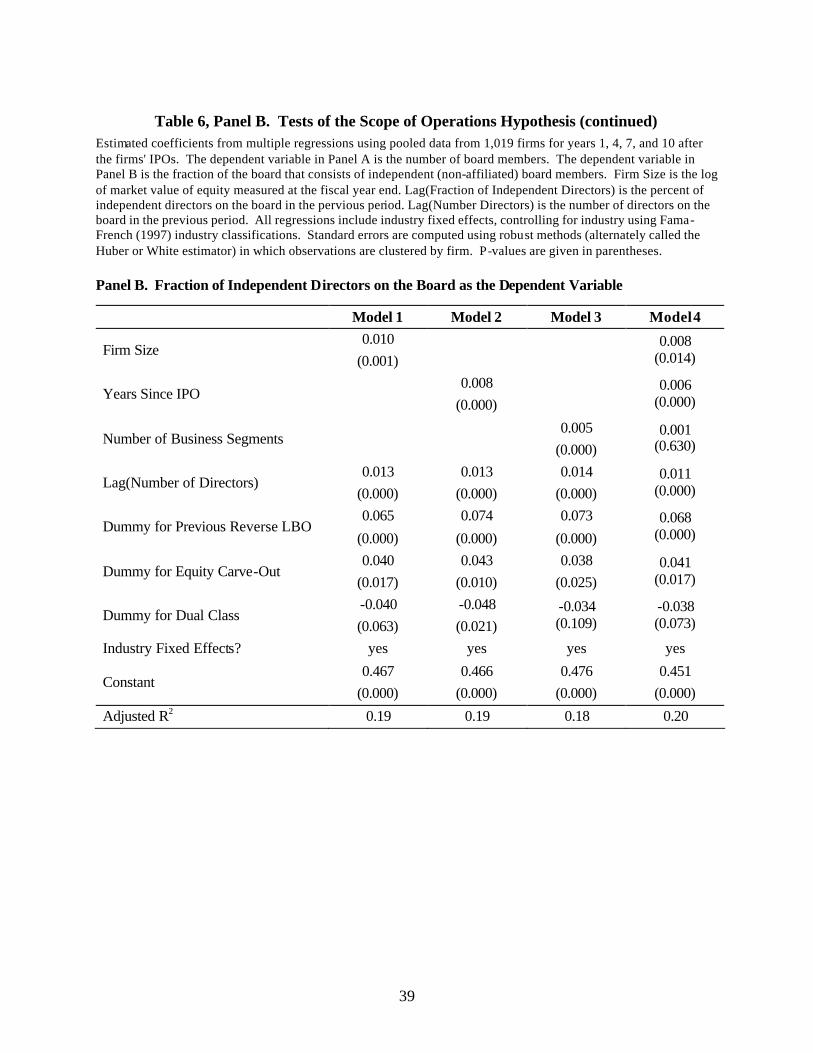
Panel B of Table 6 reports results when the fraction of independent outsiders is the
dependent variable. As reported in Models 1-3, the coefficients for all three measures of scope
and complexity are positive and significant at the 1% level when each is entered separately.
When all are entered together, as in Model 4, the coefficients all are positive, and those for firm

19
size and age remain statistically significant. Overall, these results support the scope of
operations hypothesis, which holds that corporate boards increase in size and independence as
firm operations grow, mature, and become more complex.
4.c. The negotiation hypothesis
As summarized in Table 1, we use two sets of variables to test the view that the
composition of the board reflects a negotiation between the CEO and outside board members.
CEO share ownership and CEO job tenure measure the CEO's influence in the negotiation. CEO
ownership is measured as the fraction of the firm's currently outstanding shares owned by the
CEO. CEO tenure is the number of years in which the CEO has held his or her position with the
firm. Outside director ownership, venture capital investment, and investment bank reputation
measure the constraints on the CEO's influence. Outside director ownership is the fraction of
outstanding shares owned by independent outside directors. The venture capital dummy variable
is set to one if a venture capital investor owned an equity stake at the IPO, and the investment
bank reputation is measured by the bank's Carter-Manaster rank at the time of the firm's IPO.
The negotiation hypothesis predicts that board independence is negatively related to CEO
ownership and job tenure, and positively related to outside director ownership, venture capital
investment, and investment bank reputation.
The results are reported in Table 7. In Models 1–5, each of the five measures is included
separately, and all five are significantly related to board independence in the predicted direction.
In Model 6, all five measures are included together. Once again, this introduces multi-
collinearity. As reported in Table 5, CEO tenure and CEO ownership are positively correlated.
Likewise, outside ownership, the presence of a venture capitalist, and the Carter-Manaster rank
are positively correlated (and each is negatively correlated with CEO tenure and CEO

20
ownership.) Despite the resulting multicollinearity, all five remain significantly related to board
independence. Model 7 includes also the regressors used to test the scope of operations
hypothesis. Once again, all five measures used to test the negotiation hypothesis have the
predicted signs, and all but the Carter-Manaster rank are statistically significant. Overall, these
results provide strong support for the negotiation hypothesis.
In Model 7, the variables used to test the scope of operations hypothesis remain similar in
sign to the results reported in Table 6, Panel B, although only the number of years since the IPO
is statistically significant. Collinearity appears to be a problem here, as firm size, the years since
the IPO, and the number of business segments each is positive and statistically significant at the
5% level when entered separately with the five variables at the top of the table. Overall, we
interpret the data as providing support for both the scope of operations and negotiation
hypotheses.
Note that two of our measures – the venture capital dummy and the Carter-Manaster rank
– are measured at the time of the IPO. Baker and Gompers (2003) argue that the IPO is a
particularly ripe time to investigate the negotiation hypothesis. This is because many firms’
boards undergo significant changes around the IPO, and any negotiating influence that a CEO
has will come into play at such times. Our results indicate that such measures of influence at the
time of the IPO are useful in explaining board composition even in the years after the IPO. In
tests not shown here, we test the negotiations hypothesis separately for each year in our sample.
In these tests, we find that CEO ownership and tenure, as well as ownership by outside directors,
all measured at the IPO, are significant in explaining board independence (as are the Carter-
Manaster ranking and venture-capital dummy) even 10 years later! However, the coefficients
drop in magnitude and significance as the firm ages beyond its IPO (although all remain
significant at the 10% level or better, even 10 years out). This implies that a CEO's influence at

21
the time of the IPO affects the board's composition in future years, but that such influence at the
time of the IPO declines over time.
4.d. The monitoring hypothesis
As summarized in Table 1, we use six different variables to test the monitoring
hypothesis. The monitoring hypothesis implies that board size and independence are positively
related to managers' opportunities for private benefits. To measure private benefits, we use:
(i) free cash flow, measured as the firm's earnings plus depreciation minus capital
expenditures, all divided by assets. As argued by Jensen (1986), free cash flow generates agency
conflicts, as managers have incentives to use it for private benefits rather than to create
shareholder wealth;
(ii) industry concentration, measured as the Herfindahl index of industry sales using data
on Compustat- listed firms. We conjecture that managers at firms with market power are subject
to less market discipline, and are better able to extract private benefits than managers of firms in
highly competitive industries (e.g., see Gillan, Hartzell, and Starks (2003));
(iii) takeover defenses, measured using a variation of Gompers, Ishii, and Metrick's
(2003) G-Index. In our variation, we compute G as the firm's number of takeover defenses plus
the number of state antitakeover laws that apply to the firm. The takeover defenses and state
antitakeover laws are those defined and tracked by Field and Karpoff (2002). Larger levels of
the G-Index indicate a greater amount of insulation from the external market for control and a
greater opportunity for managers to extract private benefits.4
4 Reverse causality is a potential issue here, as managers with large private benefits may encourage the firm's directors to adopt many takeover defenses. For our purposes, however, any reverse causality is not a problem, since we simply seek a variable that is correlated with, and hence provides a measure of, managers' potential to extract private benefits.

22
The monitoring hypothesis also predicts that board size and independence are negatively
related to the cost to outsiders of monitoring the firm's managers. To measure such costs, we
use:
(i) the market-to-book ratio, defined as the book value of debt plus the market value of
equity, divided by the book value of assets;
(ii) a dummy variable that is set equal to one for firms whose R&D expenditures divided
by assets ranks in the upper quartile of our firms; and
(iii) the stock return variance, measured as the variance of the daily logarithmic stock
return measured over the preceding fiscal year.
The rationale for all three measures is similar. Firms with market-to-book ratios or high
research and development expenses tend to have significant growth opportunities, the
management of which are more costly for outsiders to monitor and verify than are assets in
place. Similarly, the cost of monitoring managers is likely to increase with the volatility of the
firm's stock price, because volatility reflects background uncertainty about the firm's prospects
and performance, and increases the difficulty of judging managers' performance. (Similar
arguments and measurements are made by Yermack (1995), Smith and Watts (1992), Bizjak,
Brickley, and Coles (1993), Gaver and Gaver (1993), Kole (1997), Lehn, Patro and Zhao (2003)
and Coles, Daniel and Naveen (2004).)
The correlation coefficients reported in Table 5 indicates that our proxies for private
benefits and monitoring costs are noisy. Free cash flow, for example, is positively correlated
with the takeover defense G-index, but it is negatively correlated with the industry concentration
measure. Likewise, the return variance is positively correlated with the R&D measure, but it is
negatively correlated with the market-to-book ratio. Such results suggest that at least some of
our measures of private benefits and monitoring costs are imperfect.

23
The empirical results for board size are reported in Table 8. In Models 1–6, each of the
six explanatory measures is entered separately. As predicted by the monitoring hypothesis,
board size is positively and significantly related to free cash flow, industry concentration and the
takeover defense G-index, and is negatively related to R&D expenditures and the return
variance. The coefficient for the market-to-book ratio, however, is statistically insignificant.
When all six variables are entered simultaneously, as in Model 7, the coefficients for industry
concentration, the takeover defense G-index, R&D expenditures, and the stock return variance
remain statistically significant at the 5% level or lower.
Despite the potential for multicollinearity problems, we estimated a model that includes
all six variables used to test the monitoring hypothesis, plus the three variables used to test the
scope of operations hypothesis. The results are reported as Model 8. In this specification board
size is positively related to the takeover defense G- index, and is negatively related to the market-
to-book ratio and R&D expenditures. The coefficients for industry concentration and the return
variance are statistically insignificant, while that for free cash flow has the opposite sign as
predicted by the monitoring hypothesis. These results indicate some support for the monitoring
hypothesis, but the sensitivity of some of the individual coefficients to the model specification
indicates that some of these results are not terribly robust. In Model 8, board size is positively
and significantly related to firm size and the number of business segments, results that continue
to lend support to the scope of operations hypothesis.
The tests of the monitoring hypothesis’ predictions for board independence are
summarized in Table 9. For ease of reporting, Table 9 reports results from a single regression in
which all six measures are entered simultaneously. Also included are the variables used to test
the scope of operations and negotiation hypotheses. Board independence is negatively related to
the stock return variance (significant at the 5% level) and positively related to the R&D measure

24
(significant at the 10% level), but the other coefficients are not statistically significant. We
interpret this as weak support, at most, for the monitoring hypothesis' predictions regarding
board independence. The variables that are used to test the scope of operations and negotiation
hypotheses, in general, remain significantly related to the fraction of independent outsiders on
the board.5
4.e. The inefficient board hypothesis
The data clearly reject the view that board structure is unrelated to the firm's
characteristics, since the majority of variables used to test the scope of operations, negotiation,
and monitoring hypotheses are related to board size and independence in the predicted ways.
This indicates that boards are not structured haphazardly, but rather, in response to the firm's
unique operating and monitoring characteristics. The results in Tables 8 and 9 also fail to
support the view that boards are structured to facilitate managers' consumption of value-
decreasing perquisites. One of the coefficients – for free cash flow in Model 8 of Table 8 – has
the sign predicted by the inefficient board hypothesis. But as noted above, this result is not
robust to model specification. Furthermore, the other measures of managers' opportunities to
consume private benefits are, if anything, positively related to board size and board
independence. Thus, the data do not support the inefficient board hypothesis.
5 Using a model similar to the monitoring hypothesis, Raheja (2004) shows that board size is negatively related to CEO ownership and positively related to ownership by outside directors. Our data support this prediction. For example, the coefficients for both CEO ownership and outside director ownership are significant at the 1% level when these variables are added to Model 8 of Table 8.

25
5. Sensitivity tests
We conducted three types of tests to probe the robustness of the results reported in Tables
6-9. The first sensitivity tests explore the importance of our controls for the lack of
independence in the error terms. Our data consist of a cross-section, time series panel. In the
main tests we control for lack of independence among observations from the same firm by
estimating robust regressions with clusters based on firms. An alternative test procedure is to use
a random effects GLS model. This procedure, however, yields results that are qualitatively
identical to those reported in Tables 6-9. We also estimated year-by-year cross-sectional
regressions and calculated Fama-Macbeth (1973) regression coefficients. Having only a short
time series that consists of four years (years 1, 4, 7, and 10 relative to the IPO year), the Fama-
Macbeth coefficients sometimes have higher significance levels than those reported in Tables
5-8, but the point estimates are similar.
Second, we examined whether the results are sensitive to our industry controls for
endogeneity. Using Compustat industry definitions rather than Fama-French industries,
however, does not affect the results. Eliminating industry controls altogether increases the
statistical significance of some coefficients, but does not change our overall inferences.
In the third set of sensitivity tests, we include additional control variables that are used by
previous researchers to examine the empirical determinants of board size and independence. For
example, in some specifications the firm's debt-to-assets ratio is positively related to board size
and board independence at the 10% level. This is similar to the results reported by Denis and
Sarin (1999, Table 4). We also examine model specifications that include sales growth, the
CEO's age, whether or not the CEO is the chairman, and whether or not the CEO is the company
founder. The primary effect from including these additional control variables is that the number
of business segments becomes statistically insignificant in Model 4 of Table 6A, and firm size

26
becomes insignificant in Model 4 of Table 6B. Otherwise, these additional controls do not
substantially affect the size or statistical significance of the primary variables reported in
Tables 5-8.
One type of sensitivity test yields noteworthy results. In some model specifications, the
fraction of shares held by 5% blockholders who also have a representative on the board is
positively related to both board size and board independence. This indicates that, when
blockholders obtain board representation, they do so by increasing board size rather than
displacing other board members.
Overall, the results reported in Tables 5-8 appear not to be artifacts of the model
specifications. The data indicate that board size and independence increase with the scope of the
firm's operations. Consistent with the negotiation hypothesis, board independence also decreases
with the CEO's influence and increases with constraints on such influence. And consistent with
the monitoring hypothesis, board size generally increases with the benefits to monitoring
managers and decreases with the cost of such monitoring.
6. The magnitude of impacts on board size and independence
The data indicate that board size and independence depend on proxies for the firm's scope
of operations, the CEO influence and constraints on such influence, the opportunities for private
benefits, and the cost of monitoring managers. But just how large are these effects?
To investigate this question, we use the coefficients estimated in Tables 6-8 to fit values
for board size and independence when all regressors are set at their mean values. For each
regressor that is significantly related to board size or independence, we then perturb that
regressor by one standard deviation – leaving all other regressors at their mean values – to
calculate the predicted change for the dependent variable.

27
The results are summarized in Table 10. Using fitted values from Model 1 in Table 6A, a
one standard deviation increase in firm size predicts an increase in board size by 0.71 members.
Using coefficients from Model 2 in Table 6A, a one standard deviation increase in the years
since the firm's IPO increases board size by 0.22 people, and (using coefficients from Model 3) a
one standard deviation increase in the number of business segments increases board size by 0.17
people. Thus, among the three measures used to investigate the scope of operations hypothesis,
perturbations in firm size have the largest impact on board size.
Among the measures used to investigate the monitoring hypothesis, perturbations in the
takeover defense G-index, the R&D measure, and the return variance have the largest impact on
the predicted number of board members. A one standard deviation increase in the takeover G-
index predicts an increase in board size by 0.22 people, while a one standard deviation increase
in the R&D measure predicts a decrease in board size by 0.26 people and a one standard
deviation increase in the return variance predicts a decrease in board size by 0.27 people.
The second column in Table 10 reports on the perturbation tests when board
independence is the dependent variable. Among the variables used to investigate the scope of
operations hypothesis, changes in the number of years since the IPO has the largest impact on
board independence, as a one standard deviation increase in this variable predicts a 3.0%
increase in the percentage of independent board members. Even larger impacts are found with
the variables used to investigate the negotiation hypothesis. A one standard deviation increase in
the fraction of CEO ownership decreases the fraction of independent directors by 4.0%, for
example. Venture capital backing has an even larger effect: a one standard deviation increase
venture capital backing predicts an increase in the fraction of independent directors by 5.0%.

28
7. Conclusion
Corporate boards are the subject of much policy concern and a growing number of
research papers. Policy arguments, such as those that influenced the Sarbanes-Oxley Act of
2002, presume that outside policy directives can improve board performance. Many researchers,
in contrast, argue that boards develop in response to certain firm characteristics, and have
proposed a number of firm characteristics that may be important in shaping corporate boards.6
In this paper we test empirically the notion that boards are adapted to the characteristics
of the firms they are designed to oversee. Our innovation is to consider simultaneously a large
number of previous arguments about which firm characteristics affect board size and
independence. We group these arguments into four testable hypotheses, which we then test
using hand-collected and Compustat data from 1,019 firms that went public from 1988-1992 and
which we track for ten years after their IPOs.
The results support the researchers' views and reject the notion that boards are haphazard
or inefficient. In particular, the data indicate support to varying levels for three of the
hypotheses: (i) larger, more seasoned, and more diverse firms tend to have larger and more
independent boards; (ii) firms in which managers have substantial influence, perhaps because
they generate quasi-rents for the firm, and in which the constraints to managerial influence are
weak, have less independent boards; and (iii) firms in which managers' opportunities to consume
private benefits, or in which the cost of monitoring managers is small, have larger boards. These
results indicate that board size and independence are shaped by a broad combination of firm-
specific and managerial characteristics. The results reject the view that boards are structured to
6 E.g., see Fama and Jensen (1983), Demsetz and Lehn (1985), Hermalin and Weisbach (1998), Denis and Sarin (1999), Frye (2003), Lehn et al. (2003), Coles et al. (2003), Gillan et al. (2003), Raheja (2004), and Kieschnick and Moussawi (2004).

29
facilitate managers' consumption of private benefits by lessening oversight when the
opportunities to consume private benefits are large.
Our data also provide descriptive evidence about the development of corporate boards
during the first 10 years after a firm's IPO. We find that firms average three fewer directors at
their IPOs than large, seasoned firms (6.2 versus 9.4). These new firms add an average of 0.13
board members per year during the 10 years after the IPO. This moves their boards closer in size
to those for large seasoned firms, but after 10 years the average board remains relatively small
(7.3 versus 9.4). Boards of these IPO firms have a majority (56.5%) of independent outsiders,
and continue to add independent outsiders such that, 10 years later, 65.3% are independent
outsiders. The increase in the fraction of independent outsiders occurs even as one important
type of outsider – venture capital investors – tends to leave the board.
We conclude that board structure does not result from a mechanical process that easily
can be improved by uniform rules on board size and composition, but rather, reflects a dynamic
process involving the particular, and changing, nature of the firm's competitive environment and
managerial team. The important drivers that shape corporate boards, in turn, can be partitioned
into three categories: the scope of the firm's operations, the top manager's influence, and firm-
specific opportunities for managerial consumption on the job and the costs of monitoring top
managers. Overall, the data indicate that corporate boards adjust to meet the specific
characteristics of the firm's business environment.

30
References
Alchian, A., 1950, “Uncertainty, Evolution and Economic Theory,” Journal of Political Economy 58, 211-221.
Agrawal, A. and C. Knoeber, 1996, “Firm Performance and Mechanisms to Control Agency
Problems between Managers and Shareholders,” Journal of Financial and Quantitative Analysis 31, 377-397.
Baker, M. and P. Gompers, 2003, “The Determinants of Board Structure at the Initial Public
Offering,” Journal of Law and Economics, 46, 569-598. Bhagat, S. and B. Black, 1999, “The Uncertain Relationship Between Board Composition and
Firm Performance,” Business Lawyer 54, 921-963. Bhagat, S. and R. Jefferis, Jr., 2002, The Econometrics of Corporate Governance Studies,
Cambridge, MA: The MIT Press. Bizjak, J., J. Brickley, and J. Coles, 1993, “Stock-based Incentive Compensation and Investment
Behavior,” Journal of Accounting and Economics 16, 349-372. Carter, R. and S. Manaster, 1990, “Initial Public Offerings and Underwriter Reputation,” Journal
of Finance 45, 1045-1068. Chaochharia, V. and Y. Grinstein, 2004, “The Transformation of US Corporate Boards: 1997-
2003,” Cornell University Working Paper. Clutchley, C., J. Garner, and B. Marshall, 2004, “Does One-Size Fit All? A Comparison of
Boards Between Newly Public and Mature Firms,” Drexel University Working Paper. Coles, J., N. Daniel, and L. Naveen, 2004, “Boards: Does One Size Fit All?” Arizona State
University Working Paper. Demsetz, H. and K. Lehn, 1985, “The Structure of Corporate Ownership: Causes and
Consequences,” Journal of Political Economy 93, 1155-1177. Denis, D. and J. McConnell, 2003, “International Corporate Governance,” Journal of Financial
and Quantitative Analysis 38, 1-36. Denis, D. and A. Sarin 1999, “Ownership and Board Structure in Publicly Traded Corporations,”
Journal of Financial Economics 52, 187-223. Fama, E. and K. French, 1997, “The Industry Costs of Equity,” Journal of Financial Economics
43, 153-193. Fama, E. and M. Jensen 1983, “Separation of Ownership and Control,” Journal of Law and
Economics 26, 301-325.

31
Fama, E. and J. MacBeth, 1973, “Risk, Return, and Equilibrium: Empirical Tests,” Journal of
Political Economy 81, 607-636. Field, L. and J. Karpoff, 2002, “Takeover Defenses of IPO Firms,” Journal of Finance 57,
1857-1889. Frye, M., 2003, “The Evolution of Corporate Governance: Evidence from Initial Public
Offerings,” Central Florida University Working Paper. Gaver, J. and K. Gaver, 1993, “Additional Evidence on the Association Between the Investment
Opportunity Set and Corporate Financing, Dividend, and Compensation Policies,” Journal of Accounting and Economics 16, 125-160.
Gertner, R. and S. Kaplan, 1996, “The Value-Maximizing Board,” University of Chicago and
NBER Working Paper. Gillan, S., J. Hartzell, and L. Starks, 2003, “Explaining Corporate Governance: Boards, Bylaws,
and Charter Provisions,” University of Delaware Working Paper. Gompers, P., J. Ishii, and A. Metrick, 2003, “Corporate Governance and Equity Prices,”
Quarterly Journal of Economics 118, 107-155. Hermalin, B. and M. Weisbach 1998, “Endogenously Chosen Boards of Directors and their
Monitoring of the CEO,” American Economic Review 88, 96-118. Hermalin, B. and M. Weisbach, 2003, “Board of Directors as an Endogenously-Determined
Institution: A Survey of the Economic Literature,” Economic Policy Review 9, 7-26. Huber, P., 1964, “Robust Estimation of a Location Parameter,” Annals of Mathematical Statistics
35, 73-101. Institutional Shareholders Services, Inc. 2003, ISS Comments on NYSE Governance – 09/04/03
– Seven recommendations include disclosure of issuer compliance. Available at www.issproxy.com.
Jensen, M., 1986, “Agency Costs of Free Cash Flow, Corporate Finance, and Takeovers,”
American Economic Review 76, 323 –329. Kahle, K. and R. Walkling, 1996, “The Impact of Industry Classification on Financial Research,”
Journal of Financial and Quantitative Analysis 31, 309-335. Kieschnick, R. and R. Moussawi, 2004, “The Board of Directors: A Bargaining Perspective?”
University of Texas at Dallas Working Paper.

32
Klein, A, 1998, “Affiliated Directors: Puppets of Management or Effective Directors?” New York University, Center for Law and Business, Working Paper No. 98-010. http://ssrn.com/abstract=10569
Kole, S., 1997, “The complexity of compensation contracts,” Journal of Financial Economics
43, pp 79-104. Lehn, K., S. Patro, and M. Zhao, 2003, “Determinants of the Size and Structure of Corporate
Boards: 1935-2000,” University of Pittsburgh Working Paper. National Association of Corporate Directors, 2001, Report of the NACD Blue Ribbon
Commission on Director Professionalism. Raheja, C., 2004, “Determinant of Board Size and Composition: A Theory of Corporate Boards,”
Journal of Financial and Quantitative Analysis, forthcoming. The Business Roundtable, 1997, Statement on Corporate Governance, Available for download at
http://www.brtable.org/document.cfm/11. Smith, C. and R. Watts, 1992, “The Investment Opportunity Set and Corporate Financing,
Dividend, and Compensation Policies,” Journal of Financial Economics 32, 263-292. Volcker, P. and A. Levitt Jr., 2004, “In Defense of Sarbanes-Oxley,” The Wall Street Journal,
June 14, A14. Yang, T., J. Linck, and J. Netter, 2004, “A Large Sample Study on Board Changes and
Determinants of Board Structure,” University of Georgia Working Paper. Yermark, D. 1995, “Do Corporations Award CEO Stock Options Effectively?” Journal of
Financial Economics 39, 237-269. Yermack, D. 1996, “Higher Valuation of Companies with a Small Board of Directors,” Journal
of Financial Economics 40, 185-212. White, H. 1980, “A Heteroskedasticity-Consistent Covariance Matrix Estimator and a Direct
Test for Heteroskedasticity,” Econometrica 48, 817-830.

33
Table 1. Predictions of the Hypotheses This table summarizes the empirical predictions of the three hypotheses tested in this paper with regard to the size of the board (“Number of Directors”) and independence of the board (“Fraction of Independent Directors). The “Scope of Operations Hypothesis” argues that boards grow in response to the increasing net benefits of monitoring and specialization of board members that accompany a firm’s growth. The “Negotiations Hypothesis” argues that corporate boards reflect the outcome of a negotiation between the CEO and outside board members. The “Monitoring Hypothesis” argues that board size reflects a trade-off between the firm-specific benefits of increased monitoring and the costs of such monitoring. The inefficiency hypothesis argues that boards size and composition is structured to facilitate manager’s extraction of private benefits at shareholders’ expense. Number of
Directors Fraction of
Independent Directors
For the Scope of Operations Hypothesis: Firm Size + + Years Since IPO + + Number of Business Segments + +
For the Negotiation Hypothesis Measures of insiders' influence:
CEO Tenure − CEO Ownership −
Measures of constraints on insiders' influence: Outside Ownership + Venture Capital Presence + Carter-Manaster Underwriter Rank +
For the Monitoring Hypothesis Measures of private benefits:
Free Cash Flow + + Industry Concentration + + Presence of Takeover Defense + +
Measures of monitoring costs: Market-to-Book Ratio − − R&D Expenditures − −
Return Variance − −
For the Inefficient Board Hypothesis
Measures of private benefits: Free Cash Flow − − Industry Concentration − − Presence of Takeover Defense − −

34
Table 2: Sample Size and Changes Over Time This table shows the sample distribution of 1,019 firms undergoing an IPO between 1988 and 1992. The data are partitioned by the year the firm goes public and gives the number of firms with data available in years 1, 4, 7, and 10 relative to the year of the IPO. Panel A. Sample Distribution by IPO Year
Year From IPO IPO Year IPO Year 1 Year 4 Year 7 Year 10
1988 111 107 81 67 51 1989 116 114 94 73 52 1990 113 112 96 75 49 1991 286 285 243 178 128 1992 393 389 309 220 142
Total 1019 1007 823 613 422 Panel B. Reasons Given by CRSP for Delistings (by year of delisting)
Year From IPO Reason for Delisting Year 1 Year 4 Year 7 Year 10
Total Delistings
Merger 3 119 137 121 380 (37%) Exchange 0 0 1 0 1 ( 0%) Delisted by Exchange 3 71 71 69 214 (21%) Liquidation 0 0 0 2 2 ( 0%)
Delistings by Year 6 190 209 192 597 (59%)
No Proxy Available 6 0 1 0

35
Table 3. Descriptive Statistics for Firms at Time of IPO This table provides descriptive statistics for 1,019 firms undergoing an IPO from 1988-1992. Firm market value is the price at the end of the year in which the firm went public multiplied by shares outstanding and is given millions. Firm Debt to Assets is the debt of the firm divided by company assets. CEO Ownership is the percent of shares outstanding owned by the current CEO of the firm. Firm R&D/Assets is research and development costs divided by firm assets. Officer and Director Ownership shows the percent of total shares held by all of the officers and directors of the corporation. Number of directors is the size of the board at the IPO. Percent Insiders is the percent of the board who are employees of the firm. Percent Outsiders is the fraction of board members who are non-employees of the firm. Affiliated Directors represents the percent of the board that are non-employees but have some relationship with the firm such as being a former employee, related to an employee, or having a business tie with the firm. Panel A. Firm Characteristics Mean Minimum 25th Percentile Median 75th Percentile Maximum
Firm Market Value ($ millions) 150.22 2.80 29.77 76.43 170.81 1922.71 Firm Debt/Assets 35% 0% 6% 24% 53% 1220% Firm R&D/Assets 11% 0% 0% 0% 11% 338%
Panel B. Ownership and Board Structure Mean Minimum 25th Percentile Median 75th Percentile Maximum CEO Ownership 16% 0% 2% 8% 21% 97% Officer & Director Ownership 52% 0% 38% 53% 66% 100% Number of Directors 6.2 1.0 5.0 6.0 7.0 17.0 Percent Insiders 38% 0% 22% 33% 50% 100% Percent Outsiders 62% 0% 50% 67% 78% 100% Percent Affiliated 5% 0% 0% 0% 0% 88% Percent Unaffiliated 56% 0% 40% 60% 75% 100%

36
Table 4. Evolution of Ownership, CEO Characteristics, and Board Structure Over Time This table shows the evolution of ownership, CEO characteristics, and board structure following the IPO. Panel A shows the evolution of ownership for IPO firms. Panel B provides mean characteristics of firm CEOs for a sample of 1,019 IPO firms occurring from 1988-1992 from the year they go public through ten years later. Panel C provides information on the board structure of the firms at the IPO and afterwards. CEO tenure is the number of years the executive has been in the position of CEO. CEO ownership represents the percent of total shares held by the CEO. CEO is Founder is a dummy variable equal to one if the CEO is a founder of the firm. CEO is Chairman is a dummy variable equal to one if the CEO is also the current chairman of the board of directors. CEO turnover is a dummy variable equal to one if the CEO has changed since the previous data collection period. Percent Original Directors Remaining is the percent of the directors on the board at the IPO who are still on the board after one year, four years, seven years and ten years after the IPO. Percent Outside Directors shows the fraction of board members who are not employees of the firm. Percent Affiliated shows the fraction of the board who are grey directors, while Percent Unaffiliated shows the fraction of the board who have no other affiliations with the firm. Panel A. Evolution of Ownership for IPO Firms
Year from IPO IPO Year 1 Year 4 Year 7 Year 10 Ownership by Officers & Directors 52% 45% 34% 28% 25% Ownership by CEO 16% 14% 10% 8% 7% Ownership by Officers 26% 23% 18% 15% 14% Ownership by Outside Directors 26% 22% 16% 12% 11% Ownership by 5% Blockholders 31% 30% 28% 29% 29% Number of 5% Blockholders 2.9 3.0 2.9 3.0 3.2
Panel B. Characteristics of CEOs of IPO Firms Over Time
Year from IPO IPO Year 1 Year 4 Year 7 Year 10 CEO Age 48 49 51 53 54 CEO Tenure 8 9 10 10 12 CEO is Founder 43% 42% 33% 25% 21% CEO is Chairman of the Board 60% 63% 64% 62% 60% CEO Turnover . 6% 30% 25% 30%
Panel C. Board Structure for IPO Firms Over Time
Year from IPO IPO Year 1 Year 4 Year 7 Year 10 Number of Directors 6.21 6.74 6.98 7.17 7.52 Percent Original Directors Remaining 90% 67% 51% 42% Percent Outside Directors 62% 65% 69% 71% 74% Percent Affiliated 5% 5% 7% 7% 5% Percent Unaffiliated 56% 60% 62% 64% 69%
37
Table 5. Correlation Matrix This table provides pairwise correlations. Lnmktvall is the log of the market value of the firm, measured at the end of the first public year. Yearout is the number of years since the IPO. Nseg is the number of business segments. CEO_ten is the number of years the CEO has been with the firm. CEOp is the ownership percentage of the CEO, as a fraction of shares outstanding. Outown is the ownership percentage of the independent directors, as a fraction of shares outstanding. VCdum is a dummy variable equal to one for venture-backed IPOs. Carter is the Carter-Manaster ranking of the lead IPO underwriter. Cashflow is free cash flow, defined as (Earnings + Depreciation – Capital Expenditures)/Total Assets. Ind_Herf is the Herfindahl index of industry sales using data on Compustat-listed firms. Gindex is measured as the firm’s number of takeover defenses plus the number of state antitakeover laws that apply to the firm. Mkt_Bk is the market-to-book ratio. HighRD is a dummy variable equal to one for firms in the top quartile of R&D expenditures relative to firm size. P-values are given in parentheses. LnMktVal Yearout Nseg CEO_ten CEOp Outown VCdum Carter Cashflow Ind_Herf Gindex Mkt_Bk HighRD Yearout 0.14
(0.00)
Nseg 0.14 (0.00)
0.48 (0.00)
CEO_ten 0.16 (0.00)
0.13 (0.00)
0.14 (0.00)
CEOp -0.20 (0.00)
-0.15 (0.00)
-0.09 (0.00)
0.19 (0.00)
Outown -0.04 (0.02)
-0.19 (0.00)
-0.09 (0.00)
-0.12 (0.00)
-0.28 (0.00)
VCdum 0.07 (0.00)
0.00 (1.00)
-0.06 (0.00)
-0.22 (0.00)
-0.22 (0.00)
0.02 (0.14)
Carter 0.43 (0.00)
0.00 (1.00)
0.05 (0.01)
0.04 (0.01)
-0.16 (0.00)
0.08 (0.00)
0.21 (0.00)
Cashflow 0.09 (0.00)
-0.03 (0.08)
0.01 (0.55)
0.17 (0.00)
0.06 (0.00)
-0.03 (0.06)
-0.01 (0.59)
0.06 (0.00)
Ind_Herf -0.06 (0.00)
0.04 (0.01)
0.03 (0.03)
-0.01 (0.68)
0.04 (0.01)
0.00 (0.83)
0.00 (0.89)
-0.06 (0.00)
-0.08 (0.00)
Gindex 0.17 (0.00)
0.00 (1.00)
0.04 (0.01)
0.15 (0.00)
-0.03 (0.08)
-0.06 (0.00)
-0.05 (0.00)
0.16 (0.00)
0.04 (0.02)
-0.08 (0.00)
Mkt_Bk -0.05 (0.00)
0.01 (0.40)
-0.01 (0.64)
-0.06 (0.00)
0.04 (0.02)
-0.05 (0.01)
-0.01 (0.43)
-0.05 (0.01)
-0.94 (0.00)
0.00 (0.81)
-0.02 (0.20)
HighRD -0.03 (0.14)
0.00 (0.99)
-0.08 (0.00)
-0.20 (0.00)
-0.17 (0.00)
-0.07 (0.00)
0.46 (0.00)
0.05 (0.00)
-0.06 (0.00)
0.02 (0.20)
-0.09 (0.00)
-0.01 (0.71)
Retvar -0.34 (0.00)
0.07 (0.00)
0.01 (0.52)
-0.11 (0.00)
0.02 (0.31)
0.02 (0.15)
0.00 (0.92)
-0.16 (0.00)
-0.24 (0.00)
-0.01 (0.69)
-0.06 (0.00)
-0.02 (0.31)
0.07 (0.00)

38
Table 6. Tests of the Scope of Operations Hypothesis Estimated coefficients from multiple regressions using pooled data from 1,019 firms for years 1, 4, 7, and 10 after the firms' IPOs. The dependent variable in Panel A is the number of board members. The dependent variable in Panel B is the fraction of the board that consists of independent (non-affiliated) board members. Firm Size is the log of market value of equity measured at the fiscal year end. Lag(Fraction of Independent Directors) is the percent of independent directors on the board in the pervious period. Lag(Number Directors) is the number of directors on the board in the previous period. All regressions include industry fixed effects, controlling for industry using Fama-French (1997) industry classifications. Standard errors are computed using robust methods (alternately called the Huber or White estimator) in which observations are clustered by firm. P-values are given in parentheses. Panel A. Number of Board Members as the Dependent Variable
Model 1 Model 2 Model 3 Model 4
Firm Size 0.426
(0.000) 0.408
(0.000)
Years Since IPO 0.067 (0.000) 0.004
(0.784)
Number of Business Segments 0.094
(0.000) 0.058
(0.003)
Lag(Fraction Independent Directors) 1.134 (0.000)
1.382 (0.000)
1.407 (0.000)
1.019 (0.000)
Dummy for Previous Reverse LBO 0.023 (0.876)
0.385
(0.010)
0.336
(0.031) -0.001 (0.993)
Dummy for Equity Carve-Out 0.211 (0.315)
0.231 (0.322)
0.181 (0.434)
0.222 (0.299)
Dummy for Dual Class 0.495 (0.067)
0.686 (0.023)
0.655 (0.036)
0.489 (0.073)
Industry Fixed Effects? yes yes yes yes
Constant 5.396 (0.000)
6.673 (0.000)
6.556 (0.00)
5.219 (0.000)
Adjusted R2 0.26 0.17 0.16 0.25
39
Table 6, Panel B. Tests of the Scope of Operations Hypothesis (continued)
Estimated coefficients from multiple regressions using pooled data from 1,019 firms for years 1, 4, 7, and 10 after the firms' IPOs. The dependent variable in Panel A is the number of board members. The dependent variable in Panel B is the fraction of the board that consists of independent (non-affiliated) board members. Firm Size is the log of market value of equity measured at the fiscal year end. Lag(Fraction of Independent Directors) is the percent of independent directors on the board in the pervious period. Lag(Number Directors) is the number of directors on the board in the previous period. All regressions include industry fixed effects, controlling for industry using Fama-French (1997) industry classifications. Standard errors are computed using robust methods (alternately called the Huber or White estimator) in which observations are clustered by firm. P-values are given in parentheses.
Panel B. Fraction of Independent Directors on the Board as the Dependent Variable
Model 1 Model 2 Model 3 Model 4
Firm Size 0.010
(0.001) 0.008
(0.014)
Years Since IPO 0.008
(0.000) 0.006
(0.000)
Number of Business Segments 0.005
(0.000) 0.001
(0.630)
Lag(Number of Directors) 0.013
(0.000) 0.013
(0.000) 0.014
(0.000) 0.011
(0.000)
Dummy for Previous Reverse LBO 0.065
(0.000)
0.074
(0.000)
0.073
(0.000) 0.068
(0.000)
Dummy for Equity Carve-Out 0.040
(0.017) 0.043
(0.010) 0.038
(0.025) 0.041
(0.017)
Dummy for Dual Class -0.040 (0.063)
-0.048 (0.021)
-0.034 (0.109)
-0.038 (0.073)
Industry Fixed Effects? yes yes yes yes
Constant 0.467
(0.000) 0.466
(0.000) 0.476
(0.000) 0.451
(0.000)
Adjusted R2 0.19 0.19 0.18 0.20

40
Table 7. Tests of the Negotiation Hypothesis: Predictions for Board Independence Estimated coefficients from multiple regressions using pooled data from 1,019 firms for years 1, 4, 7, and 10 after the firms' IPOs. The dependent variable is the fraction of the board that consists of independent (non-affiliated) board members. Firm Size is the log of market value of equity measured at the fiscal year end. Lag(Number Directors) is the number of directors on the board in the previous period. All regressions include industry fixed effects, controlling for industry using Fama-French (1997) industry classifications. Standard errors are computed using robust methods (alternately called the Huber or White estimator) in which observations are clustered by firm. P-values are given in parentheses.
Model 1 Model 2 Model 3 Model 4 Model 5 Model 6 Model 7
CEO Tenure -0.002 (0.000)
-0.001 (0.089)
-0.002 (0.010)
CEO Ownership -0.261 (0.000)
-0.181 (0.000)
-0.136 (0.000)
Outside Director Ownership
0.149 (0.000)
0.103 (0.000)
0.157 (0.000)
Dummy for Venture Backing 0.107
(0.000) 0.080
(0.000) 0.090
(0.000)
Carter-Manaster Ranking 0.018
(0.000) 0.008
(0.013) 0.005
(0.1213)
Lag(Number of Directors)
0.014 (0.000)
0.011 (0.000)
0.014 (0.000)
0.015 (0.000)
0.012 (0.000)
0.009 (0.001)
0.006 (0.040)
Dummy for Previous Reverse LBO
0.076 (0.000)
0.060 (0.000)
0.064 (0.000)
0.076 (0.000)
0.053 (0.000)
0.054 (0.000)
0.055 (0.000)
Dummy for Equity Carve-Out
0.042 (0.014)
0.032 (0.057)
0.011 (0.511)
0.080 (0.000)
0.054 (0.002)
0.044 (0.010)
0.032 (0.062)
Dummy for Dual Class
-0.042 (0.041)
-0.017 (0.474)
-0.058 (0.007)
-0.026 (0.211)
-0.053 (0.011)
-0.018 (0.413)
-0.013 (0.560)
Firm Size 0.005 (0.163)
Years Since IPO 0.008 (0.000)
Number of Business Segments 0.002
(0.280)
Constant 0.552 (0.000)
0.616 (0.000)
0.497 (0.000)
0.497 (0.000)
0.544 (0.000)
0.564 (0.000)
0.474 (0.000)
Industry fixed effects yes yes yes yes yes yes yes Adjusted R2 0.18 0.17 0.20 0.24 0.19 0.27 0.30
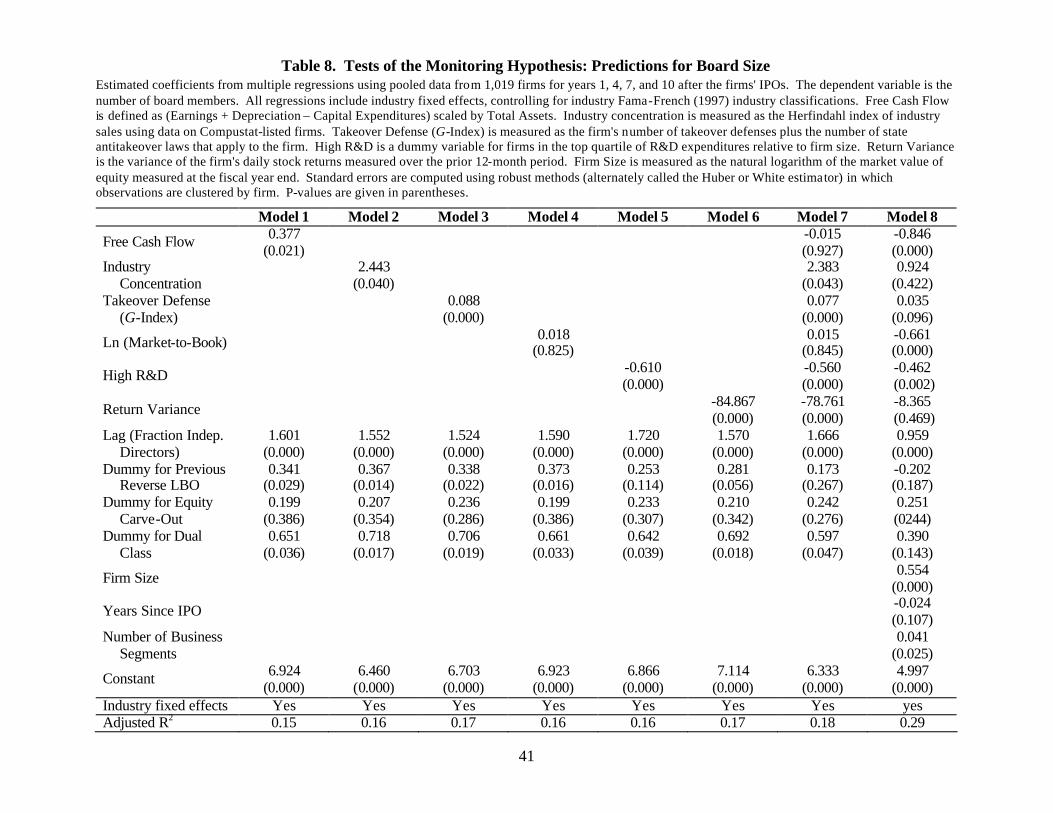
41
Table 8. Tests of the Monitoring Hypothesis: Predictions for Board Size Estimated coefficients from multiple regressions using pooled data from 1,019 firms for years 1, 4, 7, and 10 after the firms' IPOs. The dependent variable is the number of board members. All regressions include industry fixed effects, controlling for industry Fama-French (1997) industry classifications. Free Cash Flow is defined as (Earnings + Depreciation – Capital Expenditures) scaled by Total Assets. Industry concentration is measured as the Herfindahl index of industry sales using data on Compustat-listed firms. Takeover Defense (G-Index) is measured as the firm's number of takeover defenses plus the number of state antitakeover laws that apply to the firm. High R&D is a dummy variable for firms in the top quartile of R&D expenditures relative to firm size. Return Variance is the variance of the firm's daily stock returns measured over the prior 12-month period. Firm Size is measured as the natural logarithm of the market value of equity measured at the fiscal year end. Standard errors are computed using robust methods (alternately called the Huber or White estimator) in which observations are clustered by firm. P-values are given in parentheses.
Model 1 Model 2 Model 3 Model 4 Model 5 Model 6 Model 7 Model 8
Free Cash Flow 0.377 (0.021) -0.015
(0.927) -0.846 (0.000)
Industry Concentration 2.443
(0.040) 2.383 (0.043)
0.924 (0.422)
Takeover Defense (G-Index) 0.088
(0.000) 0.077 (0.000)
0.035 (0.096)
Ln (Market-to-Book) 0.018 (0.825) 0.015
(0.845) -0.661 (0.000)
High R&D -0.610 (0.000) -0.560
(0.000) -0.462
(0.002)
Return Variance -84.867 (0.000)
-78.761 (0.000)
-8.365 (0.469)
Lag (Fraction Indep. Directors)
1.601 (0.000)
1.552 (0.000)
1.524 (0.000)
1.590 (0.000)
1.720 (0.000)
1.570 (0.000)
1.666 (0.000)
0.959 (0.000)
Dummy for Previous Reverse LBO
0.341 (0.029)
0.367 (0.014)
0.338 (0.022)
0.373 (0.016)
0.253 (0.114)
0.281 (0.056)
0.173 (0.267)
-0.202 (0.187)
Dummy for Equity Carve-Out
0.199 (0.386)
0.207 (0.354)
0.236 (0.286)
0.199 (0.386)
0.233 (0.307)
0.210 (0.342)
0.242 (0.276)
0.251 (0244)
Dummy for Dual Class
0.651 (0.036)
0.718 (0.017)
0.706 (0.019)
0.661 (0.033)
0.642 (0.039)
0.692 (0.018)
0.597 (0.047)
0.390 (0.143)
Firm Size 0.554 (0.000)
Years Since IPO -0.024 (0.107)
Number of Business Segments 0.041
(0.025)
Constant 6.924 (0.000)
6.460 (0.000)
6.703 (0.000)
6.923 (0.000)
6.866 (0.000)
7.114 (0.000)
6.333 (0.000)
4.997 (0.000)
Industry fixed effects Yes Yes Yes Yes Yes Yes Yes yes Adjusted R2 0.15 0.16 0.17 0.16 0.16 0.17 0.18 0.29

42
Table 9. Tests of the Monitoring Hypothesis: Predictions for Board Independence Estimated coefficients from multiple regressions using pooled data from 1,019 firms for years 1, 4, 7, and 10 after the firms' IPOs. The dependent variable is the fraction of the board that consists of independent board members. All regressions include industry fixed effects, controlling for industry using Compustat Fama -French (1997) industry classifications. Free Cash Flow is defined as (Earnings + Depreciation – Capital Expenditures) scaled by Total Assets. Industry concentration is measured as the Herfindahl index of industry sales using data on Compustat-listed firms. Takeover Defense (G-Index) is measured as the firm's number of takeover defenses plus the number of state antitakeover laws that apply to the firm. High R&D is a dummy variable for firms in the top quartile of R&D expenditures relative to firm size. Return Variance is the variance of the firm's daily stock returns measured over the prior 12-month period. Firm Size is measured as the natural logarithm of the market value of equity measured at the fiscal year end. Standard errors are computed using robust methods (alternately called the Huber or White estimator) in which observations are clustered by firm. P-values are given in parentheses.
Coefficient (p-value)
Free Cash Flow -0.020 (0.272)
Industry Concentration -0.125 (0.230)
Takeover Defense (G-Index) 0.002 (0.235)
Ln (Market-to-Book) -0.012 (0.182)
High R&D 0.025 (0.091)
Return Variance -3.274 (0.038)
Lag (Number of Directors) 0.005 (0.108)
Dummy for Reverse LBO, Carve, or Dual Class 0.055 (0.000)
Firm Size 0.007 (0.112)
Years Since IPO 0.008 (0.000)
Number of Business Segments 0.002 (0.127)
CEO Tenure -0.002 (0.008)
CEO Ownership -0.148 (0.000)
Outside Director Ownership 0.179 (0.000)
Dummy for Venture Backing 0.084 (0.000)
Carter-Manaster Ranking 0.003 (0.323)
Constant 0.132 (0.002)
Industry fixed effects? yes
Adjusted R2 0.30

43
Table 10. Economic Impact of Variables for the Three Hypotheses in Tables 6-8 This table reports on the economic impact of each variable used to test the three hypotheses in Tables 6-8. Specifically, coefficient estimates from Tables 6-8 are used to fit values for board size and independence when all regressors are set at their mean values. We then perturb each key explanatory variable by one standard deviation – leaving all other regressors at their mean values – to calculate the predicted change in the dependent variable. The predicted change is the estimate of the size of the impact on board size (or independence) of a one-standard deviation in the explanatory variable. Results are reported for each key explanatory that, when isolated, is significantly related to board size (or independence).
Board Size Board Independence
Tests of the Firm Scope of Operations Hypothesis: Firm Size 0.71 2% Years Since IPO 0.22 3% Number of Business Segments 0.21 1%
Tests of the Negotiation Hypothesis: CEO Tenure n/a -2% CEO Ownership n/a -4% Outside Director Ownership n/a 3% Venture Capital Backing n/a 5% Carter-Manaster Ranking n/a 3%
Tests of the Monitoring Hypothesis: Free Cash Flow 0.10 (a) Industry Concentration 0.18 (a) Takeover Defense (G_Index) 0.22 (a) Market-to-Book (a) (a) High R&D -0.26 (a) Return Variance -0.27 (a)
(a) Coefficient not significant in regression, so economic significance not computed.
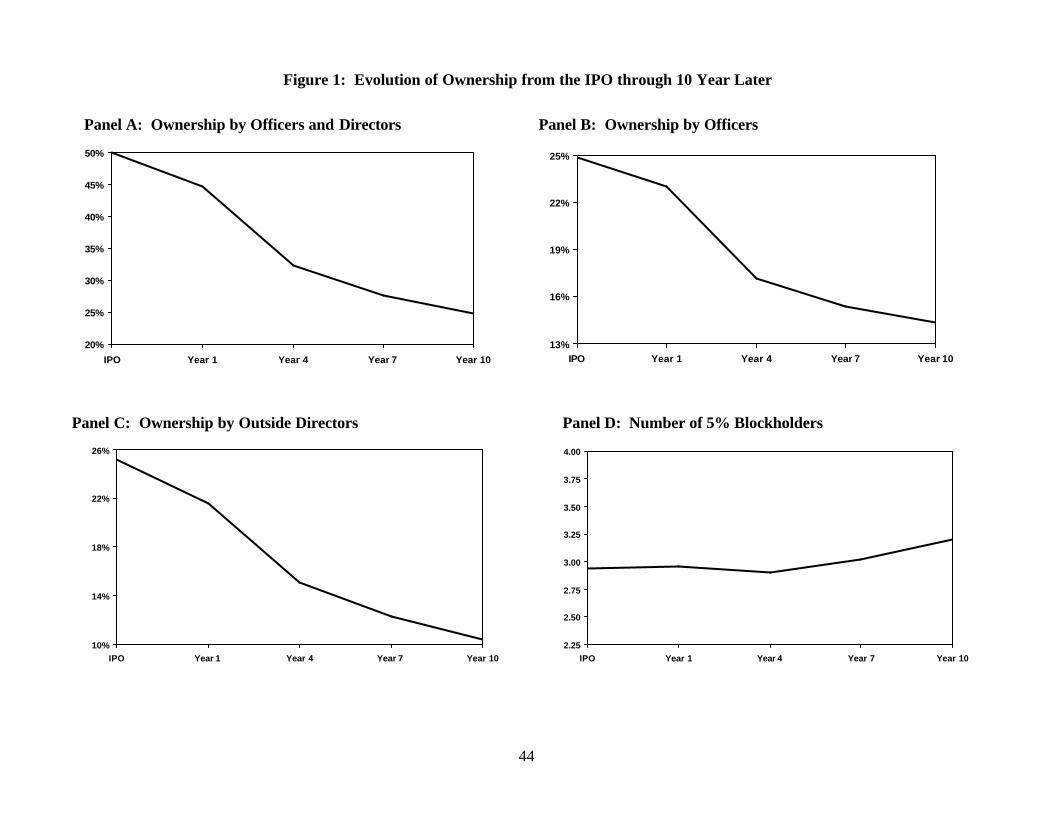
44
Figure 1: Evolution of Ownership from the IPO through 10 Year Later
Panel A: Ownership by Officers and Directors Panel B: Ownership by Officers
20%
25%
30%
35%
40%
45%
50%
IPO Year 1 Year 4 Year 7 Year 10
13%
16%
19%
22%
25%
IPO Year 1 Year 4 Year 7 Year 10
Panel C: Ownership by Outside Directors Panel D: Number of 5% Blockholders
10%
14%
18%
22%
26%
IPO Year 1 Year 4 Year 7 Year 10
2.25
2.50
2.75
3.00
3.25
3.50
3.75
4.00
IPO Year 1 Year 4 Year 7 Year 10

45
Figure 2: Evolution of Board Characteristics from the IPO through 10 Years Later Panel A: Size of Board of Directors Panel B: Fraction of Outsiders on the Board
6.00
6.25
6.50
6.75
7.00
7.25
7.50
IPO Year 1 Year 4 Year 7 Year 10
Num
ber
of B
oard
Mem
bers
60%
62%
64%
66%
68%
70%
72%
IPO Year 1 Year 4 Year 7 Year 10
Panel C: Percent of Original Board Members Remaining
40%
50%
60%
70%
80%
90%
100%
IPO Year 1 Year 4 Year 7 Year 10