Embed Size (px)
Citation preview
The detection of TMPRSS2:ERG fusiongene in blood of prostate cancer patients
Anna-Maria Lappalainen
Degree project in biology, Master of science (2 years), 2012Examensarbete i biologi 30 hp till masterexamen, 2012Biology Education Centre, Uppsala University, and Institute of Biomedical Technology, BioMediTech,Tampere University Hospital, University of Tampere, 33014 Tampere, FinlandSupervisors: Professor, MD, PhD, Tapio Visakorpi and PhD Heini KallioExternal opponent: PhD Daniel Larsson

1
CONTENTS
CONTENTS ............................................................................................................................................................................. 1 ABBREVIATIONS .................................................................................................................................................................... 3 ABSTRACT ............................................................................................................................................................................. 4 1. INTRODUCTION ................................................................................................................................................................. 5
1.1 CANCER .............................................................................................................................................................................. 5
1.1.1 Oncogenes ................................................................................................................................................................ 5 1.1.2 Tumor suppressor genes .......................................................................................................................................... 5 1.2 PROSTATE CANCER ............................................................................................................................................................... 6
1.2.1 The anatomy and physiology of the prostate ........................................................................................................... 6 1.2.2 Incidence and risk factors ......................................................................................................................................... 6 1.2.3 Early signs and symptoms ........................................................................................................................................ 7 1.2.4 Diagnosis .................................................................................................................................................................. 8 1.2.5 The role of the androgen receptor in prostate cancer ............................................................................................ 11 1.2.6 Localized prostate cancer ....................................................................................................................................... 13 1.2.7 Metastatic prostate cancer .................................................................................................................................... 13 1.2.8 Castration-resistant prostate cancer ...................................................................................................................... 13 1.2.9 Traditional treatments ........................................................................................................................................... 14
1.3 TMPRSS2:ETS TRANSLOCATIONS ........................................................................................................................................ 15
1.3.1 The discovery of TMPRSS2:ETS translocations in prostate cancer ......................................................................... 15 1.3.2 TMPRSS2 (transmembrane protease, serine 2) ...................................................................................................... 16 1.3.3 ERG (v-ets erythroblastosis virus E26 oncogene homolog (avian)) ........................................................................ 16 1.3.4 TMPRSS2:ERG fusion .............................................................................................................................................. 17 1.3.5 The formation of TMPRSS2:ERG fusion .................................................................................................................. 19 1.3.6 Prostate cancer and TMPRSS2:ERG fusion ............................................................................................................. 19
1.4 OTHER GENES INVOLVED IN PROSTATE CANCER PROGRESSION ...................................................................................................... 21
1.4.1 MYC ........................................................................................................................................................................ 21 1.4.2 NKX3.1 .................................................................................................................................................................... 21 1.4.3 PI3K pathway and PTEN ......................................................................................................................................... 22 1.4.4 EZH2 ....................................................................................................................................................................... 22
1.4.5 TP53 ....................................................................................................................................................................... 22
1.5 CIRCULATING TUMOR CELLS (CTCS) IN PROSTATE CANCER .......................................................................................................... 23
1.5.1 The definition of CTC .............................................................................................................................................. 23 1.5.2 Current methods for the detection of CTCs ........................................................................................................... 24 1.5.2.1 Immunology based methods ............................................................................................................................ 24 1.5.2.2 RT-PCR methods ............................................................................................................................................... 26 1.6 QUANTITATIVE REAL-TIME PCR .............................................................................................................................................. 28
2. AIMS OF THE STUDY........................................................................................................................................................ 29
2
3. MATERIALS AND METHODS ............................................................................................................................................ 30 3.1 Cell lines and clinical samples ..................................................................................................................................... 30 3.2 RNA isolation from PC-3 & VCaP cells and first strand cDNA synthesis ...................................................................... 31 3.3 Validation of real-time quantitative RT-PCR assays .................................................................................................... 31 3.3.1 TaqMan gene expression assay ........................................................................................................................... 33 3.3.2 SYBR Green assay ................................................................................................................................................ 33 3.3.3 iScript One-Step RT-PCR assay ............................................................................................................................. 33 3.4 Validation of TMPRSS2:ERG detection in the mixture of VCaP cells and human leukocytes ...................................... 33 3.4.1 VCaP cell line........................................................................................................................................................ 33 3.4.2 Human blood specimens ...................................................................................................................................... 33 3.4.3 Isolation of human leukocytes ............................................................................................................................. 34 3.4.4 The mixture of VCaP cells and human leukocytes ............................................................................................... 34 3.4.5 RNA isolation from VCaP cells + leukocyte -mixture and first strand cDNA synthesis ......................................... 34 3.4.6 TaqMan gene expression assay for the detection of TMPRSS2:ERG ................................................................... 34 3.4.7 SYBR Green assay for the detection of ERG ......................................................................................................... 35 3.5 The detection of TMPRSS2:ERG fusion transcript in clinical prostate cancer blood samples ..................................... 35 3.5.1 First strand cDNA synthesis ................................................................................................................................. 35 3.5.2 TaqMan gene expression assay ........................................................................................................................... 35
3.6 Statistical analysis ...................................................................................................................................................... 35 4. RESULTS .......................................................................................................................................................................... 36 4.1 TaqMan, SYBR Green, and iScript One-Step qRT-PCR assays ..................................................................................... 36 4.2 The detection of TMPRSS2:ERG and ERG expression in the mixture of human leukocytes and VCaP cells ............... 36 4.3 The frequency of TMPRSS2:ERG expression in clinical prostate cancer blood samples ............................................. 37 4.4 The Mann-Whitney test ............................................................................................................................................. 40 4.5 Kaplan-Meier progression-free survival analysis ....................................................................................................... 40 5. DISCUSSION .................................................................................................................................................................... 41 5.1 The sensitivity of TaqMan, SYBR Green and iScript One-Step qRT-PCR assays .......................................................... 41 5.2 TMPRSS2:ERG and ERG expression in the mixture of human leukocytes and VCaP cells .......................................... 42 5.3 The expression of TMPRSS2:ERG in the clinical prostate cancer blood samples ........................................................ 43 5.4 Correlation between TMPRSS2:ERG status and clinicopathological data .................................................................. 45 5.5 Prognostic value of TMPRSS2:ERG status in blood of prostate cancer patients ........................................................ 46 6. CONCLUSIONS ................................................................................................................................................................ 47 ACKNOWLEDGEMENTS ....................................................................................................................................................... 48 REFERENCES ........................................................................................................................................................................ 49 APPENDIX ............................................................................................................................................................................ 58
3
ABBREVIATIONS
AR Androgen receptor
ARE Androgen receptor element
BPH Benign prostate hyperplasia
CDK Cyclin-dependent kinase
CGH Comparative genomic hybridization
CRPC Castration resistant PC
CTC Circulating tumor cell
DHT 5α-dihydrotestosterone
EMT Epithelial-to-mesenchymal transition
ERG V-ets erythroblastosis virus E26 oncogene homolog (avian)
ETS Avian erythroblastosis virus E26 homolog
EZH2 Enhancer of zeste homolog 2
GS Gleason score
GnRH Gonadotropin releasing-hormone
HDAC Histone deacetylase
HGPIN High-grade prostatic intraepithelial neoplasia
HPC Hereditary prostate cancer
LOH Loss of heterozygosity
mRNA Messenger ribonucleic acid
MYC V-myc myelocytomatosis viral oncogene homolog (avian)
NKX3.1 NK3 homeobox 1
PC Prostate cancer
PC-3 Human PC cell line 3
P53 Tumor protein 53
PCR Polymerase chain reaction
PI3K Phosphoinositide-3-kinase
PIN Prostatic intraepithelial neoplasia
PSA Prostate specific antigen
PTEN Phosphatase and tensin homolog
QRT-PCR Quantitative real-time PCR
RNA Ribonucleic acid
TMPRSS2 Transmembrane protease, serine 2
TNM TNM classification of malignant tumors
TURP Transurethral resection of prostate
UTR Untranslated region
VCaP Vertebrae PC cell line
4
ABSTRACT
Prostate cancer (PC) is a heterogeneous disease caused by multiple complex genetic, epigenetic and
chromosomal abnormalities within cells. The discovery of total prostate specific antigen (total PSA)
testing in the blood of PC patients has led to an increased number of PC diagnoses in western
populations. However, PSA is not only PC specific, since other conditions which disrupt the normal
prostatic architechture can also cause PSA to appear in blood, therefore more reliable biomarkers are
needed to improve PC detection. Currently, the best predictor of PC survival is provided by the
combination of PSA levels, clinical and pathological tumor stage, and Gleason score. In order to
better define the type of cells undergoing malignant transformation, analysis of specific tumor
phenotypes involved in PC recurrence and finally predict patient outcome in the future, more tumor-
and tissue-specific (as well as blood based) biomarkers are needed.
Translocations of the androgen-induced 5´ TMPRSS2 (transmembrane protease, serine 2)
chromosomal region to the oncogenic transcription factor coding family member 3´ ERG (v-ets
erythroblastosis virus E26 homolog avian) have been shown to be present in approximately 50% of
PC cases. It has been reported that the translocation between TMPRSS2 and ERG is an early lesion in
PC progression and the frequency of TMPRSS2:ERG fusions increases from moderately to poorly
differentiated tumors. There have been several studies utilizing different molecular techniques to
investigate the role of TMPRSS2:ERG fusion in PC progression. However, the real biological role of
the fusion in PC tumorigenesis remains to be elucidated.
The main aim of the present study was to validate the sensitivity of TaqMan, SYBR Green and
iScript One RT-PCR assays in the detection of the TMPRSS2:ERG transcript in the fusion positive
VCaP prostate cancer cell line. Further, TMPRSS2:ERG status in 163 clinical PC patients’ blood
samples was studied and the frequency of the fusion was determined with a TaqMan assay, which
was considered to be the most sensitive assay for the detection of the fusion. The association
between TMPRSS2:ERG fusion and clinicopathological data was evaluated using Fisher’s exact test.
The Kaplan-Meier progression-free survival analysis and the Mantel-Cox hazard model were used to
define the correlation between the fusion status and patients’ clinical outcome.
In the present study, the fusion status was not shown to be significantly associated either with
clinicopathological data or patient outcome, due to low frequency and high variability of the
TMPRSS2:ERG fusion transcript detected in the blood of respective PC patients. According to the
results obtained from clinical samples, the TaqMan assay was not confirmed to be a sufficiently
stable and reproducible method for the detection of TMPRSS2:ERG fusion transcripts in the blood of
PC patients. Thus, this TaqMan assay cannot be used as a clinical diagnostic method for PC. In the
future, it would be interesting to further evaluate whether or not the sensitivity of the TaqMan assay
and the detection of TMPRSS2:ERG fusion positive PC cases could be improved by using different
combinations of blood-based biomarkers.
5
1. INTRODUCTION
1.1 CANCER
Cancer is a heterogeneous disease caused by multiple sets of genetic alterations. During cancer
development the normal process of the mammalian cell cycle is disrupted leading to impaired
replication of DNA. Defects in the double-strand break DNA repair process can lead to inhibition of
homologous recombination between strands, increasing chromosomal instability, and finally
accumulation over time can lead to the tumor formation (Kumma and Jackson 2001). Moreover,
according to Kumma and Jackson (2001), chromosomal translocations and inversions usually arise
during the error prone non-homologous end joining (NHEJ) process where the strands which are not
repaired are aberrantly joined together initiating tumorigenesis. Thus, mutations, chromosomal
rearrangements and epigenetic changes occur during constant and rapid cell cycle divisions. Due to
the fast mutation and proliferation rate of tumor cells, adaptation to the constantly changing
microenvironment is a requirement for tumor cell survival. This leads to the formation of
heterogeneous and complex tumor cell tissue (Hanahan and Weinberg 2000).
1.1.1 Oncogenes
Oncogenes are mutated cancer-promoting genes that originate from proto-oncogenes. They are
dominant genes which require only one mutation for malignant transformation. Proto-oncogenes
encode essential proteins such as transcription factors (e.g. MYC), signal transducers (e.g. kinases),
apoptosis regulators (e.g. BCL-1 and BCL-2), and growth factors, as well as growth factor receptors
that regulate cell growth and differentiation (Croce 2008). When the proto-onco genes become
structurally altered due to gain-of-function mutations such as gene amplification, chromosomal
rearrangements, or point mutations they become oncogenes and start to directly encode oncoproteins
(Croce 2008). Oncogenes can alter the normal function of growth by inducing the receptor and
cytoplasmic tyrosine kinase phosphorylation, leading to ligand-independent activation of receptors.
The BCR-ABL gene fusion is one example of an oncogene; found on the Philadelphia chromosome in
chronic myelogenous leukemia patients. BCR-ABL encodes receptor tyrosine kinase, which is
constitutively active, accelerating cell proliferation during cancer tumorigenesis. Oncogenes can
permanently activate epidermal growth factor receptors (EGFR) and vascular endothelial growth
factor receptor (VEGFR), inducing epidermal growth and angiogenesis in cancer, respectively.
(Croce 2008).
1.1.2 Tumor suppressor genes
Tumor suppressor genes (TSGs) are recessive genes with cancer-preventive effects, such as the
regulation of DNA damage detection and repair, tumor vascularization, and responses at cell cycle
checkpoints (Sherr 2004). Mutations in TSGs lead to the inhibition of cancer-suppressive functions,
increasing the risk of malignant growth. Due to the recessive characteristic of TSGs, at least two
mutational events are required in both alleles in order to silence the gene (Knudson 1971, Berger et
al. 2011). The first allelic mutation in TSGs usually occurs at the germline level, whereas
inactivation of the other allele occurs at the somatic level. The second mutational event is called loss
of heterozygocity (LOH), which occurs due to interstitial deletions of the chromosomal regions close
to the respective gene, and by mitotic recombination or gene conversion (Berger et al. 2011, Sherr
2004). Haploinsufficient genes are TSGs which need only one allelic loss for tumor growth,
especially when combined with other mutations which alter the function of oncogenes and TSGs
(Cook and McCaw 2000).
6
1.2 PROSTATE CANCER
1.2.1 The anatomy and physiology of the prostate
The prostate gland is located in anterior to the rectum, and inferior to the bladder within the lower
pelvis, and is connected to the seminal vesicles, forming the accessory glands of reproduction. The
main function of prostate gland is to secrete a milky, slightly acidic fluid which is essential for
ejaculation. One crucial component of this fluid is serum prostate specific antigen (PSA); used
during the screening of PC patients. The prostate is a glandular and muscular organ supported by a
stroma and extracellular matrix (ECM) components including neurovascular tissue, fibroblasts,
smooth muscle cells, and lymphocytes. There are four different cell types in the prostatic epithelium:
secretory, basal, transient amplifying (intermediate between secretory and basal cells), and
neuroendocrine cells. (Isaacs and Coffey 1989)
Cellular compartment of the prostate
Secretory cells which line the prostate glands and ducts are involved in the secretion of an alkaline
fluid that is crucial for the motility and nourishment of sperm. Basal cells are attached to the
basement membrane and are adjacent to the secretory cells; they have a high proliferative capacity
and long life span. Neuroendocrine cells are spread throughout the prostate gland, their main
function being the regulation of cell growth and prostatic secretory activity (Bonkhoff et al. 1994, De
Marzo et al. 1998, Foster et al. 2002). The prostate gland is divided into four anatomical zones: the
peripheral, central, transition, and fibromuscular zones. The peripheral zone is the largest,
comprising approximately 75% of the prostate gland, from which about 70-80% of PCs originate.
Precursor lesions to PC, such as high-grade prostatic intraepithelial neoplasia (HGPIN), prostatic
intraepithelial neoplasia (PIN), and primary prostate carcinoma develop in the peripheral zone.
However, tumors may also develop in the transition zone. Benign prostatic hyperplasia (BPH), which
is not considered to be a precursor lesion to PC, usually develops in the transition zone (Appelwhite
et al. 2001, Ayala and Ro 2007, Kristal et al. 2010). Most PCs are multifocal and grow in the
multiple zones of the prostate.
1.2.2 Incidence and risk factors
Incidence
In recent years, PC incidence has increased throughout the developed world. This can largely be
attributed to increased PSA testing, as well as increased positive biopsy rate in aging populations.
However, mortality has decreased or remained at the same level (Jemal et al. 2010). PC incidence in
the aging population of developed countries is approximately 16% (Jemal et al. 2010, Siegel et al.
2012), suggesting that on average, one in every six men in these countries will be diagnosed with PC.
According to Siegel et al. (2012), PC is the most commonly diagnosed malignancy in men in the
United States and the second (after lung cancer) most common cause of all cancer deaths in the USA.
In the developed world, about 650 000 men are diagnosed with PC, while approximately 136 000
men die from PC annually (Jemal et al. 2011).
7
Risk factors
Little is known about the risk factors of PC, though several studies have shown that the most
common risk factors significantly affecting PC progression are: advanced age, ethnicity, and family
history (Damber and Aus 2008, Haas et al. 1997). According to different epidemiological studies, PC
risk increases by two to three fold if any first degree relatives (i.e. father or brother) have PC (Cerhan
et al. 1999, Zeegers 2003). Hereditary PC (HPC) – a type of familial PC – accounts for 5-10% of PC
cases, and is more common in families with significantly earlier onset of PC (Cerhan et al. 1999,
Grönberg et al. 1997). High penetrance genes increase the PC risk among HPC cases. However, only
a few HPC cases have been found to interact with high penetrance genes, including breast cancer
type 2 susceptibility protein (BRCA2), elaC homolog 2 (Escherichia coli) (ELAC), macrophage
scavenger receptor 1 (MSR1), and ribonuclease L (RNASEL) (Carpten et al. 2002, Edwards et al.
2003). Low penetrance genes are more common in HPC. In addition, several chromosomal loci
including 8q24, 17q21, Xp11 and 10q21 have been found to be associated with PC risk (Al Olama et
al. 2009, Witte 2009).
1.2.3 Early signs and symptoms
Morphological changes
The morphology of prostate cells changes during the aging process; known as benign prostatic
hyperplasia (BPH), which is not a precursor to PC as mentioned earlier. In BPH the number of
epithelial cells increases but the nuclear appearance of the cells remains normal. BPH is a very
common lesion among elderly men; affecting approximately 90% of 80-year-old men (Bushman
2009, Kristal et al. 2010). However, constantly proliferating prostate epithelial cells can acquire
changes in their nuclear histology and columnar appearance. When the nuclear compartment is
enlarged and the nucleoli are prominent the lesion is considered to be a precursor lesion to PC. Such
pre-malignant lesions are either called prostatic intraepithelial neoplasia (PIN) (leading to nuclear
enlargement and accumulation of luminal epithelial cells) or high-grade prostatic intraepithelial
neoplasia (HGPIN) (leading to dysplasia of prostatic epithelial cells). Multifocal lesions, which may
be characterized by a variety of differentiation phenotypes at histological level, arise in the
constantly changing micro-environment and cell compartments during PC progression (Ayala and
Ro 2007).
Genetic and epigenetic changes
Several genetic and epigenetic aberrations have been shown to be involved in the development of
malignant PC. The most frequently found alterations are TMPRSS2:ETS translocations, androgen
receptor (AR) gene amplification, MYC oncogene overexpression, loss of NKX3.1, loss of PTEN,
gain-of-function mutations in EZH2, and inactivation of TP53 (Asatiani et al. 2005, Bowen et al.
2000). Loss of NKX3.1 has been found to be associated with the early stages of HGPIN. In addition,
TMPRSS2:ETS translocations and gain-of-function mutations of MYC have been reported to be
associated with localized PC. Furthermore, amplification of the AR gene, loss of PTEN, and
mutations in EZH2 and TP53 have been found more often in advanced stage of PC (Asatiani et al.
2005, Bowen et al. 2000).
Epigenetic alterations, such as GSTP1 (glutathione S-transferase pi 1) promoter hypermethylation
(Maruyama et al. 2002) and APC (adenomatous polyposis coli) hypermethylation (Kang et al. 2004)
have been found to be involved in early HGPIN lesions as well as in primary tumors. GSTP1 is a
caretaker gene that is involved in the detoxification and inactivation of carcinogens by conjugating
8
them with glutathione. Moreover, GSTP1 promoter hypermethylation has been observed in 70% of
PIN and 90% of primary tumors (Meiers et al. 2002). Further, the well-known tumor suppressor gene
APC in colon cancer has been shown to be involved in the regulation of downstream targets such as
β-catenin, MYC, and Wnt signaling (Markowitz and Bertagnolli 2009). It has been reported that APC
is hypermethylated in 30% of PIN cases, and around 55-85% of prostate carcinomas (Kang et al.
2004). Disruption of APC activity leads to altered cellular division, growth and migration of the
prostate cells.
1.2.4 Diagnosis
PSA testing
Prostate specific antigen, PSA, is a serine protease which is a member of the human kallikrein family
genes. PSA is produced by both normal and malignant prostate epithelial cells, and has been reported
to be involved in the regulation of semen liquefaction. PSA can be detected in the blood and PSA
testing is currently used for early PC detection and as part of the clinical application for measuring
PC progression after prostatectomy, therapeutic response, and staging (Lilja et al. 2008). The
common threshold level of PSA for the detection of PC is 4 ng/ml, and men who have PSA levels >
4 ng/ml are recommended to undergo prostate biopsy. However, PSA is not a PC-specific marker;
elevated serum PSA levels can reflect other disorders affecting the integrity of the prostate
architechture, such as BPH and proliferative inflammatory atrophy (PIA) (Lilja et al. 2008,
Thompson et al. 2004). So in order to avoid overdiagnosis, PSA testing must be carefully interpreted
and combined with results obtained from digital rectal examination (DRE), and transrectal
ultrasound (TRUS)-guided prostate needle biopsy, which is analyzed according to the Gleason
grading system and pathological tumor, node, metastasis staging system.
Gleason grading system
One of the most important and widespread indicators of PC prognosis is the Gleason grading system,
based on examination of prostate biopsy samples by light microscopy (Epstein 2010). Due to the
heterogeneic nature of PC, multiple biopsies of the prostate tumor have to be obtained. The urologist
commonly takes 12 core-biopsies of the prostate (the majority from the peripheral zone), and
prepares hematoxylin & eosin (H&E) stained slides for histological examination (Heidenreich et al.
2011) using a light microscope. The pathologist will examine the architectural pattern and histology
of tumor samples and determine the relative degree of tumor differentiation according to the two
most prevalent tumor patterns within the biopsy (Humphrey 2004). Thus, PC aggressiveness is
determined according to five basic Gleason grade patterns, numbers ranging from 1 to 5: 1 being
very well differentiated (looks most like normal prostate tissue and least aggressive), 5 being poorly
differentiated (most abnormal and most aggressive prostate tissue glandular structure) (Humphrey
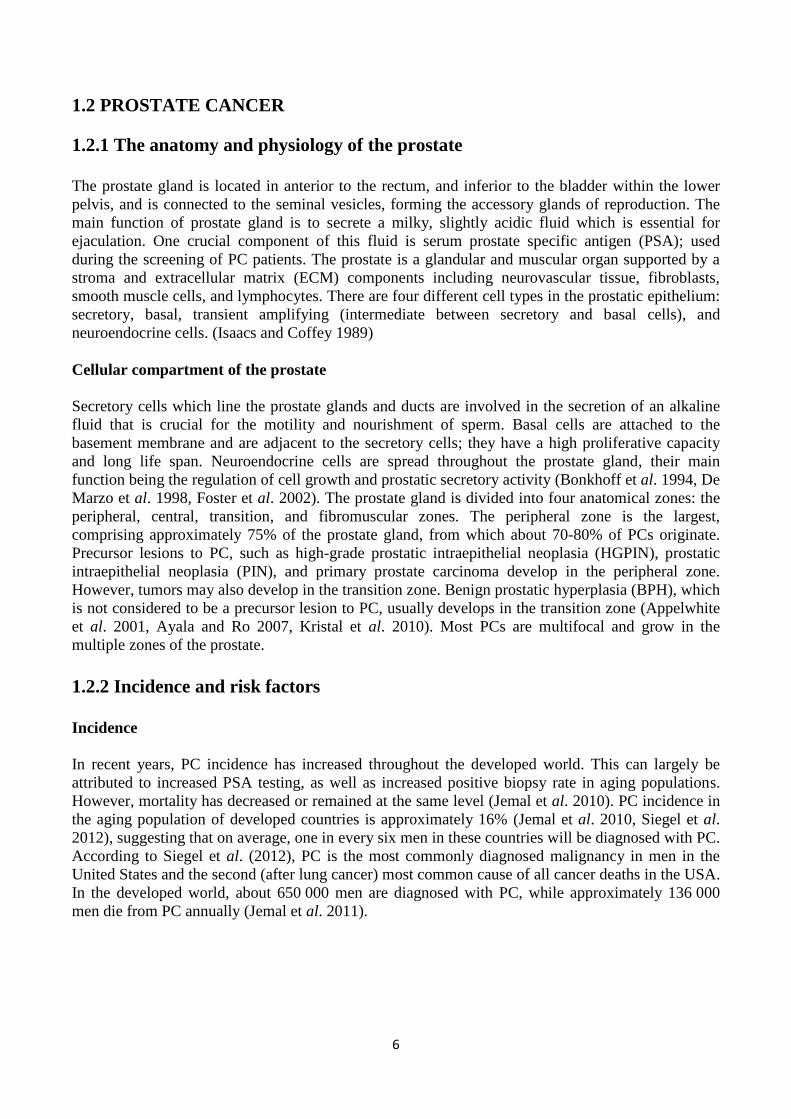
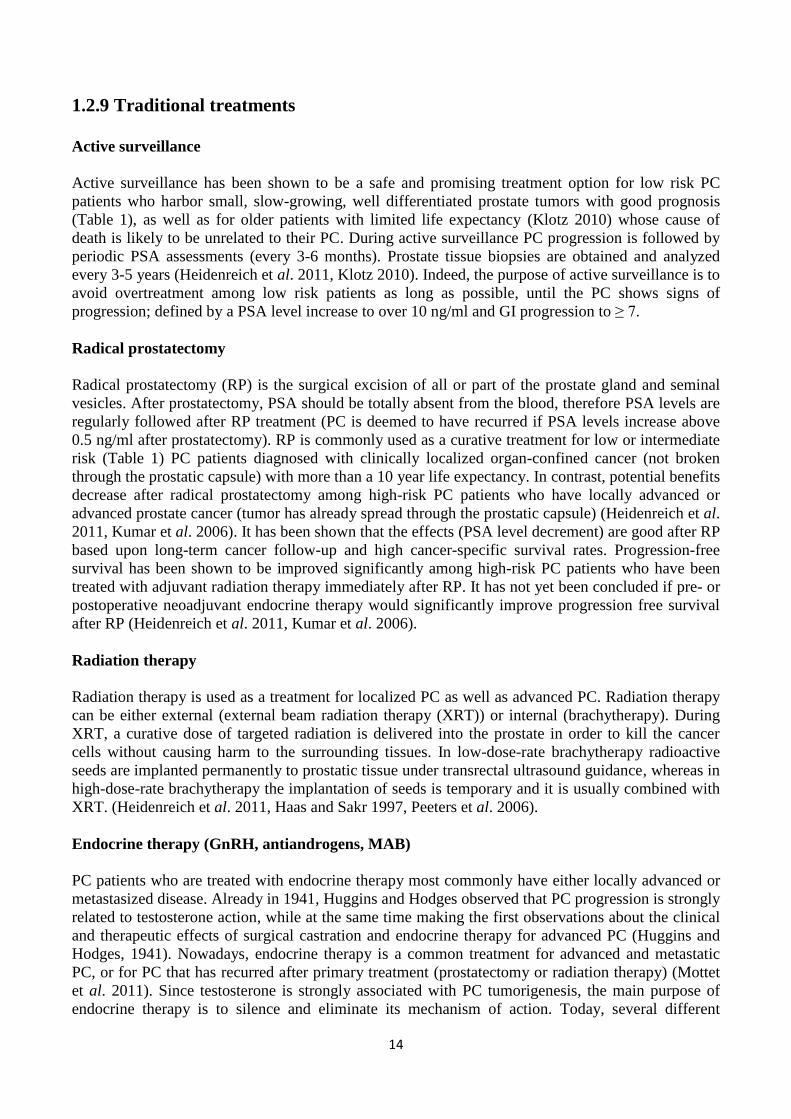
2004) (Figure 1).
The total Gleason score (GS) is determined by adding the two most predominant morphological
grade patterns together. For example a GS of 5+2 = 7 means that final GS is 7 (PC is at an
intermediate stage), with the most prevalent glandular structure being poorly differentiated, while the
second most abundant glandular structure was quite well differentiated. However, if the GS was 2+5
= 7, the most prevalent structure would be well differentiated (GS = 2) meaning that this type of
prostate tumor has less aggressive features compared to the previous tumor. Overall, high-grade
prostate tumors (GS > 8) are more likely to spread and grow quickly compared to low-grade prostate
tumors (GS < 6). (Humphrey 2004).
9
Figure 1. Gleason grading system. Prostate cancer aggressiveness is defined according to five Gleason
patterns found on a hematoxylin & eosin stained prostate tissue biopsy slide. Final Gleason score (GS) is
determined by adding the two most predominant patterns together. Gleason grades vary between 1 (well
differentiated, almost normal tissue) and 5 (poorly differentiated, most abnormal and aggressive prostate
tissue structure). Higher final GS implicates more aggressive prostate cancer.
Reproduced with permission from the copyright holder: Harnden P., Shelley M. D., Coles B., Staffurth J.,
Mason M. D. (2007) Should the Gleason grading system for prostate cancer be modified to account for
high-grade tertiary components? A systematic review and meta-analysis. The Lancet Oncology 8, 411-
419
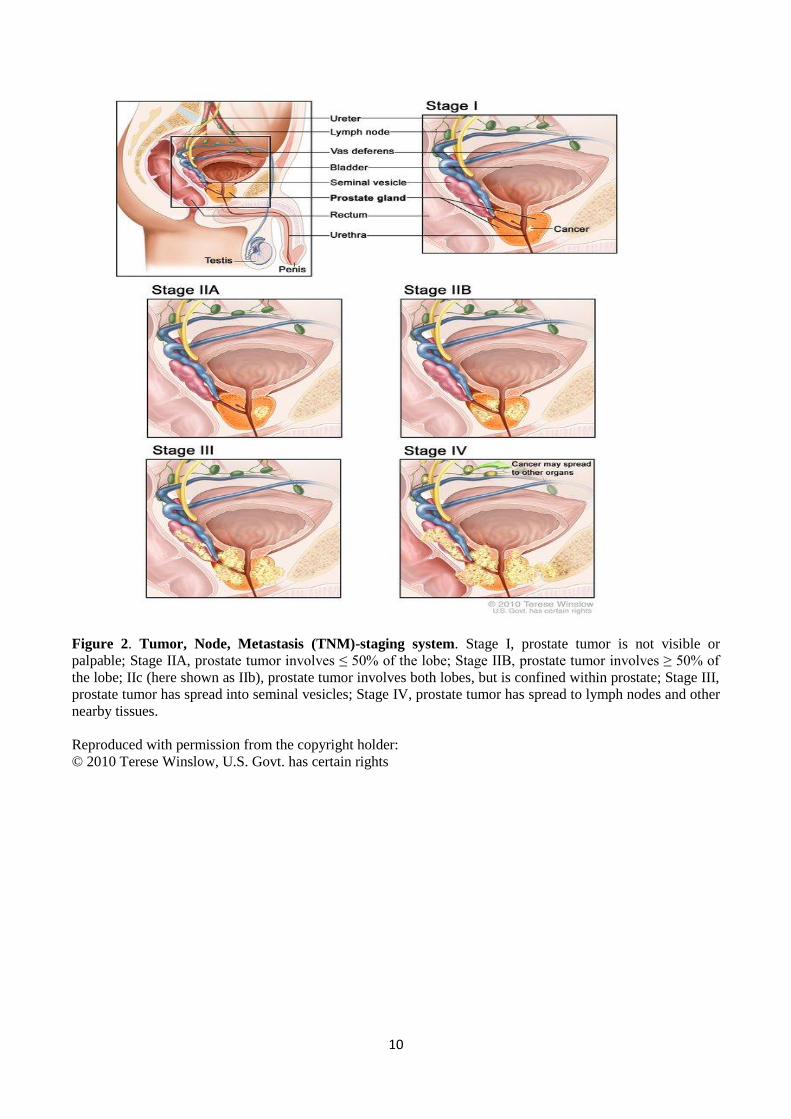
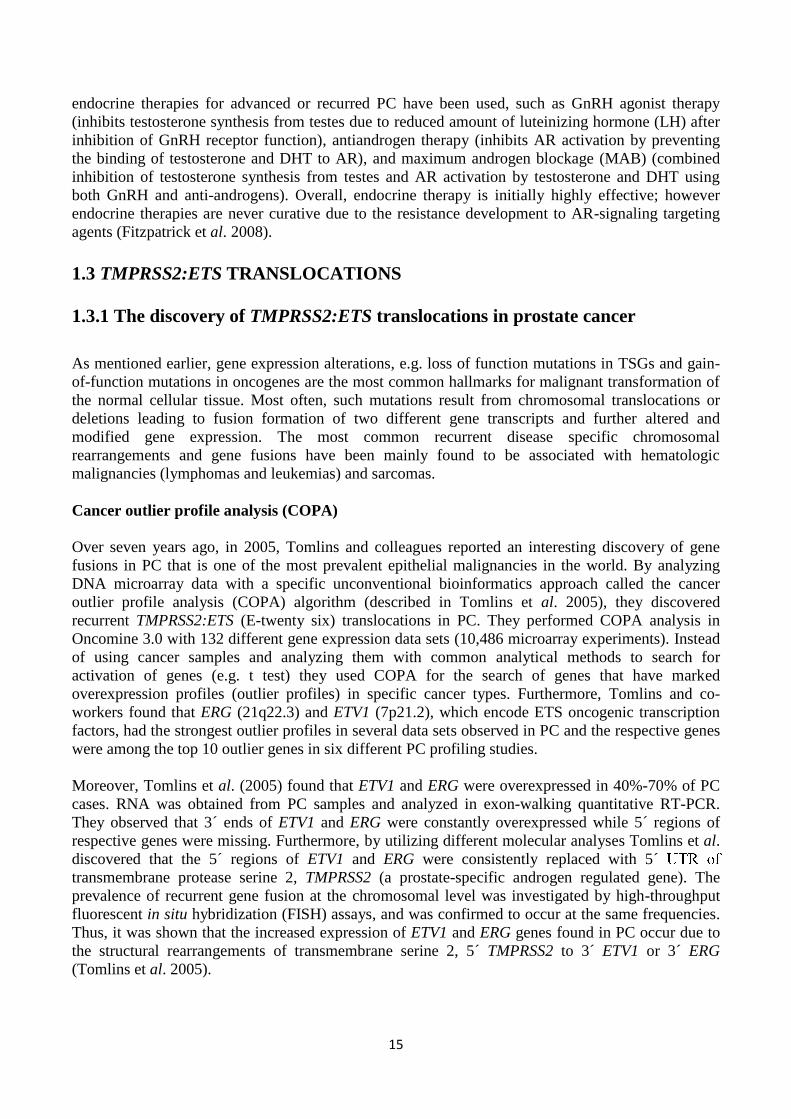
Tumor, Node, Metastasis (TNM) staging systems
There are two different TNM staging systems: clinical and pathological. Clinical staging (cT) is
based on the information obtained before prostate surgery (such as PSA levels, DRE findings,
imaging etc.). Pathological staging (pT) is based on the information obtained after prostate surgery,
i.e. it is based on the histological findings of the prostate tissue sample examination. The PC
diagnosis is always determined according to histological examination, while the type of treatment is
determined according to PSA levels, T stage and pathological findings. (Heidenreich et al. 2011)
TNM-staging describes how much the tumor tissue has spread within the prostate and to the
surrounding structures (Figure 2). Stages are as follows: pT I, tumor is not palpable or visible by
rectal examination; pT II, tumor is confined within the prostate; pT IIa, tumor involves ≤ 50% of one
prostate lobe; pT IIb, tumor involves more than 50 % of the lobe; (pT IIc, tumor involves both lobes,
here shown as IIb); pT III, tumor extends through the prostatic capsule into seminal vesicles; pT IV,
tumor has spread to lymph nodes and other organs. Tumor lymph node spread and distant metastasis
are described as (N) and (M), respectively. (Heidenreich et al. 2011)
10
Figure 2. Tumor, Node, Metastasis (TNM)-staging system. Stage I, prostate tumor is not visible or
palpable; Stage IIA, prostate tumor involves ≤ 50% of the lobe; Stage IIB, prostate tumor involves ≥ 50% of
the lobe; IIc (here shown as IIb), prostate tumor involves both lobes, but is confined within prostate; Stage III,
prostate tumor has spread into seminal vesicles; Stage IV, prostate tumor has spread to lymph nodes and other
nearby tissues.
Reproduced with permission from the copyright holder:
© 2010 Terese Winslow, U.S. Govt. has certain rights
11
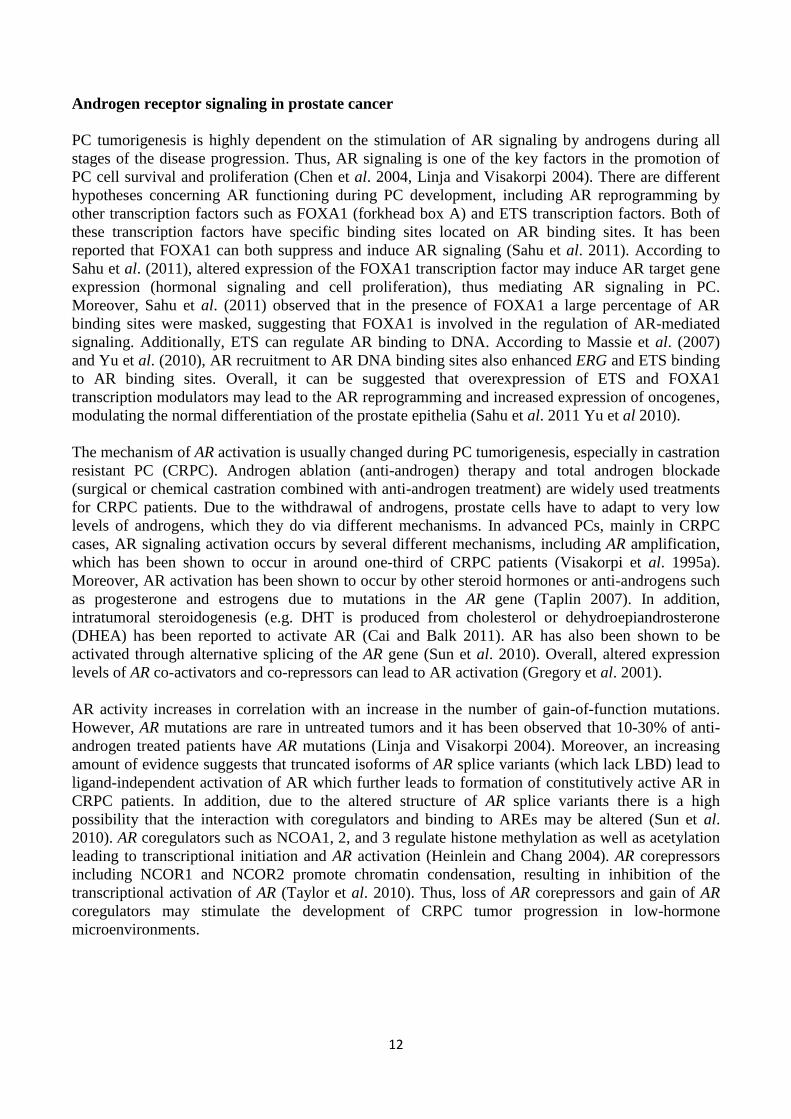
PC patients are commonly placed to different risk groups according to PSA levels, GS, cT and TNM-
staging (Table 1) (Heidenreich et al. 2011).
Table 1. Prostate cancer risk groups
Risk PSAa Gleason Score
b Clinical stage
c
Group (ng/ml) (GS) (cT)
Low < 10 ≤ 6 T1a-c, T2a
Intermediate ≥ 10 - ≤ 20 7 T2b
High > 20 ≥ 8 T2c, T3a-c a PSA, prostate specific antigen;
b is based on the pathological findings on the prostate tumor biopsy;
c clinical
stages; T1a-c, tumor is not palpable or visible by digital rectal examination or imaging; T2, tumor is palpable
and confined within prostate; T2a, tumor involves ≤ 50% of one prostate lobe; T2b, tumor involves > 50% of
one lobe; T2c, tumor involves both prostate lobes; T3a-c, tumor extends through the prostatic capsule and the
growth is no longer limited within the prostate lobes.
1.2.5 The role of the androgen receptor in prostate cancer
Androgen receptor signaling
Androgens such as testosterone and dihydrotestosterone (DHT) are steroid hormones which bind to
androgen responsive elements (AREs) on the androgen receptor (AR). They both control and
stimulate the development of male sex organs. The production of testosterone is dependent on the
regulation of luteinizing hormone (LH) by the anterior pituitary. Secretion of gonadotropin releasing
hormone (GnRH) in the hypothalamus is essential for LH regulation by the anterior pituitary; LH
inducement by the anterior pituitary leads to testosterone production by Leydig cells in the testicles.
Indeed, the prostate needs androgens for its development and normal physiological function. ARs are
responsible for the specification of the lineage-specific differentiation of prostate cells through the
activation of prostate-specific gene expression. Moreover, in the normal prostate AR maintains the
differentiated phenotype of the prostate epithelial cells (Heinlein & Chang 2004).
AR, also called NR3C4, is a member of the nuclear DNA-binding transcription factors that regulate
the action of androgens. The AR protein has four main domains, including the regulatory N-terminal
domain, a hinge region that connects the DNA binding domain (DBD) with the ligand binding
domain (LBD), DBD and LBD (Heinlain & Chang 2004). In association with heat shock proteins
(HSPs), chaperones, and cytoskeletal proteins the tertiary structure of AR is stabilized and AR is
held inactive in the cytoplasm. Further, when testosterone enters the cell it is converted to DHT in
the presence of a resident enzyme: 5α-reductase. After DHT conversion, inhibitory HSPs are
released and the AR undergoes a conformational change. The AR is then phosphorylated and further
translocated to the nucleus where it binds to AREs in the promoter regions and to DNA binding sites
of AR target genes. Furthermore, transcriptional initiation of target genes is facilitated in the presence
of coregulators including histone acetylases and chromatin remodeling complexes, which are
recruited after nuclear localization of AR (Heinlein & Chang 2004, Hodgson et al. 2011).
12
Androgen receptor signaling in prostate cancer
PC tumorigenesis is highly dependent on the stimulation of AR signaling by androgens during all
stages of the disease progression. Thus, AR signaling is one of the key factors in the promotion of
PC cell survival and proliferation (Chen et al. 2004, Linja and Visakorpi 2004). There are different
hypotheses concerning AR functioning during PC development, including AR reprogramming by
other transcription factors such as FOXA1 (forkhead box A) and ETS transcription factors. Both of
these transcription factors have specific binding sites located on AR binding sites. It has been
reported that FOXA1 can both suppress and induce AR signaling (Sahu et al. 2011). According to
Sahu et al. (2011), altered expression of the FOXA1 transcription factor may induce AR target gene
expression (hormonal signaling and cell proliferation), thus mediating AR signaling in PC.
Moreover, Sahu et al. (2011) observed that in the presence of FOXA1 a large percentage of AR
binding sites were masked, suggesting that FOXA1 is involved in the regulation of AR-mediated
signaling. Additionally, ETS can regulate AR binding to DNA. According to Massie et al. (2007)
and Yu et al. (2010), AR recruitment to AR DNA binding sites also enhanced ERG and ETS binding
to AR binding sites. Overall, it can be suggested that overexpression of ETS and FOXA1
transcription modulators may lead to the AR reprogramming and increased expression of oncogenes,
modulating the normal differentiation of the prostate epithelia (Sahu et al. 2011 Yu et al 2010).
The mechanism of AR activation is usually changed during PC tumorigenesis, especially in castration
resistant PC (CRPC). Androgen ablation (anti-androgen) therapy and total androgen blockade
(surgical or chemical castration combined with anti-androgen treatment) are widely used treatments
for CRPC patients. Due to the withdrawal of androgens, prostate cells have to adapt to very low
levels of androgens, which they do via different mechanisms. In advanced PCs, mainly in CRPC
cases, AR signaling activation occurs by several different mechanisms, including AR amplification,
which has been shown to occur in around one-third of CRPC patients (Visakorpi et al. 1995a).
Moreover, AR activation has been shown to occur by other steroid hormones or anti-androgens such
as progesterone and estrogens due to mutations in the AR gene (Taplin 2007). In addition,
intratumoral steroidogenesis (e.g. DHT is produced from cholesterol or dehydroepiandrosterone
(DHEA) has been reported to activate AR (Cai and Balk 2011). AR has also been shown to be
activated through alternative splicing of the AR gene (Sun et al. 2010). Overall, altered expression
levels of AR co-activators and co-repressors can lead to AR activation (Gregory et al. 2001).
AR activity increases in correlation with an increase in the number of gain-of-function mutations.
However, AR mutations are rare in untreated tumors and it has been observed that 10-30% of anti-
androgen treated patients have AR mutations (Linja and Visakorpi 2004). Moreover, an increasing
amount of evidence suggests that truncated isoforms of AR splice variants (which lack LBD) lead to
ligand-independent activation of AR which further leads to formation of constitutively active AR in
CRPC patients. In addition, due to the altered structure of AR splice variants there is a high
possibility that the interaction with coregulators and binding to AREs may be altered (Sun et al.
2010). AR coregulators such as NCOA1, 2, and 3 regulate histone methylation as well as acetylation
leading to transcriptional initiation and AR activation (Heinlein and Chang 2004). AR corepressors
including NCOR1 and NCOR2 promote chromatin condensation, resulting in inhibition of the
transcriptional activation of AR (Taylor et al. 2010). Thus, loss of AR corepressors and gain of AR
coregulators may stimulate the development of CRPC tumor progression in low-hormone
microenvironments.
13
1.2.6 Localized prostate cancer
PC growing within the prostate gland which has not extended through the prostate capsule is known
as localized PC. The clinical stages that best define localized PC are T1-T2 (Table 1). Thus, the
patients that belong to low or intermediate risk groups most commonly have localized PC.
Nowadays, an increasing number of localized, slow growing, well differentiated PCs are diagnosed
due to a widespread increase in the use of PSA testing (Klotz 2010). The clinical challenge is now to
avoid overtreatment among the patients who have been diagnosed with localized, slow growing PC.
Often the most suitable treatment for patients diagnosed with localized slow growing PC is active
surveillance (close monitoring of PSA levels and prostate tissue morphology). Furthermore, the risk
of prostate tumor progression is low (approximately 15-20 years) among nearly 50% of the patients
who have been diagnosed with localized slow growing PC (Heidenreich et al. 2011, Klotz 2010).
1.2.7 Metastatic prostate cancer
PC can either metastasize locally or to distant organs. PC is referred to as “locally advanced” when
the prostate tumor has broken the prostate capsule (clinical stage T3a) and spread just outside of the
prostate gland, to the seminal vesicles for example (clinical stage T3b). Moreover, after invading the
seminal vesicles, the prostate tumor may spread into nearby structures including bladder, rectum,
muscles, and pelvic cavity. Clinical stages T3 and T4 commonly refer to locally advanced PC.
Contrastingly, in advanced stage of PC (clinical stage T4) distant metastases are found most
commonly in the bones, liver, or lungs. According to Bubendorf et al. (2000), over 90% of advanced
PC tumors metastasize to bone, around 40-50% metastasize to the lungs, and 25-30% metastasize to
the liver. PC bone metastases can be also called PC osteoblasts due to their ability to form bone
tissue (Ibrahim et al. 2010). Still, the molecular mechanisms of the crosstalk between metastasized
PC cells and the cells involved in the bone formation (osteoblasts, osteoclasts, and immune cells)
remain to be investigated.
1.2.8 Castration-resistant prostate cancer
The growth of PC is a highly androgen dependent process. Indeed, the key treatment for metastatic
PC is androgen deprivation therapy by way of chemical or physical castration. It has been shown that
approximately 80-90% of metastatic PC patients have favorable initial biochemical responses after
castration therapy, including decreased levels of PSA and serum markers in the blood. However,
cancer cells are able to adapt to low levels of androgens by utilizing alternative signal transduction
mechanisms including steroidogenesis, AR reactivation (AR amplification, LBD mutations in AR), as
well as bypass pathways (overexpression of anti-apoptotic proteins such as BCL-2) (Attard et al.
2006). Moreover, castration-resistant PC (CRPC) commonly develops within 18-24 months of initial
castration therapy (Damber and Aus 2008) and, according to Halabi et al. (2009), survival after
CRPC progression is only around 20 months. Overall, castration therapy is not curative and one of
the major clinical challenges is to develop better therapies against CRPC which are curative.
14
1.2.9 Traditional treatments
Active surveillance
Active surveillance has been shown to be a safe and promising treatment option for low risk PC
patients who harbor small, slow-growing, well differentiated prostate tumors with good prognosis
(Table 1), as well as for older patients with limited life expectancy (Klotz 2010) whose cause of
death is likely to be unrelated to their PC. During active surveillance PC progression is followed by
periodic PSA assessments (every 3-6 months). Prostate tissue biopsies are obtained and analyzed
every 3-5 years (Heidenreich et al. 2011, Klotz 2010). Indeed, the purpose of active surveillance is to
avoid overtreatment among low risk patients as long as possible, until the PC shows signs of
progression; defined by a PSA level increase to over 10 ng/ml and GI progression to ≥ 7.
Radical prostatectomy
Radical prostatectomy (RP) is the surgical excision of all or part of the prostate gland and seminal
vesicles. After prostatectomy, PSA should be totally absent from the blood, therefore PSA levels are
regularly followed after RP treatment (PC is deemed to have recurred if PSA levels increase above
0.5 ng/ml after prostatectomy). RP is commonly used as a curative treatment for low or intermediate
risk (Table 1) PC patients diagnosed with clinically localized organ-confined cancer (not broken
through the prostatic capsule) with more than a 10 year life expectancy. In contrast, potential benefits
decrease after radical prostatectomy among high-risk PC patients who have locally advanced or
advanced prostate cancer (tumor has already spread through the prostatic capsule) (Heidenreich et al.
2011, Kumar et al. 2006). It has been shown that the effects (PSA level decrement) are good after RP
based upon long-term cancer follow-up and high cancer-specific survival rates. Progression-free
survival has been shown to be improved significantly among high-risk PC patients who have been
treated with adjuvant radiation therapy immediately after RP. It has not yet been concluded if pre- or
postoperative neoadjuvant endocrine therapy would significantly improve progression free survival
after RP (Heidenreich et al. 2011, Kumar et al. 2006).
Radiation therapy
Radiation therapy is used as a treatment for localized PC as well as advanced PC. Radiation therapy
can be either external (external beam radiation therapy (XRT)) or internal (brachytherapy). During
XRT, a curative dose of targeted radiation is delivered into the prostate in order to kill the cancer
cells without causing harm to the surrounding tissues. In low-dose-rate brachytherapy radioactive
seeds are implanted permanently to prostatic tissue under transrectal ultrasound guidance, whereas in
high-dose-rate brachytherapy the implantation of seeds is temporary and it is usually combined with
XRT. (Heidenreich et al. 2011, Haas and Sakr 1997, Peeters et al. 2006).
Endocrine therapy (GnRH, antiandrogens, MAB)
PC patients who are treated with endocrine therapy most commonly have either locally advanced or
metastasized disease. Already in 1941, Huggins and Hodges observed that PC progression is strongly
related to testosterone action, while at the same time making the first observations about the clinical
and therapeutic effects of surgical castration and endocrine therapy for advanced PC (Huggins and
Hodges, 1941). Nowadays, endocrine therapy is a common treatment for advanced and metastatic
PC, or for PC that has recurred after primary treatment (prostatectomy or radiation therapy) (Mottet
et al. 2011). Since testosterone is strongly associated with PC tumorigenesis, the main purpose of
endocrine therapy is to silence and eliminate its mechanism of action. Today, several different
15
endocrine therapies for advanced or recurred PC have been used, such as GnRH agonist therapy
(inhibits testosterone synthesis from testes due to reduced amount of luteinizing hormone (LH) after
inhibition of GnRH receptor function), antiandrogen therapy (inhibits AR activation by preventing
the binding of testosterone and DHT to AR), and maximum androgen blockage (MAB) (combined
inhibition of testosterone synthesis from testes and AR activation by testosterone and DHT using
both GnRH and anti-androgens). Overall, endocrine therapy is initially highly effective; however
endocrine therapies are never curative due to the resistance development to AR-signaling targeting
agents (Fitzpatrick et al. 2008).
1.3 TMPRSS2:ETS TRANSLOCATIONS
1.3.1 The discovery of TMPRSS2:ETS translocations in prostate cancer
As mentioned earlier, gene expression alterations, e.g. loss of function mutations in TSGs and gain-
of-function mutations in oncogenes are the most common hallmarks for malignant transformation of
the normal cellular tissue. Most often, such mutations result from chromosomal translocations or
deletions leading to fusion formation of two different gene transcripts and further altered and
modified gene expression. The most common recurrent disease specific chromosomal
rearrangements and gene fusions have been mainly found to be associated with hematologic
malignancies (lymphomas and leukemias) and sarcomas.
Cancer outlier profile analysis (COPA)
Over seven years ago, in 2005, Tomlins and colleagues reported an interesting discovery of gene
fusions in PC that is one of the most prevalent epithelial malignancies in the world. By analyzing
DNA microarray data with a specific unconventional bioinformatics approach called the cancer
outlier profile analysis (COPA) algorithm (described in Tomlins et al. 2005), they discovered
recurrent TMPRSS2:ETS (E-twenty six) translocations in PC. They performed COPA analysis in
Oncomine 3.0 with 132 different gene expression data sets (10,486 microarray experiments). Instead
of using cancer samples and analyzing them with common analytical methods to search for
activation of genes (e.g. t test) they used COPA for the search of genes that have marked
overexpression profiles (outlier profiles) in specific cancer types. Furthermore, Tomlins and co-
workers found that ERG (21q22.3) and ETV1 (7p21.2), which encode ETS oncogenic transcription
factors, had the strongest outlier profiles in several data sets observed in PC and the respective genes
were among the top 10 outlier genes in six different PC profiling studies.
Moreover, Tomlins et al. (2005) found that ETV1 and ERG were overexpressed in 40%-70% of PC
cases. RNA was obtained from PC samples and analyzed in exon-walking quantitative RT-PCR.
They observed that 3´ ends of ETV1 and ERG were constantly overexpressed while 5´ regions of
respective genes were missing. Furthermore, by utilizing different molecular analyses Tomlins et al.
discovered that the 5´ regions of ETV1 and ERG were consistently replaced with 5´
transmembrane protease serine 2, TMPRSS2 (a prostate-specific androgen regulated gene). The
prevalence of recurrent gene fusion at the chromosomal level was investigated by high-throughput
fluorescent in situ hybridization (FISH) assays, and was confirmed to occur at the same frequencies.
Thus, it was shown that the increased expression of ETV1 and ERG genes found in PC occur due to
the structural rearrangements of transmembrane serine 2, 5´ TMPRSS2 to 3´ ETV1 or 3´ ERG
(Tomlins et al. 2005).
16
Other novel 5´ and 3´ fusion gene partners
Since the first discovery of TMPRSS2:ERG and ETV1 gene fusions by Tomlins et al. in 2005,
various different novel 5´ and 3´ gene partners have been found to be associated in PC.
TMPRSS2:ERG and TMPRSS2:ETV1 are the most common gene fusions and translocations
associated in PC, and have been found to occur in approximately 40-70% and 2-30% of PC cases,
respectively. Furthermore, fusions of 5´ TMPRSS2 to 3´ ETV4 and 3´ ETV5 have been found in 2-5%
and < 1% of PC cases, respectively (Shah and Chinnaiyan 2009). Helgeson et al. (2008) reported that
other fusions such as HERV-K (11q22): ETV1 (7p21), SLC45A3 (1q32): ETV1 (7p21), SLC45A3
(1q32): ETV5 (3q28), Cl5ORF21 (1q25): ETV1 (7p21) and HNRPA2B1 (7p15): ETV1 (7p21) are
involved in the molecular network of PC at significantly lower levels (<1%). Moreover, in the same
year Hermans and colleagues observed that additional KLK2 (19q13): ETV4 (17q21) and CANT1
(17q25): ETV4 gene fusions occurred at similar frequencies (<1%) in PC (Hermans et al. 2008).
However, the molecular function of respective fusions remains to be investigated.
1.3.2 TMPRSS2 (Transmembrane protease, serine 2)
Transmembrane protease serine 2 is a type II transmembrane protein encoded by the TMPRSS2 gene
and located on 21q22.2 in humans. TMPRSS2 protein contains five types of domains, a protease
domain, a scavenger receptor cysteine-rich domain, a receptor class A lipoprotein domain, type II
transmembrane domain, and a cytoplasmic domain (Paoloni-Giacobino et al. 1997). TMPRSS2
belongs to a serine protease gene family, the members of which have crucial roles in different
physiological and pathological processes such as in digestion, blood coagulation, remodeling of
tissues, invasion of tumor cells, inflammatory responses, and apoptosis. Furthermore, TMPRSS2 has
been shown to be expressed at low levels in liver, kidney, pancreas, lung, and colon (Vaarala et al.
2001). TMPRSS2 is highly expressed in both normal prostate and PC cells and contains androgen
responsive elements (AREs) in its promoter region. It has been reported (Afar et al. 2001) that the
expression of TMPRSS2 is increased by androgens in PC cells and decreased in androgen
independent PC (Afar et al. 2001, Lin et al. 1999).
1.3.3 ERG (v-ets erythroblastosis virus E26 oncogene homolog (avian))
ERG (v-ets erythroblastosis virus E26 oncogene homolog (avian)) is an oncogene and is located on
22q22.3. ERG belongs to the family of ETS (E-twenty six) coding transcription factors. ETS family
encodes for transcription factors regulating the expression of genes that are involved in cellular
proliferation and differentiation, inflammation, embryonic development, angiogenesis (platelet
adhesion, stem cell maintenance and hematopoiesis) and apoptosis (Seth and Watson 2005, Wang et
al. 2011). ERG contains conserved ETS DNA-binding domain and protein-protein interaction
domain (PNT). Moreover, ERG has been shown to regulate the expression of genes involved in PC
progression pathways such as DNA damage, cell invasion and proliferation, epithelial to
mesenchymal transformation (EMT) as well as cellular differentiation and epigenetic control
(Sreenath et al. 2011). In addition, ERG gene has been shown to be associated with chromosomal
translocations leading to the formation of fusion gene product with different genes. The most
common ERG related gene fusions have been observed in PC (TMPRSS2:ERG), Ewing’s sarcoma
(EWS:ERG) and acute myeloid leukemia (FUS:ERG).
17
1.3.4 TMPRSS2:ERG fusion
The frequency of TMPRSS2:ERG fusions
As mentioned earlier, TMPRSS2:ERG is the most dominant fusion and according to different FISH,
array comparative genomic hybridization (aCGH) and RT-PCR assays it is detected in approximately
40-70% of clinical PCs (Tomlins et al. 2005, Perner et al. 2006, Mosquera et al. 2008). In addition,
TMPRSS2:ERG fusions have been found in approximately 10-20% of high HGPIN precursor lesions
and in 29%-69% of advanced or hormone refractory PCs, but not in benign epithelial cells or stromal
cells. This suggests that TMPRSS2:ERG fusion is an early event in PC progression.
TMPRSS2:ERG fusion is formed either by chromosomal translocation (found commonly in early
stages of PC) or interstitial deletion (found commonly in aggressive forms of PC) on a single copy of
chromosome 21 (Perner et al. 2006, Mosquera et al. 2008). Both of the TMPRSS2 and ERG genes
are located on chromosome 21q and the distance between AR regulated TMPRSS2 and ERG
oncogene is approximately 3 mega bases (MB). The relatively short distance between these genes on
the same chromosome could explain the higher frequency of TMPRSS2:ERG fusions in PC
compared to other observed fusions of different 5 and 3 ETS partners.
TMPRSS2:ERG transcript variants
Different PC-related TMPRSS2:ERG fusion transcripts have been characterized by Rapid
Amplification of cDNA ends (RACE) assays and RT-PCR assays (Tu et al. 2007). Most commonly,
a transcript variant of TMPRSS2 exon 1 or 2 is fused to ERG exon 2, 3, 4 or 5. The fusion of
TMPRSS2 exon 4 or 5 to ERG exon 4 or 5 is less frequent. Overall, nineteen different alternatively
spliced transcript variants of TMPRSS2:ERG have been found. The exons of 5´ TMPRSS2 involved
in the formation of the fusion transcript are usually non-coding and are rarely translated into protein
products. Furthermore, an N-terminal truncated form of the ERG protein is the protein which is
commonly translated by all of the fusion transcripts (Tu et al. 2007). However, there are also fusion
protein transcript variants such as TMPRSS2 exon 2:ERG exon 4 expressing true fusion protein
product (both the 5 TMPRSS2 exons and ERG exons are translated). It may be possible that most
of the protein products have similar functions as wild-type ERG. However, the biological association
of N-terminal truncated ERG proteins and true fusion products encoded by TMPRSS2:ERG transcript
variants in PC progression remains to be further determined (Tu et al. 2007).
18
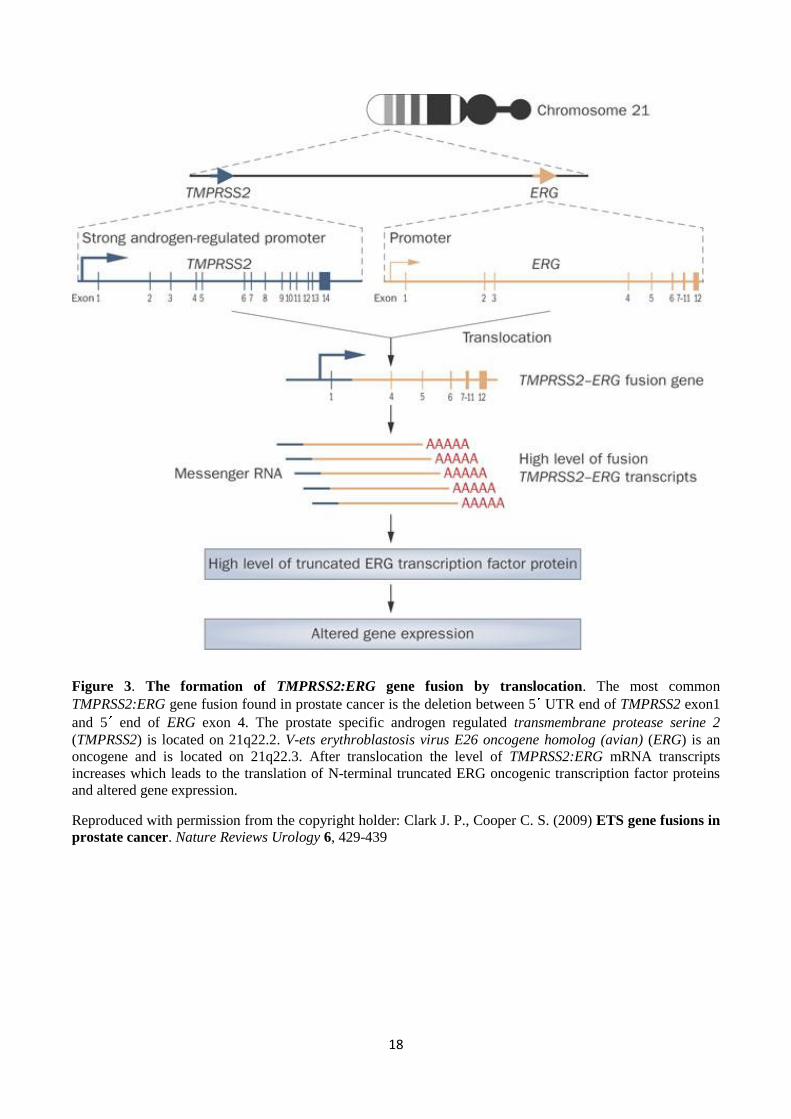
Figure 3. The formation of TMPRSS2:ERG gene fusion by translocation. The most common
TMPRSS2:ERG gene fusion found in prostate cancer is the deletion between 5 UTR end of TMPRSS2 exon1
and 5 end of ERG exon 4. The prostate specific androgen regulated transmembrane protease serine 2
(TMPRSS2) is located on 21q22.2. V-ets erythroblastosis virus E26 oncogene homolog (avian) (ERG) is an
oncogene and is located on 21q22.3. After translocation the level of TMPRSS2:ERG mRNA transcripts
increases which leads to the translation of N-terminal truncated ERG oncogenic transcription factor proteins
and altered gene expression.
Reproduced with permission from the copyright holder: Clark J. P., Cooper C. S. (2009) ETS gene fusions in
prostate cancer. Nature Reviews Urology 6, 429-439
19
1.3.5 The formation of TMPRSS2:ERG fusion
The genomic events leading to the formation of gene fusions are of great interest to researchers in the
hopes of find new possible molecular drug targets for the treatment of cancer. The molecular
mechanisms leading to the formation of TMPRSS2:ERG gene fusions are under investigation.
Several studies have been done and different trigger points that may be associated in the fusion event
have been found. Liu et al. (2006) found consensus sequences homologous to the human restriction
endonucleases (Alu-Sq and Alu-Sp subfamily) after fine-mapping the intronic deletion breakpoint
regions of ERG and TMPRSS2. Moreover, Liu and colleagues concluded that there is a correlation
between the presence of TMPRSS2:ERG gene fusions and the respective restriction endonuclease
sequences, which may be one of the possible factors leading to fusion formation by deletion at
21q22.2 - 21q.22.3. In 2009 Luedeke and colleagues performed genome-wide linkage studies of
familial PC and found a significant correlation between the polymorphism in DNA repair genes and
the presence of the TMPRSS2:ERG fusion gene in the familial form of PC. Moreover, they
discovered that the defects in the variants of POLI that protects chromosomal stability, and ESCO1
which is needed for sister chromatid pairing (by preventing chromosomal damage during S-phase)
may play a role in TMPRSS2:ERG fusion gene translocation event in familial PC (Luedeke et al.
2009).
Furthermore, Mani et al. (2009) studied the fusion formation using the fusion-negative LNCaP cell
line. By irradiating LNCaP cells, Mani and colleagues introduced double strand breaks into the cells
before further stimulating them with DHT. According to the results of FISH assays, Mani et al.
(2009) observed that after irradiation and stimulation of LNCaP cells with DHT, the TMPRSS2:ERG
fusion transcripts could be detected in the previously fusion-negative LNCaP cells. Haffner et al.
(2009) reported that androgen signaling stimulates the recruitment of AR and topoisomerase II beta
(TOP2B) (involved in the breaking and rejoining of two strands of duplex DNA) to the androgen
responsive genes, and TMPRSS2 and ERG regions. Moreover, they discovered that the recruitment of
AR and TOP2B leads to the formation of DNA double-strand breakpoints and TMPRSS2:ERG fusion
formation (Haffner et al. (2009).
In addition, chromosomal alterations and rearrangements occurring at an elevated rate (called
chromosomal instability) could also aid in explaining the formation of the TMPRSS2:ERG fusion
gene in PC. A well known TSG called phosphatase and tensin homologue, PTEN, is commonly
deleted in PC. This genomic aberration leads to increased chromosomal instability through activation
of the cell cycle stimulating protein kinase, AKT. The deletion of PTEN further leads to
phosphorylation and inactivation of Chk1, which is known to prevent cell cycle progression after
DNA damage. Thus, it may be argued that PTEN deficiency could delay the DNA damage repair
process, and thus lead to the formation of TMPRSS2:ERG fusions.
1.3.6 Prostate cancer and TMPRSS2:ERG fusion
Several studies using in vivo models have reported that the overexpression of ERG due to
TMPRSS2:ERG fusion formation leads to prostate cell migration and invasion (Klezovitch et al.
2008, Tomlins et al. 2008). In the study by Tomlins et al. (2008), transgenic mice were generated to
overexpress a truncated version of ERG (ERG expression was activated by an androgen-inducible
probasin promoter) to further study the effects of ERG. In total, 3 of 8 respective transgenic mice
developed PIN by 12-14 weeks of age. This study was supported by Klezovitch et al. (2008), who
showed that high levels of ERG (under the control of probasin promoter) lead to the formation of
murine PIN (mPIN) by five to six months of age. Furthermore, they observed that transgenic mice
20
overexpressing ERG at lower levels (but still at significantly higher levels than normal ERG
expression) developed mPIN by 10-12 months of age. Furthermore, the basal cell layer of the
prostate gland was observed to be disrupted in the ERG-overexpressing mice, which could be a
potential early sign of PC development. However, none of the studies reported malignant tumors of
the prostate, indicating that TMPRSS2:ERG fusion alone may only induce the transformation of the
prostate epithelium.
Different in vivo studies have shown that there is a co-operation between phosphatase and tensin
homologue (Pten) inactivation and TMPRSS2:ERG expression during the PC tumorigenesis. It has
been shown that transgenic mouse expressing only TMPRSS2:ERG fusion did not develop HGPIN
lesions or prostate tumors. However, it has been reported that when the respective fusion transgenic
mouse was crossed with either a Pten-deficient mouse or a mouse that had high Akt (serine/threonine
specific protein kinase) activity, the offspring developed HGPIN preneoplasia but PC progression
was not observed (King et al. 2009). Similar results with haploinsufficient Pten or Pten knockdown
mice overexpressing ERG under the control of an androgen-inducible probasin promoter have been
observed (Carver et al. 2009). However, Carver et al. (2009) observed PC progression in the
offspring. In addition, they demonstrated that Pten haploinsufficiency or increased activity of Akt
leads to increased cell proliferation in PC cell lines, whereas cell migration is increased due to ERG
expression (Carver et al. 2009). Thus, it can be assumed that development of HGPIN in prostate cells
is stimulated by the co-operation between PTEN loss, constitutively activated AKT, and
TMPRSS2:ERG fusion (Figure 4). In addition to in vivo animal models, several PC cell culture
models have been designed to study the biological role of ERG overexpression in vitro. The
invasiveness of VCaP cells, which are known to express AR and are TMPRSS2:ERG fusion positive,
was significantly inhibited after knockdown of ERG by small interfering RNA (siRNA) (Tomlins et
al. 2008). Moreover, Tomlins et al. (2008) reported that cellular invasiveness of PC cells was
inhibited after blockage of urokinase plasminogen activator (uPa) and plasminogen activator
pathways which are known to be associated with ERG overexpression.
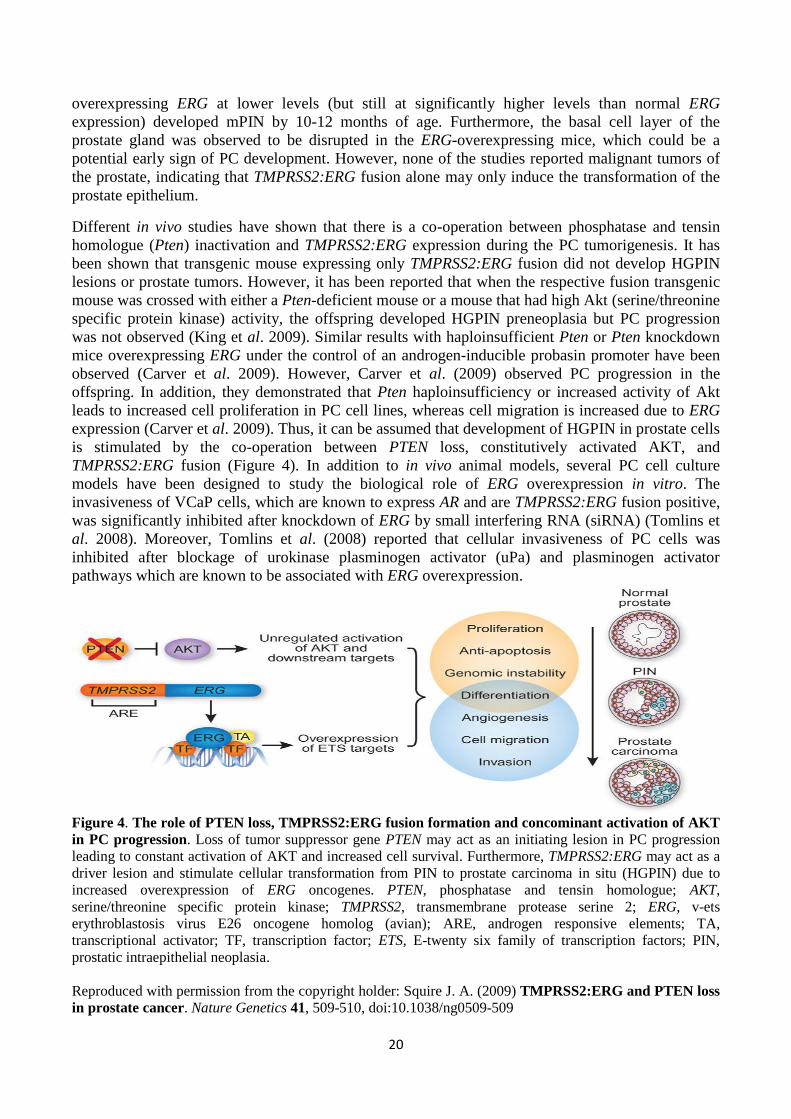
Figure 4. The role of PTEN loss, TMPRSS2:ERG fusion formation and concominant activation of AKT
in PC progression. Loss of tumor suppressor gene PTEN may act as an initiating lesion in PC progression
leading to constant activation of AKT and increased cell survival. Furthermore, TMPRSS2:ERG may act as a
driver lesion and stimulate cellular transformation from PIN to prostate carcinoma in situ (HGPIN) due to
increased overexpression of ERG oncogenes. PTEN, phosphatase and tensin homologue; AKT,
serine/threonine specific protein kinase; TMPRSS2, transmembrane protease serine 2; ERG, v-ets
erythroblastosis virus E26 oncogene homolog (avian); ARE, androgen responsive elements; TA,
transcriptional activator; TF, transcription factor; ETS, E-twenty six family of transcription factors; PIN,
prostatic intraepithelial neoplasia.
Reproduced with permission from the copyright holder: Squire J. A. (2009) TMPRSS2:ERG and PTEN loss
in prostate cancer. Nature Genetics 41, 509-510, doi:10.1038/ng0509-509
21
1.4 OTHER GENES INVOLVED IN PROSTATE CANCER PROGRESSION
1.4.1 MYC
MYC (c-MYC) is an oncogene located at the 8q24 chromosomal region. MYC is one of the commonly
amplified loci in PC (Jenkins et al. 1997, Visakorpi et al. 1995b); it encodes a transcription factor
which is crucial for the regulation of cell proliferation, cell growth, apoptosis, and stem cell renewal
(Albihn et al. 2010). MYC has been shown to be overexpressed in different types of tumors such as
in lymphomas and leukemias, hematopoietic tumors, breast, prostate, and colon cancers, as well as in
hepatocellular carcinoma and neuroblastoma (Toyoshima et al. 2012).
The MYC protein has been reported to be overexpressed in different stages of PC tumorigenesis
including HGPIN, localized primary tumors, and in advanced metastatic tumors (Jenkins et al.
1997). Moreover, MYC has been reported to have the ability to downregulate NKX3.1 TSG
expression and increase the expression of EZH2 transcriptional repressor gene, suggesting its role in
different stages of PC progression (Iwata et al. 2010, Koh et al. 2011). It has been shown that up to
70% of CRPC patients have the gain of 8q and one third of these patients have MYC amplification
(Nupponen et al. 1998a, Saramäki et al. 2001). However, amplification has not been confirmed to be
the primary mechanism for elevated MYC expression levels (Gurel et al. 2008). The gain of 8q24 is
rarely observed in localized PC but MYC is commonly overexpressed in such cases. The reasons for
MYC overexpression remain unknown but it has been suggested that inactivation of APC and the
downregulation of FOXP3 could be associated with MYC upregulation (Kang et al. 2004, Wang et
al. 2009a).
1.4.2 NKX3.1
One of the most frequently observed deletions in PC is the loss of the NKX3.1 locus at 8p21 region.
NKX3.1 is a TSG that encodes homeobox-containing transcription factor (Voeller et al. 1997).
Moreover, NKX3.1 inhibits the proliferation and differentiation of epithelial cells in the prostate and
it can be expected that cell proliferation and cell differentiation increase in the prostatic epithelia
after the deletion of the NKX3.1 locus. Further, according to Asatiani et al. (2005) NKX3.1 might be
epigenetically regulated through promoter methylation. However, mutations are rare in the 8p21
region and no additional mutations have been observed in the remaining NKX3.1 allele (Ornstein et
al. 2001, Voeller et al. 1997). In addition, Bowen et al. (2000) found that the expression of NKX3.1
is lost in advanced tumor stage as well as in hormone refractory disease. Furthermore, Lei et al.
(2006) observed that due to the deletion of PTEN, the expression level of NKX3.1 is decreased
leading to increased activity of AR and further to tumor progression.
Taken together, the facts that LOH has been observed in up to 85% of prostate adenocarcinomas and
in 60% of PIN at the 8p21 chromosomal region, and no additional mutations have been found at the
aforementioned region, it may be assumed that NKX3.1 is a haploinsufficient TSG. This assumption
can be supported by the additional studies of Abdulkadir et al. (2002) and Bhatia-Gaur et al. (1999),
in which the researchers observed that both heterozygous and homozygous knockout mice develop
hyperplasias and PIN lesions in their prostates.
22
1.4.3 PI3K pathway and PTEN
PTEN is a TSG located on the chromosome 10; it is involved in the regulation of cell signaling
pathways by targeting the proteins that regulate cell growth and survival. According to Zhang and
Yu (2010), PTEN is among the most commonly inactivated TSGs in many human cancers. Kwabi-
Addo et al. (2001) and Trotman et al. (2003) showed that functional loss of just one PTEN allele in
mice confers to advantage for PC growth.
Moreover, PTEN mutations have been observed in around 40% of localized PC cases (Bismar et al.
2011, Taylor et al. 2010), whereas in advanced PCs the incidence of PTEN deletions is much higher
being around 70-80% (Liu et al. 2009, Taylor et al. 2010). Recently, Krohn et al. (2012) analyzed
several hormone-naïve and hormone-refractory tissue microarray (TMA) samples by FISH and
observed that PTEN deletions are significantly associated with high Gleason grade, advanced tumor
stage (pT), presence of ERG gene fusion, lymph node metastasis, CRPC disease, and early PSA
recurrence.
PI3K is a phosphoinositide 3-kinase that regulates the conversion of phosphatidylinositol (4,5) bis-
phosphate (PI(4,5)P2) to PI(3,4,5)P3. PI(3,4,5)P3 is involved in the activation of serine/threonine
specific protein kinase (AKT) whose activity facilitates cell cycle progression, protein synthesis, cell
growth and cell survival (Cantley 2002, Sulis and Parsons 2003). The activity of PI3K is negatively
regulated by PTEN lipid phosphatase. Thus, inactivation of PTEN in somatic cells during PC by
LOH or complete loss of PTEN increases the levels of PI(3,4,5)P3, leading to enhanced PC cell
growth as well as enhanced PC cell survival (Uzoh et al. 2009).
Moreover, according to Carver et al. (2011) and Mulholland et al. (2011) there is a linkage between
Akt, PI3K and AR signaling. Indeed, they observed that AR inhibition leads to the activation of Akt
signaling and in the similar manner PI3K inhibition activates AR signaling. Thus, the inhibition of
one of the signaling pathways activates the other pathway leading to tumor cell survival. Further,
Carver and colleagues found cancer regression in Pten-/- PC mice after inactivation of PI3K/Akt and
AR signaling pathways.
1.4.4 EZH2
EZH2 is a transcriptional repressor gene that belongs to polycomb group family. EZH2 is located at
7q36 chromosomal region and it has been shown to regulate cell proliferation in vivo – especially in
metastatic prostate carcinomas (Varambally et al. 2002). According to Yu at al. (2007), gain-of-
function mutation of EZH2 could be one of the reasons for epigenetic silencing of TSGs during PC
development leading to poor prognosis of the patients. In a recent study, Yu et al. (2010) observed
that TMPRSS2:ERG fusion is associated with the regulation of EZH2 signaling. They found that the
epigenetic silencing mediated by EZH2 is increased due to increased EZH2 gene expression and
decreased EZH2 target gene expression by ERG.
1.4.5 TP53
One of the most commonly inactivated genes in human cancers is a tumor suppressor TP53. TP53
encodes tumor protein p53: a homotetrameric transcription factor. Tumor protein p53 is a crucial
regulator of the cell cycle; involved controlling the transition from G1 phase to S phase. Further,
TP53 is activated under conditions conducive to DNA damage, such as during hypoxia, irradiation,
and oncogene activation or during genotoxic damage leading to cell cycle arrest (DNA repair) or
induction of apoptosis (Prives 1998, Morris 2002). Mutated p53 protein can be detected by
23
immunohistochemistry due to nuclear accumulation caused by prolonged half-life. According to
Visakorpi et al. (1992), Bookstein et al. (1993) and Navone et al. (1993), early localized PC cases
with TP53 gene mutations are rare. In contrast, mutations in TP53 have been observed in about 20-
40% of hormone-refractory or metastatic prostate carcinoma cases. In addition, nuclear accumulation
of mutated TP53 has been reported to be associated with poor prognosis (Visakorpi et al. 1992).
1.5 CIRCULATING TUMOR CELLS (CTCs) IN PROSTATE CANCER
The molecular nature of PC metastasis remains to be elucidated. The aberrant migration of PC cells
to the blood and to distant organs in the body is accelerated due to the induction of epithelial to
mesenchymal transition (EMT), increasing the development of invasive epithelial cells. During
EMT, prostate tumor cells acquire mesenchymal cell morphology and decrease their epithelial
characteristics, which lead to phenotypic variability of tumor cells. Overall, decreased expression of
integrins (key regulators of the signal transduction exchange between extracellular matrix (ECM)
and cells), repression of E-cadherin (a cell adhesion molecule) expression, as well as elevated
expression of N-cadherin and increased degradation of the surrounding stroma by proteases are
involved in the PC metastatic progression and CTC invasion. (Gravdal et al. 2007, Jin et al. 2011).
Most often, circulating prostate tumor cells metastasize into bone marrow (BM). Moreover, when
CTCs extravasate into BM and form micrometastases in bones they are called as disseminated tumor
cells (DTCs). However, not all disseminated tumor cells from primitive tumor site are capable of
forming metastases, suggesting that metastasis can be a relatively inefficient process (Chambers et
al. 2002). Moreover, it has been reported that the immune system, e.g. natural killer cells, can detect
tumor cell antigens and destroy tumor cells in the circulation and in the bone marrow (Zamai et al.
2007). Several different techniques have been developed for the capture, isolation and
characterization of CTCs according to their phenotypic properties.
1.5.1 The definition of CTC
CTCs can be found either in peripheral blood (PB) or bone marrow (BM). They are relatively rare
events, occurring at levels as low as one CTC per 106 or 10
7 leukocytes in blood. Thus, a high degree
of assay sensitivity is required in order to detect these rare events in PB. Moreover, the assay has to
be highly specific in order to detect as many true positive events as possible and the fewest false
positive and false negative events. Commonly used threshold values for CTC count in blood of PC
patients have been shown to be controversial; standard definitions of unfavorable and favorable CTC
counts have been reported to be ≥5 CTCs/7.5ml and <5 CTCs/7.5ml, respectively. (de Bono et al.
2008).
The DNA, RNA or protein surface markers of CTCs are commonly used to detect these rare CTCs in
PB and BM. Multiple PCR-based methods and immunohistochemical methods can be used to
identify captured CTCs. After identification, CTCs can be potentially used as biomarkers to predict
patient outcome and to predict the response to a specific therapy (e.g. pre- and postoperative CTC
count). Additionally, CTCs can be used as response-indicators to confirm if the specific treatment
has led to a pharmacologic or physiologic response after therapy, such as a decline in PSA level in
PB after PC therapy, or if the therapy has resulted in treatment resistance such as treatment failure or
PC progression. (Danila et al. 2011)
24
1.5.2 Current methods for the detection of CTCs
An increasing number of molecular biological assays has been developed to enumerate, isolate, and
characterize CTCs from blood. However, the development of the most analytically valid assay for
clinics has shown to be difficult. As mentioned earlier, during EMT, tumor cells acquire
mesenchymal characteristics and lose their epithelial characteristics. Thus, the essential step of CTC
detection from blood is to use specific cell surface markers for phenotypic differentiation between
epithelial and hematopoietic tumor cells. Before CTCs can be identified by nucleic acid-based
methods, e.g. RT-PCR, CTCs have to be captured and enriched from blood, which can be done via
different methods. Initially, CTCs are separated from blood by immune affinity methods (e.g.
magnetic beads and immunoseparation) based on their specific cell surface markers, for example,
epithelial cell adhesion molecule, EpCAM. Alternatively, CTCs can be enriched from blood by cell
adhesiveness or size filtration methods. After enrichment, CTCs are labeled with fluorescent
antibodies specific for epithelial cells (CK 8, 18, and 19), leukocytes (CD45) and the nuclei of tumor
cells (DAPI). (Jones et al. 2013).
1.5.2.1 Immunology based methods
Immunological techniques are used to enrich and detect CTCs based on the expression of epithelial
markers such as epithelial cell adhesion molecules (EpCAM) or cytokeratins (CK) on the surface of
CTCs. The strength of immunological assays is that mRNA from dead cells as well as free mRNA
can be detected and thus differentiated from living mRNA. However, compared to RT-PCR methods,
immunological methods have lower sensitivity and specificity.
CellSearch
The CellSearch (Veridex LLC) system is currently the only CTC detection assay that is approved by
USA Food and Drug Administration (FDA) for the detection of metastatic prostate cancer, breast
cancer, and colorectal cancer and for the prediction of patients’ prognosis. The enrichment step and
immunostaining of CTCs is combined in the CellSearch system. CellSearch is based on the isolation
(by magnetic separation) of EpCAM expressing tumor cells (Figure 5) (Danila et al. 2007).
In the beginning of the assay, a patient’s blood sample is mixed with anti-EpCAM coated magnetic
beads in order to positively select EpCAM expressing cells. To further identify specific tumor cells
of interest, the sample is incubated with anti-cytokeratin antibodies such as CK 8, 18 or 19 and anti-
CD45 antibodies to eliminate the presence of leukocytes. Furthermore, the nuclei of enriched tumor
cells are labeled with fluorescent nucleic acid dye (4, 2-diamidino-2-phenylindole dihydrochloride,
DAPI) in order to visualize the cell population of interest on the automated fluorescent microscopy.
Thus, after enrichment and capture of CTCs they are identified as EpCAM+-CD45
--CK
+-DAPI+. The
CellSearch system provides accurate information of the quantity of CTCs present in the blood
sample according to the specificity of EpCAM, CK and DAPI antibodies. However, as mentioned
before, the epithelial characteristics of tumor cells decrease during EMT, which may lower the
detection of metastatic CTCs when using the CellSearch assay (Danila et al. 2007, Jones et al. 2013).
Circulating Tumor Cell (CTC)-Chip
CTC-Chip is a microfluidic platform containing an array of 78 000 microposts coated with anti-
EpCAM antibodies. The blood sample is processed through the CTC-chip in order to obtain
EpCAM-expressing cells on the microfluidic platform. Thus, EpCAM expressing CTCs bind to
microposts, while anuclear red blood cells and nucleated leukocytes are washed away. Following
25
that, the CTC-chip is washed in order to remove leukocytes. Captured CTCs are then fixed and
immunostained with specific antibodies – such as CK and DAPI – for better identification of
epithelial cells. Finally, the cells are analyzed with fluorescence microscope (Figure 5). One of the
major advantages of CTC-Chip assay is that several different gene expressions can be studied
simultaneously (array technique). (Stott et al. 2010).
MagSweeper
MagSweeper system is also based on the immunomagnetic separation of EpCAM positive circulating
epithelial cells (CepC) from blood. A blood sample is incubated with magnetic beads which are
coated with anti-EpCAM antibodies in specific wells. Further, the robotically guided magnetic rod
covered with plastic sheath is swept through the capture well that contains the EpCAM positive
CePCs. After that EpCAM-coated antibody CepCs are captured to plastic sheath and unbound cells
are washed away. Finally magnetic rod is disengaged from the nonadherent plastic covers in new
well containing buffer solution and the release of EpCAM labeled CepCs is stimulated with external
magnetic beads which are located under the wells. One of the advantages of MagSweeper assay is
that after incubating the blood sample with anti EpCAM antibodies, no other handling of the blood
sample is required, leading to higher purity of the CTCs of interest and reliable results. Moreover, in
the MagSweeper assay individual CTCs can be extracted based on their physical properties (Talasaz
et al. 2008). The MagSweeper assay has been mainly used for the detection of CepCs in breast
cancer (Figure 5).
Functional assays
Epithelial ImmunoSPOT (EPISPOT)
Epithelial immunospot is based on the detection of viable cells after negative selection of CD45
cells. A blood sample is mixed with antibody complexes which recognize unwanted cells, such as
CD45 and Glyco A on red blood cells. After negative selection of CD45 and red blood cells, the
blood sample is centrifuged by the Ficoll density gradient method in order to obtain the target tumor
cells. CTCs or DTCs are cultured on an antibody-coated membrane that captures the secreted
proteins. Secondary fluorochrome-labelled antibodies are used to detect viable DTCs or CTCs after
48 h of ex vivo cultures based on the secretion of proteins such as PSA and FGF2 (a stem cell
fibroblast growth factor 2). (Alix-Panabières et al. 2012) (Figure 5).
Collagen Adhesion Matrix (CAM)
During CTC metastasis, tumor cells are commonly able to invade collagenous matrices. A collagen
adhesion matrix assay is used for the separation of CTCs based on their invasive phenotype in vitro.
In the beginning of the reaction, CTCs are separated from peripheral blood by mixing blood cells
with fluorescently labeled collagen adhesion matrix fragments (CAM+). The unbound cells are
thenwashed away. Those CTCs which are capable of ingesting CAM+ are confirmed to be tumor
cells after specific immunostaining with CK marker Epi+. Thus, CTCs are separated from
leukocytes, since leukocytes do not express Epi+ cytokeratin markers. CTCs are identified as CAM+-
Epi+-CK
+-CD45
-. In order to obtain mononucleated cells (MNC) from the blood, CAM+ expressing
CTCs are centrifuged by Ficoll density gradient centrifugation. Subsequently, MNCs are seeded to a
fluorescently-labeled collagen matrix, and non-adherent cells are washed away. Thus, more viable
aggressive types of CTCs can be detected and separated by CAM assay (Paris et al. 2009) (Figure 5).
However, CTC detection is based solely on their functional properties, meaning limited numbers of
CTCs (mainly metastasized CTCs) are able to be detected.
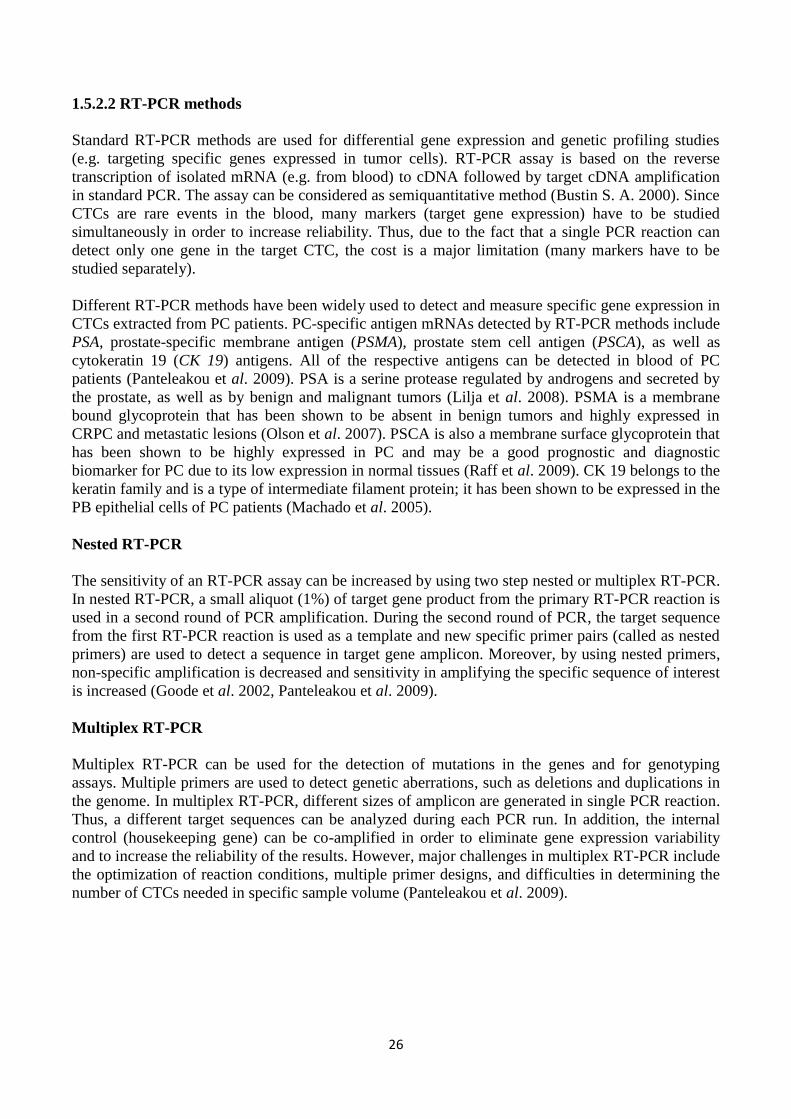
26
1.5.2.2 RT-PCR methods
Standard RT-PCR methods are used for differential gene expression and genetic profiling studies
(e.g. targeting specific genes expressed in tumor cells). RT-PCR assay is based on the reverse
transcription of isolated mRNA (e.g. from blood) to cDNA followed by target cDNA amplification
in standard PCR. The assay can be considered as semiquantitative method (Bustin S. A. 2000). Since
CTCs are rare events in the blood, many markers (target gene expression) have to be studied
simultaneously in order to increase reliability. Thus, due to the fact that a single PCR reaction can
detect only one gene in the target CTC, the cost is a major limitation (many markers have to be
studied separately).
Different RT-PCR methods have been widely used to detect and measure specific gene expression in
CTCs extracted from PC patients. PC-specific antigen mRNAs detected by RT-PCR methods include
PSA, prostate-specific membrane antigen (PSMA), prostate stem cell antigen (PSCA), as well as
cytokeratin 19 (CK 19) antigens. All of the respective antigens can be detected in blood of PC
patients (Panteleakou et al. 2009). PSA is a serine protease regulated by androgens and secreted by
the prostate, as well as by benign and malignant tumors (Lilja et al. 2008). PSMA is a membrane
bound glycoprotein that has been shown to be absent in benign tumors and highly expressed in
CRPC and metastatic lesions (Olson et al. 2007). PSCA is also a membrane surface glycoprotein that
has been shown to be highly expressed in PC and may be a good prognostic and diagnostic
biomarker for PC due to its low expression in normal tissues (Raff et al. 2009). CK 19 belongs to the
keratin family and is a type of intermediate filament protein; it has been shown to be expressed in the
PB epithelial cells of PC patients (Machado et al. 2005).
Nested RT-PCR
The sensitivity of an RT-PCR assay can be increased by using two step nested or multiplex RT-PCR.
In nested RT-PCR, a small aliquot (1%) of target gene product from the primary RT-PCR reaction is
used in a second round of PCR amplification. During the second round of PCR, the target sequence
from the first RT-PCR reaction is used as a template and new specific primer pairs (called as nested
primers) are used to detect a sequence in target gene amplicon. Moreover, by using nested primers,
non-specific amplification is decreased and sensitivity in amplifying the specific sequence of interest
is increased (Goode et al. 2002, Panteleakou et al. 2009).
Multiplex RT-PCR
Multiplex RT-PCR can be used for the detection of mutations in the genes and for genotyping
assays. Multiple primers are used to detect genetic aberrations, such as deletions and duplications in
the genome. In multiplex RT-PCR, different sizes of amplicon are generated in single PCR reaction.
Thus, a different target sequences can be analyzed during each PCR run. In addition, the internal
control (housekeeping gene) can be co-amplified in order to eliminate gene expression variability
and to increase the reliability of the results. However, major challenges in multiplex RT-PCR include
the optimization of reaction conditions, multiple primer designs, and difficulties in determining the
number of CTCs needed in specific sample volume (Panteleakou et al. 2009).
27
Figure 5. Current molecular biology- and immunology -based methods for enrichment and detection of
circulating tumor cells (CTCs) in blood of prostate cancer patients. RT-PCR assays: are used to detect and
measure specific gene expression (such as PSA, PSMA, PSCA and CK 19) in CTCs of PC patients.
Immunological methods: The CTCs are enriched from blood based on the epithelial expression of EpCAM
and CK. CellSearch®: blood is mixed with EpCAM coated magnetic beads and incubated with anti-CK
antibodies and anti-CD45 antibodies to eliminate the presence of leukocytes. The nuclei of enriched tumor
cells are labeled with fluorescent nucleic acid Dapi in order to visualize the tumor cells with fluorescent
microscopy. CTC-Chip: blood is processed through the EpCAM coated micropost. EpCAM expressing CTCs
bind to microposts. CTCs are further stained with CK and Dapi. MagSweeper: blood is incubated with anti
EpCAM coated magnetic beads. EpCAM positive cells are captured by magnetic rod covered with plastic
sheath. Functional assays: EPISPOT: blood sample is mixed with antibody complexes which recognize CD45
and Glyco A on red blood cells and centrifuged by Ficoll density gradient method. DTCs/CTCs are identified
after 48 h of ex vivo cultures based on the secretion of proteins such as PSA and FGF2. Collagen Adhesion
Matrix: blood is mixed with CAM+ fluorescent fragments. CTCs that are capable to ingest CAM+ are
confirmed to be tumor cells after CK, Epi+ immunostaining. After Ficoll density gradient centrifugation
mononuclear cells are seeded to fluorescently labeled collagen matrix and non adherent cells are washed
away. CTCs are characterized based on their functional properties. PSA, prostate specific antigen; PSMA,
prostate specific membrane antigen; PSCA, prostate stem cell antigen; CK, cytokeratin; EpCAM, epithelial
adhesion molecule; Dapi, 4,2-diamidino-2-phenylindole dihydrochloride; CTC-Chip, circulating tumor cell-
microfluidic platform; EPISPOT, epithelial immunospot; Glyco A, glycophorin A, a 131 amino acids protein
present at the extra-cellular surface of the human red blood cells; CD45, leukocyte specific marker; FGF-2, a
stem cell fibroblast growth factor; CAM, collagen adhesion matrix.
Reproduced with permission from the copyright holder: Doyen J., Alix-Panabières C., Hofman P., Parks S.
K., Chamorey E., Naman H., Hannoun-Lévi J. M. (2012) Circulating tumor cells in prostate cancer: A
potential surrogate marker of survival. Critical Reviews in Oncology/Hematology 81, 241-256
28
1.6 QUANTITATIVE REAL-TIME PCR
In quantitative real-time PCR (qRT-PCR) the amplified PCR product is quantitatively measured after
each PCR cycle. Different fluorescent dyes that bind to double-stranded (ds) DNA can be used for
the detection of amplified cDNA. During the reaction, fluorescence signals are monitored by a
computer-based program in real-time and the intensity of fluorescence signals is directly correlated
with the quantity of the target PCR product present after each cycle (Kubista et al. 2006). Moreover,
due to the low intensity of the fluorescence signals they cannot be distinguished from the background
in the beginning of the qRT-PCR reaction.
With each PCR cycle the concentration of target cDNA sequence increases and fluorescence signals
become detectable above background, leading to an exponential increment of fluorescence levels.
The cycle numbers required to cross a set threshold fluorescence signal level is represented with Ct
(cycle threshold) value. The background value is determined according to the relatively stable
fluorescence signal levels during the first cycles. Furthermore, threshold value is defined in order to
detect the fluorescence above background (Kubista et al. 2006).
In order to obtain Ct values, the fluorescence from the amplified cDNA has to cross the threshold.
Moreover, the relative concentration of target cDNA during the exponential phase of the reaction is
obtained by plotting fluorescence signals against cycle number on a logarithmic scale. In addition,
known concentrations of serially diluted PCR products are used for the generation of a standard
curve in order to generate a linear relationship between Ct values and starting quantities of the
template. Furthermore, based on the Ct values of unknown samples the concentrations can directly
be determined from the standard curve. Housekeeping genes are used as control genes to correct the
variability in gene expression (Kubista et al. 2006).
TaqMan assay
A TaqMan assay reaction is based on the binding of specific TaqMan probe to target DNA sequence
and the 5´exonuclease activity of Taq DNA polymerase to hydrolyze the TaqMan probe from the
target region. 5´end of TaqMan probe is usually labeled with reporter (R) fluorescent dye and 3´ end
of the probe is labeled with quenching (Q) fluorescent dye. During denaturation cDNA is separated
into two single strands. The following annealing step allows the two target template specific primers
(5´ forward and 3´ reverse) to define the endpoints of the sequence by binding to respective cDNA
sequence. After the respective primers have been annealed to the sequence the target specificity is
increased further when the dual-fluorescent labeled TaqMan probe hybridizes specifically to the
target sequence of interest between the two PCR primers during the annealing step. (Bustin et al.
2000)
When the probe is bound there is an energy transfer between R and Q and little or no fluorescence is
detected due to reporter fluorescence suppression by quencher. During polymerization, 5´ Taq DNA
polymerase starts to synthesize the target sequence. TaqMan probe remains bound to the sequence
until Taq polymerase reaches the reporter end and cleaves the probe by utilizing its 5´exonuclease
activity. Thus, the reporter is released and is no longer suppressed by the quencher, allowing the
fluorescence to be detected. The fluorescence intensity is increased if the target sequence is
complementary to the TaqMan probe. (Bustin S. A. 2000)
29
SYBR Green assay
The SYBR Green reaction is based on the binding of SYBR Green fluorescent dye to dsDNA during
DNA polymerization. During denaturation, the background fluorescent signal is very weak and
SYBR Green is unbound. After the denaturation process, specific primers bind to target sequence
(annealing) and some SYBR Green molecules bind to annealed sequence. The fluorescence signal is
weak and only light emitted upon excitation is detected. During polymerization, new DNA is
constantly synthesized leading to increased binding of SYBR Green molecules to dsDNA sequences.
After each PCR cycle, fluorescence levels are exponentially increased and directly monitored in real-
time. (Bustin S. A. 2000)
iScript One-Step RT-PCR assay
The iScript One-Step RT-PCR assay is also based on the SYBR Green dye binding to ds DNA. What
is different compared to TaqMan assay and SYBR Green assay is that mRNA reverse transcription
into cDNA and qPCR (SYBR Green) occurs in the same reaction. Thus, mRNA is used as a template
in iScript One-Step RT-PCR assay, in contrast to the TaqMan and SYBR Green assays. Initially,
mRNA is transcribed to produce cDNA by the specific iScript RT enzyme. After cDNA synthesis the
reaction continues according to the standard RT-PCR protocol.
2. AIMS OF THE STUDY
The main aim of this study was to detect the TMPRSS2:ERG fusion gene in clinical prostate cancer
patient samples. The specific aims were as follows:
1. to validate the sensitivity and specificity of TaqMan, SYBR Green and iScript One-Step RT-
PCR assays for detecting TMPRSS2:ERG fusion gene in fusion positive VCaP prostate
cancer cell line.
2. to find the most suitable assay for detecting TMPRSS2:ERG fusion gene in prostate cancer
patient material to study the occurrence of the fusion gene in blood samples.
3. to examine how the TMPRSS2:ERG fusion gene occurrence affects patient outcome.
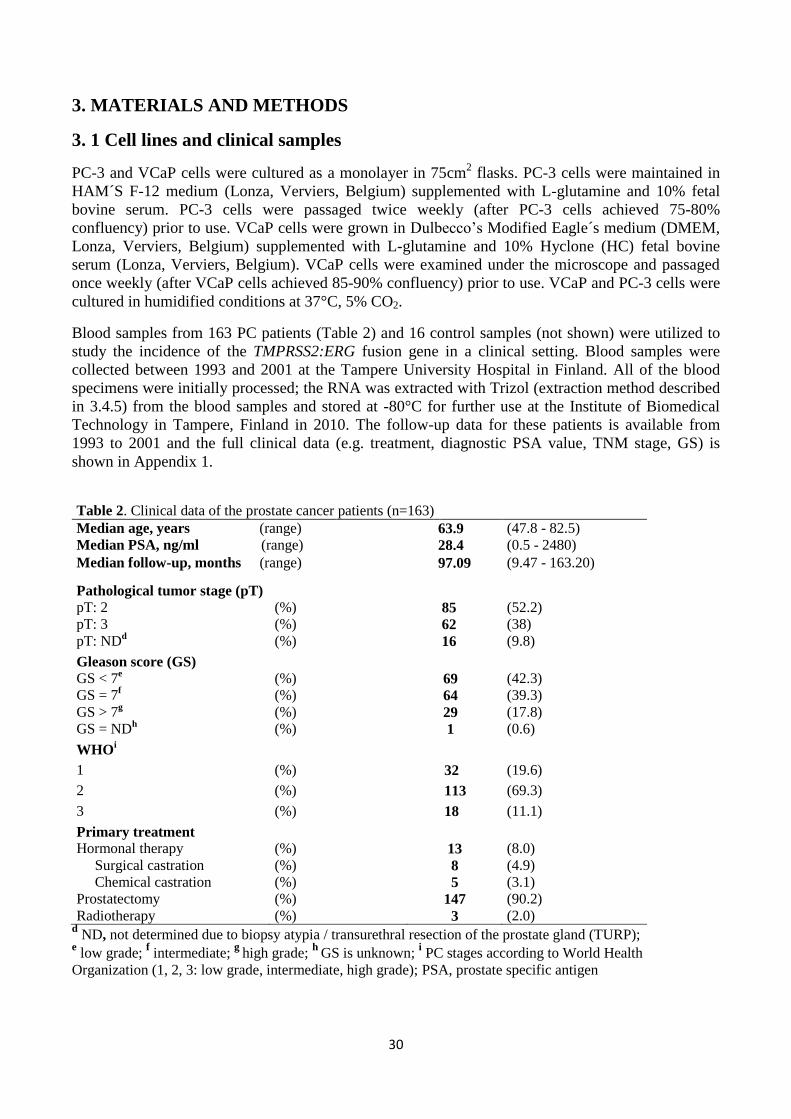
30
3. MATERIALS AND METHODS
3. 1 Cell lines and clinical samples
PC-3 and VCaP cells were cultured as a monolayer in 75cm2 flasks. PC-3 cells were maintained in
HAM´S F-12 medium (Lonza, Verviers, Belgium) supplemented with L-glutamine and 10% fetal
bovine serum. PC-3 cells were passaged twice weekly (after PC-3 cells achieved 75-80%
confluency) prior to use. VCaP cells were grown in Dulbecco’s Modified Eagle´s medium (DMEM,
Lonza, Verviers, Belgium) supplemented with L-glutamine and 10% Hyclone (HC) fetal bovine
serum (Lonza, Verviers, Belgium). VCaP cells were examined under the microscope and passaged
once weekly (after VCaP cells achieved 85-90% confluency) prior to use. VCaP and PC-3 cells were
cultured in humidified conditions at 37°C, 5% CO2.
Blood samples from 163 PC patients (Table 2) and 16 control samples (not shown) were utilized to
study the incidence of the TMPRSS2:ERG fusion gene in a clinical setting. Blood samples were
collected between 1993 and 2001 at the Tampere University Hospital in Finland. All of the blood
specimens were initially processed; the RNA was extracted with Trizol (extraction method described
in 3.4.5) from the blood samples and stored at -80°C for further use at the Institute of Biomedical
Technology in Tampere, Finland in 2010. The follow-up data for these patients is available from
1993 to 2001 and the full clinical data (e.g. treatment, diagnostic PSA value, TNM stage, GS) is
shown in Appendix 1.
Table 2. Clinical data of the prostate cancer patients (n=163)
Median age, years (range) 63.9 (47.8 - 82.5)
Median PSA, ng/ml (range) 28.4 (0.5 - 2480)
Median follow-up, months (range) 97.09 (9.47 - 163.20)
Pathological tumor stage (pT)
pT: 2 (%) 85 (52.2)
pT: 3 (%) 62 (38)
pT: NDd (%) 16 (9.8)
Gleason score (GS)
GS < 7e (%) 69 (42.3)
GS = 7f (%) 64 (39.3)
GS > 7g (%) 29 (17.8)
GS = NDh (%) 1 (0.6)
WHOi
1 (%) 32 (19.6)
2 (%) 113 (69.3)
3 (%) 18 (11.1)
Primary treatment
Hormonal therapy (%) 13 (8.0)
Surgical castration (%) 8 (4.9)
Chemical castration (%) 5 (3.1)
Prostatectomy (%) 147 (90.2)
Radiotherapy (%) 3 (2.0) d ND, not determined due to biopsy atypia / transurethral resection of the prostate gland (TURP);
e low grade;
f intermediate;
g high grade;
h GS is unknown;
i PC stages according to World Health
Organization (1, 2, 3: low grade, intermediate, high grade); PSA, prostate specific antigen
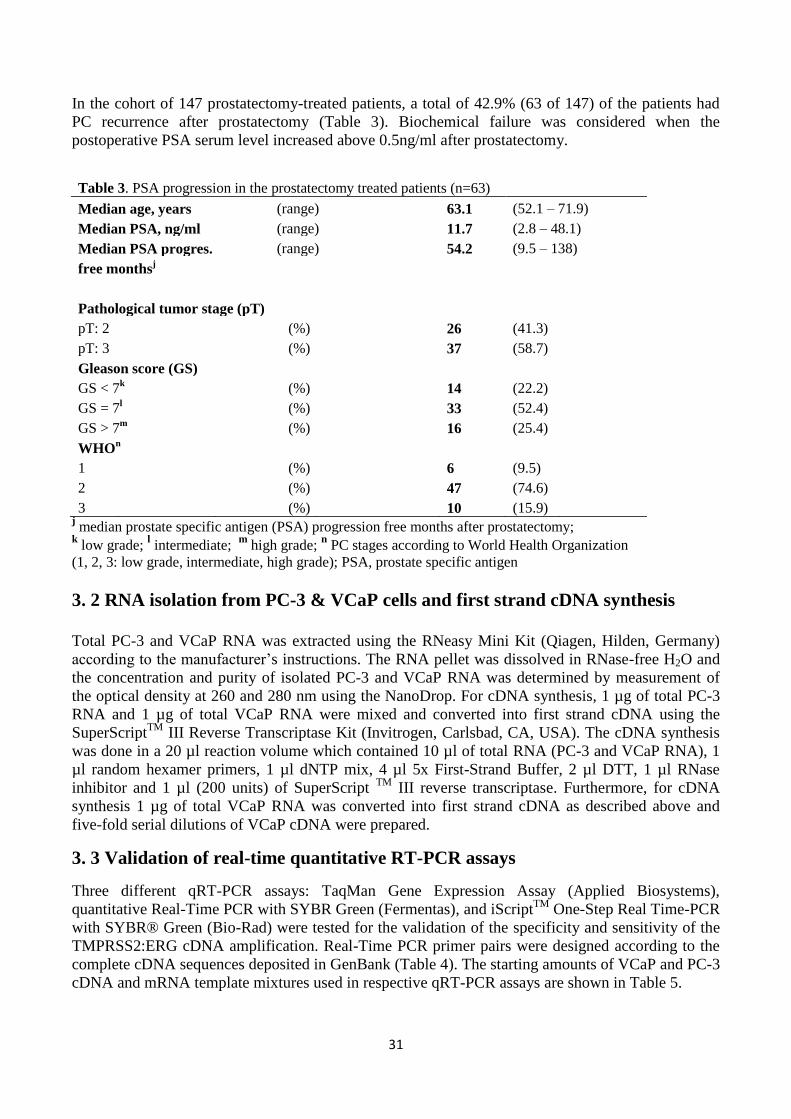
31
In the cohort of 147 prostatectomy-treated patients, a total of 42.9% (63 of 147) of the patients had
PC recurrence after prostatectomy (Table 3). Biochemical failure was considered when the
postoperative PSA serum level increased above 0.5ng/ml after prostatectomy.
Table 3. PSA progression in the prostatectomy treated patients (n=63)
Median age, years (range)
63.1 (52.1 – 71.9)
Median PSA, ng/ml (range)
11.7 (2.8 – 48.1)
Median PSA progres. (range)
54.2 (9.5 – 138)
free monthsj
Pathological tumor stage (pT)
pT: 2
(%)
26 (41.3)
pT: 3
(%)
37 (58.7)
Gleason score (GS)
GS < 7k
(%)
14 (22.2)
GS = 7l
(%)
33 (52.4)
GS > 7m
(%)
16 (25.4)
WHOn
1
(%)
6 (9.5)
2
(%)
47 (74.6)
3
(%)
10 (15.9)
j median prostate specific antigen (PSA) progression free months after prostatectomy;
k low grade;
l intermediate;
m high grade;
n PC stages according to World Health Organization
(1, 2, 3: low grade, intermediate, high grade); PSA, prostate specific antigen
3. 2 RNA isolation from PC-3 & VCaP cells and first strand cDNA synthesis
Total PC-3 and VCaP RNA was extracted using the RNeasy Mini Kit (Qiagen, Hilden, Germany)
according to the manufacturer’s instructions. The RNA pellet was dissolved in RNase-free H2O and
the concentration and purity of isolated PC-3 and VCaP RNA was determined by measurement of
the optical density at 260 and 280 nm using the NanoDrop. For cDNA synthesis, 1 µg of total PC-3
RNA and 1 µg of total VCaP RNA were mixed and converted into first strand cDNA using the
SuperScriptTM
III Reverse Transcriptase Kit (Invitrogen, Carlsbad, CA, USA). The cDNA synthesis
was done in a 20 µl reaction volume which contained 10 µl of total RNA (PC-3 and VCaP RNA), 1
µl random hexamer primers, 1 µl dNTP mix, 4 µl 5x First-Strand Buffer, 2 µl DTT, 1 µl RNase
inhibitor and 1 µl (200 units) of SuperScript TM
III reverse transcriptase. Furthermore, for cDNA
synthesis 1 µg of total VCaP RNA was converted into first strand cDNA as described above and
five-fold serial dilutions of VCaP cDNA were prepared.
3. 3 Validation of real-time quantitative RT-PCR assays
Three different qRT-PCR assays: TaqMan Gene Expression Assay (Applied Biosystems),
quantitative Real-Time PCR with SYBR Green (Fermentas), and iScriptTM
One-Step Real Time-PCR
with SYBR® Green (Bio-Rad) were tested for the validation of the specificity and sensitivity of the
TMPRSS2:ERG cDNA amplification. Real-Time PCR primer pairs were designed according to the
complete cDNA sequences deposited in GenBank (Table 4). The starting amounts of VCaP and PC-3
cDNA and mRNA template mixtures used in respective qRT-PCR assays are shown in Table 5.
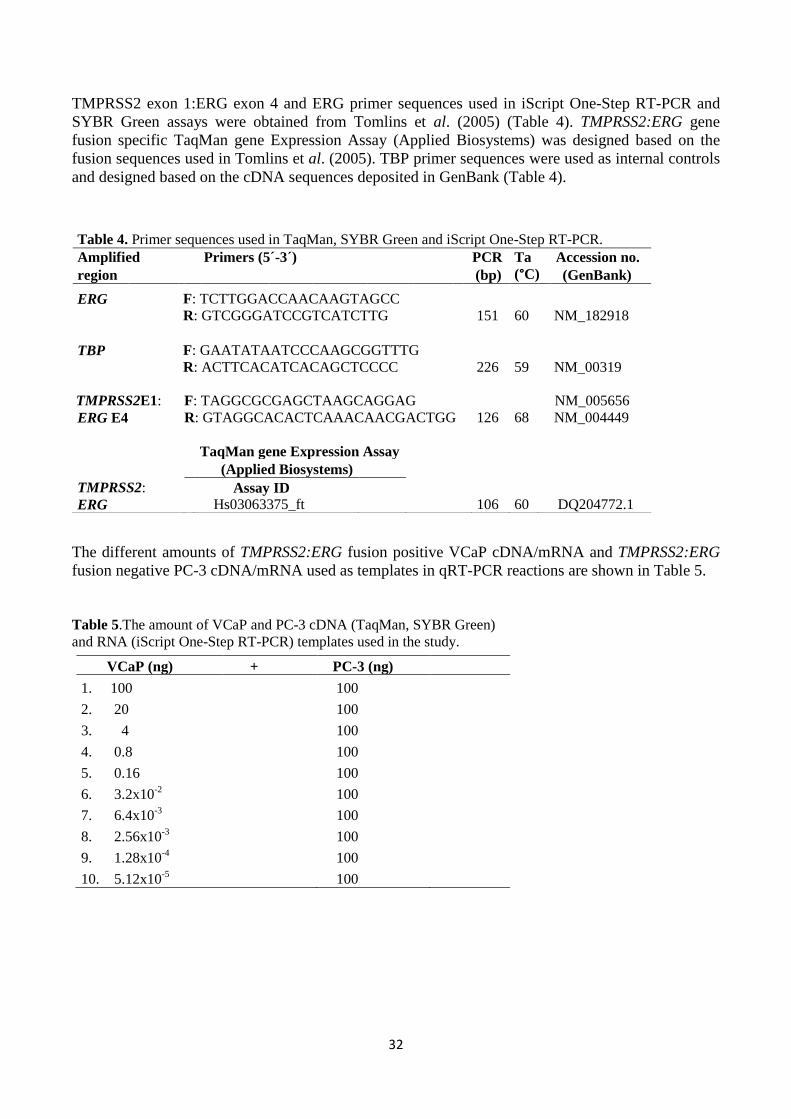
32
TMPRSS2 exon 1:ERG exon 4 and ERG primer sequences used in iScript One-Step RT-PCR and
SYBR Green assays were obtained from Tomlins et al. (2005) (Table 4). TMPRSS2:ERG gene
fusion specific TaqMan gene Expression Assay (Applied Biosystems) was designed based on the
fusion sequences used in Tomlins et al. (2005). TBP primer sequences were used as internal controls
and designed based on the cDNA sequences deposited in GenBank (Table 4).
The different amounts of TMPRSS2:ERG fusion positive VCaP cDNA/mRNA and TMPRSS2:ERG
fusion negative PC-3 cDNA/mRNA used as templates in qRT-PCR reactions are shown in Table 5.
Table 5.The amount of VCaP and PC-3 cDNA (TaqMan, SYBR Green)
and RNA (iScript One-Step RT-PCR) templates used in the study.
Table 4. Primer sequences used in TaqMan, SYBR Green and iScript One-Step RT-PCR.
Amplified Primers (5´-3´) PCR Ta Accession no.
region (bp) (°C) (GenBank)
ERG F: TCTTGGACCAACAAGTAGCC
R: GTCGGGATCCGTCATCTTG 151 60 NM_182918
TBP F: GAATATAATCCCAAGCGGTTTG
R: ACTTCACATCACAGCTCCCC 226 59 NM_00319
TMPRSS2E1: F: TAGGCGCGAGCTAAGCAGGAG NM_005656
ERG E4 R: GTAGGCACACTCAAACAACGACTGG 126 68 NM_004449
TaqMan gene Expression Assay
(Applied Biosystems)
TMPRSS2: Assay ID ERG Hs03063375_ft 106 60 DQ204772.1
VCaP (ng) + PC-3 (ng)
1. 100 100
2. 20 100
3. 4 100
4. 0.8 100
5. 0.16 100
6. 3.2x10⁻²
100
7. 6.4x10⁻³
100
8. 2.56x10⁻³
100
9. 1.28x10⁻⁴
100
10. 5.12x10⁻⁵
100
33
3.3.1 TaqMan gene expression assay
The total volume of each qRT-PCR reaction was 20 µl containing 2 µl of first strand cDNA (Table
5), TaqMan® Universal Master Mix (Applied Biosystems, Carlsbad, CA) and 0.5 µM 20xTaqMan®
Gene Expression Assay (Table 4). CFX 96 Real-Time System apparatus (Bio-Rad) was used for
qRT-PCR analysis. The following steps were carried out for amplification and detection at standard
conditions: after 10 min polymerase activation step at 95ºC amplification was performed in a two-
step cycling procedure for 45 cycles: denaturation at 95ºC for 15 s, annealing/extension at 60ºC for
15 s for TaqMan probe (FAM-labeled) and fusion primers (Table 4: TaqMan gene Expression
Assay). A standard curve was established for TMPRSS2:ERG fusion gene using the mixture of five-
fold serial dilutions of VCaP cDNA (Table 5) and the standard amount of PC-3 cDNA (Table 5).
3.3.2 SYBR Green assay
The total volume of each qRT-PCR reaction was 22µl containing 2µl of first strand cDNA (Table 5),
2xMaxima SYBR® Green/Rox qPCR Master Mix (Fermentas) and 0.625µM of TMPRSS2:ERG
fusion primers (Table 4). CFX 96 Real-Time System apparatus (Bio-Rad) was used for qRT-PCR
analysis. The amplification and detection were carried out as follows: after an initial 5 min
polymerase activation step at 95oC, amplification was performed in a three-step cycling procedure
for 50 cycles: denaturation at 95oC for 10s, annealing at 68°C for TMPRSS2:ERG fusion primers for
30s, and elongation at 72oC for 20s (the ramp rate was 0.5
oC/s for all steps), and a final cooling step.
Melting curve analysis was performed after the amplification to check the specificity of the qRT-
PCR reaction. A standard curve was established for TMPRSS2:ERG fusion gene as described in
3.3.1.
3.3.3 iScript One-Step RT-PCR assay
The total volume of each qRT-PCR was 25 µl containing 2.5 µl of template RNA (Table 5),
2xSYBR® Green RT-PCR Reaction Mix (Bio-Rad, Hercules, CA) and 0.3 µM of TMPRSS2:ERG
fusion primers (Table 4). CFX 96 Real-Time System apparatus (Bio-Rad) was used for qRT-PCR
analysis. The following steps were carried out for cDNA synthesis, amplification, and detection: first
strand cDNA synthesis for 10 min at 44°C, iScript Reverse transcriptase inactivation for 5 min at
95°C, amplification was performed in a three-step cycling procedure for 40 cycles: denaturation at
95oC for 10 s, annealing at 68°C for TMPRSS2:ERG fusion primers for 30 s, and elongation at 72
oC
for 20 s (the ramp rate was 0.5oC/s for all steps), and a final cooling step. Melting curve analysis was
performed after the amplification to check the specificity of the qRT-PCR reaction. A standard curve
was established for TMPRSS2:ERG fusion gene as described in 3.3.1.
3.4 Validation of TMPRSS2:ERG detection in the mixture of VCaP cells and
human leukocytes
3.4.1 VCaP cell line
VCaP cells were cultured as described in 3.1.
3.4.2 Human blood specimens
Blood samples from three randomly chosen individuals were collected into 9 ml x EDTA
(ethylenediaminetetraacetic acid) -containing tubes at the Institute of Biomedical Technology
Tampere, Finland in 2012. Blood specimens were initially processed within 1 hour of collection.
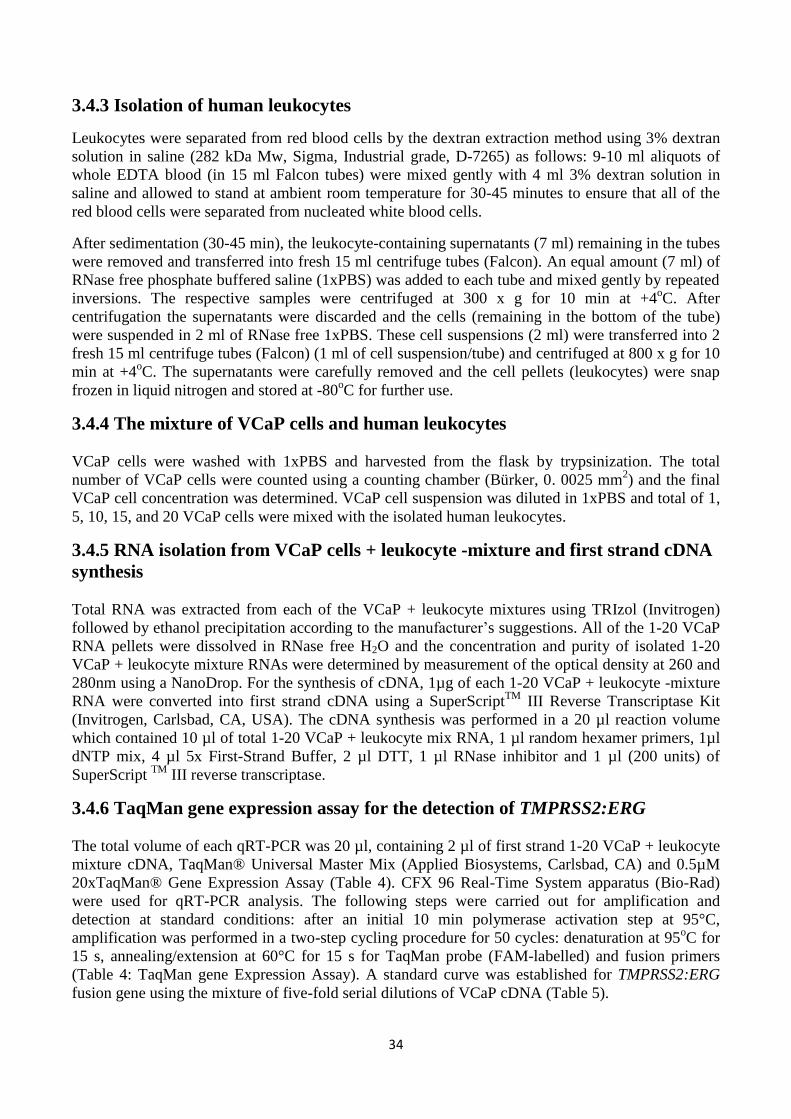
34
3.4.3 Isolation of human leukocytes
Leukocytes were separated from red blood cells by the dextran extraction method using 3% dextran
solution in saline (282 kDa Mw, Sigma, Industrial grade, D-7265) as follows: 9-10 ml aliquots of
whole EDTA blood (in 15 ml Falcon tubes) were mixed gently with 4 ml 3% dextran solution in
saline and allowed to stand at ambient room temperature for 30-45 minutes to ensure that all of the
red blood cells were separated from nucleated white blood cells.
After sedimentation (30-45 min), the leukocyte-containing supernatants (7 ml) remaining in the tubes
were removed and transferred into fresh 15 ml centrifuge tubes (Falcon). An equal amount (7 ml) of
RNase free phosphate buffered saline (1xPBS) was added to each tube and mixed gently by repeated
inversions. The respective samples were centrifuged at 300 x g for 10 min at +4oC. After
centrifugation the supernatants were discarded and the cells (remaining in the bottom of the tube)
were suspended in 2 ml of RNase free 1xPBS. These cell suspensions (2 ml) were transferred into 2
fresh 15 ml centrifuge tubes (Falcon) (1 ml of cell suspension/tube) and centrifuged at 800 x g for 10
min at +4oC. The supernatants were carefully removed and the cell pellets (leukocytes) were snap
frozen in liquid nitrogen and stored at -80oC for further use.
3.4.4 The mixture of VCaP cells and human leukocytes
VCaP cells were washed with 1xPBS and harvested from the flask by trypsinization. The total
number of VCaP cells were counted using a counting chamber (Bürker, 0. 0025 mm2) and the final
VCaP cell concentration was determined. VCaP cell suspension was diluted in 1xPBS and total of 1,
5, 10, 15, and 20 VCaP cells were mixed with the isolated human leukocytes.
3.4.5 RNA isolation from VCaP cells + leukocyte -mixture and first strand cDNA
synthesis
Total RNA was extracted from each of the VCaP + leukocyte mixtures using TRIzol (Invitrogen)
followed by ethanol precipitation according to the manufacturer’s suggestions. All of the 1-20 VCaP
RNA pellets were dissolved in RNase free H2O and the concentration and purity of isolated 1-20
VCaP + leukocyte mixture RNAs were determined by measurement of the optical density at 260 and
280nm using a NanoDrop. For the synthesis of cDNA, 1µg of each 1-20 VCaP + leukocyte -mixture
RNA were converted into first strand cDNA using a SuperScriptTM
III Reverse Transcriptase Kit
(Invitrogen, Carlsbad, CA, USA). The cDNA synthesis was performed in a 20 µl reaction volume
which contained 10 µl of total 1-20 VCaP + leukocyte mix RNA, 1 µl random hexamer primers, 1µl
dNTP mix, 4 µl 5x First-Strand Buffer, 2 µl DTT, 1 µl RNase inhibitor and 1 µl (200 units) of
SuperScript TM
III reverse transcriptase.
3.4.6 TaqMan gene expression assay for the detection of TMPRSS2:ERG
The total volume of each qRT-PCR was 20 µl, containing 2 µl of first strand 1-20 VCaP + leukocyte
mixture cDNA, TaqMan® Universal Master Mix (Applied Biosystems, Carlsbad, CA) and 0.5µM
20xTaqMan® Gene Expression Assay (Table 4). CFX 96 Real-Time System apparatus (Bio-Rad)
were used for qRT-PCR analysis. The following steps were carried out for amplification and
detection at standard conditions: after an initial 10 min polymerase activation step at 95°C,
amplification was performed in a two-step cycling procedure for 50 cycles: denaturation at 95oC for
15 s, annealing/extension at 60°C for 15 s for TaqMan probe (FAM-labelled) and fusion primers
(Table 4: TaqMan gene Expression Assay). A standard curve was established for TMPRSS2:ERG
fusion gene using the mixture of five-fold serial dilutions of VCaP cDNA (Table 5).
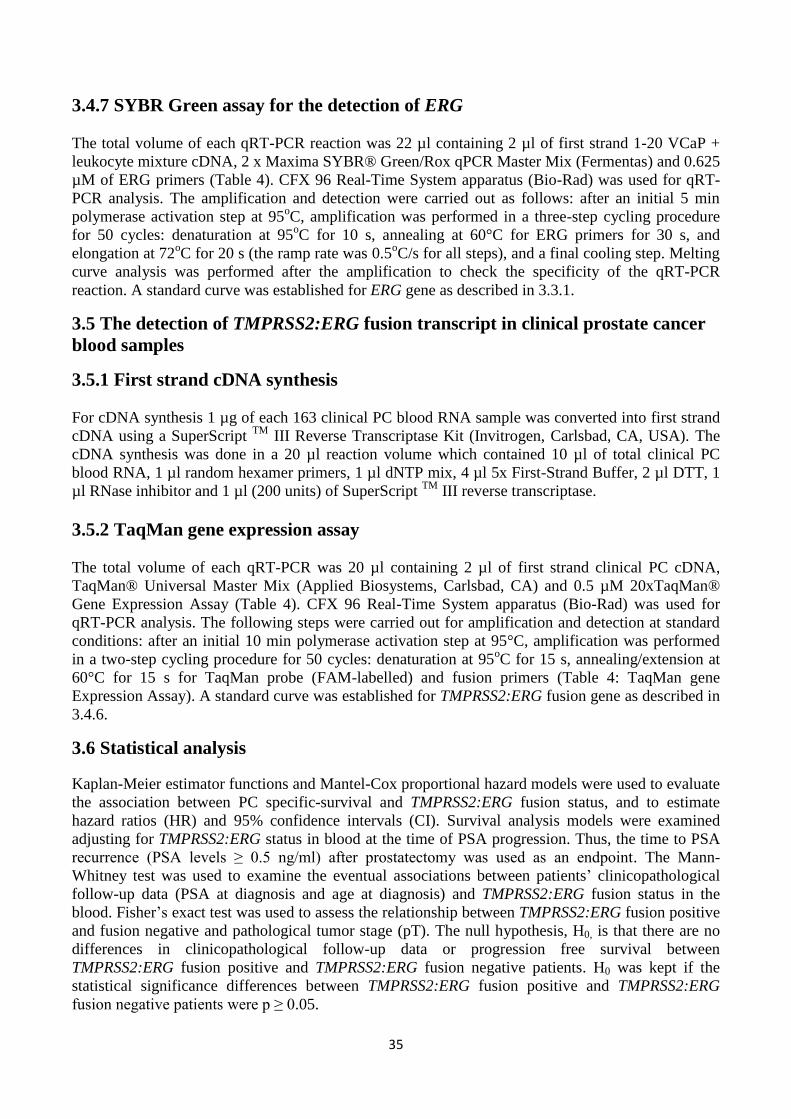
35
3.4.7 SYBR Green assay for the detection of ERG
The total volume of each qRT-PCR reaction was 22 µl containing 2 µl of first strand 1-20 VCaP +
leukocyte mixture cDNA, 2 x Maxima SYBR® Green/Rox qPCR Master Mix (Fermentas) and 0.625
µM of ERG primers (Table 4). CFX 96 Real-Time System apparatus (Bio-Rad) was used for qRT-
PCR analysis. The amplification and detection were carried out as follows: after an initial 5 min
polymerase activation step at 95oC, amplification was performed in a three-step cycling procedure
for 50 cycles: denaturation at 95oC for 10 s, annealing at 60°C for ERG primers for 30 s, and
elongation at 72oC for 20 s (the ramp rate was 0.5
oC/s for all steps), and a final cooling step. Melting
curve analysis was performed after the amplification to check the specificity of the qRT-PCR
reaction. A standard curve was established for ERG gene as described in 3.3.1.
3.5 The detection of TMPRSS2:ERG fusion transcript in clinical prostate cancer
blood samples
3.5.1 First strand cDNA synthesis
For cDNA synthesis 1 µg of each 163 clinical PC blood RNA sample was converted into first strand
cDNA using a SuperScript TM
III Reverse Transcriptase Kit (Invitrogen, Carlsbad, CA, USA). The
cDNA synthesis was done in a 20 µl reaction volume which contained 10 µl of total clinical PC
blood RNA, 1 µl random hexamer primers, 1 µl dNTP mix, 4 µl 5x First-Strand Buffer, 2 µl DTT, 1
µl RNase inhibitor and 1 µl (200 units) of SuperScript TM
III reverse transcriptase.
3.5.2 TaqMan gene expression assay
The total volume of each qRT-PCR was 20 µl containing 2 µl of first strand clinical PC cDNA,
TaqMan® Universal Master Mix (Applied Biosystems, Carlsbad, CA) and 0.5 µM 20xTaqMan®
Gene Expression Assay (Table 4). CFX 96 Real-Time System apparatus (Bio-Rad) was used for
qRT-PCR analysis. The following steps were carried out for amplification and detection at standard
conditions: after an initial 10 min polymerase activation step at 95°C, amplification was performed
in a two-step cycling procedure for 50 cycles: denaturation at 95oC for 15 s, annealing/extension at
60°C for 15 s for TaqMan probe (FAM-labelled) and fusion primers (Table 4: TaqMan gene
Expression Assay). A standard curve was established for TMPRSS2:ERG fusion gene as described in
3.4.6.
3.6 Statistical analysis
Kaplan-Meier estimator functions and Mantel-Cox proportional hazard models were used to evaluate
the association between PC specific-survival and TMPRSS2:ERG fusion status, and to estimate
hazard ratios (HR) and 95% confidence intervals (CI). Survival analysis models were examined
adjusting for TMPRSS2:ERG status in blood at the time of PSA progression. Thus, the time to PSA
recurrence (PSA levels ≥ 0.5 ng/ml) after prostatectomy was used as an endpoint. The Mann-
Whitney test was used to examine the eventual associations between patients’ clinicopathological
follow-up data (PSA at diagnosis and age at diagnosis) and TMPRSS2:ERG fusion status in the
blood. Fisher’s exact test was used to assess the relationship between TMPRSS2:ERG fusion positive
and fusion negative and pathological tumor stage (pT). The null hypothesis, H0, is that there are no
differences in clinicopathological follow-up data or progression free survival between
TMPRSS2:ERG fusion positive and TMPRSS2:ERG fusion negative patients. H0 was kept if the
statistical significance differences between TMPRSS2:ERG fusion positive and TMPRSS2:ERG
fusion negative patients were p ≥ 0.05.
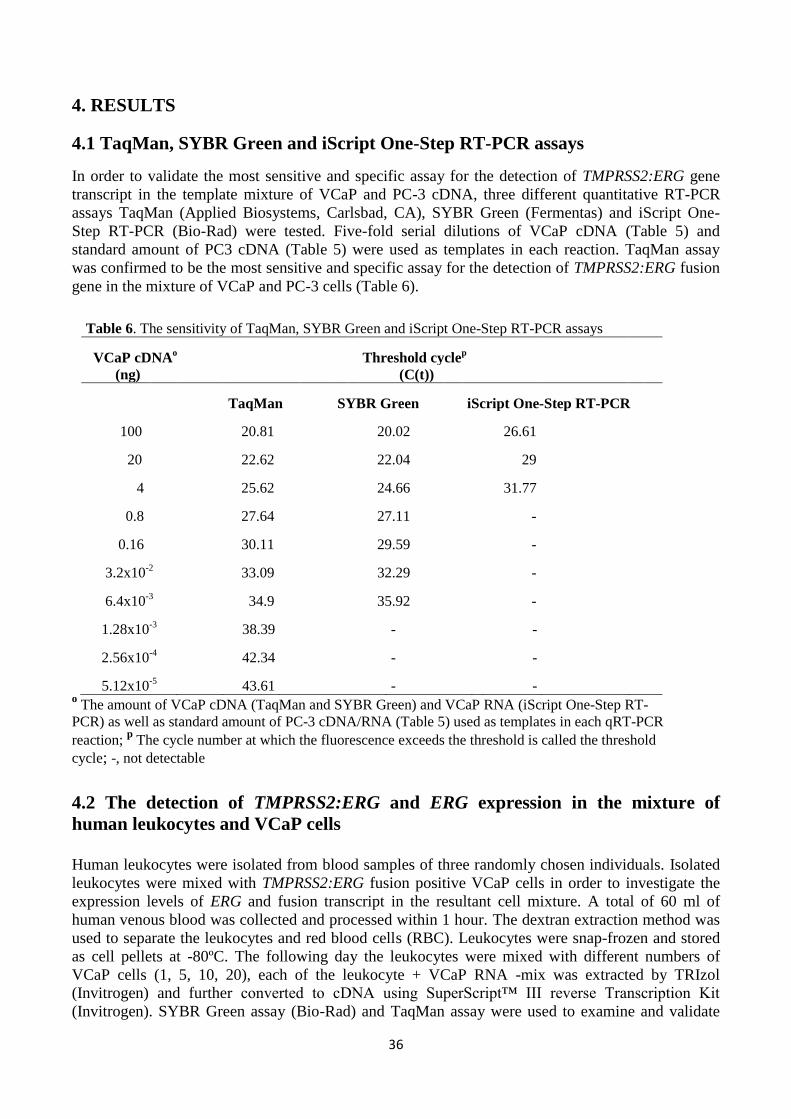
36
4. RESULTS
4.1 TaqMan, SYBR Green and iScript One-Step RT-PCR assays
In order to validate the most sensitive and specific assay for the detection of TMPRSS2:ERG gene
transcript in the template mixture of VCaP and PC-3 cDNA, three different quantitative RT-PCR
assays TaqMan (Applied Biosystems, Carlsbad, CA), SYBR Green (Fermentas) and iScript One-
Step RT-PCR (Bio-Rad) were tested. Five-fold serial dilutions of VCaP cDNA (Table 5) and
standard amount of PC3 cDNA (Table 5) were used as templates in each reaction. TaqMan assay
was confirmed to be the most sensitive and specific assay for the detection of TMPRSS2:ERG fusion
gene in the mixture of VCaP and PC-3 cells (Table 6).
Table 6. The sensitivity of TaqMan, SYBR Green and iScript One-Step RT-PCR assays
VCaP cDNAo Threshold cycle
p
(ng) (C(t))
TaqMan SYBR Green iScript One-Step RT-PCR
100 20.81 20.02 26.61
20 22.62 22.04 29
4 25.62 24.66 31.77
0.8 27.64 27.11 -
0.16 30.11 29.59 -
3.2x10⁻²
33.09 32.29 -
6.4x10⁻³
34.9 35.92 -
1.28x10⁻³
38.39 - -
2.56x10⁻⁴
42.34 - -
5.12x10⁻⁵
43.61 - - o The amount of VCaP cDNA (TaqMan and SYBR Green) and VCaP RNA (iScript One-Step RT-
PCR) as well as standard amount of PC-3 cDNA/RNA (Table 5) used as templates in each qRT-PCR
reaction; p The cycle number at which the fluorescence exceeds the threshold is called the threshold
cycle; -, not detectable
4.2 The detection of TMPRSS2:ERG and ERG expression in the mixture of
human leukocytes and VCaP cells
Human leukocytes were isolated from blood samples of three randomly chosen individuals. Isolated
leukocytes were mixed with TMPRSS2:ERG fusion positive VCaP cells in order to investigate the
expression levels of ERG and fusion transcript in the resultant cell mixture. A total of 60 ml of
human venous blood was collected and processed within 1 hour. The dextran extraction method was
used to separate the leukocytes and red blood cells (RBC). Leukocytes were snap-frozen and stored
as cell pellets at -80ºC. The following day the leukocytes were mixed with different numbers of
VCaP cells (1, 5, 10, 20), each of the leukocyte + VCaP RNA -mix was extracted by TRIzol
(Invitrogen) and further converted to cDNA using SuperScript™ III reverse Transcription Kit
(Invitrogen). SYBR Green assay (Bio-Rad) and TaqMan assay were used to examine and validate
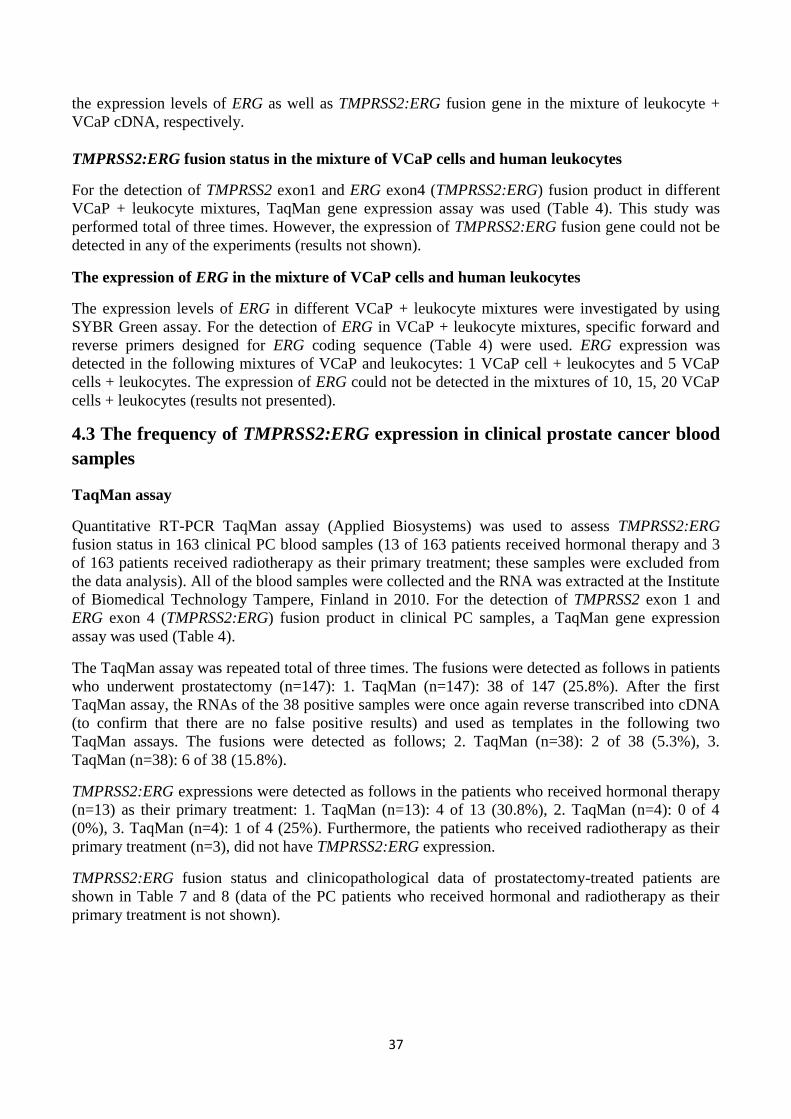
37
the expression levels of ERG as well as TMPRSS2:ERG fusion gene in the mixture of leukocyte +
VCaP cDNA, respectively.
TMPRSS2:ERG fusion status in the mixture of VCaP cells and human leukocytes
For the detection of TMPRSS2 exon1 and ERG exon4 (TMPRSS2:ERG) fusion product in different
VCaP + leukocyte mixtures, TaqMan gene expression assay was used (Table 4). This study was
performed total of three times. However, the expression of TMPRSS2:ERG fusion gene could not be
detected in any of the experiments (results not shown).
The expression of ERG in the mixture of VCaP cells and human leukocytes
The expression levels of ERG in different VCaP + leukocyte mixtures were investigated by using
SYBR Green assay. For the detection of ERG in VCaP + leukocyte mixtures, specific forward and
reverse primers designed for ERG coding sequence (Table 4) were used. ERG expression was
detected in the following mixtures of VCaP and leukocytes: 1 VCaP cell + leukocytes and 5 VCaP
cells + leukocytes. The expression of ERG could not be detected in the mixtures of 10, 15, 20 VCaP
cells + leukocytes (results not presented).
4.3 The frequency of TMPRSS2:ERG expression in clinical prostate cancer blood
samples
TaqMan assay
Quantitative RT-PCR TaqMan assay (Applied Biosystems) was used to assess TMPRSS2:ERG
fusion status in 163 clinical PC blood samples (13 of 163 patients received hormonal therapy and 3
of 163 patients received radiotherapy as their primary treatment; these samples were excluded from
the data analysis). All of the blood samples were collected and the RNA was extracted at the Institute
of Biomedical Technology Tampere, Finland in 2010. For the detection of TMPRSS2 exon 1 and
ERG exon 4 (TMPRSS2:ERG) fusion product in clinical PC samples, a TaqMan gene expression
assay was used (Table 4).
The TaqMan assay was repeated total of three times. The fusions were detected as follows in patients
who underwent prostatectomy (n=147): 1. TaqMan (n=147): 38 of 147 (25.8%). After the first
TaqMan assay, the RNAs of the 38 positive samples were once again reverse transcribed into cDNA
(to confirm that there are no false positive results) and used as templates in the following two
TaqMan assays. The fusions were detected as follows; 2. TaqMan (n=38): 2 of 38 (5.3%), 3.
TaqMan (n=38): 6 of 38 (15.8%).
TMPRSS2:ERG expressions were detected as follows in the patients who received hormonal therapy
(n=13) as their primary treatment: 1. TaqMan (n=13): 4 of 13 (30.8%), 2. TaqMan (n=4): 0 of 4
(0%), 3. TaqMan (n=4): 1 of 4 (25%). Furthermore, the patients who received radiotherapy as their
primary treatment (n=3), did not have TMPRSS2:ERG expression.
TMPRSS2:ERG fusion status and clinicopathological data of prostatectomy-treated patients are
shown in Table 7 and 8 (data of the PC patients who received hormonal and radiotherapy as their
primary treatment is not shown).
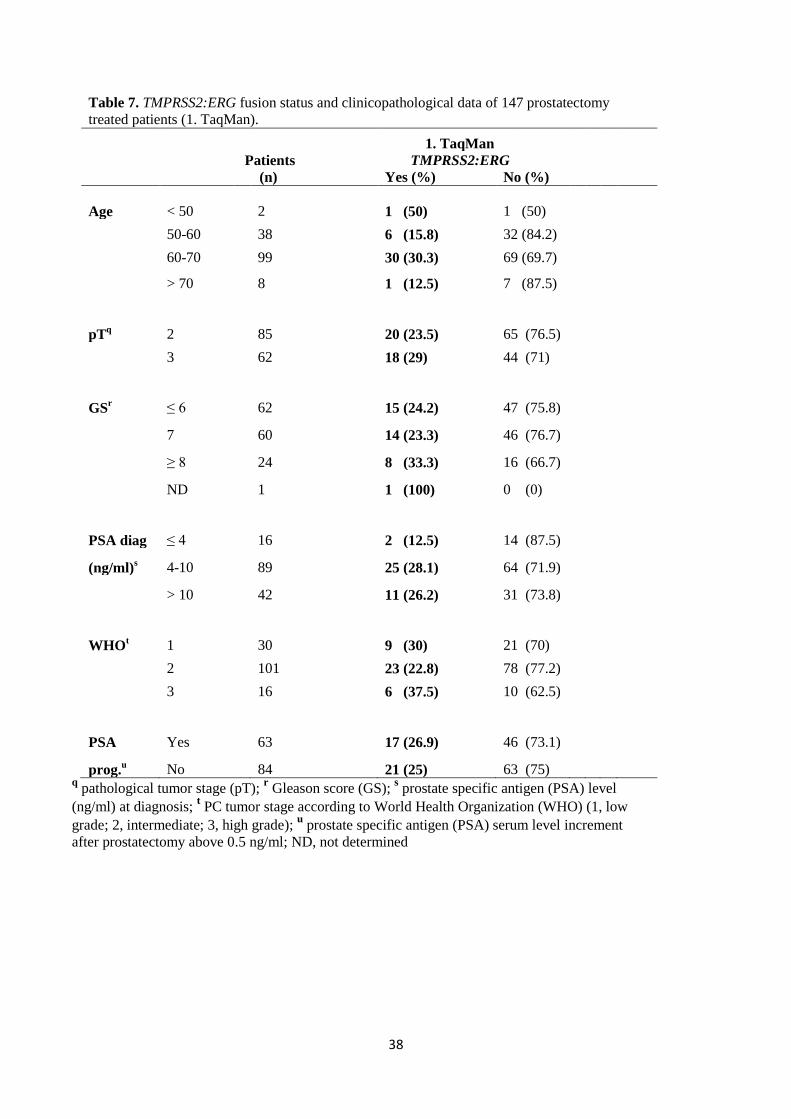
38
Table 7. TMPRSS2:ERG fusion status and clinicopathological data of 147 prostatectomy
treated patients (1. TaqMan).
1. TaqMan Patients TMPRSS2:ERG (n) Yes (%) No (%)
Age < 50 2 1 (50) 1 (50)
50-60 38 6 (15.8) 32 (84.2)
60-70 99 30 (30.3) 69 (69.7)
> 70 8 1 (12.5) 7 (87.5)
pTq 2 85 20 (23.5) 65 (76.5)
3 62 18 (29) 44 (71)
GSr ≤ 6 62 15 (24.2) 47 (75.8)
7 60 14 (23.3) 46 (76.7)
≥ 8 24 8 (33.3) 16 (66.7)
ND 1 1 (100) 0 (0)
PSA diag ≤ 4 16 2 (12.5) 14 (87.5)
(ng/ml)s 4-10 89 25 (28.1) 64 (71.9)
> 10 42 11 (26.2) 31 (73.8)
WHOt 1 30 9 (30) 21 (70)
2 101 23 (22.8) 78 (77.2)
3 16 6 (37.5) 10 (62.5)
PSA Yes 63 17 (26.9) 46 (73.1)
prog.u No 84 21 (25) 63 (75)
q pathological tumor stage (pT);
r Gleason score (GS);
s prostate specific antigen (PSA) level
(ng/ml) at diagnosis; t PC tumor stage according to World Health Organization (WHO) (1, low
grade; 2, intermediate; 3, high grade); u prostate specific antigen (PSA) serum level increment
after prostatectomy above 0.5 ng/ml; ND, not determined
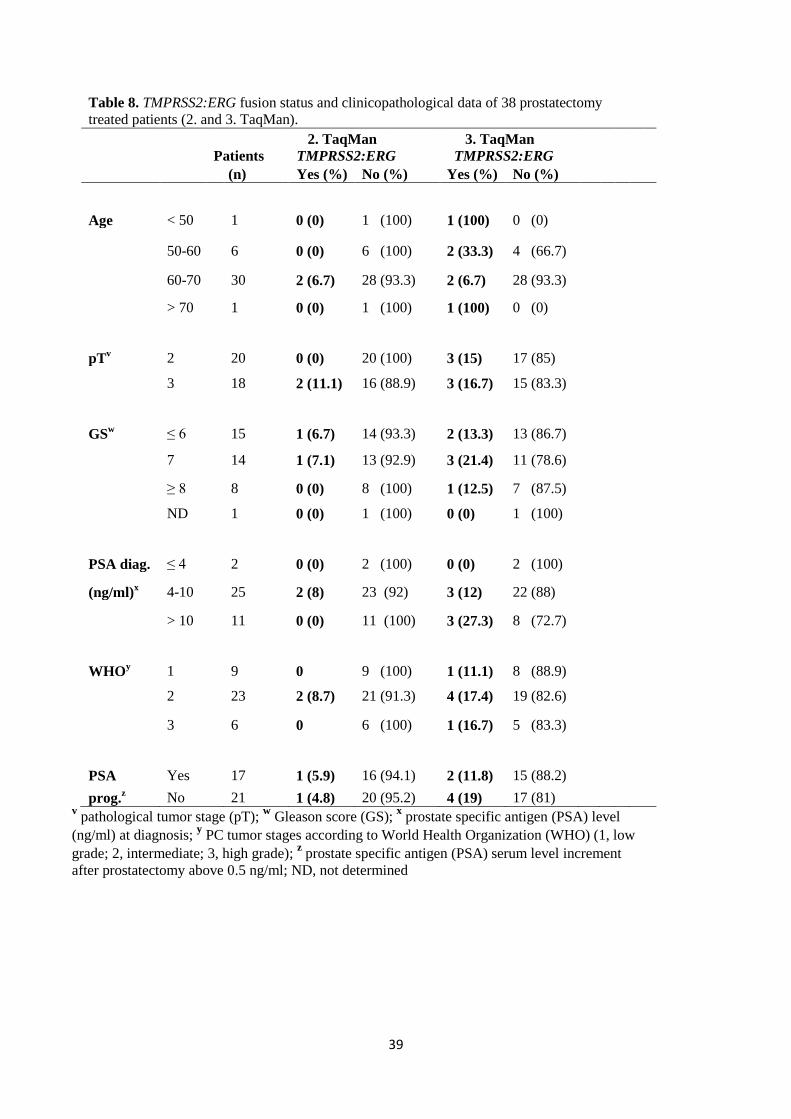
39
Table 8. TMPRSS2:ERG fusion status and clinicopathological data of 38 prostatectomy
treated patients (2. and 3. TaqMan).
2. TaqMan 3. TaqMan
Patients TMPRSS2:ERG TMPRSS2:ERG
(n) Yes (%) No (%) Yes (%) No (%)
Age < 50 1 0 (0) 1 (100) 1 (100) 0 (0)
50-60 6 0 (0) 6 (100) 2 (33.3) 4 (66.7)
60-70 30 2 (6.7) 28 (93.3) 2 (6.7) 28 (93.3)
> 70 1 0 (0) 1 (100) 1 (100) 0 (0)
pTv 2 20 0 (0) 20 (100) 3 (15) 17 (85)
3 18 2 (11.1) 16 (88.9) 3 (16.7) 15 (83.3)
GSw ≤ 6 15 1 (6.7) 14 (93.3) 2 (13.3) 13 (86.7)
7 14 1 (7.1) 13 (92.9) 3 (21.4) 11 (78.6)
≥ 8 8 0 (0) 8 (100) 1 (12.5) 7 (87.5)
ND 1 0 (0) 1 (100) 0 (0) 1 (100)
PSA diag. ≤ 4 2 0 (0) 2 (100) 0 (0) 2 (100)
(ng/ml)x 4-10 25 2 (8) 23 (92) 3 (12) 22 (88)
> 10 11 0 (0) 11 (100) 3 (27.3) 8 (72.7)
WHOy 1 9 0 9 (100) 1 (11.1) 8 (88.9)
2 23 2 (8.7) 21 (91.3) 4 (17.4) 19 (82.6)
3 6 0 6 (100) 1 (16.7) 5 (83.3)
PSA Yes 17 1 (5.9) 16 (94.1) 2 (11.8) 15 (88.2)
prog.z No 21 1 (4.8) 20 (95.2) 4 (19) 17 (81)
v pathological tumor stage (pT);
w Gleason score (GS);
x prostate specific antigen (PSA) level
(ng/ml) at diagnosis; y PC tumor stages according to World Health Organization (WHO) (1, low
grade; 2, intermediate; 3, high grade); z prostate specific antigen (PSA) serum level increment
after prostatectomy above 0.5 ng/ml; ND, not determined
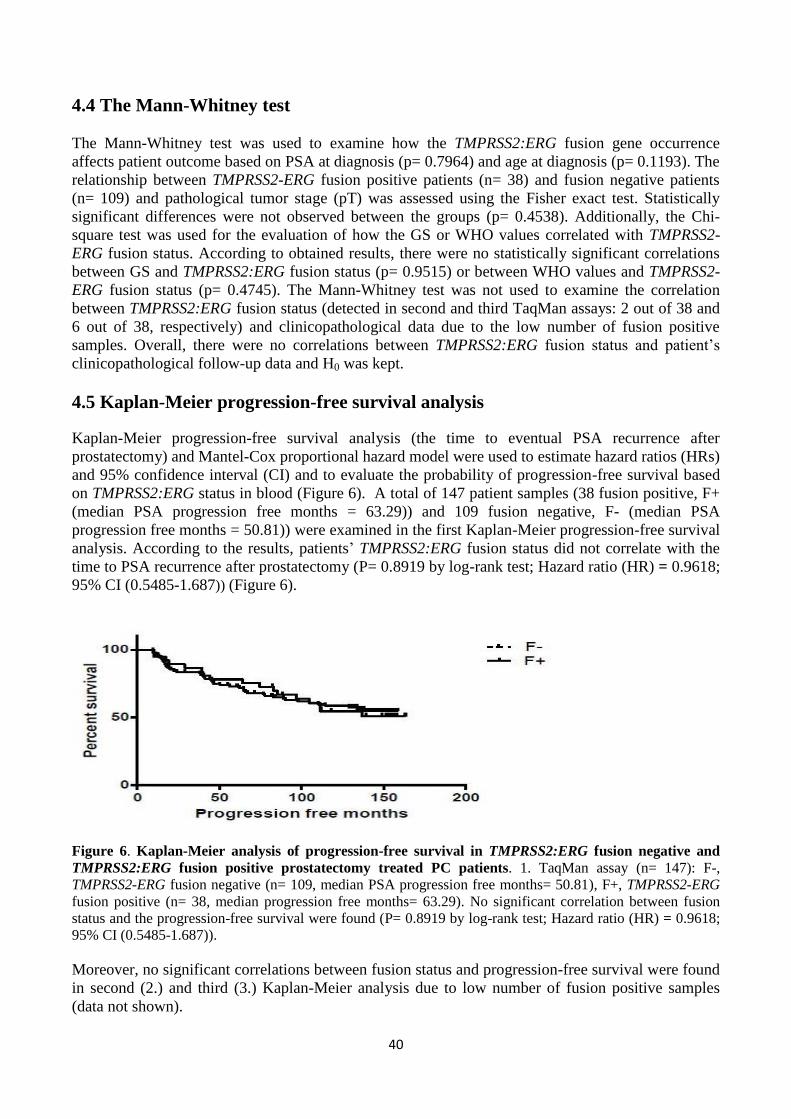
40
4.4 The Mann-Whitney test
The Mann-Whitney test was used to examine how the TMPRSS2:ERG fusion gene occurrence
affects patient outcome based on PSA at diagnosis (p= 0.7964) and age at diagnosis (p= 0.1193). The
relationship between TMPRSS2-ERG fusion positive patients (n= 38) and fusion negative patients
(n= 109) and pathological tumor stage (pT) was assessed using the Fisher exact test. Statistically
significant differences were not observed between the groups (p= 0.4538). Additionally, the Chi-
square test was used for the evaluation of how the GS or WHO values correlated with TMPRSS2-
ERG fusion status. According to obtained results, there were no statistically significant correlations
between GS and TMPRSS2:ERG fusion status (p= 0.9515) or between WHO values and TMPRSS2-
ERG fusion status (p= 0.4745). The Mann-Whitney test was not used to examine the correlation
between TMPRSS2:ERG fusion status (detected in second and third TaqMan assays: 2 out of 38 and
6 out of 38, respectively) and clinicopathological data due to the low number of fusion positive
samples. Overall, there were no correlations between TMPRSS2:ERG fusion status and patient’s
clinicopathological follow-up data and H0 was kept.
4.5 Kaplan-Meier progression-free survival analysis
Kaplan-Meier progression-free survival analysis (the time to eventual PSA recurrence after
prostatectomy) and Mantel-Cox proportional hazard model were used to estimate hazard ratios (HRs)
and 95% confidence interval (CI) and to evaluate the probability of progression-free survival based
on TMPRSS2:ERG status in blood (Figure 6). A total of 147 patient samples (38 fusion positive, F+
(median PSA progression free months = 63.29)) and 109 fusion negative, F- (median PSA
progression free months = 50.81)) were examined in the first Kaplan-Meier progression-free survival
analysis. According to the results, patients’ TMPRSS2:ERG fusion status did not correlate with the
time to PSA recurrence after prostatectomy (P= 0.8919 by log-rank test; Hazard ratio (HR) = 0.9618;
95% CI (0.5485-1.687)) (Figure 6).
Figure 6. Kaplan-Meier analysis of progression-free survival in TMPRSS2:ERG fusion negative and
TMPRSS2:ERG fusion positive prostatectomy treated PC patients. 1. TaqMan assay (n= 147): F-,
TMPRSS2-ERG fusion negative (n= 109, median PSA progression free months= 50.81), F+, TMPRSS2-ERG
fusion positive (n= 38, median progression free months= 63.29). No significant correlation between fusion
status and the progression-free survival were found (P= 0.8919 by log-rank test; Hazard ratio (HR) = 0.9618;
95% CI (0.5485-1.687)).
Moreover, no significant correlations between fusion status and progression-free survival were found
in second (2.) and third (3.) Kaplan-Meier analysis due to low number of fusion positive samples
(data not shown).
41
5. DISCUSSION
Prostate cancer is a heterogeneous and complex disease with many genetic aberrations and recurring
rearrangements. In order to find new molecular determinants for identification of new therapeutic
targets and for better prognostication of PC patient outcome, more established, reproducible as well
as accurate assays are needed. Since CellSearch (Veridex, LLC) is the only analytically validated and
FDA approved method for CTC isolation and enrichment, there is an increasing interest to discover
new potential non-invasive and safe methods to find predictive blood based biomarkers (CTCs) of
tumor sensitivity. What makes CTC detection difficult is their rareity in PC patients’ blood,
accounting for approximately 1 cell in a million to a billion nucleated cells.
The main aim of this study was to detect the TMPRSS2:ERG fusion transcript in blood of 163
randomly selected PC patients. However, before detecting the fusion status in the real PC patients’
blood samples, the sensitivity of TaqMan, SYBR Green and iScript One-Step RT-PCR assays were
studied and the assay that was considered to be most sensitive was chosen for use in further analyses.
Moreover, before the detection of TMPRSS2:ERG fusion status in the real PC blood samples, the
fusion status was studied in the mixture of VCaP cells and human leukocytes.
5.1 The sensitivity of TaqMan, SYBR Green and iScript One-Step RT-PCR
assays
The TaqMan assay was confirmed to be the most specific and sensitive assay to detect
TMPRSS2:ERG fusion. The lowest quantity of VCaP cDNA needed to detect the TMPRSS2:ERG
fusion in the mixture of VCaP and PC-3 cDNA using TaqMan assay was 5.12x10⁻²
pg. TaqMan
assay chemistry relies on the specific binding of the probe synthesized exactly for the target gene. In
order to get any fluorescent signal, specific hybridization and hydrolyzation between a precisely
designed probe and target sequence is required, which also enables the direct detection of PCR
products during the amplification cycles. Furthermore, non-specific binding to other DNA sequences
is avoided since the TaqMan probe binds exactly to the target gene sequence of interest. Thus, the
probability of non-specific amplicon formation is very low.
SYBR Green assay was confirmed to be the second most sensitive assay to detect TMPRSS2:ERG
fusion in the mixture of VCaP and PC-3 cDNA. The lowest quantity of VCaP cDNA required to
observe the TMPRSS2:ERG fusion gene within the cell mixture was 6.4x10 pg. SYBR Green
chemistry is highly sensitive since it relies on the SYBR Green dye binding to all double-stranded
(ds) DNA present in the sample including non-specific reaction products. Thus, the amplification of
any dsDNA can be observed when using SYBR Green assays and the probability of getting more
non-specific binding to any dsDNA is increased. In this study, primer-dimers were always detected
after melting curve analysis when SYBR Green was used. Thus, the non-specific binding increased
when the SYBR Green assay was used for the detection of TMPRSS2:ERG fusion in the mixture of
VCaP and PC-3 cells.
The SYBR Green detection format is also used in the iScript One-Step RT-PCR assay. In this study
the sensitivity of iScript One-Step RT-PCR assay was confirmed to be poor. Indeed, as much as 4 ng
of VCaP cDNA was required to detect TMPRSS2:ERG fusion in the mixture of VCaP and PC-3
cDNA. The difference between iScript One-Step RT-PCR assay and the other previously described
assays is that the template used in this assay is in the form of RNA and the complementary DNA
synthesis as well as PCR amplification occur in the same tube. Since the reverse transcription of
RNA into cDNA and the PCR amplification are carried out in the same reaction tube it is critical to
add precisely the same amount of RNA in all reactions. In addition, to minimize the errors in the
iScript One-Step RT-PCR assay, the extracted RNA has to be properly purified before reverse
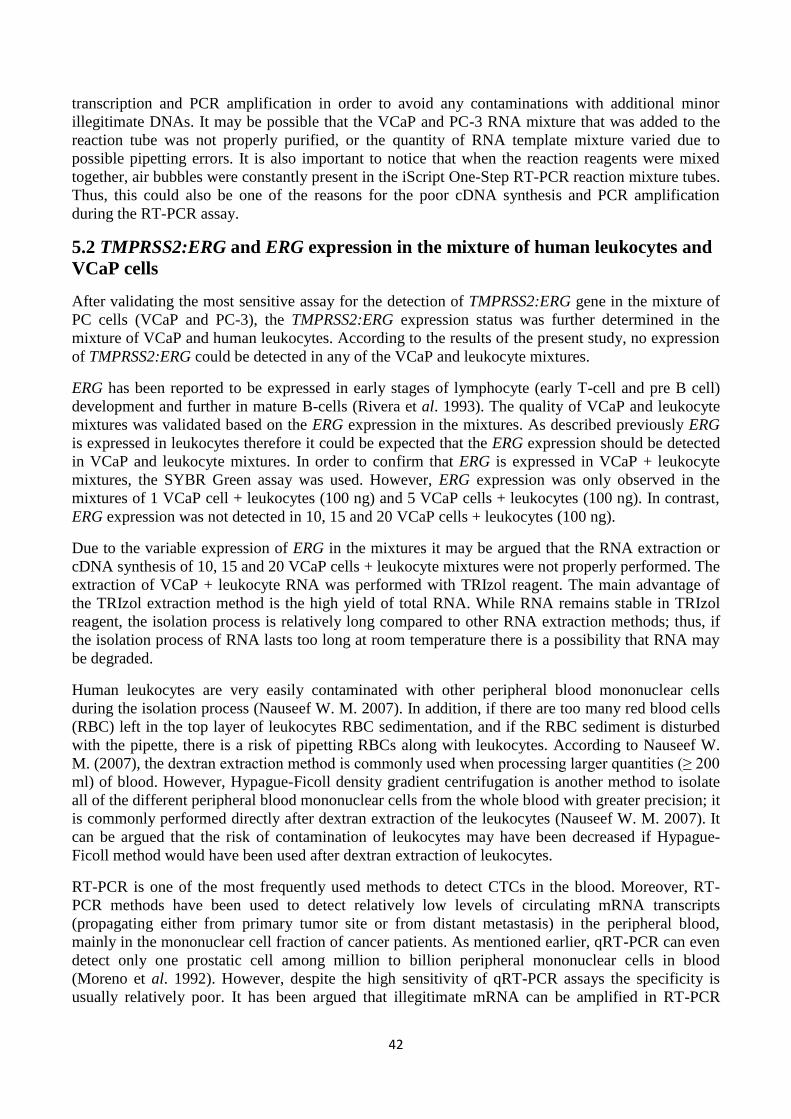
42
transcription and PCR amplification in order to avoid any contaminations with additional minor
illegitimate DNAs. It may be possible that the VCaP and PC-3 RNA mixture that was added to the
reaction tube was not properly purified, or the quantity of RNA template mixture varied due to
possible pipetting errors. It is also important to notice that when the reaction reagents were mixed
together, air bubbles were constantly present in the iScript One-Step RT-PCR reaction mixture tubes.
Thus, this could also be one of the reasons for the poor cDNA synthesis and PCR amplification
during the RT-PCR assay.
5.2 TMPRSS2:ERG and ERG expression in the mixture of human leukocytes and
VCaP cells
After validating the most sensitive assay for the detection of TMPRSS2:ERG gene in the mixture of
PC cells (VCaP and PC-3), the TMPRSS2:ERG expression status was further determined in the
mixture of VCaP and human leukocytes. According to the results of the present study, no expression
of TMPRSS2:ERG could be detected in any of the VCaP and leukocyte mixtures.
ERG has been reported to be expressed in early stages of lymphocyte (early T-cell and pre B cell)
development and further in mature B-cells (Rivera et al. 1993). The quality of VCaP and leukocyte
mixtures was validated based on the ERG expression in the mixtures. As described previously ERG
is expressed in leukocytes therefore it could be expected that the ERG expression should be detected
in VCaP and leukocyte mixtures. In order to confirm that ERG is expressed in VCaP + leukocyte
mixtures, the SYBR Green assay was used. However, ERG expression was only observed in the
mixtures of 1 VCaP cell + leukocytes (100 ng) and 5 VCaP cells + leukocytes (100 ng). In contrast,
ERG expression was not detected in 10, 15 and 20 VCaP cells + leukocytes (100 ng).
Due to the variable expression of ERG in the mixtures it may be argued that the RNA extraction or
cDNA synthesis of 10, 15 and 20 VCaP cells + leukocyte mixtures were not properly performed. The
extraction of VCaP + leukocyte RNA was performed with TRIzol reagent. The main advantage of
the TRIzol extraction method is the high yield of total RNA. While RNA remains stable in TRIzol
reagent, the isolation process is relatively long compared to other RNA extraction methods; thus, if
the isolation process of RNA lasts too long at room temperature there is a possibility that RNA may
be degraded.
Human leukocytes are very easily contaminated with other peripheral blood mononuclear cells
during the isolation process (Nauseef W. M. 2007). In addition, if there are too many red blood cells
(RBC) left in the top layer of leukocytes RBC sedimentation, and if the RBC sediment is disturbed
with the pipette, there is a risk of pipetting RBCs along with leukocytes. According to Nauseef W.
M. (2007), the dextran extraction method is commonly used when processing larger quantities (≥ 200
ml) of blood. However, Hypague-Ficoll density gradient centrifugation is another method to isolate
all of the different peripheral blood mononuclear cells from the whole blood with greater precision; it
is commonly performed directly after dextran extraction of the leukocytes (Nauseef W. M. 2007). It
can be argued that the risk of contamination of leukocytes may have been decreased if Hypague-
Ficoll method would have been used after dextran extraction of leukocytes.
RT-PCR is one of the most frequently used methods to detect CTCs in the blood. Moreover, RT-
PCR methods have been used to detect relatively low levels of circulating mRNA transcripts
(propagating either from primary tumor site or from distant metastasis) in the peripheral blood,
mainly in the mononuclear cell fraction of cancer patients. As mentioned earlier, qRT-PCR can even
detect only one prostatic cell among million to billion peripheral mononuclear cells in blood
(Moreno et al. 1992). However, despite the high sensitivity of qRT-PCR assays the specificity is
usually relatively poor. It has been argued that illegitimate mRNA can be amplified in RT-PCR
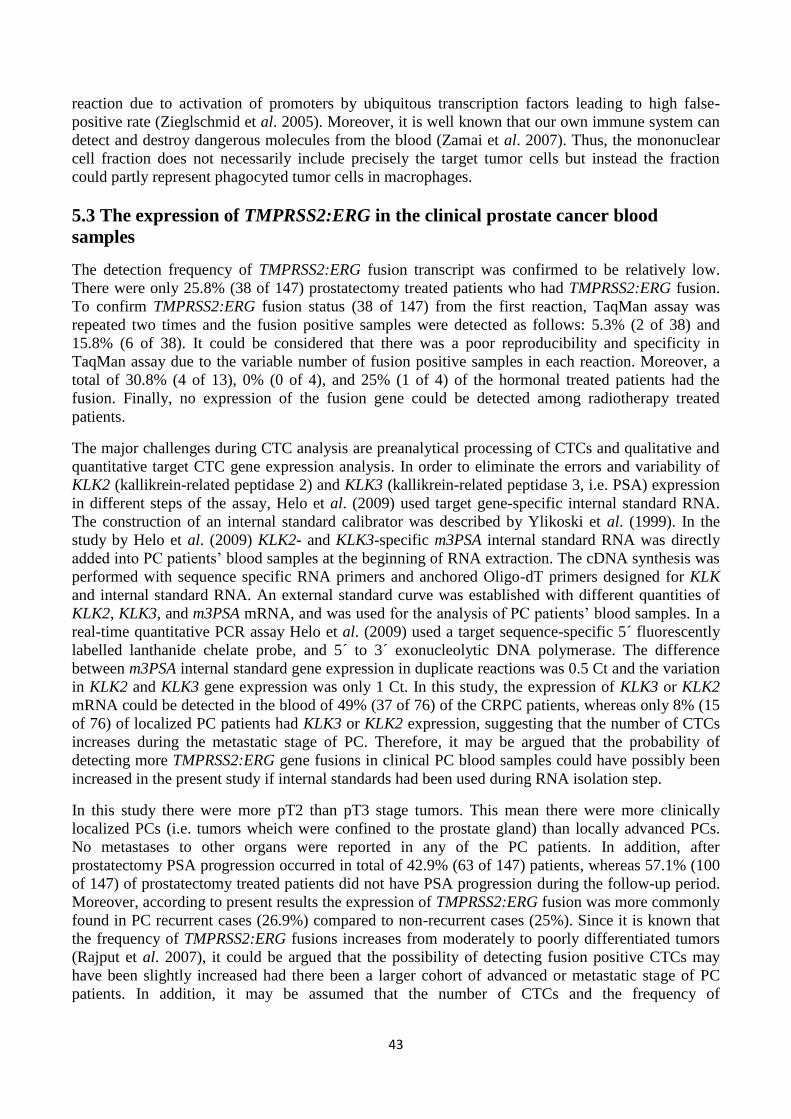
43
reaction due to activation of promoters by ubiquitous transcription factors leading to high false-
positive rate (Zieglschmid et al. 2005). Moreover, it is well known that our own immune system can
detect and destroy dangerous molecules from the blood (Zamai et al. 2007). Thus, the mononuclear
cell fraction does not necessarily include precisely the target tumor cells but instead the fraction
could partly represent phagocyted tumor cells in macrophages.
5.3 The expression of TMPRSS2:ERG in the clinical prostate cancer blood
samples
The detection frequency of TMPRSS2:ERG fusion transcript was confirmed to be relatively low.
There were only 25.8% (38 of 147) prostatectomy treated patients who had TMPRSS2:ERG fusion.
To confirm TMPRSS2:ERG fusion status (38 of 147) from the first reaction, TaqMan assay was
repeated two times and the fusion positive samples were detected as follows: 5.3% (2 of 38) and
15.8% (6 of 38). It could be considered that there was a poor reproducibility and specificity in
TaqMan assay due to the variable number of fusion positive samples in each reaction. Moreover, a
total of 30.8% (4 of 13), 0% (0 of 4), and 25% (1 of 4) of the hormonal treated patients had the
fusion. Finally, no expression of the fusion gene could be detected among radiotherapy treated
patients.
The major challenges during CTC analysis are preanalytical processing of CTCs and qualitative and
quantitative target CTC gene expression analysis. In order to eliminate the errors and variability of
KLK2 (kallikrein-related peptidase 2) and KLK3 (kallikrein-related peptidase 3, i.e. PSA) expression
in different steps of the assay, Helo et al. (2009) used target gene-specific internal standard RNA.
The construction of an internal standard calibrator was described by Ylikoski et al. (1999). In the
study by Helo et al. (2009) KLK2- and KLK3-specific m3PSA internal standard RNA was directly
added into PC patients’ blood samples at the beginning of RNA extraction. The cDNA synthesis was
performed with sequence specific RNA primers and anchored Oligo-dT primers designed for KLK
and internal standard RNA. An external standard curve was established with different quantities of
KLK2, KLK3, and m3PSA mRNA, and was used for the analysis of PC patients’ blood samples. In a
real-time quantitative PCR assay Helo et al. (2009) used a target sequence-specific 5´ fluorescently
labelled lanthanide chelate probe, and 5´ to 3´ exonucleolytic DNA polymerase. The difference
between m3PSA internal standard gene expression in duplicate reactions was 0.5 Ct and the variation
in KLK2 and KLK3 gene expression was only 1 Ct. In this study, the expression of KLK3 or KLK2
mRNA could be detected in the blood of 49% (37 of 76) of the CRPC patients, whereas only 8% (15
of 76) of localized PC patients had KLK3 or KLK2 expression, suggesting that the number of CTCs
increases during the metastatic stage of PC. Therefore, it may be argued that the probability of
detecting more TMPRSS2:ERG gene fusions in clinical PC blood samples could have possibly been
increased in the present study if internal standards had been used during RNA isolation step.
In this study there were more pT2 than pT3 stage tumors. This mean there were more clinically
localized PCs (i.e. tumors wheich were confined to the prostate gland) than locally advanced PCs.
No metastases to other organs were reported in any of the PC patients. In addition, after
prostatectomy PSA progression occurred in total of 42.9% (63 of 147) patients, whereas 57.1% (100
of 147) of prostatectomy treated patients did not have PSA progression during the follow-up period.
Moreover, according to present results the expression of TMPRSS2:ERG fusion was more commonly
found in PC recurrent cases (26.9%) compared to non-recurrent cases (25%). Since it is known that
the frequency of TMPRSS2:ERG fusions increases from moderately to poorly differentiated tumors
(Rajput et al. 2007), it could be argued that the possibility of detecting fusion positive CTCs may
have been slightly increased had there been a larger cohort of advanced or metastatic stage of PC
patients. In addition, it may be assumed that the number of CTCs and the frequency of
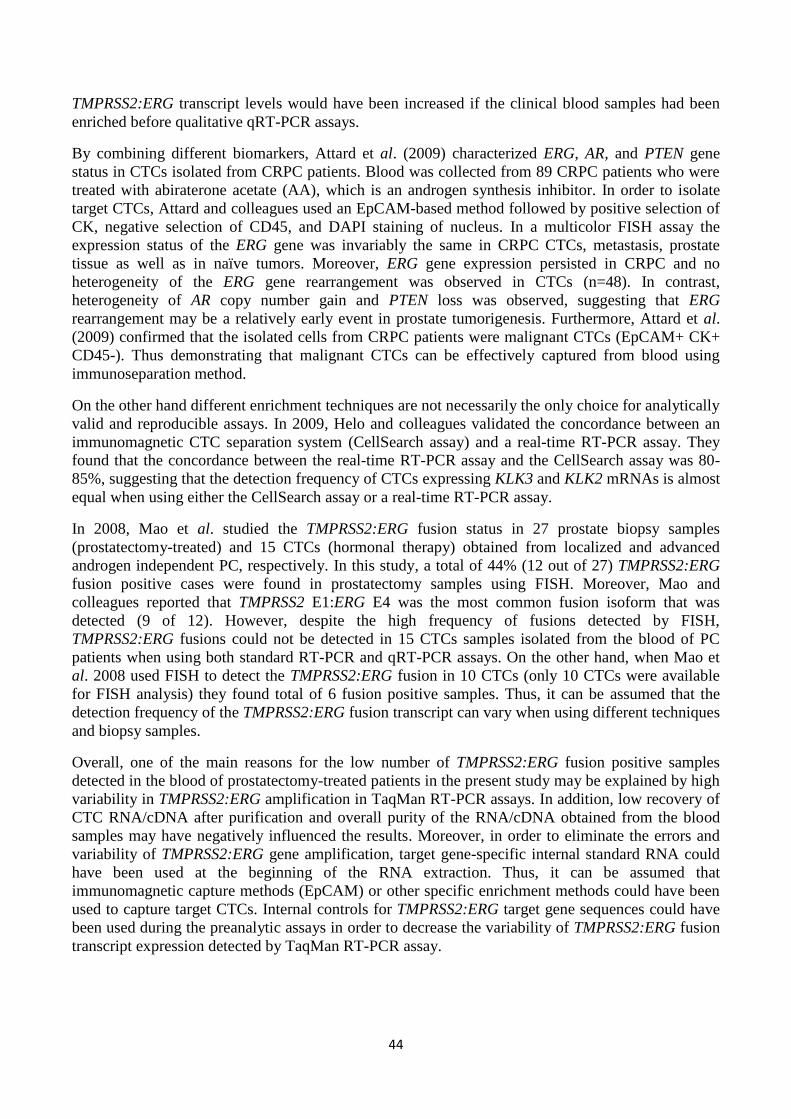
44
TMPRSS2:ERG transcript levels would have been increased if the clinical blood samples had been
enriched before qualitative qRT-PCR assays.
By combining different biomarkers, Attard et al. (2009) characterized ERG, AR, and PTEN gene
status in CTCs isolated from CRPC patients. Blood was collected from 89 CRPC patients who were
treated with abiraterone acetate (AA), which is an androgen synthesis inhibitor. In order to isolate
target CTCs, Attard and colleagues used an EpCAM-based method followed by positive selection of
CK, negative selection of CD45, and DAPI staining of nucleus. In a multicolor FISH assay the
expression status of the ERG gene was invariably the same in CRPC CTCs, metastasis, prostate
tissue as well as in naïve tumors. Moreover, ERG gene expression persisted in CRPC and no
heterogeneity of the ERG gene rearrangement was observed in CTCs (n=48). In contrast,
heterogeneity of AR copy number gain and PTEN loss was observed, suggesting that ERG
rearrangement may be a relatively early event in prostate tumorigenesis. Furthermore, Attard et al.
(2009) confirmed that the isolated cells from CRPC patients were malignant CTCs (EpCAM+ CK+
CD45-). Thus demonstrating that malignant CTCs can be effectively captured from blood using
immunoseparation method.
On the other hand different enrichment techniques are not necessarily the only choice for analytically
valid and reproducible assays. In 2009, Helo and colleagues validated the concordance between an
immunomagnetic CTC separation system (CellSearch assay) and a real-time RT-PCR assay. They
found that the concordance between the real-time RT-PCR assay and the CellSearch assay was 80-
85%, suggesting that the detection frequency of CTCs expressing KLK3 and KLK2 mRNAs is almost
equal when using either the CellSearch assay or a real-time RT-PCR assay.
In 2008, Mao et al. studied the TMPRSS2:ERG fusion status in 27 prostate biopsy samples
(prostatectomy-treated) and 15 CTCs (hormonal therapy) obtained from localized and advanced
androgen independent PC, respectively. In this study, a total of 44% (12 out of 27) TMPRSS2:ERG
fusion positive cases were found in prostatectomy samples using FISH. Moreover, Mao and
colleagues reported that TMPRSS2 E1:ERG E4 was the most common fusion isoform that was
detected (9 of 12). However, despite the high frequency of fusions detected by FISH,
TMPRSS2:ERG fusions could not be detected in 15 CTCs samples isolated from the blood of PC
patients when using both standard RT-PCR and qRT-PCR assays. On the other hand, when Mao et
al. 2008 used FISH to detect the TMPRSS2:ERG fusion in 10 CTCs (only 10 CTCs were available
for FISH analysis) they found total of 6 fusion positive samples. Thus, it can be assumed that the
detection frequency of the TMPRSS2:ERG fusion transcript can vary when using different techniques
and biopsy samples.
Overall, one of the main reasons for the low number of TMPRSS2:ERG fusion positive samples
detected in the blood of prostatectomy-treated patients in the present study may be explained by high
variability in TMPRSS2:ERG amplification in TaqMan RT-PCR assays. In addition, low recovery of
CTC RNA/cDNA after purification and overall purity of the RNA/cDNA obtained from the blood
samples may have negatively influenced the results. Moreover, in order to eliminate the errors and
variability of TMPRSS2:ERG gene amplification, target gene-specific internal standard RNA could
have been used at the beginning of the RNA extraction. Thus, it can be assumed that
immunomagnetic capture methods (EpCAM) or other specific enrichment methods could have been
used to capture target CTCs. Internal controls for TMPRSS2:ERG target gene sequences could have
been used during the preanalytic assays in order to decrease the variability of TMPRSS2:ERG fusion
transcript expression detected by TaqMan RT-PCR assay.
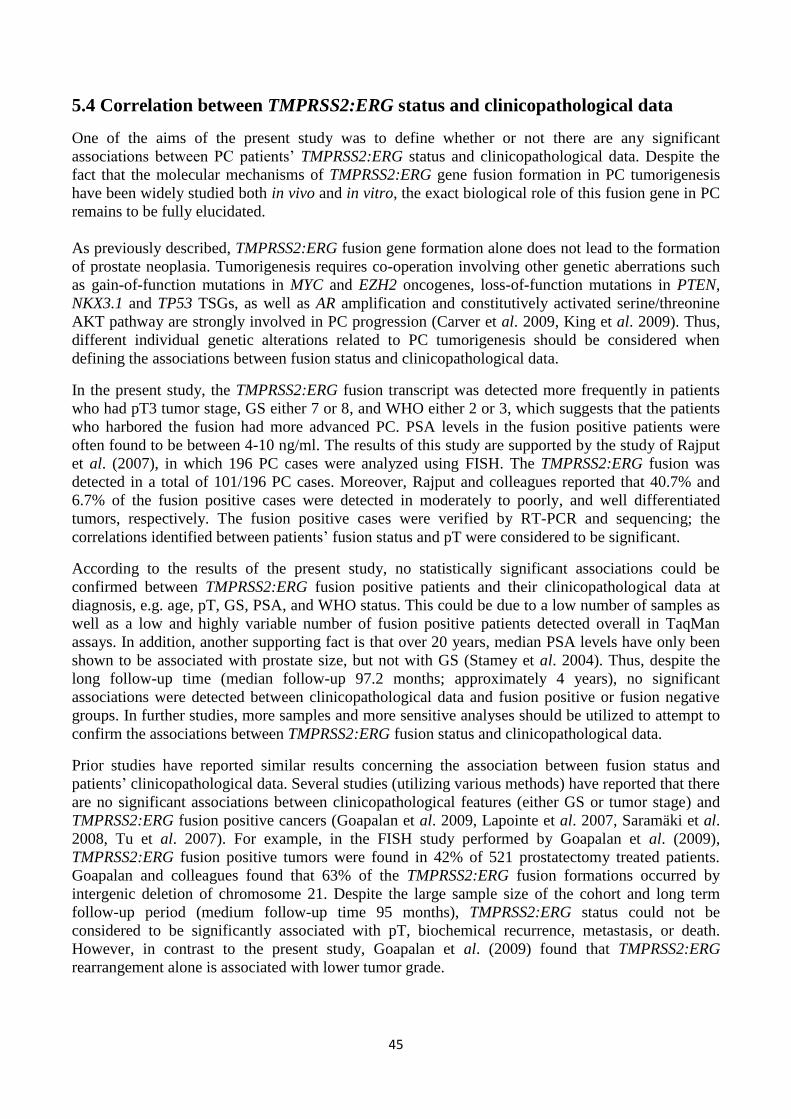
45
5.4 Correlation between TMPRSS2:ERG status and clinicopathological data
One of the aims of the present study was to define whether or not there are any significant
associations between PC patients’ TMPRSS2:ERG status and clinicopathological data. Despite the
fact that the molecular mechanisms of TMPRSS2:ERG gene fusion formation in PC tumorigenesis
have been widely studied both in vivo and in vitro, the exact biological role of this fusion gene in PC
remains to be fully elucidated.
As previously described, TMPRSS2:ERG fusion gene formation alone does not lead to the formation
of prostate neoplasia. Tumorigenesis requires co-operation involving other genetic aberrations such
as gain-of-function mutations in MYC and EZH2 oncogenes, loss-of-function mutations in PTEN,
NKX3.1 and TP53 TSGs, as well as AR amplification and constitutively activated serine/threonine
AKT pathway are strongly involved in PC progression (Carver et al. 2009, King et al. 2009). Thus,
different individual genetic alterations related to PC tumorigenesis should be considered when
defining the associations between fusion status and clinicopathological data.
In the present study, the TMPRSS2:ERG fusion transcript was detected more frequently in patients
who had pT3 tumor stage, GS either 7 or 8, and WHO either 2 or 3, which suggests that the patients
who harbored the fusion had more advanced PC. PSA levels in the fusion positive patients were
often found to be between 4-10 ng/ml. The results of this study are supported by the study of Rajput
et al. (2007), in which 196 PC cases were analyzed using FISH. The TMPRSS2:ERG fusion was
detected in a total of 101/196 PC cases. Moreover, Rajput and colleagues reported that 40.7% and
6.7% of the fusion positive cases were detected in moderately to poorly, and well differentiated
tumors, respectively. The fusion positive cases were verified by RT-PCR and sequencing; the
correlations identified between patients’ fusion status and pT were considered to be significant.
According to the results of the present study, no statistically significant associations could be
confirmed between TMPRSS2:ERG fusion positive patients and their clinicopathological data at
diagnosis, e.g. age, pT, GS, PSA, and WHO status. This could be due to a low number of samples as
well as a low and highly variable number of fusion positive patients detected overall in TaqMan
assays. In addition, another supporting fact is that over 20 years, median PSA levels have only been
shown to be associated with prostate size, but not with GS (Stamey et al. 2004). Thus, despite the
long follow-up time (median follow-up 97.2 months; approximately 4 years), no significant
associations were detected between clinicopathological data and fusion positive or fusion negative
groups. In further studies, more samples and more sensitive analyses should be utilized to attempt to
confirm the associations between TMPRSS2:ERG fusion status and clinicopathological data.
Prior studies have reported similar results concerning the association between fusion status and
patients’ clinicopathological data. Several studies (utilizing various methods) have reported that there
are no significant associations between clinicopathological features (either GS or tumor stage) and
TMPRSS2:ERG fusion positive cancers (Goapalan et al. 2009, Lapointe et al. 2007, Saramäki et al.
2008, Tu et al. 2007). For example, in the FISH study performed by Goapalan et al. (2009),
TMPRSS2:ERG fusion positive tumors were found in 42% of 521 prostatectomy treated patients.
Goapalan and colleagues found that 63% of the TMPRSS2:ERG fusion formations occurred by
intergenic deletion of chromosome 21. Despite the large sample size of the cohort and long term
follow-up period (medium follow-up time 95 months), TMPRSS2:ERG status could not be
considered to be significantly associated with pT, biochemical recurrence, metastasis, or death.
However, in contrast to the present study, Goapalan et al. (2009) found that TMPRSS2:ERG
rearrangement alone is associated with lower tumor grade.
46
The strength of the present study was the long-term follow-up period (median follow-up 97.2
months), however, had there been a greater number of samples, it may have been possible to identify
a better correlation between patients’ clinicopathological data and their fusion status. According to
these results, it can be concluded that TMPRSS2:ERG fusion status in the blood cannot be used as a
predictive biomarker using the TaqMan assay alone. Moreover, since TMPRSS2:ERG fusion gene is
androgen regulated, it could be argued that the combination of different biomarkers – such as
different androgen regulated genes – may have been better in the prediction of patients’ outcome
according to clinicopathological features. Thus, in order to predict patient outcome according to
individual’s TMPRSS2:ERG status, more sensitive methods, larger sample cohorts, and eventually
more combined biomarkers are needed.
In 2004, Mitsiades and colleagues reported that the combined detection of PSMA and PSA in nested
RT-PCR increased the specificity of the nested RT-PCR reaction. They performed nested PCR for
PSA and PSMA transcripts and found that the combined expressions of PSA and PSMA transcripts
found in peripheral blood leukocytes (PBL) and in bone marrow (BM) samples indicated a
significantly shorter time to PSA level increment after prostatectomy. Moreover, in 2010 Joung and
colleagues reported that membrane surface glycoprotein PSCA mRNA detected by nested RT-PCR
in the peripheral blood of high-risk PC patients is a significant factor indicative of PC recurrence
after prostatectomy. These results suggest that different prostate tumor antigens detected in CTCs
may have prognostic value. On the other hand, Thomas et al. (2002) could not confirm the clinical
value of PSA and PSMA detected by combined nested RT-PCR.
5.5 Prognostic value of TMPRSS2:ERG status in blood of prostate cancer patients
One of the aims of the present study was to validate if TMPRSS2:ERG fusion status could be a
possible prognostic tool to help predict PC patients’ outcome and survival. In the present study
TMPRSS2:ERG fusion was detected in 26.9% (17 of 63) of the recurrent PC cases in the first
TaqMan assay. On the other hand, total of 25% (21 of 84) PC patients who did not have PC
recurrence after prostatectomy possessed the TMPRSS2:ERG fusion. In the second TaqMan assay,
there was a total of 5.9% of fusion positive cases with PC recurrence, whereas 4.8% of non-recurrent
PC patients expressed the fusion. Moreover, in the third TaqMan assay, TMPRSS2:ERG fusions were
detected more frequently (19%; 4 of 20) in non-recurrent PC cases compared to recurrent PC cases
11.8% (2 of 16). Thus, the frequency of TMPRSS2:ERG fusion was slightly increased in recurrent
PC cases compared to non-recurrent PC cases (except in the last TaqMan assay).
Interestingly, the time to PSA recurrence was notably longer for the patients who had
TMPRSS2:ERG fusion (63.29 months) compared to fusion negative PC patients (50.81 months).
Thus, it could be argued that those patients who harbored the TMPRSS2:ERG fusion had more
favorable prognosis compared to fusion negative patients. However, the difference between
TMPRSS2:ERG status in recurrent and non-recurrent PC patients could not be considered to be
significant in any assays. Thus, no definitive conclusions can be drawn from these results. The
present results are supported by other studies, since there have been several controversial results
regarding the prognostic value of TMPRSS2:ERG status (Fitzgerald et al. 2007, Goapalan et al.
2009, Hermans et al. 2009, Lapointe et al. 2007, Saramäki et al. 2008, Wang et al. 2006).
TMPRSS2:ERG fusion status has been shown to be associated both positively and negatively with
the outcome of PC patients. Fitzgerald et al. (2007) and Wang et al. (2006) observed poor outcome
in patients harboring the fusion. Furthermore, Wang et al. (2006) showed that the fusion transcript
variants of TMPRSS2 E1:ERG E2, TMPRSS2 E1:ERG E3, and TMPRSS2 E2:ERG E4 are involved in
pathogenic progression of aggressive PC, seminal vesicle invasion, and early PSA recurrence. Thus,
47
the expression of TMPRSS2:ERG fusion transcript variants may negatively affect patient outcome.
In contrast, Hermans et al. (2009) and Saramäki et al. (2008) found that PC patients harboring the
TMPRSS2:ERG fusion have more favorable prognoses. Conversely, different studies have also
reported that there are no significant correlations between fusion status and clinical prognosis
(Goapalan et al. 2009, Lapointe et al. 2007).
In 2011, Danila and colleagues showed that TMPRSS2:ERG fusion status in CTCs is a predictive
biomarker of sensitivity after AA treatment. They used the CellSearch system to enumerate CTCs, a
TaqMan assay to confirm the fusion status in CTCs isolated from CRPC patients, and finally, FISH
analysis in primary tumor samples to confirm the results. They found total of 37% (15 of 41) of
fusion positive CRPC patients had a median CTC count of 17 in 7.5 ml of blood. After AA treatment
a PSA decline ≥50% was found in 47% (7 of 15) of fusion positive patients and in 38% (10 of 26) of
fusion negative patients. Danila et al. (2011) reported that patients who had five or more CTCs in
their circulation after 4 weeks of AA therapy had significantly shorter overall survival. However,
Danila and colleagues confirmed that there were no associations between TMPRSS2:ERG status and
PSA decline and there were no significant differences in overall survival between fusion positive and
fusion negative patients.
In the present study, TMPRSS2:ERG status could not be considered to be associated with patient
outcome: a conclusion which is supported by several previous studies as described above.
Controversial results of the prevalence and prognostic significance of TMPRSS2:ERG fusion status
observed in different studies could be explained by the fact that researchers have been using different
techniques for the detection and characterization of TMPRSS2:ERG gene rearrangements in blood
and PC tissues. Moreover, high variability of novel potential TMPRSS2:ERG fusion products, in
addition to individual genetic differences may have certain effects when defining patient outcome in
relation to TMPRSS2:ERG fusion status. In order to be able to acurately predict patient outcome and
discriminate between low and high risk patient groups, more combined prostate tumor-specific
biomarkers, reliable assays, and larger sample cohorts are required.
6. CONCLUSIONS
According to the results of the present study, the TaqMan assay can be confirmed to be a more
sensitive method for qualitative gene expression analysis than SYBR Green and iScript One-Step
RT-PCR assays. However, the TaqMan assay cannot be considered to be a sufficiently sensitive and
specific method in the detection of TMPRSS2:ERG fusion in the blood of PC patients without valid
preanalytical assays. The efficiency of preanalytic target CTC isolation could be increased by using
target gene-specific internal controls at the beginning of the assay, starting at the RNA isolation
stage. Furthermore, different enrichment, isolation, and characterization methods could potentially
increase the probability of detecting more target CTCs before validating TMPRSS2:ERG fusion
status in the blood of PC patients by qualitative TaqMan gene expression assays. Moreover, due to
the heterogeneic nature of PC and individual genetic variability, TMPRSS2:ERG fusion status in
blood of PC patients cannot be used alone to determine patient prognosis and outcome. Therefore, in
order to accurately separate tumors into distinct prognostic categories, and to better predict the
outcome of the patients, more variable combinations of tumor- and tissue-specific, as well as blood
based biomarkers are needed. In the future, it would be interesting to evaluate how TMPRSS2:ERG
fusion could be used in combination with other biomarkers in order to better predict and monitor
patients’ prognosis.

48
ACKNOWLEDGEMENTS
First of all, I am very grateful for Prof. Tapio Visakorpi for giving me the opportunity to perform this
study in his research group at Institute of Biomedical Technology in Tampere, Finland.
Moreover, I am sincerely thankful to my supervisor, Heini Kallio, PhD, for teaching me during this
project and for giving me valuable scientific advice.
I would also like to thank Kati Waltering, PhD, and Outi Saramäki, PhD, for their help in the
statistical analysis of the results.
In addition, I am grateful to Merja Helenius for giving interesting lectures about cell culture
techniques and for giving me important advice, especially during VCaP cell culturing.
Furthermore, I wish to thank Mariitta Vakkuri and Päivi Martikainen for their skillful technical
assistance in the lab.
Overall, I want to thank all of the group members in Prof. Visakorpi’s lab, it was really nice to work
with you!
Finally, I owe my warmest and personal gratitude to my family for their everlasting support and
encouragement in my life!
49
REFERENCES
Abdulkadir S. A., Magee J. A., Peters T. J., Kaleem Z., Naughton C. K., Humphrey P. A., Milbrandt J. (2002)
Conditional loss of Nkx3.1 in adult mice induces prostatic intraepithelial neoplasia. Molecular and Cellular Biology
22, 1495-1503
Afar D. E. H., Vivanco I., Hubert R. S., Kuo J., Chen E., Saffran D. C., Raitano A. B., Jakobovits A. (2001) Catalytic
cleavage of the androgen-regulated TMPRSS2 protease results in its secretion by prostate and prostate cancer
epithelia. Cancer Research 61, 1686-1692
Albihn A., Johnsen J. I., Henriksson M. A. (2010) MYC in oncogenesis and as a target for cancer therapies.
Advanced Cancer Research 107, 163-224
Alix-Panabières C. (2012) EPISPOT assay: detection of viable DTCs/CTCs in solid tumor patients. Recent results in
cancer research 195, 69-76
Al Olama A. A., Kote-Jarai Z., Giles G. G., Guy M., Morrison J., Severi G., Leongamornlert D. A., Tymrakiewicz M.,
Jhavar S., Saunders E., Hopper J. L., Southey M. C., Muir K. R., English D. R., Dearnaley D. P., Ardern-Jones A. T.,
Hall A. L., O´Brien L. T., Wilkinson R. A., Sawyer E., Lophatananon A. (2009) Multiple loci on 8q24 associated with
prostate cancer susceptibility. Nature Genetics 41, 1058-1060
Appelwhite J. C., Matalaga B. R, McCullough D. L., Hall M. C. (2001) Transrectal ultrasound and biopsy in the
early diagnosis of prostate cancer. Cancer Control 8, 141-150
Asatiani E., Huang W. X., Wang A., Rodriguez Ortner E., Cavalli L. R., Haddad B. R., Gelmann E. P. (2005) Deletion,
methylation and expression of the NKX3.1 suppression gene in primary human prostate cancer. Cancer Research
65, 1164-1173
Attard G., Sarker D., Reid A., Molife R., Parker C., de Bono J. S. (2006) Improving the outcome of patients with
castration-resistant prostate cancer through rational drug development. British Journal of Cancer 95, 767-774
Attard G., Swennenhuis J. F., Olmos D., Reid A. H. M., Vickers E., A’Hern R., Levink R., Coumans F., Moreira J.,
Riisnaes R., Oommen N. B., Hawche G., Jameson C., Thompson E., Ronald S., Carden C. P., Parker C., Dearnaley D.,
Kaye S. B., Cooper C. S., Molina A., Cox M. E., W.M.M. Terstappen L., de Bono J. S. (2009) Characterization of
ERG, AR and PTEN gene status in circulating tumor cells from patients with castration-resistant prostate cancer.
Cancer Research 69, 2912-2918
Ayala A. G., and Ro J. Y. (2007) Prostatic intraepithelial neoplasia: recent advances. Archives of Pathology &
Laboratory Medicine 131, 1257-1266
Berger A., Knudson A., and Pandolfi P. (2011) A continuum model for tumour suppression. Nature 476, 163-169
Bhatia-Gaur R., Donjacour A. A., Sciavolino P. J., Kim M., Desai N., Young P., Norton C. R., Gridley T., Cardiff R. D.,
Cunha G. R., Abate-Shen C., Shen M. M. (1999) Roles for Nkx3.1 in prostate development and cancer. Genes &
Development 13, 966-977
Bismar T. A., Yoshimoto M., Vollmer R. T., Duan Q., Firszt M., Corcos J., Squire J. A. (2011) PTEN genomic deletion
is an early event associated with ERG gene rearrangements in prostate cancer. British Journal of Urology
International 107, 477-485
Bonkhoff H., Stein U., and Remberger K. (1994) The proliferative function of basal cells in the normal and
hyperplastic human prostate. Prostate 24, 114-118
Bookstein R., MacGrogan D., Hilsenbeck S. G., Sharkey F., Allred DC. (1993) p53 is mutated in a subset of advanced-
stage of prostate cancers. Cancer Research 53, 3369-3373
Bowen C., Bubendorf L., Voeller H. J., Sack R., Willi N., Sauter G., Gasser T. C., Koivisto P., Lack E. E., Kononen J.,
Kallioniemi OP., Gelmann E. P. (2000) Loss of NKX3.1 expression in human prostate cancers correlates with
tumor progression. Cancer Research 60, 6111-6115
50
Bubendorf L., Schopfer A., Wagner U., Sauter G., Moch H., Willi N., Gasser T. C., Mihatsch M. J. (2000) Metastatic
patterns of prostate cancer: an autopsy study of 1,589 patients. Human Pathology 31, 578-583
Bushman W. (2009) Etiology, epidemiology, and natural history of benign prostatic hyperplasia. Urologic Clinics
of North America 36, 403-415
Bustin S. A. (2000) Absolute quantification of mRNA using real-time reverse transcription polymerase chain
reaction assays. Journal of Molecular Endocrinology 25, 169-193
Cai C., and Balk S. (2011) Intratumoral androgen biosynthesis in prostate cancer pathogenesis and response to
therapy. Endocrine-Related Cancer 18, R175-182
Cantley L. C. (2002) The phosphoinositide 3-kinase pathway. Science 296, 1655-1657
Carpten J., Nupponen N., Isaacs S., Sood R., Robbins C., Xu J., Faruque M., Moses T., Ewing C., Gillanders E., Hu P.,
Bujinovszky P., Makalowska I., Baffoe-Bonnie A., Faith D., Smith J., Stephan D., Wiley K., Brownstein M., Gildea D.,
Kelly B., Jenkins R., Hostetter G., Matikainen M., Schleutker J., Klinger K., Connors T., Xiang Y., Wang Z., De Marzo
A., Papadopoulos N., Kallioniemi O. P., Burk R., Meyers D., Grönberg H., Meltzer P., Silverman R., Bailey-Wilson J.,
Walsh P., Isaacs W., Trent J. (2002) Germline mutations in the ribonuclease L gene in families showing linkage with
HPC1. Nature Genetics 30, 181-184
Carver B. S., Chapinski C., Wongvipat J., Hieronymus H., Chen Y., Chandarlapaty S., Arora V. K., Le C., Koutcher J.,
Scher H., Scardino P. T., Rosen N., Sawyers C. L. (2011) Reciprocal Feedback Regulation of PI3K and Androgen
Receptor Signaling in PTEN-Deficient prostate cancer. Cancer Cell 19, 575-586
Carver B. S., Tran J., Gopalan A., Chen Z., Shaikh S., Carracedo A., Alimonti A., Nardella C., Varmeh S., Scardino P.
T., Cordon-Cardo C., Gerald W., Pandolfi P. P. (2009) Aberrant ERG expression cooperates with loss of PTEN to
promote cancer progression in the prostate. Nature Genetics 41, 619-624
Cerhan J. R., Parker A. S., Putnam S. D., Chiu B. C., Lynch C. F., Cohen M. B., Torner J. C., Cantor K. P. (1999)
Family history and prostate cancer risk in a population-based cohort of Iowa men. Cancer Epidemiological
Biomarkers Prev. 8, 52-60
Chambers A. F., Groom A. C., MacDonald I. C. (2002) Dissemination and growth of cancer cells in metastatic sites.
Nature Reviews Cancer 2, 563-572
Chen C. D., Welsbie D. S., Tran C., Baek S. H. Chen R., Vessella R., Rosenfeld M. G., Sawyers C. L. (2004) Molecular
determinants of resistance to antiandrogen therapy. Nature Medicine 10, 33-39
Clark J. P., Cooper C. S. (2009) ETS gene fusions in prostate cancer. Nature Reviews Urology 6, 429-439
Cook W. D. and McCaw B. J. (2000) Accommodating haploinsufficient tumour suppressor genes in Knudson´s
model. Oncogene 19, 3434-3438
Croce, C. M. (2008) Molecular origins of cancer, Oncogenes and Cancer. The New England Journal of Medicine 358,
502-511
Damber J. E., and Aus G. (2008) Prostate cancer. Lancet 371, 1710-1721
Danila D. C., Anand A., Sung C. C., Heller G., Leversha M. A., Cao L., Lilja H., Molina A., Sawyers C. L., Fleisher M.,
Scher H. I. (2011) TMPRSS2:ERG status in circulating tumor cells as a predictive biomarker of sensitivity in
castration-resistant prostate cancer patients treated with abiraterone acetate. European Urology 60, 897-904
De Marzo A. M., Nelson W. G., Meeker A. K., and Coffey D. S. (1998) Stem cell features of benign and malignant
prostate epithelial cells. Journal of Urology 160, 2381-2392
Doyen J., Alix-Panabières C., Hofman P., Parks S. K., Chamorey E., Naman H., Hannoun-Lévi J. M. (2012) Circulating
tumor cells in prostate cancer: A potential surrogate marker of survival. Critical Reviews in Oncology/Hematology
81, 241-256
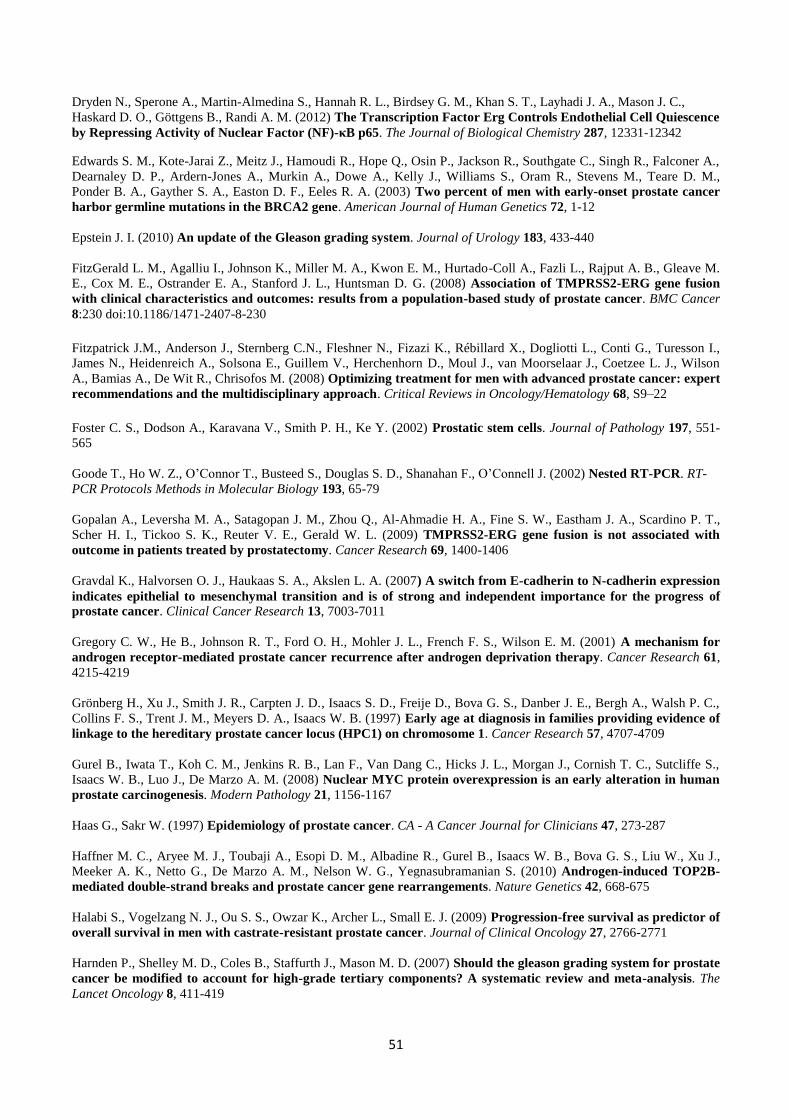
51
Dryden N., Sperone A., Martin-Almedina S., Hannah R. L., Birdsey G. M., Khan S. T., Layhadi J. A., Mason J. C.,
Haskard D. O., Göttgens B., Randi A. M. (2012) The Transcription Factor Erg Controls Endothelial Cell Quiescence
by Repressing Activity of Nuclear Factor (NF)-κB p65. The Journal of Biological Chemistry 287, 12331-12342
Edwards S. M., Kote-Jarai Z., Meitz J., Hamoudi R., Hope Q., Osin P., Jackson R., Southgate C., Singh R., Falconer A.,
Dearnaley D. P., Ardern-Jones A., Murkin A., Dowe A., Kelly J., Williams S., Oram R., Stevens M., Teare D. M.,
Ponder B. A., Gayther S. A., Easton D. F., Eeles R. A. (2003) Two percent of men with early-onset prostate cancer
harbor germline mutations in the BRCA2 gene. American Journal of Human Genetics 72, 1-12
Epstein J. I. (2010) An update of the Gleason grading system. Journal of Urology 183, 433-440
FitzGerald L. M., Agalliu I., Johnson K., Miller M. A., Kwon E. M., Hurtado-Coll A., Fazli L., Rajput A. B., Gleave M.
E., Cox M. E., Ostrander E. A., Stanford J. L., Huntsman D. G. (2008) Association of TMPRSS2-ERG gene fusion
with clinical characteristics and outcomes: results from a population-based study of prostate cancer. BMC Cancer
8:230 doi:10.1186/1471-2407-8-230
Fitzpatrick J.M., Anderson J., Sternberg C.N., Fleshner N., Fizazi K., Rébillard X., Dogliotti L., Conti G., Turesson I.,
James N., Heidenreich A., Solsona E., Guillem V., Herchenhorn D., Moul J., van Moorselaar J., Coetzee L. J., Wilson
A., Bamias A., De Wit R., Chrisofos M. (2008) Optimizing treatment for men with advanced prostate cancer: expert
recommendations and the multidisciplinary approach. Critical Reviews in Oncology/Hematology 68, S9–22
Foster C. S., Dodson A., Karavana V., Smith P. H., Ke Y. (2002) Prostatic stem cells. Journal of Pathology 197, 551-
565
Goode T., Ho W. Z., O’Connor T., Busteed S., Douglas S. D., Shanahan F., O’Connell J. (2002) Nested RT-PCR. RT-
PCR Protocols Methods in Molecular Biology 193, 65-79
Gopalan A., Leversha M. A., Satagopan J. M., Zhou Q., Al-Ahmadie H. A., Fine S. W., Eastham J. A., Scardino P. T.,
Scher H. I., Tickoo S. K., Reuter V. E., Gerald W. L. (2009) TMPRSS2-ERG gene fusion is not associated with
outcome in patients treated by prostatectomy. Cancer Research 69, 1400-1406
Gravdal K., Halvorsen O. J., Haukaas S. A., Akslen L. A. (2007) A switch from E-cadherin to N-cadherin expression
indicates epithelial to mesenchymal transition and is of strong and independent importance for the progress of
prostate cancer. Clinical Cancer Research 13, 7003-7011
Gregory C. W., He B., Johnson R. T., Ford O. H., Mohler J. L., French F. S., Wilson E. M. (2001) A mechanism for
androgen receptor-mediated prostate cancer recurrence after androgen deprivation therapy. Cancer Research 61,
4215-4219
Grönberg H., Xu J., Smith J. R., Carpten J. D., Isaacs S. D., Freije D., Bova G. S., Danber J. E., Bergh A., Walsh P. C.,
Collins F. S., Trent J. M., Meyers D. A., Isaacs W. B. (1997) Early age at diagnosis in families providing evidence of
linkage to the hereditary prostate cancer locus (HPC1) on chromosome 1. Cancer Research 57, 4707-4709
Gurel B., Iwata T., Koh C. M., Jenkins R. B., Lan F., Van Dang C., Hicks J. L., Morgan J., Cornish T. C., Sutcliffe S.,
Isaacs W. B., Luo J., De Marzo A. M. (2008) Nuclear MYC protein overexpression is an early alteration in human
prostate carcinogenesis. Modern Pathology 21, 1156-1167
Haas G., Sakr W. (1997) Epidemiology of prostate cancer. CA - A Cancer Journal for Clinicians 47, 273-287
Haffner M. C., Aryee M. J., Toubaji A., Esopi D. M., Albadine R., Gurel B., Isaacs W. B., Bova G. S., Liu W., Xu J.,
Meeker A. K., Netto G., De Marzo A. M., Nelson W. G., Yegnasubramanian S. (2010) Androgen-induced TOP2B-
mediated double-strand breaks and prostate cancer gene rearrangements. Nature Genetics 42, 668-675
Halabi S., Vogelzang N. J., Ou S. S., Owzar K., Archer L., Small E. J. (2009) Progression-free survival as predictor of
overall survival in men with castrate-resistant prostate cancer. Journal of Clinical Oncology 27, 2766-2771
Harnden P., Shelley M. D., Coles B., Staffurth J., Mason M. D. (2007) Should the gleason grading system for prostate
cancer be modified to account for high-grade tertiary components? A systematic review and meta-analysis. The
Lancet Oncology 8, 411-419
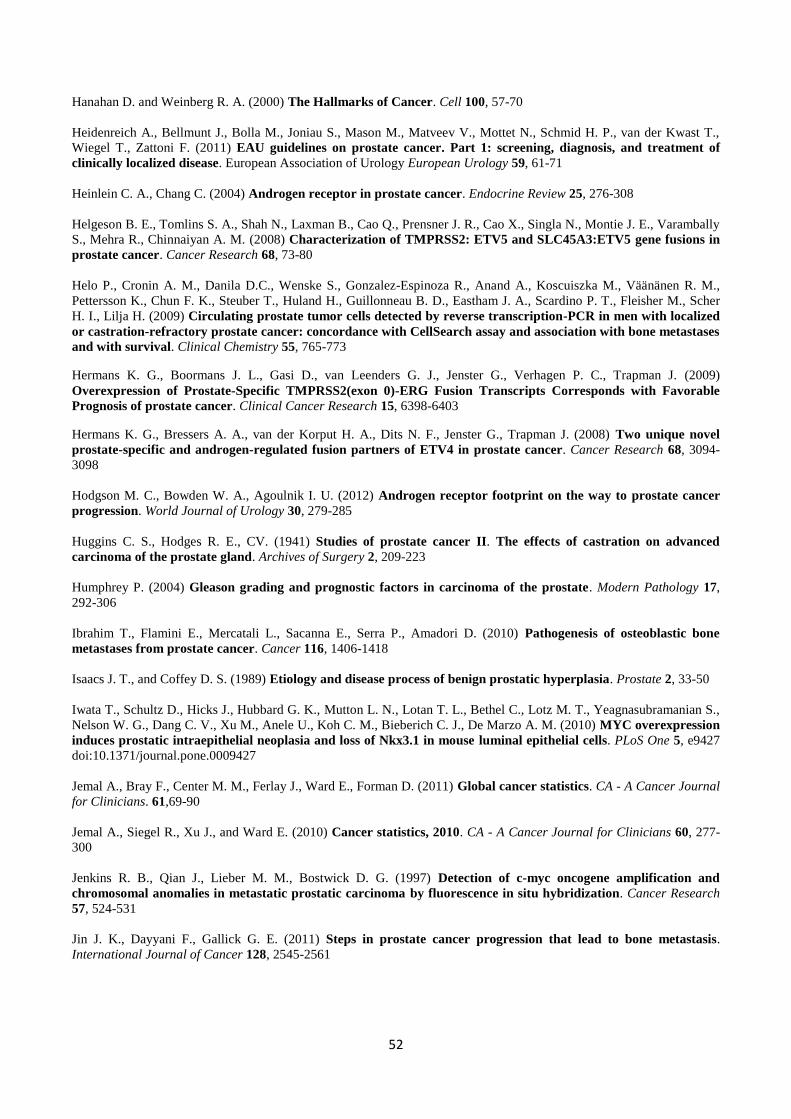
52
Hanahan D. and Weinberg R. A. (2000) The Hallmarks of Cancer. Cell 100, 57-70
Heidenreich A., Bellmunt J., Bolla M., Joniau S., Mason M., Matveev V., Mottet N., Schmid H. P., van der Kwast T.,
Wiegel T., Zattoni F. (2011) EAU guidelines on prostate cancer. Part 1: screening, diagnosis, and treatment of
clinically localized disease. European Association of Urology European Urology 59, 61-71
Heinlein C. A., Chang C. (2004) Androgen receptor in prostate cancer. Endocrine Review 25, 276-308
Helgeson B. E., Tomlins S. A., Shah N., Laxman B., Cao Q., Prensner J. R., Cao X., Singla N., Montie J. E., Varambally
S., Mehra R., Chinnaiyan A. M. (2008) Characterization of TMPRSS2: ETV5 and SLC45A3:ETV5 gene fusions in
prostate cancer. Cancer Research 68, 73-80
Helo P., Cronin A. M., Danila D.C., Wenske S., Gonzalez-Espinoza R., Anand A., Koscuiszka M., Väänänen R. M.,
Pettersson K., Chun F. K., Steuber T., Huland H., Guillonneau B. D., Eastham J. A., Scardino P. T., Fleisher M., Scher
H. I., Lilja H. (2009) Circulating prostate tumor cells detected by reverse transcription-PCR in men with localized
or castration-refractory prostate cancer: concordance with CellSearch assay and association with bone metastases
and with survival. Clinical Chemistry 55, 765-773
Hermans K. G., Boormans J. L., Gasi D., van Leenders G. J., Jenster G., Verhagen P. C., Trapman J. (2009)
Overexpression of Prostate-Specific TMPRSS2(exon 0)-ERG Fusion Transcripts Corresponds with Favorable
Prognosis of prostate cancer. Clinical Cancer Research 15, 6398-6403
Hermans K. G., Bressers A. A., van der Korput H. A., Dits N. F., Jenster G., Trapman J. (2008) Two unique novel
prostate-specific and androgen-regulated fusion partners of ETV4 in prostate cancer. Cancer Research 68, 3094-
3098
Hodgson M. C., Bowden W. A., Agoulnik I. U. (2012) Androgen receptor footprint on the way to prostate cancer
progression. World Journal of Urology 30, 279-285
Huggins C. S., Hodges R. E., CV. (1941) Studies of prostate cancer II. The effects of castration on advanced
carcinoma of the prostate gland. Archives of Surgery 2, 209-223
Humphrey P. (2004) Gleason grading and prognostic factors in carcinoma of the prostate. Modern Pathology 17,
292-306
Ibrahim T., Flamini E., Mercatali L., Sacanna E., Serra P., Amadori D. (2010) Pathogenesis of osteoblastic bone
metastases from prostate cancer. Cancer 116, 1406-1418
Isaacs J. T., and Coffey D. S. (1989) Etiology and disease process of benign prostatic hyperplasia. Prostate 2, 33-50
Iwata T., Schultz D., Hicks J., Hubbard G. K., Mutton L. N., Lotan T. L., Bethel C., Lotz M. T., Yeagnasubramanian S.,
Nelson W. G., Dang C. V., Xu M., Anele U., Koh C. M., Bieberich C. J., De Marzo A. M. (2010) MYC overexpression
induces prostatic intraepithelial neoplasia and loss of Nkx3.1 in mouse luminal epithelial cells. PLoS One 5, e9427 doi:10.1371/journal.pone.0009427
Jemal A., Bray F., Center M. M., Ferlay J., Ward E., Forman D. (2011) Global cancer statistics. CA - A Cancer Journal
for Clinicians. 61,69-90
Jemal A., Siegel R., Xu J., and Ward E. (2010) Cancer statistics, 2010. CA - A Cancer Journal for Clinicians 60, 277-
300
Jenkins R. B., Qian J., Lieber M. M., Bostwick D. G. (1997) Detection of c-myc oncogene amplification and
chromosomal anomalies in metastatic prostatic carcinoma by fluorescence in situ hybridization. Cancer Research
57, 524-531
Jin J. K., Dayyani F., Gallick G. E. (2011) Steps in prostate cancer progression that lead to bone metastasis.
International Journal of Cancer 128, 2545-2561
53
Joung J. Y., Cho K. S., Kim J. E., Seo H. K., Chung J., Park W. S., Choi M. K., Lee K. H. (2010) Prostate stem cell
antigen mRNA in peripheral blood as a potential predictor of biochemical recurrence in high-risk prostate cancer.
Journal of Surgical Oncology 101, 145-148
Kang G. H., Lee S., Lee H. J., Hwang K. S. (2004) Aberrant CpG island hypermethylation of multiple genes in
prostate cancer and prostatic intraepithelial neoplasia. Journal of Pathology 202, 233-240
King J. C., Xu J., Wongvipat J., Hieronymus H., Carver B. S., Leung D. H., Taylor B. S., Sander C., Cardiff R. D., Couto
S. S., Gerald W. L., Sawyers C. L. (2009) Cooperativity of TMPRSS2-ERG with PI3-kinase pathway activation in
prostate cancer oncogenesis. Nature Genetics 41, 524-526
Klezovich O., Risk M., Coleman I., Lucas J. M., Null M., True L. D., Nelson P. S., Vasioukhin V. (2008) A causal role
for ERG in neoplastic transformation of prostate epithelium. Proceedings of the National Academy of Sciences of the
United States of America 105, 2105-2110
Klotz L. (2010) Active surveillance for prostate cancer. Current Urology Reports 11, 165-171
Knudson A. G. (1971) Mutation and cancer: statistical study of retinoblastoma. Proceedings of The National
Academy of Sciences 68, 820-823
Koh C. M., Iwata T., Zheng Q., Bethel C., Yegnasubramanian S., De Marzo A. M. (2011) Myc enforces overexpression
of EZH2 in early prostatic neoplasia via transcriptional and post-transcriptional mechanisms. Oncotarget 2, 669-
683
Kristal A. R., Price D. K., Till C., Schenk J. M., Neuhouser M. L., Ockers S., Lin D. W., Thompson I. M., Figg W. D.
(2010) Androgen receptor CAG repeat length is not associated with the risk of incident symptomatic benign
prostatic hyperplasia: results from the prostate cancer prevention trial. Prostate 70, 584-590
Krohn A., Diedler T., Burkhardt L., Mayer P. S., De Silva C., Meyer-Kornblum M., Kötschau D., Tennstedt P., Huang J.,
Gerhäuser C., Mader M., Kurtz S., Sirma H., Saad F., Steuber T., Graefen M., Plass C., Sauter G., Simon R., Minner S.,
Schlomm T. (2012) Genomic deletion of PTEN is associated with tumor progression and early PSA recurrence in
ERG fusion-positive and fusion-negative prostate cancer. The American Journal of Pathology 181, 401-412
Kubista M., Andrade J. M., Bengtsson M., Forootan A., Jonak J., Lind K., Sindelka R., Sjöback R., Sjögreen B.,
Strömbom L., Ståhlberg A., Zoric N. (2006) The real-time polymerase chain reaction. Molecular aspects of medicine
27, 95-125
Kumar S., Shelley M., Harrison C., Coles B., Wilt T. J., Mason M. D. (2006) Neo-adjuvant and adjuvant hormone
therapy for localized and locally advanced prostate cancer. Cochrane Database Systemic Reviews 4, CD006019
doi:10.1002/14651858.CD006019.pub2
Kumma K., and Jackson S. (2001) DNA double strand breaks: signaling, repair and the cancer connection. Nature
Genetics 27, 247-254
Kwabi-Addo B., Giri D., Schmidt K., Podsypanina K., Parsons R., Greenberg N., Ittmann M. (2001) Haploinsufficiency
of the Pten tumor suppressor gene promotes prostate cancer progression. Proceedings of The National Academy of
Sciences 98, 11563-11568
Lapointe J., Kim Y. H., Miller M. A., Li C., Kaygusuz G., van de Rijn M., Huntsman D. G., Brooks J. D., Pollack J. R.
(2007) A variant TMPRSS2:ERG isoform and ERG fusion product in prostate cancer with implications for
molecular diagnosis. Modern Pathology 20, 467-473
Lilja H., Ulmert D., Vickers A. J. (2008) Prostate-specific antigen and prostate cancer: prediction, detection and
monitoring. Nature Reviews Cancer 8, 268-278
Lin B., Ferguson C., White J. T., Wang S., Vessella R., True L. D., Hood L., Nelson P. S. (1999) Prostate-localized and
Androgen-regulated Expression of the Membrane-bound Serine Protease TMPRSS2. Cancer Research 59, 4180-
4184
54
Linja M. J., and Visakorpi T. (2004) Alterations of androgen receptor in prostate cancer. The Journal of Steroid
Biochemistry and Molecular Biology 92, 255-264
Liu W., Chang B., Sauvageot J., Dimitrov L., Gielzak M., Li T., Yan G., Sun J., Sun J., Adams T. S., Turner A. R., Kim
J. W., Meyers D. A., Zheng S. L., Isaacs W. B., Xu J. (2006) Comprehensive assessment of DNA copy number
alterations in human prostate cancers using Affymetrix 100K SNP mapping array. Genes, chromosomes & cancer
45, 1018-1032
Liu W., Laitinen S., Khan S., Vihinen M., Kowalski J., Yu G., Chen L., Ewing C. M., Eisenberger M. A., Carducci M.
A., Nelson W. G., Yegnasubramanian S., Luo J., Wang Y., Xu J., Isaacs W. B., Visakorpi T., Bova G. S. (2009) Copy
number analysis indicates monoclonal origin of lethal metastatic prostate cancer. Nature Medicine 15, 559-565
Luedeke M., Linnert C. M., Hofer M. D., Surowy H. M., Rinckleb A. E., Hoegel J., Kuefer R., Rubin M. A., Vogel W.,
Maier C. (2009) Predisposition for TMPRSS2-ERG fusion in prostate cancer by variants in DNA repair genes.
Cancer Epidemiology, Biomarkers & Prevention 18, 3030-3035
Mani R. S., Tomlins S. A., Callahan K., Ghosh A., Nyati M. K., Varambally S., Palanisamy N., Chinnaiyan A. M. (2009)
Induced chromosomal proximity and gene fusions in prostate cancer. Science 326, 1230 doi:
10.1126/science.1178124
Mao X., Shaw G., James S. Y., Purkis P., Kudahetti S. C., Tsigani T.,Kia S., Young B. D., Oliver R. T. D., Berney D.,
Prowse D. M., Lu Y. J. (2008) Detection of TMPRSS2:ERG fusion gene in circulating prostate cancer cells. Asian
Journal of Andrology 10, 467-473
Markowitz S. D., Bertagnolli M. M. (2009) Molecular basis of colorectal cancer. New England Journal of Medicine
361, 2449-2460
Maruyama R., Toyooka S., Toyooka K. O., Virmani A. K., Zöchbauer-Muller S., Farinas A. J., Minna J. D., McConnel
J., Frenkel E. P., Gazdar A. F. (2002) Aberrant promoter methylation profile of prostate cancers and its relationship
to clinicopathological features. Clinical Cancer Research 8, 514-519
Massie C. E., Adryan B., Barbosa-Morais N. L., Lynch A. G., Tran M. G., Neal D. E. Mills I. G. (2007) New androgen
receptor genomic targets show an interaction with the ETS1 transcription factor. EMBO reports 8, 871-878
McLaughlin F., Ludbrook V. J., Kola I., Campbell C. J., Randi A. M. (1999) Characterisation of the tumour necrosis
factor (TNF)-a response elements in the human ICAM-2 promoter. Journal of Cell Science 112, 4695-4703
Meiers I., Shanks J. H., Bostwick D. G. (2007) Glutathione S-transferase pi (GSTP1) hypermethylation in prostate
cancer. Pathology 39, 299-304
Mitsiades C. S., Lembessis P., Sourla A., Milathianakis C., Tsintavis A., Koutsilieris M. (2004) Molecular staging by
RT-PCR analysis for PSA and PSMA in peripheral blood and bone marrow samples is an independent predictor
of time to biochemical failure following radical prostatectomy. Clinical and experimental metastasis 21, 495-505
Moreno J. G., Croce C. M., Fischer R., Monne M., Vihko P., Mulholland G., Gomella L. G. (1992) Detection of
hematogenous micrometastasis in patients with prostate cancer. Cancer Research 52, 6110-6112
Morris S. M. (2002) A role for p53 in the frequency and mechanism of mutation. Mutation Research 511, 45-62
Mosquera J. M., Perner S., Genega E. M., Sanda M., Hofer M. D., Mertz K. D., Paris P. L., Simko J., Bismar T. A.,
Ayala G., Shah R. B., Loda M., Rubin M. A. (2008) Characterization of TMPRSS2-ERG fusion high-grade prostatic
intraepithelial neoplasia and potential clinical implications. Clinical Cancer Research 14, 3380-3385
Mottet N., Bellmunt J., Bolla M., Joniau S., Mason M., Matveev V., Scmid H. P., Van der Kwast T., Wiegel T., Zattoni
F., Heidenreich A. (2011) EAU Guidelines on prostate cancer. Part II. Treatment of Advanced, Relapsing, and
Castration-Resistant prostate cancer. European Urology 35, 565-579
Mulholland D. J., Tran L. M., Li Y., Cai H., Morim A., Wang S., Plaisier S., Garraway I. P., Huang J., Graeber T. G.,
Wu H. (2011) Cell Autonomous Role of PTEN in Regulating Castration-Resistant prostate cancer Growth. Cancer
Cell 19, 792-804

55
Nauseef W. M. (2007) Isolation of human neutrophils from venous blood. Methods in Molecular Biology: Neutrophil
Methods and Protocols 412, 15-20 doi: 10.1007/978-1-59745-467-4
Navone N. M., Troncoso P., Pisters L. L., Goodrow T. L., Palmer J. L., Nichols W. W., von Eschenbach A. C., Conti C.
J. (1993) p53 protein accumulation and gene mutation in the progression of human prostate carcinoma. Journal of
National Cancer Institute 85, 1657-1669
Nupponen N.N., Kakkola L., Koivisto P., Visakorpi T. (1998a) Genetic alterations in hormone-refractory recurrent
prostate carcinomas. American Journal of Pathology 153, 141-148
Olson W. C., Heston W. D. W ., Rajasekaran A. (2007) Clinical trials of cancer therapies targeting prostate-specific
membrane antigen. Reviews on Recent Clinical Trials 2, 182-190
Ornstein D. K., Cinquanta M., Weiler S., Duray P. H., Emmert-Buck M. R., Vocke C. D., Linehan W. M., Ferretti J. A.
(2001) Expression studies and mutational analysis of the androgen regulated homebox gene NKX3.1 in benign
and malignant prostate epithelium. Journal of Urology 165, 1329-1334
Paoloni-Giacobino A., Chen H., Peitsch M. C., Rossier C., Antonarakis S. E. (1997) Cloning of the TMPRSS2 gene,
which encodes a novel serine protease with transmembrane, LDLRA, and SRCR domains and maps to 21q22.3.
Genomics 44, 309-320
Perner S., Mosquera J. M., Demichelis F., Hofer M. D., Paris P. L., Simko J., Collins C., Bismar T. A., Chinnaiyan A.
M., De Marzo A. M., Rubin M. A. (2007) TMPRSS2-ERG fusion prostate cancer: an early molecular event
associated with invasion. The American Journal of Surgical Pathology 31, 882-888
Prives C. (1998) Signaling to p53: breaking the MDM-p53 circuit. Cell 95, 5-8
Raff A. B., Gray A., Kast W. M. (2009) Prostate stem cell antigen: a prospective therapeutic and diagnostic target.
Cancer letters. 277, 126-132
Rajput A. B., Miller M. A., De Luca A., Boyd N., Leung S., Hurtado-Coll A., Fazli L., Jones E. C., Palmer J. B., Gleave
M. E., Cox M. E., Huntsman D. G. (2007) Frequency of the TMPRSS2:ERG gene fusion is increased in moderate to
poorly differentiated prostate cancers. Journal of Clinical Pathology 60, 1238-1243
Rivera R. R., Stuiver M. H., Steenbergen R., Murre C. (1993) Ets proteins: new factors that regulate immunoglobulin
heavy-chain gene expression. Molecular and Cellular Biology 13, 7163-7169
Sahu B., Laakso M., Ovaska K., Mirtti T., Lundin J., Rannikko A., Sankila A., Turunen J-P., Lundin M., Konsti J.,
Vesterinen T., Nordling S., Kallioniemi O., Hautaniemi S., Jänne O. A. (2011) Dual role of FoxA1 in androgen
receptor binding to chromatin, androgen signaling and prostate cancer. The EMBO Journal 30, 3962-3976
Saramäki O. R., Harjula A. E., Martikainen P. M., Vessella R. L., Tammela T. L., Visakorpi T. (2008) TMPRSS2:ERG
fusion identifies a subgroup of prostate cancers with favorable prognosis. Clinical Cancer Research 14, 3395-3400
Saramäki O., Willi N., Bratt O., Gasser T. C., Koivisto P., Nupponen N. N., Bubendorf L., Visakorpi T. (2001)
Amplification of EIF3S3 gene is associated with advanced stage in prostate cancer. American Journal of Pathology
159, 2089-2094
Seth A., Watson D. K. (2005) Ets transcription factors and their emerging roles in human cancer. European Journal
of Cancer 41, 2462-2478
Shah R. B., Chinnaiyan A. M. (2009) The discovery of common recurrent transmembrane protease serine 2
(TMPRSS2)-erythroblastosis virus E26 transforming sequence (ETS) gene fusions in prostate cancer. Advances in
Anatomic Pathology 16, 145-163
Sherr C. J. (2004) Principles of Tumor Suppression. Cell 116, 235-246
Siegel R., Naishadham D., Jemal A. (2012) Cancer statistics, 2012. CA - A Cancer Journal for Clinicians 62, 10-29
Squire J. A. (2009) TMPRSS2:ERG and PTEN loss in prostate cancer. Nature Genetics 41, 509-510
56
Sreenath T. L., Dobi A., Petrovics G., Srivastava S. (2011) Oncogenic activation of ERG: A predominant mechanism
in prostate cancer. Journal of Carcinogenesis 10 doi: 10.4103/1477-3163.91122
Stamey T. A., Caldwell M., McNeal J. E., Nolley R., Hemenez M., Downs J. (2004) The prostate specific antigen era
in the United States is over for prostate cancer: what happened in the last 20 years? Journal of Urology 172, 1297-
1301
Sulis M. L. and Parsons R. (2003) PTEN: from pathology to biology. Trends in Cell Biology 13, 478-483
Sun S., Sprenger C. C., Vessella R. L., Haugk K., Soriano K., Mostaghel E. A., Page S. T., Coleman I. M., Nguyen H.
M., Sun H., Nelson P. S., Plymate S. R. (2010) Castration resistance in human prostate cancer is conferred by a
frequently occurring androgen receptor splice variant. Journal of Clinical Investigation 120, 2715-2730
Taki T., Taniwaki M. (2006) Chromosomal translocations in cancer and their relevance for therapy. Current
Opinion in Oncology 18, 62-68
Taplin M. E. (2007) Drug insight: role of the androgen receptor in the development and progression of prostate
cancer. Nature Clinical Practice Oncology 4, 236-244
Taylor B. S., Schultz N., Hieronymus H., Gopalan A., Xiao Y., Carver B. S., Arora V. K., Kaushik P., Cerami E., Reva
B., Antipin Y., Mitsiades N., Landers T., Dolgalev I., Major J. E., Wilson M., Socci N. D., Lash A. E., Heguy A.,
Eastham J. A., Scher H. I., Reuter V. E., Scardino P. T., Sander C., Sawyers C. L., Gerald W. L. (2010) Integrative
genomic profiling of human prostate cancer. Cancer Cell 18, 11-22
Thomas J., Gupta M., Grasso Y., Reddy C. A., Heston W. D., Zippe C., Dreicer R., Kupelian P. A., Brainard J., Levin H.
S., Klein E. A. (2002) Preoperative combined nested reverse transcriptase polymerase chain reaction for prostate-
specific antigen and prostate-specific membrane antigen does not correlate with pathologic stage or biochemical
failure in patients with localized prostate cancer undergoing radical prostatectomy. Journal of Clinical Oncology
20, 3213-3218
Thompson I. M., Pauler D. K., Goodman P. J., Tangen C. M., Lucia M. S., Parnes H. L., Minasian L. M., Ford L. G.,
Lippman S. M., Crawford E. D., Crowley J. J., Coltman C. A. Jr. (2004) Prevalence of prostate cancer among men
with a prostate-specific antigen level ≤ 4.0 ng per milliliter. New England Journal of Medicine 350, 2239-2246
Tomlins S. A., Laxman B., Varambally S., Cao X., Xu J., Helgeson B. E., Cao Q., Prensner J. R., Rubin M. A., Shah R.
B., Mehra R., Chinnaiyan A. M. (2008) Role of the TMPRSS2:ERG gene fusion in prostate cancer. Neoplasia 10,
177-188
Tomlins S. A., Rhodes DR., Perner S., Dhanasekaran S. M., Mehra R., Sun XW., Varambally S., Cao X., Tchinda J.,
Kuefer R., Lee C., Montie J. E., Shah R. B., Pienta K. J., Rubin M. A., Chinnaiyan A. M. (2005) Recurrent fusion of
TMPRSS2 and ETS transcription factor genes in prostate cancer. Science 310, 644-648
Toyoshima M., Howie H. L., Imakura M., Walsh R. M., Annis J. E., Chang A. N., Frazier J., Chau B. N., Loboda A.,
Linsley P. S., Cleary M. A., Park J. R., Grandori C. (2012) Functional genomics identifies therapeutic targets for
MYC-driven cancer. Proceedings of the National Academy of Sciences of the United States of America 109, 9545-9550
Trotman L. C, Niki M., Dotan Z. A., Koutcher J. A., Di Cristofano A., Xiao A., Khoo A. S., Roy-Burman P., Greenberg
N. M., Van Dyke T., Cordon-Cardo C., Pandolfi P. P. (2003) Pten dose dictates cancer progression in the prostate.
PLoS Biology 1, 385-396
Tu J. J., Rohan S., Kao J., Kitabayashi N., Mathew S., Chen J. T. (2007) Gene fusions between TMPRSS2 and ETS
family genes in prostate cancer: frequency and transcript variant analysis by RT-PCR and FISH on paraffin-
embedded tissues. Modern Pathology 20, 921-928
Uzoh C. C., Perks C. M., Bahl A., Holly J. M., Sugiono M., Persad R. A. (2009) PTEN-mediated pathways and their
association with treatment resistant prostate cancer. BJU International 104, 556-561
Vaarala M. H., Porvari K. S., Kellokumpu S., Kyllönen A. P., Vihko P. T. (2001) Expression of transmembrane serine
protease TMPRSS2 in mouse and human tissues. Journal of Pathology 193, 134-140
57
Varambally S., Dhanasekaran S. M., Zhou M., Barrete T. R., Kumar-Sinha C., Sanda M. G., Ghosh D., Pienta K. J.,
Sewalt R. G., Otte A. P., Rubin M. A., Chinnaiyan A. M. (2002) The polycomb group protein EZH2 is involved in
progression of prostate cancer. Nature 419, 624-629
Visakorpi T., Hyytinen E., Koivisto P., Tanner M., Keinänen R., Palmberg C., Palotie A., Tammela T., Isola J.,
Kallioniemi O. P. (1995a) In vivo amplification of the androgen receptor gene and progression of human prostate
cancer. Nature Genetics 9, 401-406
Visakorpi T., Kallioniemi A. H., Syvänen A. C., Hyytinen E. R., Karhu R., Tammela T., Isola J. J., Kallioniemi O. P.
(1995b) Genetic changes in primary and recurrent prostate cancer by comparative genomic hybridization. Cancer
Research 55, 342-347
Visakorpi T., Kallioniemi O. P., Heikkinen A., Koivula T., Isola J. (1992) Small subgroup of aggressive, highly
proliferative prostatic carcinomas defined by p53 accumulation. Journal of National Cancer Institute 84, 883-887
Voeller H. J., Augustus M., Madike V., Bova G. S., Carter K. C., Gelmann E. P. (1997) Coding region of NKX3.1, a
prostate specific homebox gene on 8p21, is not mutated in human prostate cancers. Cancer Research 57, 4455-4459
Wang J., Cai Y., Ren C., Ittmann M. (2006) Expression of variant TMPRSS2:ERG fusion messenger RNA is
associated with aggressive prostate cancer. Cancer Research 66, 8347-8351
Wang J., Cai Y., Shao L. J., Siddiqui J., Palanisamy N., Li R., Ren C., Ayala G., Ittmann M. (2011) Activation of NF-
{kappa}B by TMPRSS2/ERG Fusion Isoforms through Toll-Like Receptor-4. Cancer Research 71, 1325-1333
Witte J. S. (2009) Prostate cancer genomics: towards a new understanding. Nature Review Genetics 10, 77-82
Ylikoski A., Sjöroos M., Lundwall A., Karp M., Lövgren T., Lilja H., Iitiä A. (1999) Quantitative reverse
transcription-PCR assay with an internal standard for the detection of prostate-specific antigen mRNA. Clinical
Chemistry 45, 1397-1407
Yoshida K., Miki Y. (2004) Role of BRCA1 and BRCA2 as regulators of DNA repair, transcription, and cell cycle
in response to DNA damage. Cancer Science 95, 866-871
Yu J., Yu J., Mani R.S., Cao Q., Brenner C.J., Cao X., Wang X., Wu L., Li J., Hu M., Gong Y., Cheng H., Laxman B.,
Vellaichamy A., Shankar S., Li Y., Dhanasekaran S. M., Morey R., Barrette T., Lonigro R. J., Tomlins S. A., Varambally
S., Qin Z. S., Chinnaiyan A. M. (2010) An integrated network of androgen receptor, polycomb and TMPRSS2-ERG
gene fusions in prostate cancer progression. Cancer Cell 17, 443-454
Yu J., Yu J., Rhodes D.R., Tomlins S. A. Cao X., Chen G., Mehra R., Wang X., Ghosh D., Shah R.B., Varambally S.,
Pienta K. J., Chinnaiyan A. M. (2007) A polycomb repression signature in metastatic prostate cancer predicts
cancer outcome. Cancer Research 67, 10657-10663
Zamai L., Ponti C., Mirandola P., Gobbi G., Papa S., Galeotti L., Cocco L., Vitale M. (2007) NK cells and cancer. The
Journal of Immunology 178, 4011-4016
Zeegers M. P., Jellema A., Ostrer H. (2003) Empiric risk of prostate carcinoma for relatives of patients with
prostate carcinoma: a meta-analysis. Cancer 97, 1894-1903
Zhang S., and Yu D. (2010) PI(3)King apart PTEN´s role in cancer. Clinical Cancer Research 16, 4325-4330
Zieglschmid V., Hollmann C., Bocher O. (2005) Detection of disseminated tumor cells in peripheral blood. Critical
Reviews in Clinical Laboratory Sciences 42, 155-196
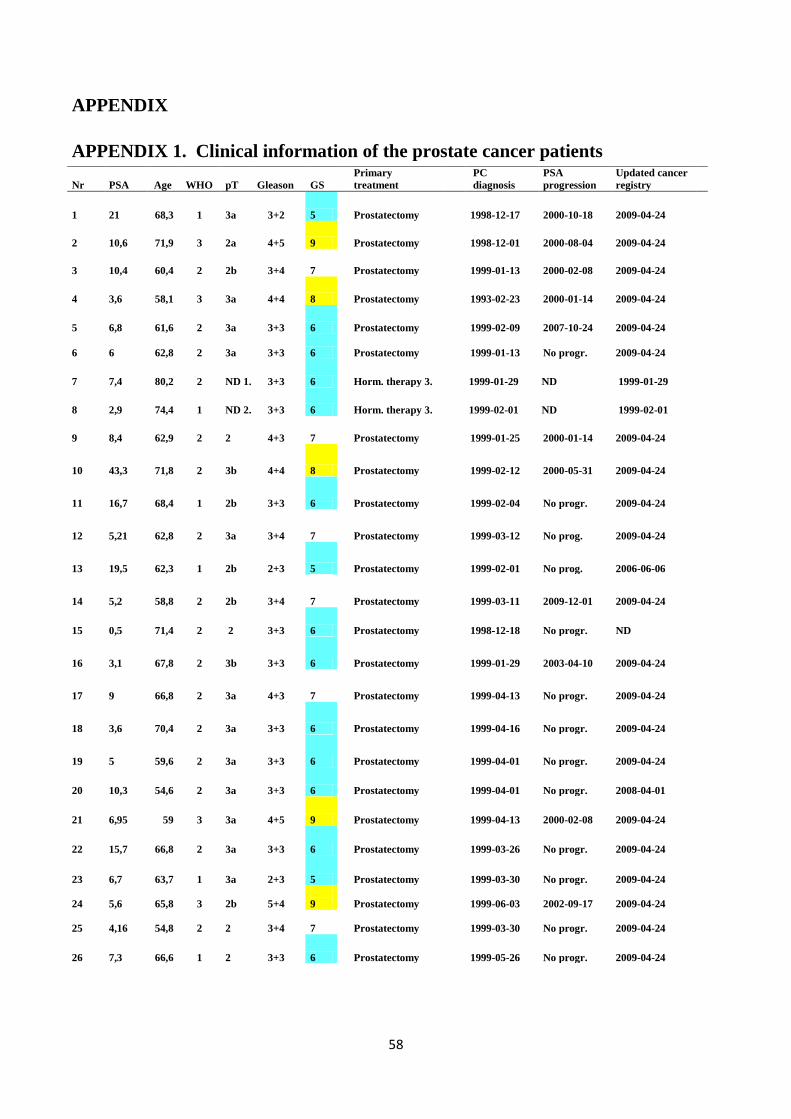
58
APPENDIX
APPENDIX 1. Clinical information of the prostate cancer patients
Nr PSA Age WHO pT Gleason GS
Primary
treatment
PC
diagnosis
PSA
progression
Updated cancer
registry
1 21 68,3 1 3a 3+2 5 Prostatectomy 1998-12-17 2000-10-18 2009-04-24
2 10,6 71,9 3 2a 4+5 9 Prostatectomy 1998-12-01 2000-08-04 2009-04-24
3 10,4 60,4 2 2b 3+4 7 Prostatectomy 1999-01-13 2000-02-08 2009-04-24
4 3,6 58,1 3 3a 4+4 8 Prostatectomy 1993-02-23 2000-01-14 2009-04-24
5 6,8 61,6 2 3a 3+3 6 Prostatectomy 1999-02-09 2007-10-24 2009-04-24
6 6 62,8 2 3a 3+3 6 Prostatectomy 1999-01-13 No progr. 2009-04-24
7 7,4 80,2 2 ND 1. 3+3 6 Horm. therapy 3. 1999-01-29 ND 1999-01-29
8 2,9 74,4 1 ND 2. 3+3 6 Horm. therapy 3. 1999-02-01 ND 1999-02-01
9 8,4 62,9 2 2 4+3 7 Prostatectomy 1999-01-25 2000-01-14 2009-04-24
10 43,3 71,8 2 3b 4+4 8 Prostatectomy
1999-02-12 2000-05-31 2009-04-24
11 16,7 68,4 1 2b 3+3 6 Prostatectomy
1999-02-04 No progr. 2009-04-24
12 5,21 62,8 2 3a 3+4 7 Prostatectomy
1999-03-12 No prog. 2009-04-24
13 19,5 62,3 1 2b 2+3 5 Prostatectomy
1999-02-01 No prog. 2006-06-06
14 5,2 58,8 2 2b 3+4 7 Prostatectomy
1999-03-11 2009-12-01 2009-04-24
15 0,5 71,4 2 2 3+3 6 Prostatectomy
1998-12-18 No progr. ND
16 3,1 67,8 2 3b 3+3 6 Prostatectomy
1999-01-29 2003-04-10 2009-04-24
17 9 66,8 2 3a 4+3 7 Prostatectomy
1999-04-13 No progr. 2009-04-24
18 3,6 70,4 2 3a 3+3 6 Prostatectomy
1999-04-16 No progr. 2009-04-24
19 5 59,6 2 3a 3+3 6 Prostatectomy
1999-04-01 No progr. 2009-04-24
20 10,3 54,6 2 3a 3+3 6 Prostatectomy 1999-04-01 No progr. 2008-04-01
21 6,95 59 3 3a 4+5 9 Prostatectomy 1999-04-13 2000-02-08 2009-04-24
22 15,7 66,8 2 3a 3+3 6 Prostatectomy 1999-03-26 No progr. 2009-04-24
23 6,7 63,7 1 3a 2+3 5 Prostatectomy 1999-03-30 No progr. 2009-04-24
24 5,6
65,8 3 2b 5+4
9 Prostatectomy 1999-06-03 2002-09-17 2009-04-24
25
4,16
54,8
2
2
3+4
7
Prostatectomy
1999-03-30 No progr.
2009-04-24
26 7,3 66,6 1 2 3+3 6 Prostatectomy 1999-05-26 No progr. 2009-04-24
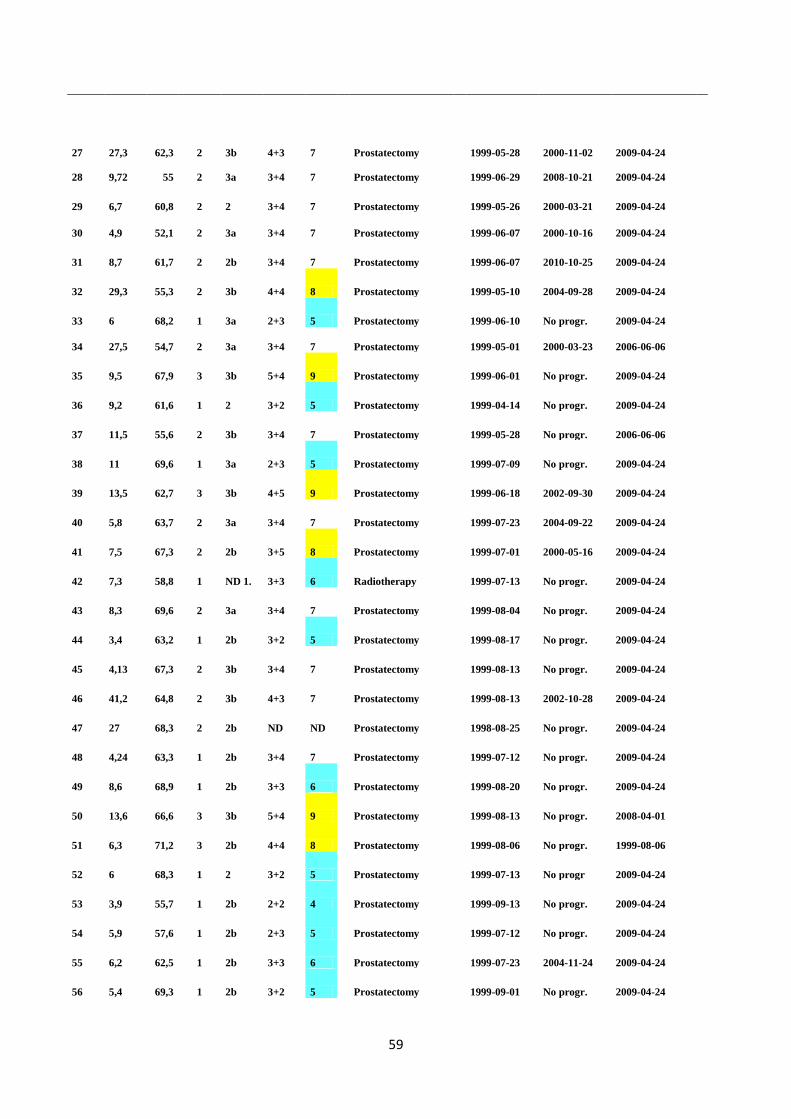
59
27 27,3 62,3 2 3b 4+3 7 Prostatectomy 1999-05-28 2000-11-02 2009-04-24
28 9,72 55 2 3a 3+4 7 Prostatectomy 1999-06-29 2008-10-21 2009-04-24
29 6,7 60,8 2 2 3+4 7 Prostatectomy 1999-05-26 2000-03-21 2009-04-24
30 4,9 52,1 2 3a 3+4 7 Prostatectomy 1999-06-07 2000-10-16 2009-04-24
31 8,7 61,7 2 2b 3+4 7 Prostatectomy 1999-06-07 2010-10-25 2009-04-24
32 29,3 55,3 2 3b 4+4 8 Prostatectomy 1999-05-10 2004-09-28 2009-04-24
33 6 68,2 1 3a 2+3 5 Prostatectomy 1999-06-10 No progr. 2009-04-24
34 27,5 54,7 2 3a 3+4 7 Prostatectomy 1999-05-01 2000-03-23 2006-06-06
35 9,5 67,9 3 3b 5+4 9 Prostatectomy 1999-06-01 No progr. 2009-04-24
36 9,2 61,6 1 2 3+2 5 Prostatectomy 1999-04-14 No progr. 2009-04-24
37 11,5 55,6 2 3b 3+4 7 Prostatectomy 1999-05-28 No progr. 2006-06-06
38 11 69,6 1 3a 2+3 5 Prostatectomy 1999-07-09 No progr. 2009-04-24
39 13,5 62,7 3 3b 4+5 9 Prostatectomy 1999-06-18 2002-09-30 2009-04-24
40 5,8 63,7 2 3a 3+4 7 Prostatectomy 1999-07-23 2004-09-22 2009-04-24
41 7,5 67,3 2 2b 3+5 8 Prostatectomy 1999-07-01 2000-05-16 2009-04-24
42 7,3 58,8 1 ND 1. 3+3 6 Radiotherapy 1999-07-13 No progr. 2009-04-24
43 8,3 69,6 2 3a 3+4 7 Prostatectomy 1999-08-04 No progr. 2009-04-24
44 3,4 63,2 1 2b 3+2 5 Prostatectomy 1999-08-17 No progr. 2009-04-24
45 4,13 67,3 2 3b 3+4 7 Prostatectomy 1999-08-13 No progr. 2009-04-24
46 41,2 64,8 2 3b 4+3 7 Prostatectomy 1999-08-13 2002-10-28 2009-04-24
47 27 68,3 2 2b ND ND Prostatectomy 1998-08-25 No progr. 2009-04-24
48 4,24 63,3 1 2b 3+4 7 Prostatectomy 1999-07-12 No progr. 2009-04-24
49 8,6 68,9 1 2b 3+3 6 Prostatectomy 1999-08-20 No progr. 2009-04-24
50 13,6 66,6 3 3b 5+4 9 Prostatectomy 1999-08-13 No progr. 2008-04-01
51 6,3 71,2 3 2b 4+4 8 Prostatectomy 1999-08-06 No progr. 1999-08-06
52 6 68,3 1 2 3+2 5 Prostatectomy 1999-07-13 No progr 2009-04-24
53 3,9 55,7 1 2b 2+2 4 Prostatectomy 1999-09-13 No progr. 2009-04-24
54 5,9 57,6 1 2b 2+3 5 Prostatectomy 1999-07-12 No progr. 2009-04-24
55 6,2 62,5 1 2b 3+3 6 Prostatectomy 1999-07-23 2004-11-24 2009-04-24
56 5,4 69,3 1 2b 3+2 5 Prostatectomy 1999-09-01 No progr. 2009-04-24
60
57 9,1 66,9 1 3a 3+2 5 Prostatectomy 1999-09-09 2007-10-10 2009-04-24
58 18,1 82,5 3 ND 1. 4+5 9 Horm. therapy 3. 1999-10-05 ND 2006-06-06
59 10,2 76,9 2 ND 1. 3+3 6 Horm. therapy 3. 1999-09-23 ND 2009-04-24
60 3 66,8 1 2b 2+3 5 Prostatectomy 1999-06-11 No progr. 2009-04-24
61 9,05 67,8 3 3a 5+4 9 Prostatectomy 1999-10-07 No progr. 2009-04-24
62 8,2 65,5 3 3b 4+4 8 Prostatectomy 1999-10-14 No progr. 2009-04-24
63 11 58,6 1 3a 3+2 5 Prostatectomy 1999-09-10 2008-11-13 2009-04-24
64 7,3 59,8 2 2b 3+3 6 Prostatectomy 1999-10-14 No progr. 2009-04-24
65 31,8 67,1 2 ND 1. 4+3 7 Horm. therapy 4. 1999-11-16 No progr. 1999-11-16
66 17 68 2 3b 4+3 7 Prostatectomy 1998-10-05 1999-07-19 1998-10-05
67 5,5 56,1 2 2b 3+3 6 Prostatectomy 1999-11-01 No progr. 2009-04-24
68 5,6 61,1 2 2b 3+3 6 Prostatectomy 1999-11-01 No progr. 2006-06-06
69 3 56,8 2 2b 3+2 5 Prostatectomy 1999-11-05 No progr. 2009-04-24
70 7,6 60,5 2 2b 3+3 6 Prostatectomy 1999-11-10 No progr. 2009-04-24
71 76 76,8 2 ND 1. 3+4 7 Horm. therapy 3. 2000-01-01 No progr. 2000-01-01
72 2480 74,7 2 ND 1. 3+5 8 Horm. therapy 3. 2000-01-04 No progr. 2006-06-06
73 21 67,1 3 3b 4+5 9 Prostatectomy 1999-12-13 2003-09-16 2009-04-24
74 8,9 60,8 2 2b 3+4 7 Prostatectomy 1999-11-01 No progr. 2009-04-24
75 9,6 67,4 2 2b 2+4 6 Prostatectomy 1999-12-13 No progr. 2009-04-24
76 5,7 59,8 2 2b 3+4 7 Prostatectomy 1999-12-17 2003-08-18 2009-04-24
77 4,4 63,3 2 2b 3+4 7 Prostatectomy 1999-12-29 No progr. ND
78 4,2 60,9 2 2b 3+4 7 Prostatectomy 1999-12-29 2006-11-20 2009-04-24
79 5 63,3 3 3a 4+5 9 Prostatectomy 1999-12-30 2003-11-03 2009-04-24
80 4,57 62,8 2 2b 2+4 6 Prostatectomy 1999-06-09 No progr. 2009-04-24
81 6,7 61,8 1 2b 2+3 5 Prostatectomy 2000-01-31 No progr. 2009-04-24
82 13 64,9 2 2b 4+4 8 Prostatectomy 2000-01-12 No progr. 2009-04-24
83 10,9 59,3 2 ND 1. 4+3 7 Horm. therapy 4. 2000-02-01 ND 2000-02-01
84 12,9 65,8 2 3b 4+3 7 Prostatectomy 2000-02-15 2003-11-27 2000-02-15
85 9,5 59,8 2 3a 4+3 7 Prostatectomy 2000-02-11 2005-09-08 2009-04-24
86 6,2 58,2 2 ND 1. 3+3 6 Radiotherapy 5. 2000-01-13 ND 2006-06-06
87 9,7 58,7 2 2a 3+3 6 Prostatectomy 2000-01-28 No progr. 2009-04-24
61
88 4,1 71 2 3a 4+3 7 Prostatectomy 2000-03-21 2001-08-31 2009-04-24
89 7,9 65,9 1 2 3+2 5 Prostatectomy 2000-02-17 No progr. 2009-04-24
90 5,9 65,5 2 2b 3+4 7 Prostatectomy 1999-07-13 No progr. 2006-06-06
91 13,1 60,3 2 2b 3+4 7 Prostatectomy 2000-04-10 No progr. 2009-04-24
92 16,2 64,8 2 3a 3+4 7 Prostatectomy 2000-03-09 2007-08-01 2009-04-24
93 14,8 62,4 2 3a 3+4 7 Prostatectomy 2000-04-05 2001-07-13 2009-04-24
94 5,6 53,6 2 2 3+3 6 Prostatectomy 2000-04-04 2009-10-22 2009-04-24
95 412 69,3 2 ND 1. 4+3 7 Horm. therapy 4. 2000-06-30 ND 2009-04-24
96 12,4 58,6 2 3a 3+4 7 Prostatectomy 2000-05-15 No progr. 2009-04-24
97 8 67,3 3 3a 4+5 9 Prostatectomy 2000-05-18 2006-10-19 2009-04-24
98 8,2 67,3 2 2b 3+4 7 Prostatectomy 2000-05-16 2011-11-16 2009-04-24
99 16,7 55,2 2 2b 3+4 7 Prostatectomy 2000-04-27 2007-10-29 ND
100 7 56,8 3 3b 4+3 7 Prostatectomy 2000-05-15 2001-10-02 2009-04-24
101 3,1 68,8 2 2b 3+3 6 Prostatectomy 2000-07-20 2009-10-26 ND
102 2,8 63,2 2 2b 3+5 8 Prostatectomy 2000-06-21 2011-09-14 2009-04-24
103 6,6 66,8 2 2b 3+2 5 Prostatectomy 2000-06-20 No progr. 2009-04-24
104 1,1 47,8 1 2b 2+3 5 Prostatectomy 2000-06-08 No progr. ND
105 3,3 58,6 1 2b 2+3 5 Prostatectomy 2000-03-24 2006-09-12 ND
106 3,9 60,1 2 2b 3+4 7 Prostatectomy 2000-05-29 No progr. ND
107 12 67,1 1 2 2+2 4 Prostatectomy 2000-06-19 No progr. ND
108 8,2 67,9 2 3a 3+2 5 Prostatectomy 2000-07-11 2002-12-09 ND
109 48,1 58,1 2 3a 3+4 7 Prostatectomy 2000-07-17 2003-11-21 2009-04-24
110 7,54 66,7 2 3a 3+3 6 Prostatectomy 2000-08-08 2009-04-28 2009-04-24
111 7 67,8 2 ND 1. 3+3 6 Radiotherapy 2000-08-31 ND 2009-04-24
112 7 72,9 2 2 3+3 6 Prostatectomy 2000-09-05 No progr. 2009-04-24
113 19 68,1 2 3b 4+3 7 Prostatectomy 2000-08-04 2002-01-31 2009-04-24
114 4,1 59,6 2 2b 3+4 7 Prostatectomy 2000-08-22 No progr. 2009-04-24
115 8,2 62,8 2 3a 4+3 7 Prostatectomy 2000-08-21 No progr. 2009-04-24
116 10,1 60,2 2 2b 4+3 7 Prostatectomy 2000-08-25 2006-11-09 2009-04-24
117 13,2 59,1 1 2b 3+2 5 Prostatectomy 2000-07-11 No progr. 2009-04-24
118 5,7 59,6 2 2b 3+4 7 Prostatectomy 2000-08-23 No progr. 2009-04-24
62
119 4,1 67 3 3a 3+5 8 Prostatectomy 2000-08-24 2007-10-09 2009-04-24
120 4,3 63,6 1 2b 3+2 5 Prostatectomy 2000-08-22 No progr. 2009-04-24
121 5,5 59,3 1 2b 3+3 6 Prostatectomy 2000-05-16 No progr. ND
122 8,2 61,2 2 2b 3+4 7 Prostatectomy 2000-03-28 No progr. ND
123 5,2 60,9 1 2b 3+2 5 Prostatectomy 2000-11-15 No progr. 2009-04-24
124 4,4 67,7 1 2b 3+2 5 Prostatectomy 2000-10-02 2006-02-21 2009-04-24
125 8,2 53,6 2 2 3+3 6 Prostatectomy 2000-10-05 No progr. 2009-04-24
126 6,1 67,5 2 2b 3+2 5 Prostatectomy 2000-08-17 No progr. 2009-04-24
127 15,8 66,5 2 2b 4+4 8 Prostatectomy 1998-09-24 2000-09-26 2009-04-24
128 29,4 80 2 ND 1. 4+5 9 Horm. therapy 3. 2000-11-14 ND 2000-11-14
129 13,4 65,2 2 2b 3+4 7 Prostatectomy 2000-12-21 2002-05-21 2009-04-24
130 4,8 53 3 3a 5+5 10 Prostatectomy 2001-01-01 No progr. 2006-06-06
131 4,1 49,6 2 2a 3+3 6 Prostatectomy 2001-02-05 No progr. 2009-04-24
132 10,3 67,3 2 3a 2+4 6 Prostatectomy 2001-02-06 No progr. 2009-04-24
133 10,1 62,6 2 3b 4+4 8 Prostatectomy 2000-12-13 2002-07-26 2009-04-24
134 7,5 60 2 2b 4+3 7 Prostatectomy 2001-02-16 2004-04-28 2009-04-24
135 9,3 63,3 2 2b 4+3 7 Prostatectomy 2001-01-05 No progr. 2009-04-24
136 8,48 54,8 2 2b 3+3 6 Prostatectomy 2001-02-08 No progr. 2009-04-24
137 9,7 59,5 2 3b 3+4 7 Prostatectomy 2001-01-22 2004-12-07 2009-04-24
138 9,9 67 2 2b 3+4 7 Prostatectomy 2000-06-19 No progr. 2009-04-24
139 11,4 74,8 2 ND 1. 3+4 7 Horm. therapy 3. 2001-05-15 ND 2001-05-15
140 12,3 59,1 1 2b 3+2 5 Prostatectomy 6. 2000-11-02 No progr. 2000-11-02
141 7,4 54,7 2 3a 3+3 6 Prostatectomy 2001-03-13 No progr. 2009-04-24
142 7,6 62,3 2 3a 3+4 7 Prostatectomy 2001-02-21 No progr. 2009-04-24
143 15,3 61,8 2 2b 4+3 7 Prostatectomy 2001-03-14 2002-05-20 2009-04-24
144 42,5 77,5 2 ND 1. 4+4 8 Horm. therapy 4. 2001-06-26 ND 2001-06-26
145 9,3 61,9 2 3a 4+3 7 Prostatectomy 2001-04-05 2002-12-13 2009-04-24
146 3,8 64,9 2 2b 3+3 6 Prostatectomy 2001-07-01 No progr. 2009-04-24
147 6,5 66,6 2 2b 3+4 7 Prostatectomy 2001-02-09 No progr. 2009-04-24
148 17 61,7 2 3a 4+4 8 Prostatectomy 2001-03-22 No progr. 2009-04-24
149 6,2 64 2 2b 3+4 7 Prostatectomy 2001-03-07 No progr. 2009-04-24
63
1. Pathological tumor stage (pT) not determined due to biopsy atypia; 2. Pathological tumor stage (pT) not determined
due to transurethral resection of the prostate gland (TURP); 3. Surgical castration; 4. Chemical castration; 5. Total
Androgen Blockade (TAB); 6. Antiandrogen treatment; ND, not determined; PSA, prostate specific antigen; WHO,
tumor stage according to World Health Organization; pT, pathological tumor stage; GS, Gleason score; PC diagnosis,
prostate cancer diagnosis; PSA progression., prostate specific antigen progression (increase in PSA levels > 0.5 ng/ml
after primary treatment); No progr., No prostate specific antigen progression after primary treatment.
150 3,7 61,9 2 2b 3+4 7 Prostatectomy 2001-04-01 No progr. 2009-04-24
151 17,4 67,6 2 3b 3+4 7 Prostatectomy 2001-03-28 2004-08-09 2009-04-24
152 6 69,7 2 2 4+3 7 Prostatectomy 2001-04-30 2004-09-28 2009-04-24
153 12 67,1 2 2 3+3 6 Prostatectomy 2000-03-24 2004-12-02 2009-04-24
154 4,48 62,3 2 3a 3+3 6 Prostatectomy 2001-03-13 No progr. 2009-04-24
155 95,3 71,7 3 ND 1. 5+5 10 Horm. therapy 4. 2001-07-10 ND 2001-07-10
156 7,5 71,8 2 3b 3+5 8 Prostatectomy 2001-05-04 2002-04-05 2009-04-24
157 4,2 67,2 2 2b 2+3 5 Prostatectomy 2001-05-08 No progr. 2009-04-24
158 5,3 58,7 2 2b 3+3 6 Prostatectomy 2001-05-03 2009-06-23 2009-04-24
159 8,6 62,7 2 2b 3+4 7 Prostatectomy 2001-05-02 No progr. 2006-06-06
160 8,4 62,6 2 2a 3+4 7 Prostatectomy 2001-05-03 No progr. 2009-04-24
161 13,3 68,8 2 2b 4+3 7 Prostatectomy 2000-11-29 No progr. 2009-04-24
162 2,4 61,9 2 2b 3+4 7 Prostatectomy 2001-05-15 No progr. 2009-04-24
163 7,8 59,4 2 3a 4+3 7 Prostatectomy 2001-06-04 2006-11-22 2009-04-24


![ELF5 isoform expression is tissue-specific and ... · ELF5, in contrast to other ETS factors, such as TMPRSS2-ERG/ETV1 fusions in prostate cancer [23]. The breast is the most well-studied](https://img.pdfslide.us/doc/110x75/5f05e7227e708231d4154b58/elf5-isoform-expression-is-tissue-specific-and-elf5-in-contrast-to-other-ets.jpg)