Embed Size (px)
Citation preview
The destiny of the resistance/susceptibility against GCRV is
controlled by epigenetic mechanisms in CIK cells
Xueying Shang1, Chunrong Yang2, Quanyuan Wan3,4, Youliang Rao3,4 & Jianguo
Su1,3,4*
1College of Animal Science and Technology, Northwest A&F University, Yangling 712100, China
2College of Veterinary Medicine, Huazhong Agricultural University, Wuhan 430070, China
3College of Fisheries, Huazhong Agricultural University, Wuhan 430070, China
4Hubei Provincial Engineering Laboratory for Pond Aquaculture, Wuhan 430070, China
*Corresponding author, Tel/Fax: 86-27-87282227; E-mail address:
Keywords: Grass carp (Ctenopharyngodon idella); Integrated omics; RNA-Seq;
DNA methylation; microRNA; Grass carp reovirus
Supplementary information
CIK Cells (C1)FCM
Susceptible Cells (S3)
Resistant Cells (R2)
Ambiguous Cells
Identify
Single cell sorting
GCRVinfection
DNA methylationMeDIP-Seq
microRNASmall RNA-Seq
Gene expressionRNA-Seq
Establishing the resistant and susceptible CIK cell models;
Revealing the antiviral mechanism of grass carp against GCRVfrom Epigenetic perspective (DNA methylation & microRNA);
Acquiring molecular markers for resistant breeding of grass carpagainst GCRV.
Transcriptional level Post-transcriptional level
Cell Line Single Cell
Monoclonal Cells
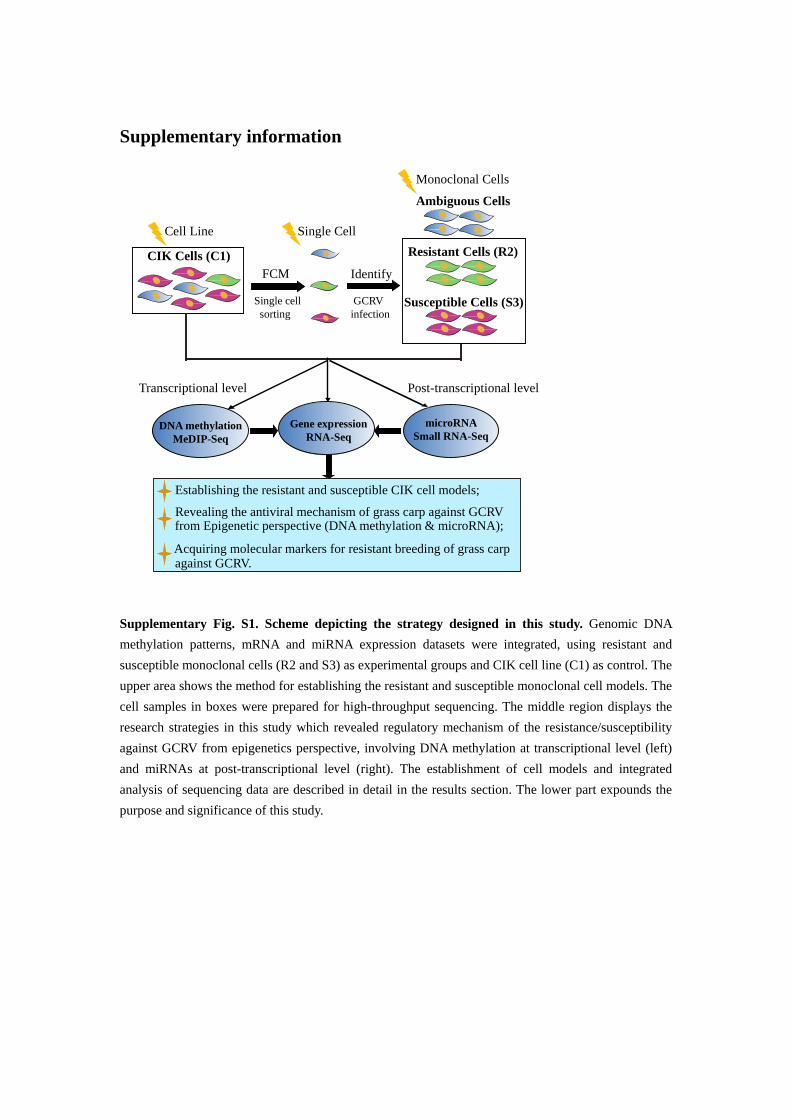
Supplementary Fig. S1. Scheme depicting the strategy designed in this study. Genomic DNA methylation patterns, mRNA and miRNA expression datasets were integrated, using resistant and susceptible monoclonal cells (R2 and S3) as experimental groups and CIK cell line (C1) as control. The upper area shows the method for establishing the resistant and susceptible monoclonal cell models. The cell samples in boxes were prepared for high-throughput sequencing. The middle region displays the research strategies in this study which revealed regulatory mechanism of the resistance/susceptibility against GCRV from epigenetics perspective, involving DNA methylation at transcriptional level (left) and miRNAs at post-transcriptional level (right). The establishment of cell models and integrated analysis of sequencing data are described in detail in the results section. The lower part expounds the purpose and significance of this study.

miRNA-Seq RNA-Seq
4000
2000
1000
500
200
25
OD: 820 ng/μL OD: 334 ng/μL OD: 391 ng/μL
OD: 560 ng/μL OD: 726 ng/μL OD: 547 ng/μL
miRNA-Seq
RNA-Seq
C1
C1
R2
R2
S3
S3
Supplementary Fig. S2. RNA quality control for building libraries. The left graph exhibits the results by agarose gel electrophoresis (AGE). The right one shows the integrity of the extracted RNA using the Agilent 2100 Bioanalyzer.
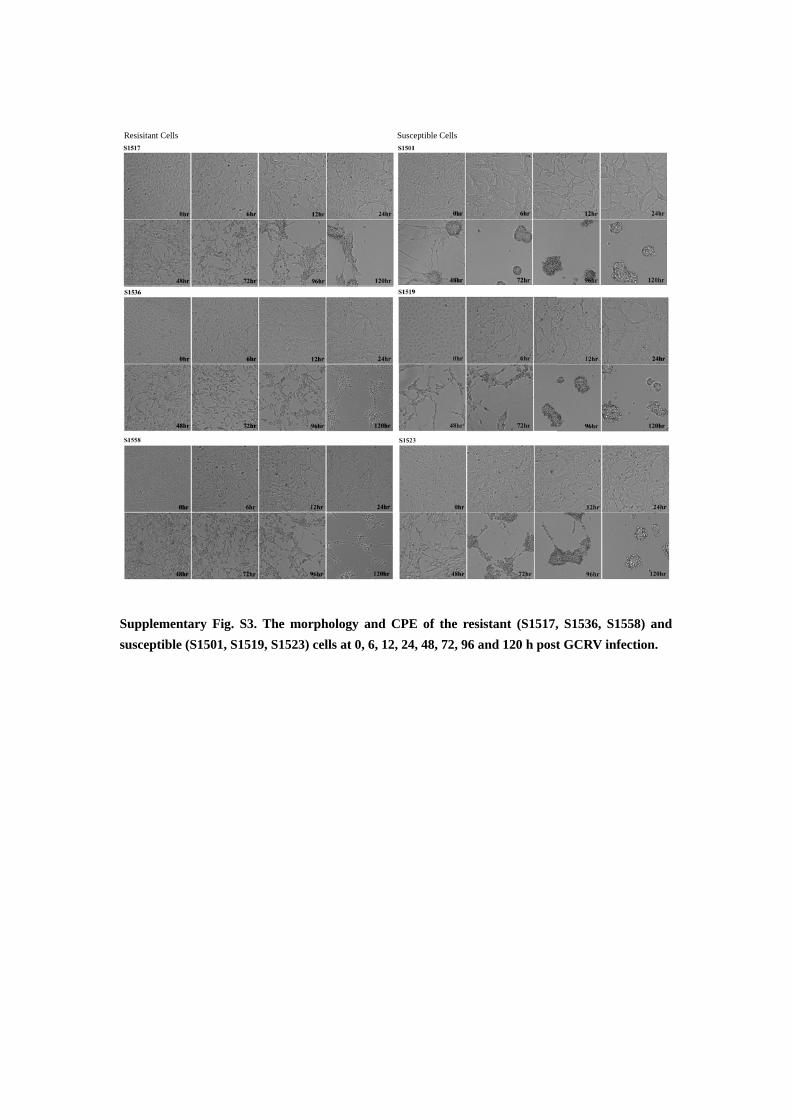
Resisitant Cells Susceptible Cells
Supplementary Fig. S3. The morphology and CPE of the resistant (S1517, S1536, S1558) and susceptible (S1501, S1519, S1523) cells at 0, 6, 12, 24, 48, 72, 96 and 120 h post GCRV infection.

A B
C D
Supplementary Fig. S4. mRNA expression patterns among samples. (A) Abundance distribution of mRNA expression. (B) Clustering analysis. (C) Principal component analysis (PCA). (D) Correlation heat map.
C1-vs-R2 C1-vs-S3
R2-vs-S3
BA
C D
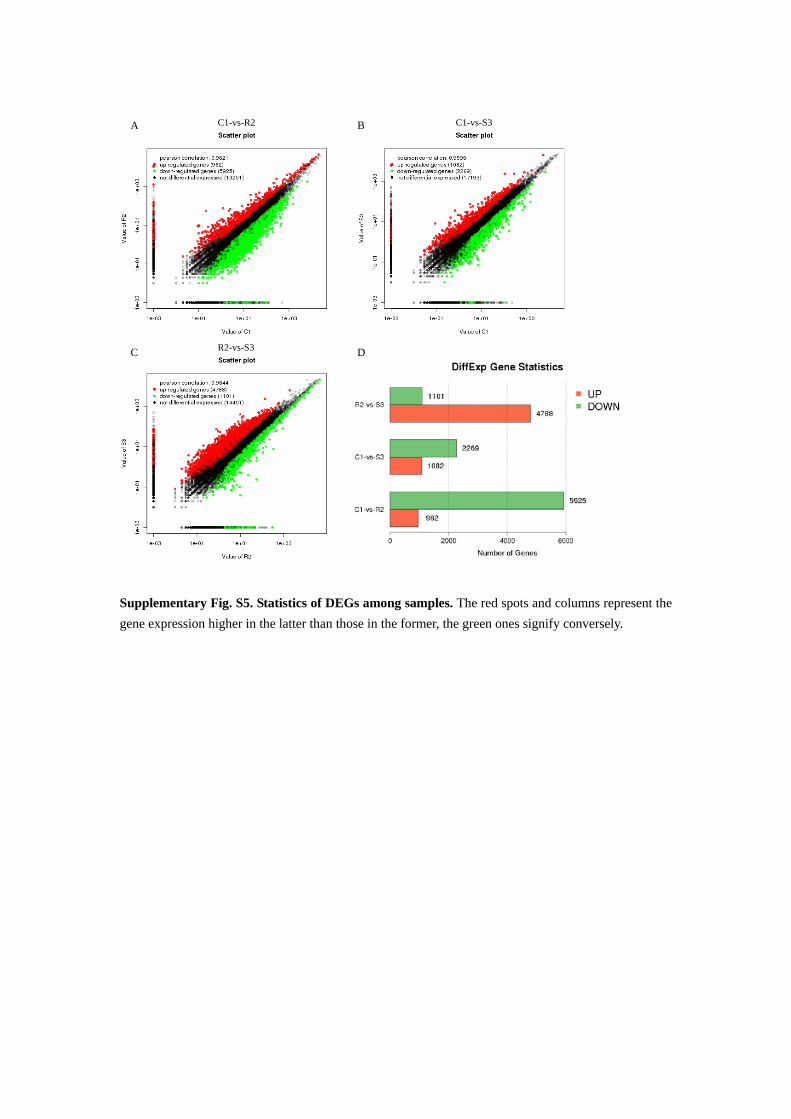
Supplementary Fig. S5. Statistics of DEGs among samples. The red spots and columns represent the gene expression higher in the latter than those in the former, the green ones signify conversely.

Percent
CHG: 21918585 (21.08%)
CHH: 70350356 (67.65%)
mCG: 11721287 (11.27%)
C1 Methylation Distribution
Percent
CHG: 22892691 (21.03%)
CHH: 73925022 (67.91%)
mCG: 12042422 (11.06%)
S3 Methylation Distribution
Percent
CHG: 21653624 (21.07%)
CHH: 69446507 (67.58%)
mCG: 11656878 (11.34%)
R2 Methylation Distribution
Supplementary Fig. S6. Distribution of mC in C1, R2 and S3 (mCG, mCHG and mCHH, where H = C, T, or A).

Supplementary Fig. S7. The statistics of peaks located in the different functional elements, including upstream2k, CDS, intron and downstream2k.

C1
R2
S3
C1
R2
S3
BC1 R2 S3
−1−0.5
00.51
A C
Supplementary Fig. S8. The expression profiling (A), length statistics (B) and chromosomes distribution of miRNAs in C1, R2 and S3 (C).

C1 R2 S3A
B C1
Known miRNA
Novel miRNA
R2 S3Known miRNA
Novel miRNA
Supplementary Fig. S9. The nucleotide bias analysis of known and novel miRNAs. (A) The first nucleotide bias. (B) The nucleotide bias at each position. The positions labeled by boxes are the discrepant loci among three groups.
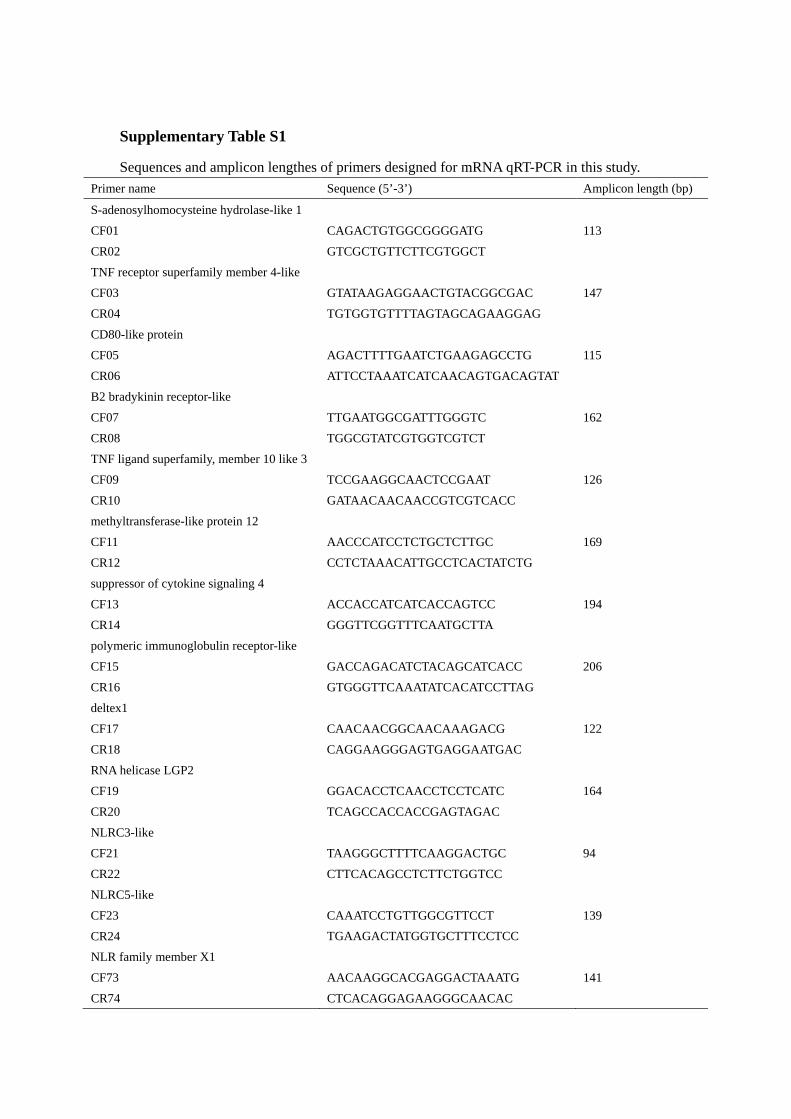
Supplementary Table S1
Sequences and amplicon lengthes of primers designed for mRNA qRT-PCR in this study. Primer name Sequence (5’-3’) Amplicon length (bp)
S-adenosylhomocysteine hydrolase-like 1 CF01 CAGACTGTGGCGGGGATG 113 CR02 GTCGCTGTTCTTCGTGGCT TNF receptor superfamily member 4-like CF03 GTATAAGAGGAACTGTACGGCGAC 147 CR04 TGTGGTGTTTTAGTAGCAGAAGGAG CD80-like protein CF05 AGACTTTTGAATCTGAAGAGCCTG 115 CR06 ATTCCTAAATCATCAACAGTGACAGTAT B2 bradykinin receptor-like CF07 TTGAATGGCGATTTGGGTC 162 CR08 TGGCGTATCGTGGTCGTCT TNF ligand superfamily, member 10 like 3 CF09 TCCGAAGGCAACTCCGAAT 126 CR10 GATAACAACAACCGTCGTCACC methyltransferase-like protein 12 CF11 AACCCATCCTCTGCTCTTGC 169 CR12 CCTCTAAACATTGCCTCACTATCTG suppressor of cytokine signaling 4 CF13 ACCACCATCATCACCAGTCC 194 CR14 GGGTTCGGTTTCAATGCTTA polymeric immunoglobulin receptor-like CF15 GACCAGACATCTACAGCATCACC 206 CR16 GTGGGTTCAAATATCACATCCTTAG deltex1 CF17 CAACAACGGCAACAAAGACG 122 CR18 CAGGAAGGGAGTGAGGAATGAC RNA helicase LGP2 CF19 GGACACCTCAACCTCCTCATC 164 CR20 TCAGCCACCACCGAGTAGAC NLRC3-like CF21 TAAGGGCTTTTCAAGGACTGC 94 CR22 CTTCACAGCCTCTTCTGGTCC NLRC5-like CF23 CAAATCCTGTTGGCGTTCCT 139 CR24 TGAAGACTATGGTGCTTTCCTCC NLR family member X1 CF73 AACAAGGCACGAGGACTAAATG 141 CR74 CTCACAGGAGAAGGGCAACAC

TBK1-binding protein 1-like CF27 CAGAGGATGAGGAGGAGTGGTC 131 CR28 GTTGGGACGGGAAGGAATG interleukin 3 regulated, member 5 CF29 AGAAGCCTCCACTGACGATG 155 CR30 GCAGAGCAGTGCCTTTCATT interleukin-17 receptor D CF31 AGTCTCGCTTCAAGATACACCCT 133 CR32 GGAGTTTACAGTATCCGCTTTCAG IRF2-binding protein 1 CF33 CTCCGAAAGTGTAAGGAACCG 199 CR34 GCACGGGTACTCGACGAAC TNF α-induced protein 8-like protein 1 CF37 TGGTCAAGTTGGGCGTCCT 173 CR38 GCGGCAGTCGTTGAGTAAGTT immunoglobulin superfamily member 21-like CF41 TCAGCAACACGCACATTCC 112 CR42 GTGACCTCGCAGCTAAACAAG macrophage-stimulating protein receptor CF43 GTCTACAACGTGGTTCAAGCG 125 CR44 ACACCCAAGTCATCAGTTACAGC MHC class I protein CF45 TCTCCAGATGTTCGTGTCTCTG 127 CR46 GGATGTTTCTGTACAATCTAATGTTC suppressor of cytokine signaling 3b CF47 GGCTTCTACTGGAGCACCGT 181 CR48 GCAGGAAGAAGGAGCAGGAAT immediate early response gene 5 CF51 GGGGAATCACATCAAGCACC 138 CR52 CTCGCCTTCCTCGTCCTCT Id1 CF53 GTTGGAGGCGAAGATGTTGTC 161 CR54 TTGTTGGTCGGTAGCGTGG cyclin-dependent kinase inhibitor 1B CF55 CTCCAATCTTCATTTGTGCTCCT 114 CR56 CGAGGTGTTTCGGGCGT tumor protein p53-inducible nuclear protein 1 CF57 ATTCGGCGGCAGACACC 186 CR58 CGTACACGGACATGCTGGG BCL2/adenovirus E1B interacting protein 3-like a CF59 GGTGGAGCTGGAGTTGAACG 170 CR60 TAGAGGAGGAGGAAGGCACG glutathione peroxidase 3 (plasma) precursor CF63 CAGACGGAAGACCAGTAATGAGG 84
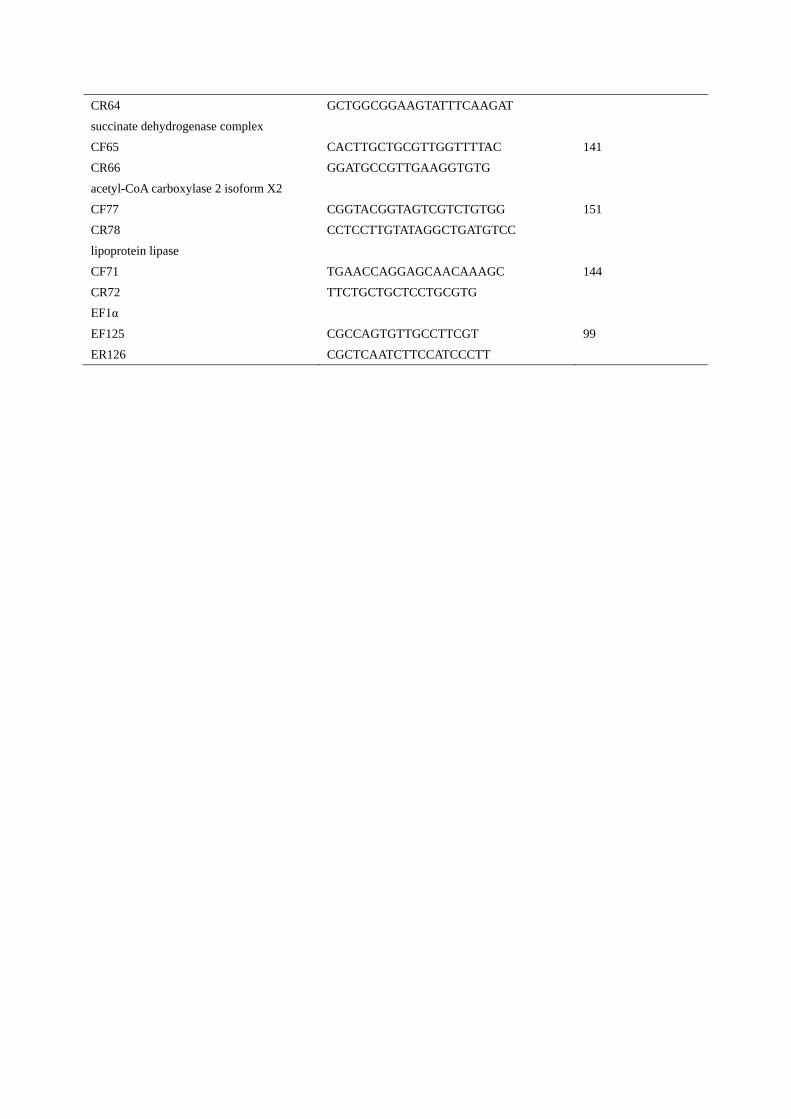
CR64 GCTGGCGGAAGTATTTCAAGAT succinate dehydrogenase complex CF65 CACTTGCTGCGTTGGTTTTAC 141 CR66 GGATGCCGTTGAAGGTGTG acetyl-CoA carboxylase 2 isoform X2 CF77 CGGTACGGTAGTCGTCTGTGG 151 CR78 CCTCCTTGTATAGGCTGATGTCC lipoprotein lipase CF71 TGAACCAGGAGCAACAAAGC 144 CR72 TTCTGCTGCTCCTGCGTG EF1α EF125 CGCCAGTGTTGCCTTCGT 99 ER126 CGCTCAATCTTCCATCCCTT
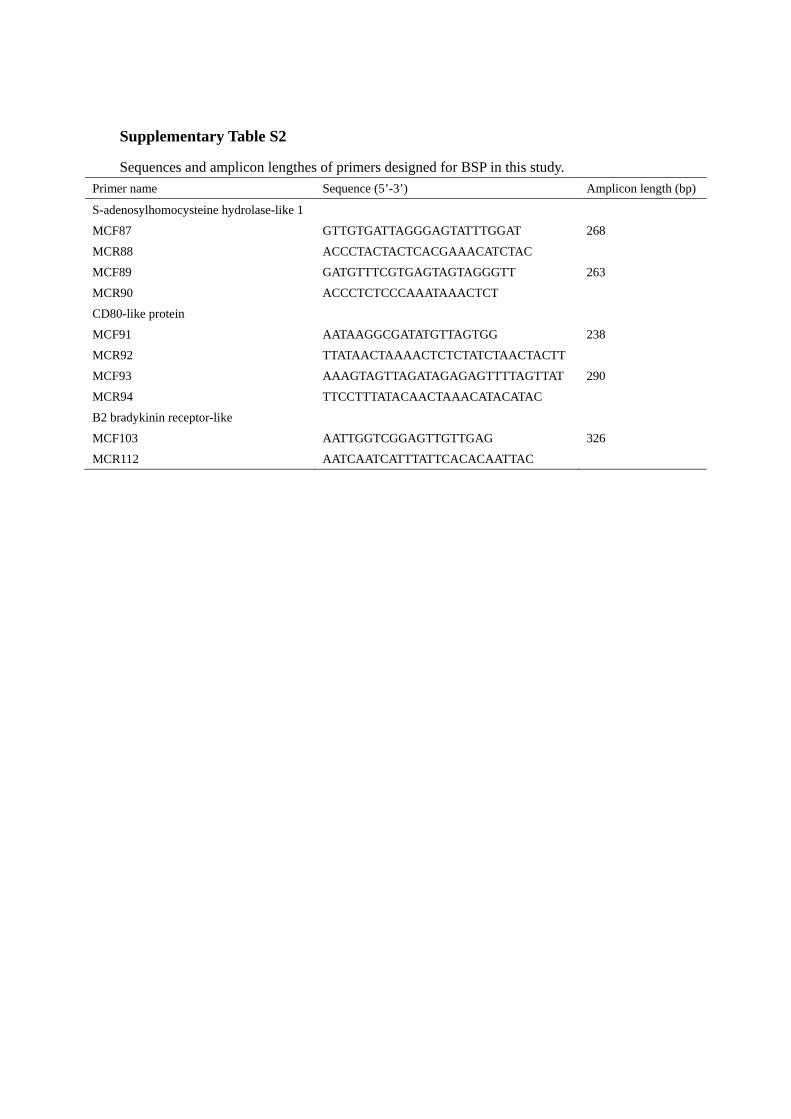
Supplementary Table S2
Sequences and amplicon lengthes of primers designed for BSP in this study. Primer name Sequence (5’-3’) Amplicon length (bp)
S-adenosylhomocysteine hydrolase-like 1 MCF87 GTTGTGATTAGGGAGTATTTGGAT 268 MCR88 ACCCTACTACTCACGAAACATCTAC MCF89 GATGTTTCGTGAGTAGTAGGGTT 263 MCR90 ACCCTCTCCCAAATAAACTCT CD80-like protein MCF91 AATAAGGCGATATGTTAGTGG 238 MCR92 TTATAACTAAAACTCTCTATCTAACTACTT MCF93 AAAGTAGTTAGATAGAGAGTTTTAGTTAT 290 MCR94 TTCCTTTATACAACTAAACATACATAC B2 bradykinin receptor-like MCF103 AATTGGTCGGAGTTGTTGAG 326 MCR112 AATCAATCATTTATTCACACAATTAC

Supplementary Table S3
Primers sequences designed for miRNA qRT-PCR in this study. miRNA Primer name Sequence (5’-3’)
mir-34-y M34-yF6A GAATCAGCAAGAATACTGCCGTTA novel-m0076-5p M0076-5pF7 GTTGCTTTAGTGCTCTTGCTTGTA mir-135-x M135-xF8 GGCTGTTATGGCTTTCTATTCCT mir-722-y M722-yF9A GCCTTTTTTCCAGTATCGTTTCA mir-191-x M191-xF10 CAACGGAATCCCAAAAGCAG mir-730-x M730xF11 GGCTCCTGATTGTGAATGCTG mir-460-y M460-yF12 GCTCAGGTTCACACCGCATA mir-730-y M730-yF13 GCTACAAGTTCACACCGCCTG
U6 snRNA U6F16 CGCTTCGGCAGCACATATAC U6R17 TTCACGAATTTGCGTGTCATC

Supplementary Table S4
Sequences, applications and amplicon lengthes of primers for luciferase reporter assay in this study.
Primer name Sequence (5’-3’) Application and amplicon length (bp)
RNA helicase LGP2 LLF1 ACTGgctagcAGCTGTCACTGTGCCAGAATT pLGP2-WT LLR2 ACTGtctagaGCAACCGTAAGGACGAAAAC 823 LLF11 AGCTGTCACTGTGCCAGAATTTCTCTCAGAT
TTGTGAATATCTCTATACCAGTGGCAG pLGP2-MUT (novel-m0076-5p)
LLR12 CTGCCACTGGTATAGAGATATTCACAAATCTGAGAGAAATTCTGGCACAGTGACAGCT
58
LLF13 TGAATATCTCTATACCAGTGGCAG LLR2 ACTGtctagaGCAACCGTAAGGACGAAAAC 789 LLF1 ACTGgctagcAGCTGTCACTGTGCCAGAATT pLGP2-MUT (mir-34-y) LLR14 GATGTAAAAAGTCGATAATCTGGATAG 147 LLF15 CTATCCAGATTATCGACTTTTTACATC LLR2 ACTGtctagaGCAACCGTAAGGACGAAAAC 703 NLRC5 LNF3 ACTGgctagcAAATAACCACGGCAGGAGC pNLRC5-WT LNR4 ACTGtctagaGGTTGTGCGTTTACCAGTGAC 770 LNF3 ACTGgctagcAAATAACCACGGCAGGAGC pNLRC5-MUT (mir-34-y) LNR16 TCAGTGTAAGTCGAAAGAGCATAAC 537 LNF17 GTTATGCTCTTTCGACTTACACTG LNR4 ACTGtctagaGGTTGTGCGTTTACCAGTGAC 258 TBK1-binding protein 1-like LTF9 ACTGgctagcAGACAGAATGTAGGCGATGC pTBK1-BP-WT LTR10 ACTGtctagaCTTTCCCATTTTAGTTCCTCTG 1217 LTF9 ACTGgctagcAGACAGAATGTAGGCGATGC pTBK1-BP-MUT (mir-722-y) LTR18 GTGTTACTTAAAACCCTTAGTGTTAGT 432 LTF19 ACTAACACTAAGGGTTTTAAGTAACAC LTR10 ACTGtctagaCTTTCCCATTTTAGTTCCTCTG 812 suppressor of cytokine signaling 3b LSF22 ACTGgctagcCAAAGACGGACTGCTGAAGAT pSOCS3B-WT LSR8 ACTGtctagaGCACGGTCCTTCATGTAAAAC 607 LSF22 ACTGgctagcCAAAGACGGACTGCTGAAGAT pSOCS3B-MUT (mir-34-y) LSR20 TATTGAATCAAGTCGAATGTTCAGT 508 LSF21 ACTGAACATTCGACTTGATTCAAT LSR8 ACTGtctagaGCACGGTCCTTCATGTAAAAC 124
Note: “ACTG” in bold represents protective bases.

Supplementary Table S5
The mapping results with C. idella genome. C1 R2 S3 Clean base (nt) 5,930,031,750 6,341,051,750 6,234,584,000 Clean reads 47,163,276 50,148,298 49,509,734 Mapped reads 39,778,122 42,654,140 42,950,397 Mapping ratio 84.34% 85.06% 86.75%
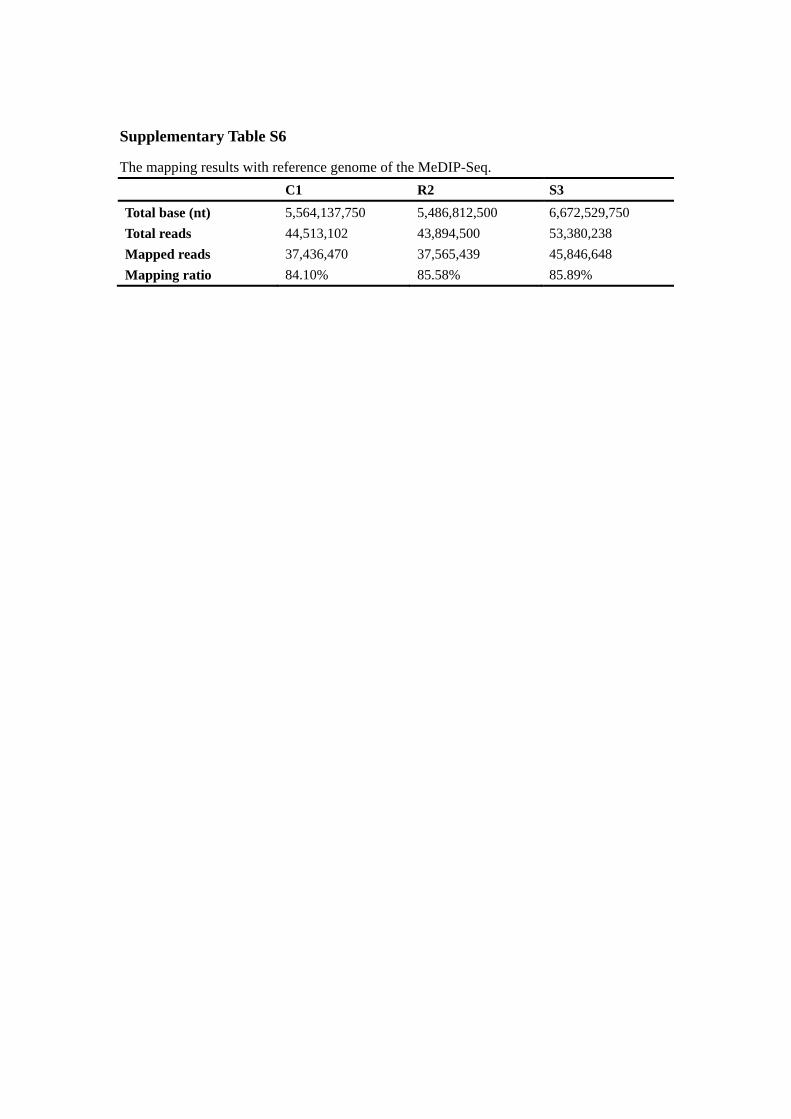
Supplementary Table S6
The mapping results with reference genome of the MeDIP-Seq. C1 R2 S3 Total base (nt) 5,564,137,750 5,486,812,500 6,672,529,750 Total reads 44,513,102 43,894,500 53,380,238 Mapped reads 37,436,470 37,565,439 45,846,648 Mapping ratio 84.10% 85.58% 85.89%
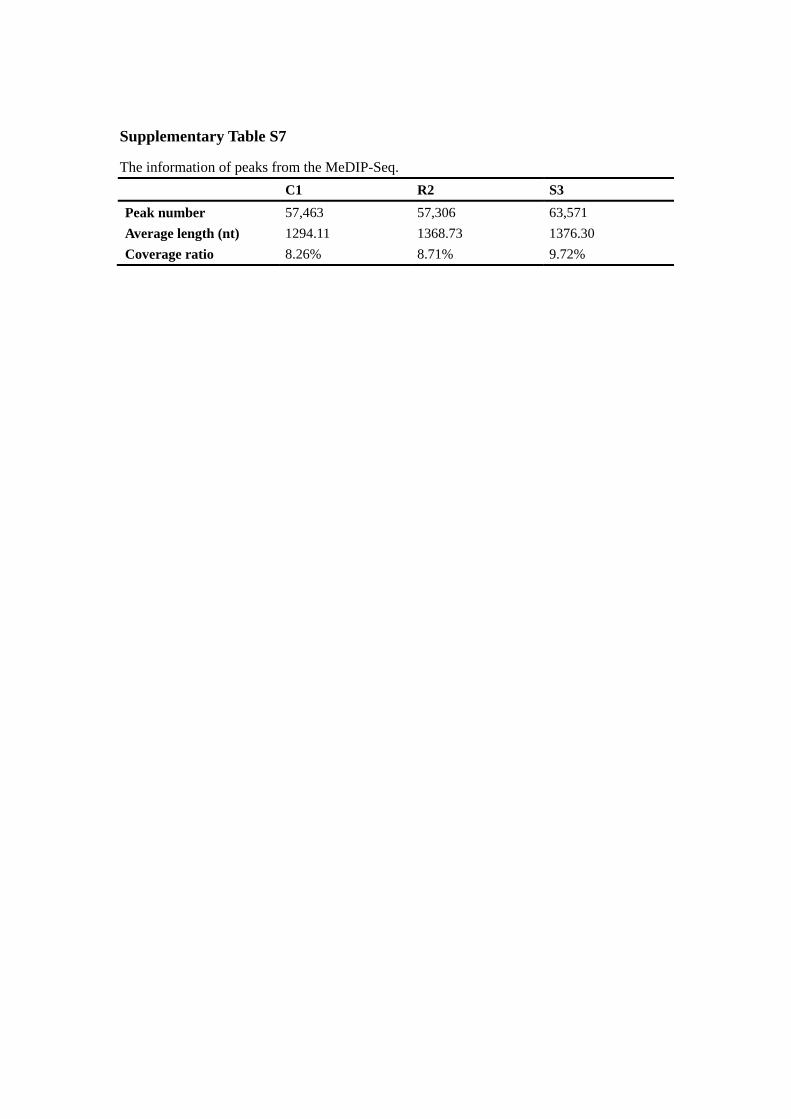
Supplementary Table S7
The information of peaks from the MeDIP-Seq. C1 R2 S3 Peak number 57,463 57,306 63,571 Average length (nt) 1294.11 1368.73 1376.30 Coverage ratio 8.26% 8.71% 9.72%

Supplementary Table S8
Methylation analysis between R2 and S3 cells at CpG loci in CD80-like protein.
Locus Methylation
status
Resistant R2 cells NO (%)
Susceptible S3 cells NO (%)
χ2-value P-value
+18 nt MC 12 (100.0) 12 (100.0) N N UMT 0 (0.0) 0 (0.0) +192 nt
MC 9 (75.0) 12 (100.0) 3.429
0.064 UMT 3 (25.0) 0 (0.0)
+196 nt
MC 10 (83.3) 12 (100.0) 2.182
0.140 UMT 2 (16.7) 0 (0.0)
+206 nt
MC 10 (83.3) 12 (100.0) 2.182
0.140 UMT 2 (16.7) 0 (0.0)
+290 nt MC 12 (100.0) 12 (100.0) N N
UMT 0 (0.0) 0 (0.0) +351 nt MC 4 (33.3) 6 (50.0) 0.686 0.408
UMT 8 (66.7) 6 (50.0) +358 nt MC 5 (41.7) 9 (75.0) 2.743 0.098
UMT 7 (58.3) 3 (25.0) +367 nt MC 6 (50.0) 10 (83.3) 3.000 0.083
UMT 6 (50.0) 2 (16.7) +381 nt MC 2 (16.7) 6 (50.0) 3.000 0.083
UMT 10 (83.3) 6 (50.0) +397 nt MC 0 (0.0) 1 (8.3) 1.043 0.307
UMT 12 (100.0) 11 (91.7)
Total CpG-loci
MC 70 (58.3) 92 (76.7) 9.193
0.002**
UMT 50 (41.7) 28 (23.3)
Note: MC and UMT stand for methylation and unmethylation, respectively.
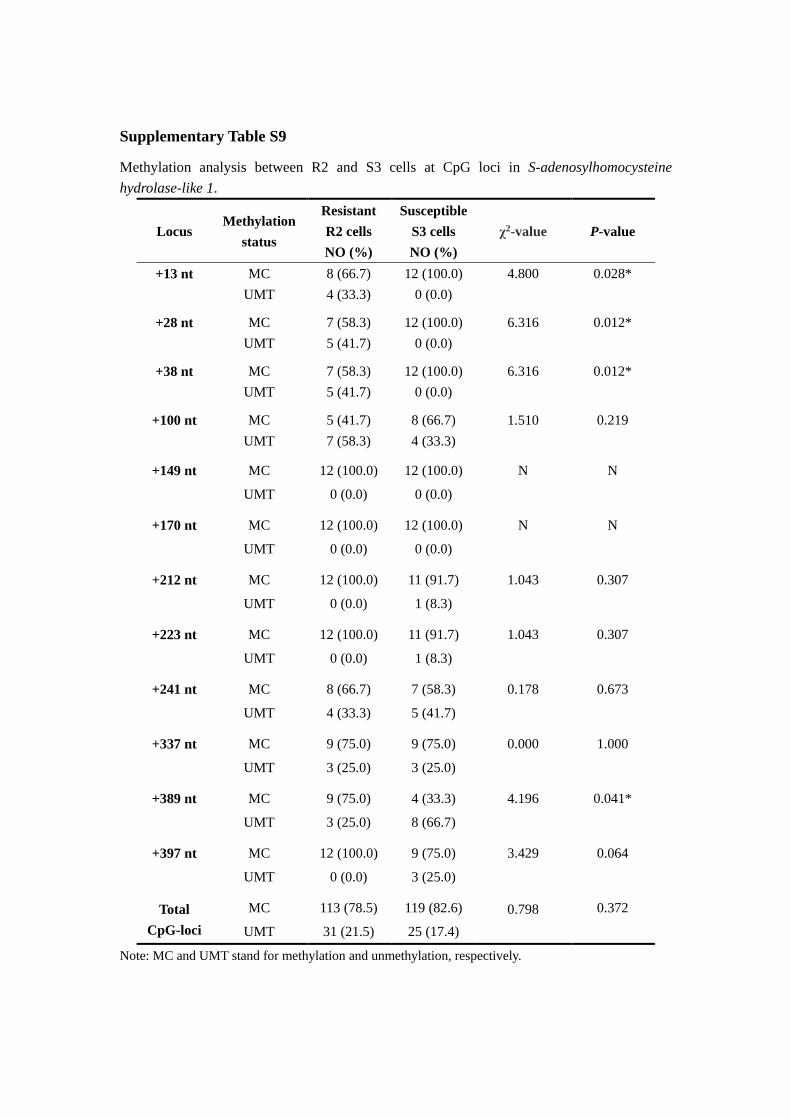
Supplementary Table S9
Methylation analysis between R2 and S3 cells at CpG loci in S-adenosylhomocysteine hydrolase-like 1.
Locus Methylation
status
Resistant R2 cells NO (%)
Susceptible S3 cells NO (%)
χ2-value P-value
+13 nt MC 8 (66.7) 12 (100.0) 4.800 0.028* UMT 4 (33.3) 0 (0.0) +28 nt
MC 7 (58.3) 12 (100.0) 6.316
0.012* UMT 5 (41.7) 0 (0.0)
+38 nt
MC 7 (58.3) 12 (100.0) 6.316
0.012* UMT 5 (41.7) 0 (0.0)
+100 nt
MC 5 (41.7) 8 (66.7) 1.510
0.219 UMT 7 (58.3) 4 (33.3)
+149 nt MC 12 (100.0) 12 (100.0) N N
UMT 0 (0.0) 0 (0.0) +170 nt MC 12 (100.0) 12 (100.0) N N
UMT 0 (0.0) 0 (0.0) +212 nt MC 12 (100.0) 11 (91.7) 1.043 0.307
UMT 0 (0.0) 1 (8.3) +223 nt MC 12 (100.0) 11 (91.7) 1.043 0.307
UMT 0 (0.0) 1 (8.3) +241 nt MC 8 (66.7) 7 (58.3) 0.178 0.673
UMT 4 (33.3) 5 (41.7) +337 nt MC 9 (75.0) 9 (75.0) 0.000 1.000
UMT 3 (25.0) 3 (25.0) +389 nt MC 9 (75.0) 4 (33.3) 4.196 0.041*
UMT 3 (25.0) 8 (66.7) +397 nt MC 12 (100.0) 9 (75.0) 3.429 0.064
UMT 0 (0.0) 3 (25.0)
Total CpG-loci
MC 113 (78.5) 119 (82.6) 0.798
0.372
UMT 31 (21.5) 25 (17.4)
Note: MC and UMT stand for methylation and unmethylation, respectively.
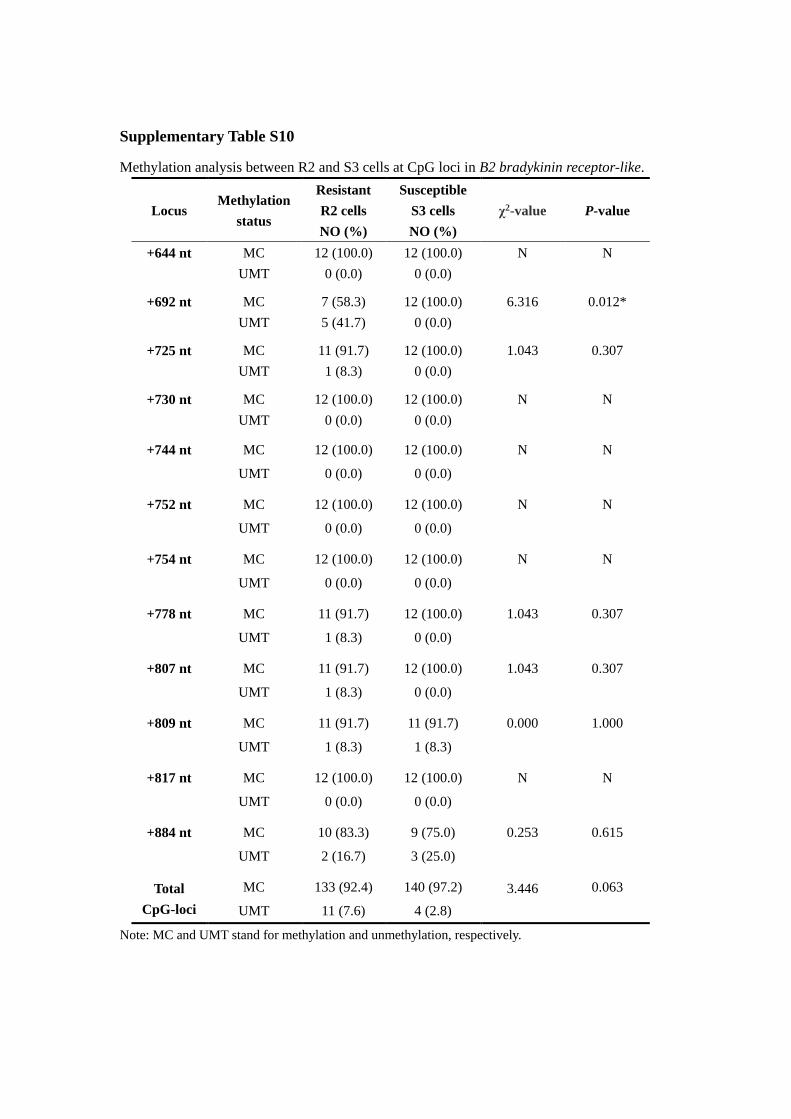
Supplementary Table S10
Methylation analysis between R2 and S3 cells at CpG loci in B2 bradykinin receptor-like.
Locus Methylation
status
Resistant R2 cells NO (%)
Susceptible S3 cells NO (%)
χ2-value P-value
+644 nt MC 12 (100.0) 12 (100.0) N N UMT 0 (0.0) 0 (0.0) +692 nt
MC 7 (58.3) 12 (100.0) 6.316
0.012* UMT 5 (41.7) 0 (0.0)
+725 nt
MC 11 (91.7) 12 (100.0) 1.043
0.307 UMT 1 (8.3) 0 (0.0)
+730 nt
MC 12 (100.0) 12 (100.0) N
N UMT 0 (0.0) 0 (0.0)
+744 nt MC 12 (100.0) 12 (100.0) N N
UMT 0 (0.0) 0 (0.0) +752 nt MC 12 (100.0) 12 (100.0) N N
UMT 0 (0.0) 0 (0.0) +754 nt MC 12 (100.0) 12 (100.0) N N
UMT 0 (0.0) 0 (0.0) +778 nt MC 11 (91.7) 12 (100.0) 1.043 0.307
UMT 1 (8.3) 0 (0.0) +807 nt MC 11 (91.7) 12 (100.0) 1.043 0.307
UMT 1 (8.3) 0 (0.0) +809 nt MC 11 (91.7) 11 (91.7) 0.000 1.000
UMT 1 (8.3) 1 (8.3) +817 nt MC 12 (100.0) 12 (100.0) N N
UMT 0 (0.0) 0 (0.0) +884 nt MC 10 (83.3) 9 (75.0) 0.253 0.615
UMT 2 (16.7) 3 (25.0)
Total CpG-loci
MC 133 (92.4) 140 (97.2) 3.446
0.063
UMT 11 (7.6) 4 (2.8)
Note: MC and UMT stand for methylation and unmethylation, respectively.

Supplementary Table S11. Information of sequences for integrated analyses.
(Excel file)

Supplementary Table S12. The potential molecules involved in the regulation on cell proliferation between the resistant and susceptible traits.
(Excel file)