Embed Size (px)
Citation preview

The Design of the Tax System
EconomicsP R I N C I P L E S O F
N. Gregory Mankiw
Chapter 12
In this chapter, look for the answers to these questions: What are the largest sources of tax revenue
in the U.S.?
What are the efficiency costs of taxes?
How can we evaluate the equity of a tax system?
2
THE DESIGN OF THE TAX SYSTEM 3
Introduction One of the Ten Principles from Chapter 1:
A government can sometimes improve market outcomes.
Providing public goods Regulating use of common resources Remedying the effects of externalities
To perform its many functions, the govt raises revenue through taxation.
THE DESIGN OF THE TAX SYSTEM 4
Introduction Lessons about taxes from earlier chapters:
A tax on a good reduces the market quantity of that good.
The burden of a tax is shared between buyers and sellers depending on the price elasticities of demand and supply.
A tax causes a deadweight loss.
THE DESIGN OF THE TAX SYSTEM 5
A Look at Taxation in the U.S.First, we consider:
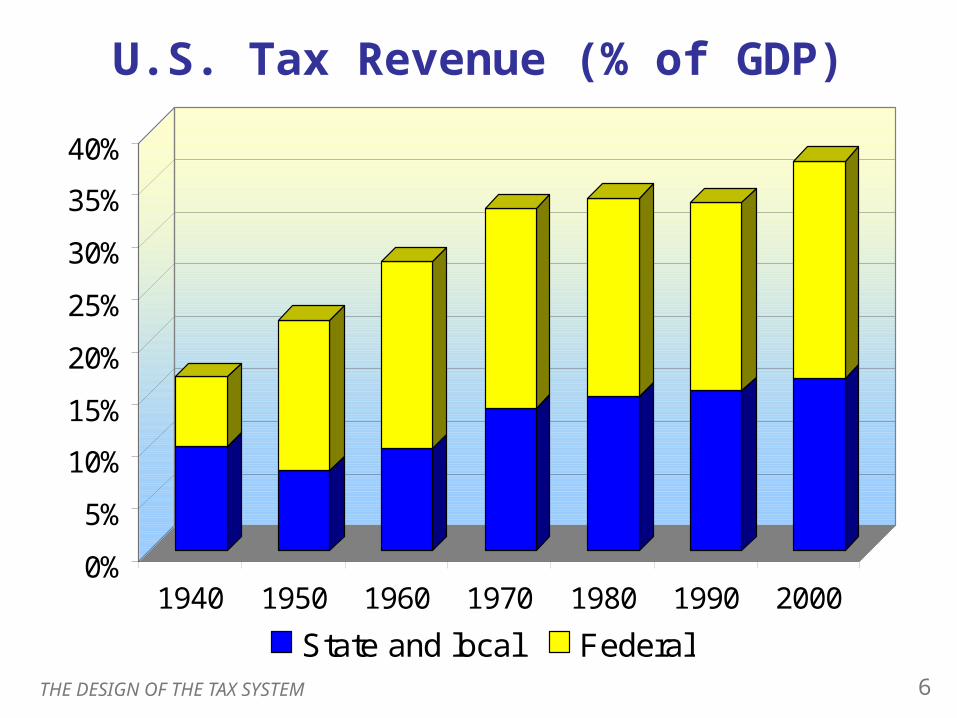
how tax revenue as a share of national income has changed over time
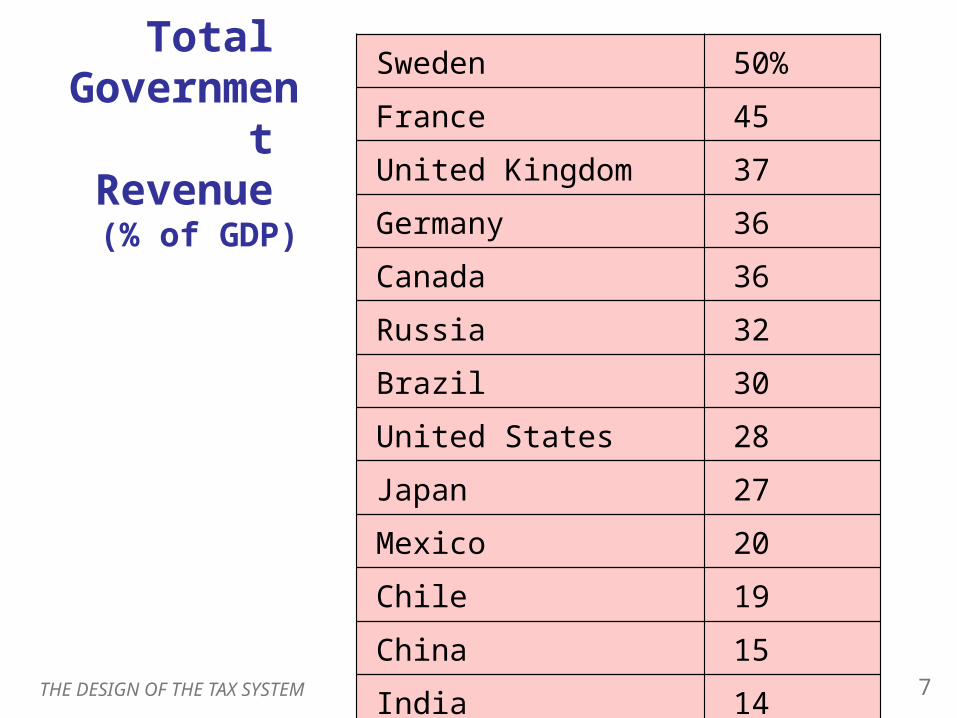
how the U.S. compares to other countries with respect to taxation
the most important revenue sources for federal, state & local govt
THE DESIGN OF THE TAX SYSTEM 6
U.S. Tax Revenue (% of GDP)
0%
5%
10%
15%
20%
25%
30%
35%
40%
1940 1950 1960 1970 1980 1990 2000
State and local Federal
THE DESIGN OF THE TAX SYSTEM 7
Total Governme
nt Revenue (% of GDP)
Sweden 50%
France 45
United Kingdom 37
Germany 36
Canada 36
Russia 32
Brazil 30
United States 28
Japan 27
Mexico 20
Chile 19
China 15
India 14
THE DESIGN OF THE TAX SYSTEM 8
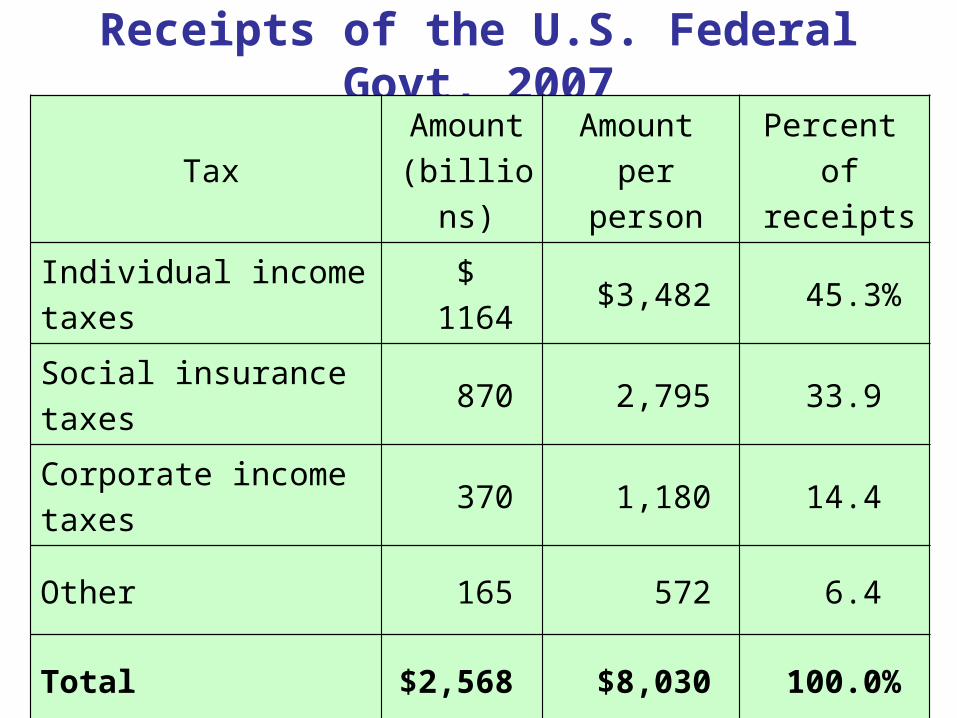
Receipts of the U.S. Federal Govt, 2007
TaxAmount (billions)
Amount per person
Percent of receipts
Individual income taxes $ 1164 $3,482 45.3%
Social insurance taxes 870 2,795 33.9
Corporate income taxes 370 1,180 14.4
Other 165 572 6.4
Total $2,568 $8,030 100.0%
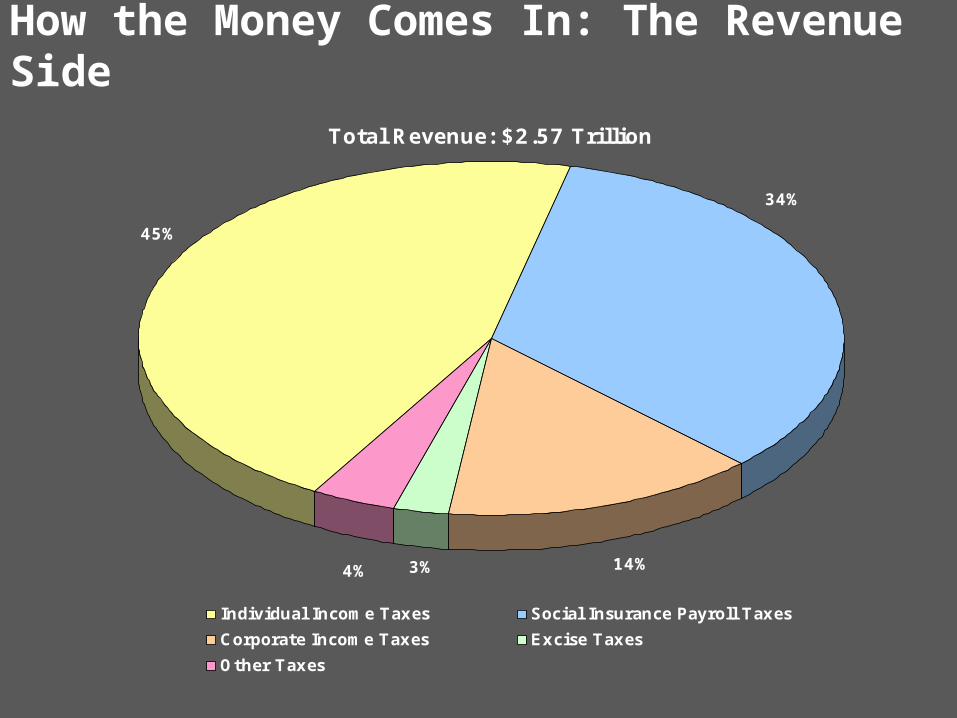
How the Money Comes In: The Revenue Side
Total Revenue: $2.57 Trillion
14%4% 3%
45%
34%
Individual Income Taxes Social Insurance Payroll Taxes
Corporate Income Taxes Excise Taxes
Other Taxes
THE DESIGN OF THE TAX SYSTEM 10
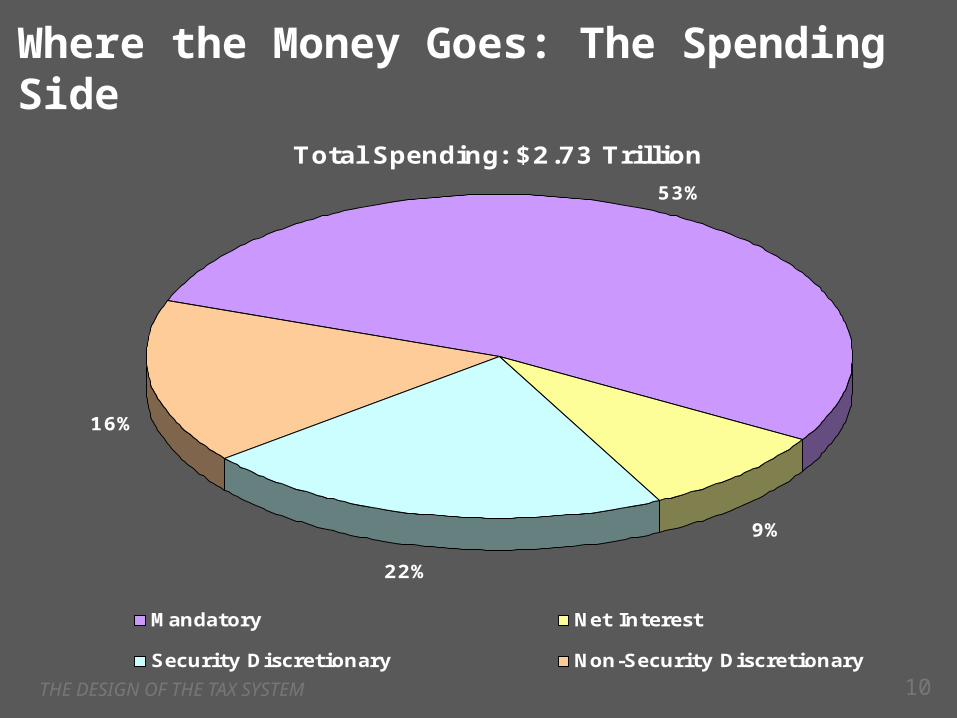
Total Spending: $2.73 Trillion
53%
9%
22%
16%
Mandatory Net Interest
Security Discretionary Non-Security Discretionary
Where the Money Goes: The Spending Side
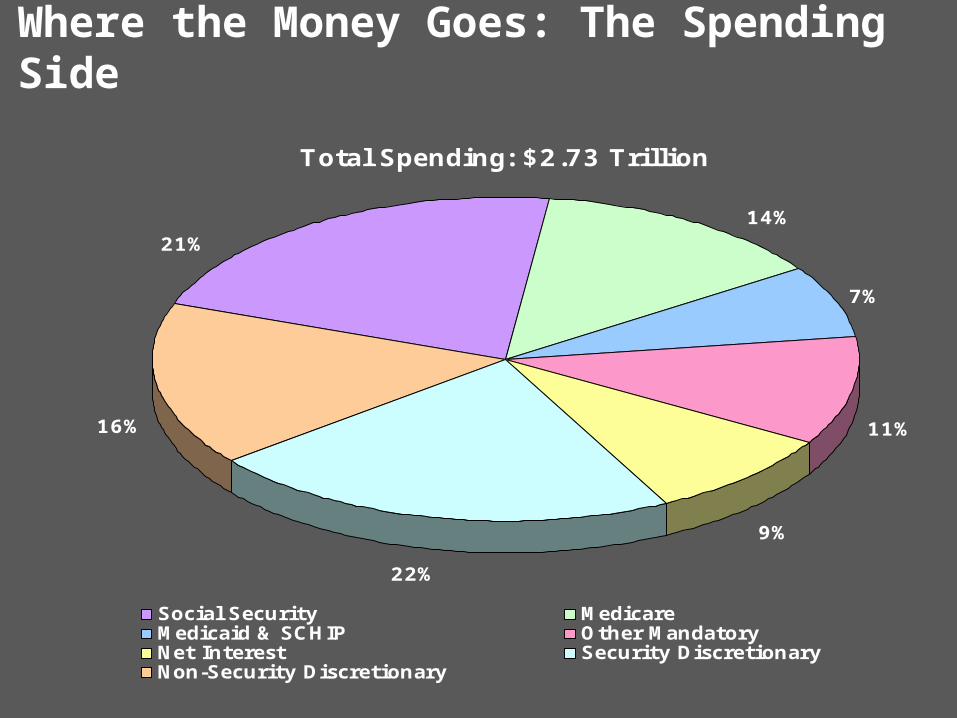
Where the Money Goes: The Spending Side
Total Spending: $2.73 Trillion
7%
11%
9%
22%
16%
21%14%
Social Security MedicareMedicaid & SCHIP Other MandatoryNet Interest Security DiscretionaryNon-Security Discretionary
THE DESIGN OF THE TAX SYSTEM 13
Taxes and Efficiency One tax system is more efficient than another
if it raises the same amount of revenue at a smaller cost to taxpayers.
The costs to taxpayers include: the tax payment itself deadweight losses administrative burden
THE DESIGN OF THE TAX SYSTEM 14
Deadweight Losses One of the Ten Principles:
People respond to incentives.
Recall from Chapter 8: Taxes distort incentives, cause people to allocate resources according to tax incentives rather than true costs and benefits.
The result: a deadweight loss. The fall in taxpayers’ well-being exceeds the revenue the govt collects.
THE DESIGN OF THE TAX SYSTEM 15
Income vs. Consumption Tax The income tax reduces the incentive to save:
If income tax rate = 25%, 8% interest rate = 6% after-tax interest rate.
The lost income compounds over time.
Some economists advocate taxing consumption instead of income. Would restore incentive to save. Better for individuals’ retirement income security
and long-run economic growth.
THE DESIGN OF THE TAX SYSTEM 16
Income vs. Consumption Tax Consumption tax-like provisions in the U.S. tax
code include Individual Retirement Accounts, 401(k) plans. People can put a limited amount of saving into
such accounts. The funds are not taxed until withdrawn at
retirement.
Europe’s Value-Added Tax (VAT) is like a consumption tax.
THE DESIGN OF THE TAX SYSTEM 17
Administrative Burden Includes the time and money people spend to
comply with tax laws
Encourages the expenditure of resources on legal tax avoidance e.g., hiring accountants to exploit “loopholes”
to reduce one’s tax burden
Is a type of deadweight loss
Could be reduced if the tax code were simplified
but would require removing loopholes, politically difficult
THE DESIGN OF THE TAX SYSTEM 18
Marginal vs. Average Tax Rates
Average tax rate total taxes paid divided by total income measures the sacrifice a taxpayer makes
Marginal tax rate the extra taxes paid on an additional dollar of
income measures the incentive effects of taxes
on work effort, saving, etc.
THE DESIGN OF THE TAX SYSTEM 19
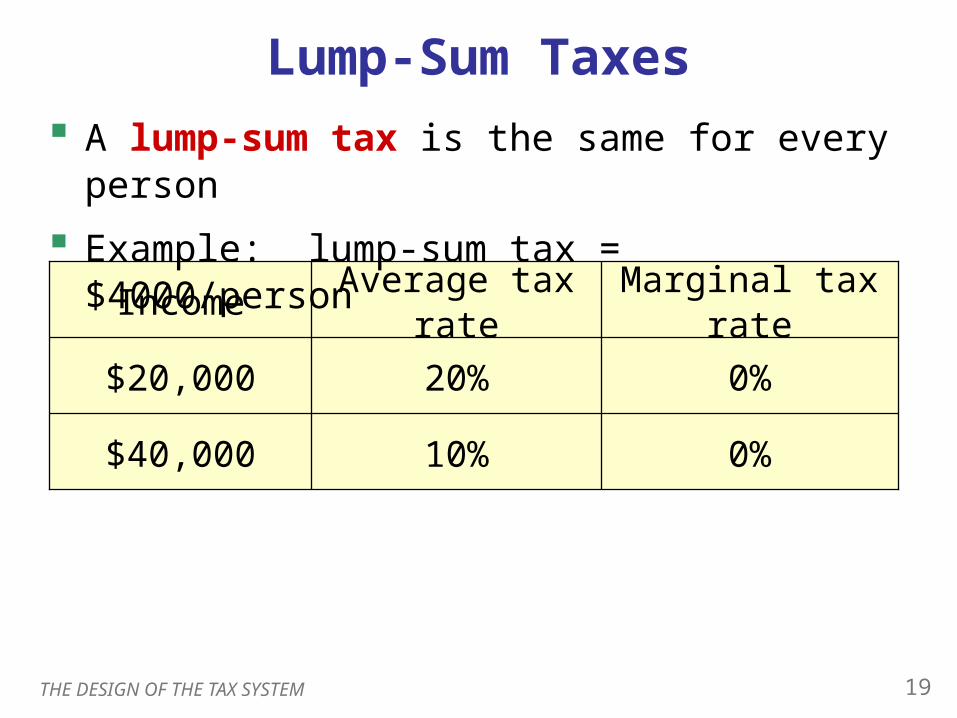
Marginal tax rateAverage tax rateIncome
0%10%$40,000
0%20%$20,000
A lump-sum tax is the same for every person
Example: lump-sum tax = $4000/person
Lump-Sum Taxes
THE DESIGN OF THE TAX SYSTEM 20
A lump-sum tax is the most efficient tax: Causes no deadweight loss
Does not distort incentives. Minimal administrative burden
No need to hire accountants, keep track of receipts, etc.
Yet, perceived as unfair: In dollar terms, the poor pay as much as the rich. Relative to income, the poor pay much more than
the rich.
Lump-Sum Taxes
THE DESIGN OF THE TAX SYSTEM 21
Taxes and Equity Another goal of tax policy:
equity – distributing the burden of taxes “fairly.”
Agreeing on what is “fair” is much harder than agreeing on what is “efficient.”
Yet, there are several principles people apply to evaluate the equity of a tax system.
THE DESIGN OF THE TAX SYSTEM 22
The Benefits Principle Benefits principle: the idea that people should
pay taxes based on the benefits they receive from govt services
Tries to make public goods similar to private goods – the more you use, the more you pay
Example: Gasoline taxes Amount of tax paid is related to
how much a person uses public roads
THE DESIGN OF THE TAX SYSTEM 23
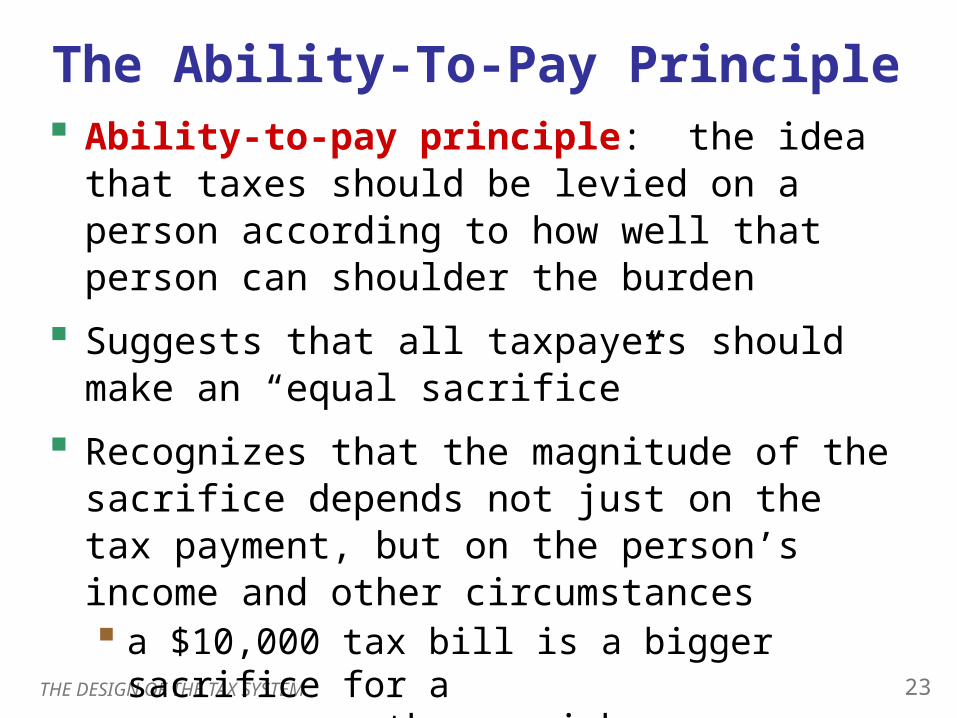
The Ability-To-Pay Principle Ability-to-pay principle: the idea that taxes
should be levied on a person according to how well that person can shoulder the burden
Suggests that all taxpayers should make an “equal sacrifice”
Recognizes that the magnitude of the sacrifice depends not just on the tax payment, but on the person’s income and other circumstances a $10,000 tax bill is a bigger sacrifice for a
poor person than a rich person
THE DESIGN OF THE TAX SYSTEM 24
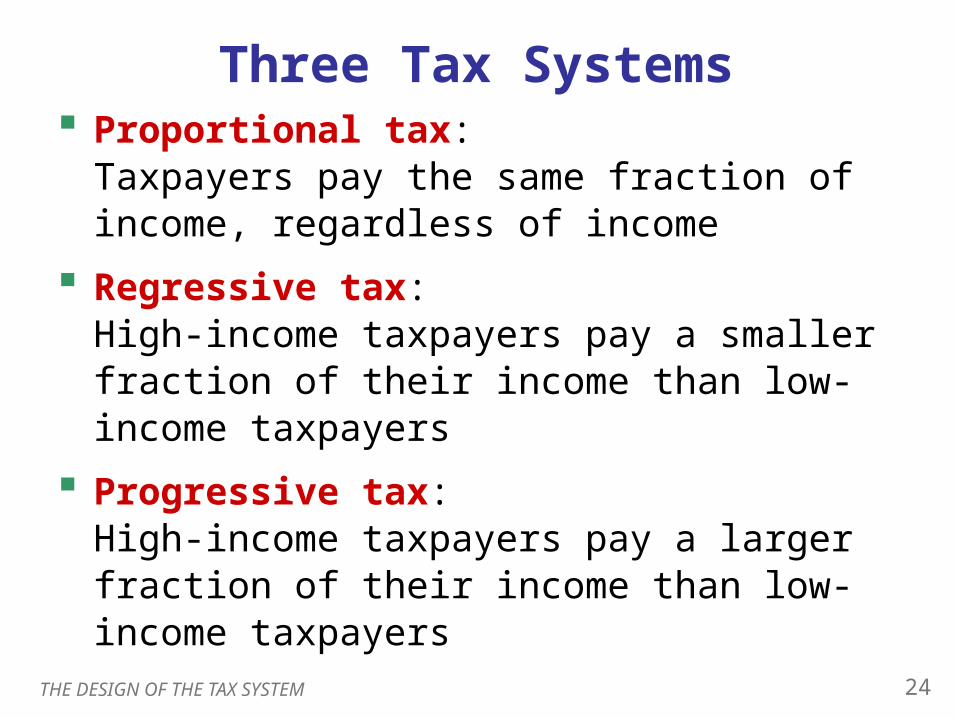
Three Tax Systems Proportional tax:
Taxpayers pay the same fraction of income, regardless of income
Regressive tax: High-income taxpayers pay a smaller fraction of their income than low-income taxpayers
Progressive tax: High-income taxpayers pay a larger fraction of their income than low-income taxpayers
THE DESIGN OF THE TAX SYSTEM 25
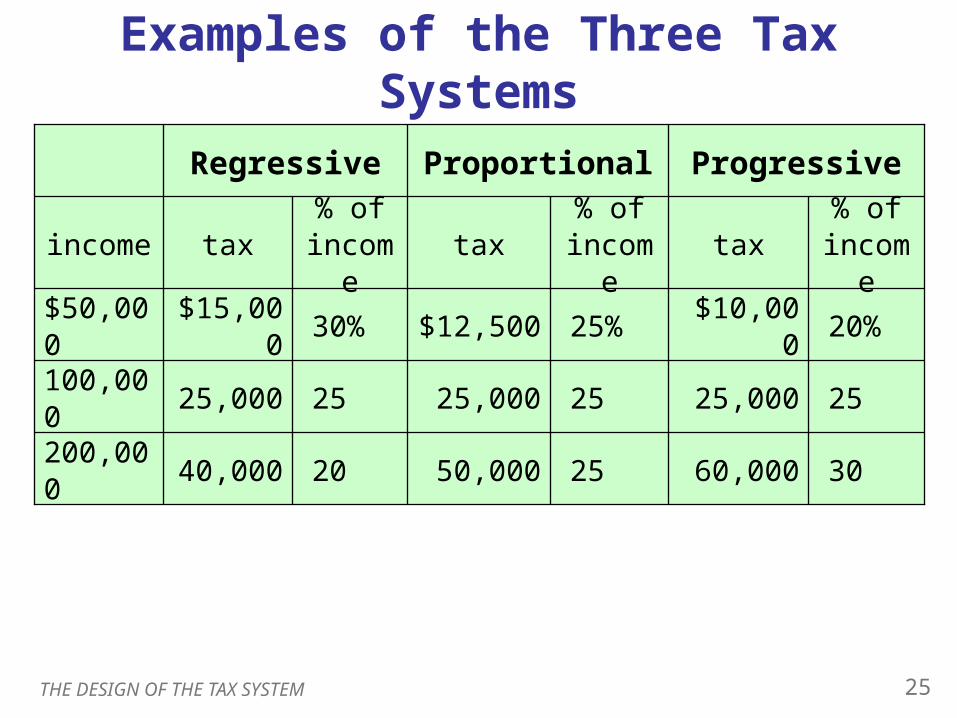
200,000
100,000
$50,000
% of income
tax% of
incometax
% of income
taxincome
3060,000
2525,000
20%$10,000
Progressive
2550,000
2525,000
25%$12,500
Proportional
2040,000
2525,000
30%$15,000
Regressive
Examples of the Three Tax Systems
THE DESIGN OF THE TAX SYSTEM 26
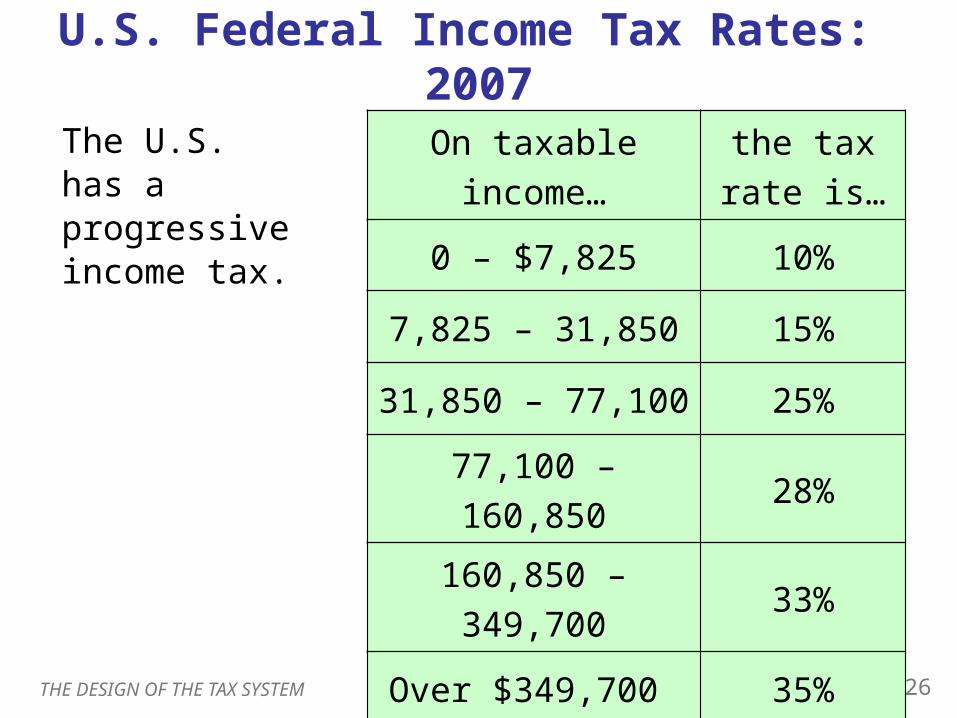
U.S. Federal Income Tax Rates: 2007
On taxable income…
the tax rate is…
0 – $7,825 10%
7,825 – 31,850 15%
31,850 – 77,100 25%
77,100 – 160,850 28%
160,850 – 349,700 33%
Over $349,700 35%
The U.S. has a progressive income tax.
THE DESIGN OF THE TAX SYSTEM 27
CONCLUSION: The Trade-Off Between Efficiency and Equity
The goals of efficiency and equity often conflict: E.g., lump-sum tax is the least equitable but
most efficient tax.
Political leaders differ in their views on this tradeoff.
Economics can help us better understand the tradeoff can help us avoid policies that sacrifice
efficiency without any increase in equity