Embed Size (px)
Citation preview
The Design and Benchmarking of a Cloud-based Platform for Processing and Visualization of
Traffic Data
Yikai Gong, Luca Morandini, Richard O. Sinnott Department of Computing and Information Systems
The University of Melbourne Melbourne, Australia
Abstract –Nowadays, more and more data are being generated and collected. This is especially so in our cities. Big data as a popular research topic has brought about a range of new challenges that must to be tackled to support both commercial and research demands. The transport area is one example that has much to benefit from big data capabilities in allowing to process voluminous amounts of data that is created in real time and in vast quantities. Tackling these big data issues requires capabilities not typically found in common Cloud platforms. The high speed of production of data (velocity) of high volume data demands a distributed file system for storing and duplicating data; high performance computing engines capable of processing such large quantities of data in real time; a reliable database system able to optimize the indexing and querying of the data, and essentially a flexible implementation for scaling the usage of computation resources based on the bursty nature of data production. In this paper, we present and benchmark SMASH, a generic and highly scalable Cloud-based solution. We focus here on the implementation and especially on the utilization of the SMASH software stack and how it can be used to process large scale traffic data - although we note that the solution can be applied to other high velocity big data processing areas.
Keywords – Cloud, big data, data analytics, traffic analysis.
I. Introduction A staggering amount of data across all walks of life is being generated. This is especially so in our cities. This covers data as diverse as social media data, transport data, health data with data collected by government, by industry and across all research endeavors. This is often referred to as the data deluge [1]. Big data and platforms to derive knowledge from such diverse collections of data is now a term in common parlance [2]. In order to store, analyse and derive knowledge from this ever-growing amount of data, large-scale and above all scalable infrastructures are needed. Such infrastructure must meets many different (overlapping) challenges from different domains, e.g. the volume of data is a common challenge that must be tackled; for some domains it is the speed (velocity) at which data itself is produced; for some domains it is the accuracy, authenticity and provenance of data (veracity). Some disciplines demand all of these big data capabilities. Transport and traffic flows analytics is one area that demands a complete big data solution.
Tackling the issues of transport requires the ability to cope with large volumes of traffic that can be bursty in nature, e.g.
morning/evening rush hour in major cities increases the data, whereas traffic is far less in the very early morning. The volume of data over time can be substantial, especially if real time information is captured on the location where vehicle and pedestrians are moving. Infrastructures supporting the analysis of such data must be able to deal with such big data aspects. Cloud computing is a dominant technology for big data processing and analysis [3]. There have been many Cloud initiatives that have established a range of capabilities, e.g. Amazon Elastic Compute Cloud (EC2); Amazon Simple Storage Solution (S3) Microsoft Azure, through to a range of widely adopted data storage services such as Dropbox and iCloud. Many of these provide generic solutions offering Infrastructure as a Service (IaaS), however to tackle the specific challenges of traffic data software solutions are required – so called Software as a Service (SaaS).
Across Australia the federally funded National eResearch Collaboration Tools and Resources (NeCTAR – www.nectar.org.au) project has been established to realise a national Cloud facility for researchers across Australia. NeCTAR utilizes the OpenStack Cloud middleware and has multiple Cloud availability zones. At present NeCTAR provides almost 30,000 servers across availability zones in Melbourne, Monash, Brisbane, Canberra, Adelaide and Tasmania. The primary focus of NeCTAR has been to establish an Australia-wide IaaS service. In this model, researchers are able to dynamically create a range of VMs from small VMs offering single core 4GB machines with 30GB storage, through to extra large machines offering 16 cores with 64GB memory and 480GB storage. In addition to this, the federally funded Research Data Services (RDS – www.rds.edu.au) project) has rolled out major storage capabilities across Australia with over 100 Petabyte data storage for Australian researchers. The local (to Melbourne) realization of this is through the VicNode project (www.vicnode.org.au). Both of these platforms have been used as the basis for the work described here.
Whilst capabilities exist for processing large volumes of transport data, in itself this does support this activity. Instead, targeted solutions are required that meet the demands of big data that are specific to the transport domain. In this paper we described the SMASH software stack and its implementation. We introduce the technologies that are involved in realizing the SMASH architecture e.g. GeoServer, GeoMesa, Apache
Accumulo, Apache Spark, Apache Hadoop. We describe their key capabilities that support the specific needs and demands in dealing with high velocity, high volume traffic data with demands for highly accurate data processing. We show how this solution provides capabilities for scalable analysis of disaggregated traffic data, i.e. down to traffic flows at specific junctions at specific time periods, with case studies and benchmarking of traffic data for Victoria Australia. The traffic volume data that we utilize here is based on the Sydney Coordinated Adaptive Traffic System (SCATS) data provided by the Department of Transport in Victoria [4].
The remainder of the paper is organized as follows. In section 2, we review related work on big data processing and transport analysis and focus on the requirements/challenges of our solution. Section 3 covers the description of the SMASH architecture and offers a comparison to the traditional Hadoop data processing ecosystem. Section 4 presents the implementation of the platform and use of the container-technology Docker to facilitate deployment and scaling across the NeCTAR Research Cloud. Section 5 shows the case study and benchmarking of SMASH using different amounts of high velocity SCATS data. Finally section 6 draws conclusions on the work and identifies future enhancements.
II. Related Work
All research disciplines are becoming increasingly driven by data. Many research endeavors in many disparate disciplines are limited by the ability to discover, access and optimally use data. The work on e-Infrastructures allowing seamless access to distributed data resources has been on-going for decades [5-8] through to more recent Cloud-based efforts typified by Amazon EC2 (and NeCTAR).
Transport is one area that many researchers have explored from a variety of perspectives. One common approach underpinning transport research is through use of transport/traffic modeling tools and simulators [9-14]. One key issue is that the accuracy of information of such systems is not guaranteed to reflect the true transport issues of cities and their associated daily road networks usage statistics, i.e. they simulate the transport network but this may not reflect that actual real world situations that can/do arise. For example, commuting patterns can fluctuate greatly for a given city based on a variety of factors such as real-time transport incidents/accidents, sporting events, flooding, bush fires amongst many other emerging issues that represent real use of the road network. Modeling tools do not capture such actual real world event information.
Other approaches have explored use of social media for event detection on the transport network, e.g. Twitter data. [15] use natural language processing to identify targeted keywords in tweets and correlates them with transport events, e.g. accidents that may have taken place. Similar to the above study, [16] extracts traffic information from tweets using syntactic analysis and then classifies the results into two categories: Point and Line. Point data refers to a single accident/event on the road, e.g. a car crash, whilst Line data refers to a traffic status along certain streets including a start point and end point on a map over a given time period. Instead of focusing on the contents of tweets data, [17] provides a
novel solution, which use the geographic information of social media for near real-time transport analysis. The novelty of this work lies in the scale of data that is captured and the fact that the algorithms only capture data (tweets) from the road network itself. This work has shown that formation of traffic jams can be identified, but the challenge is that not all road users tweet and hence there is not the depth of information on all users of the road network system. This work was extended and applied in [18] and used to identify and validate traffic accident blackspots through social media.
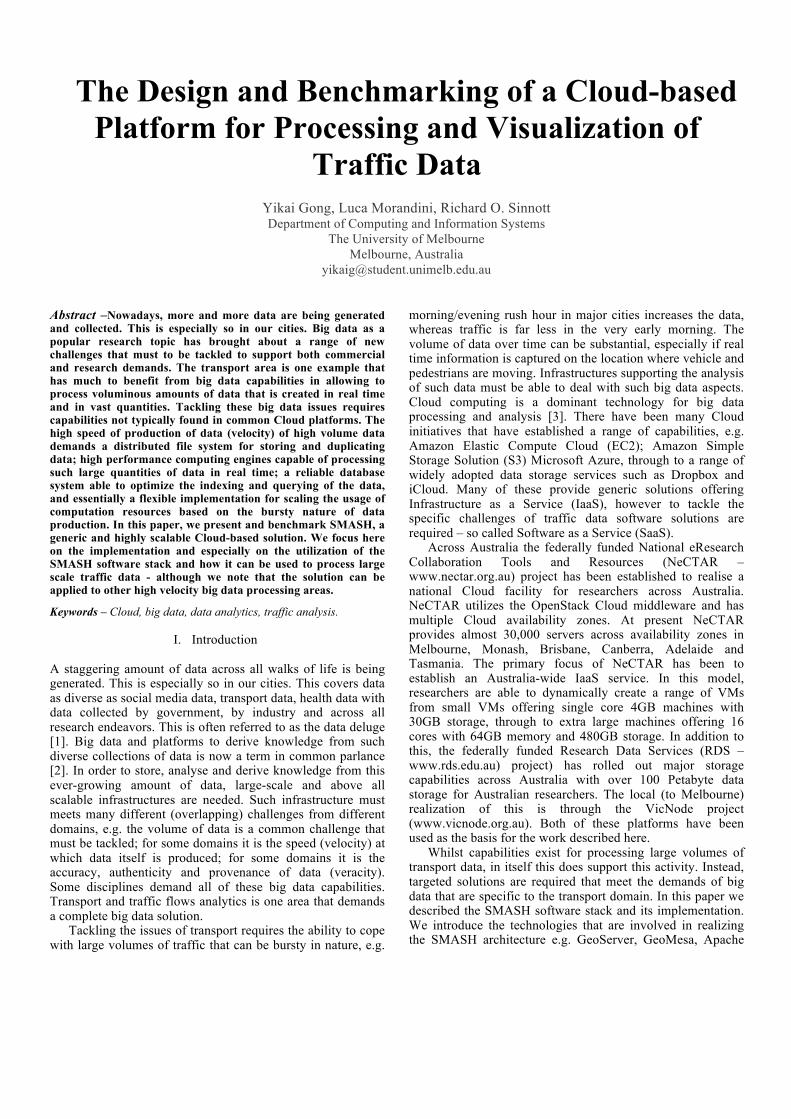
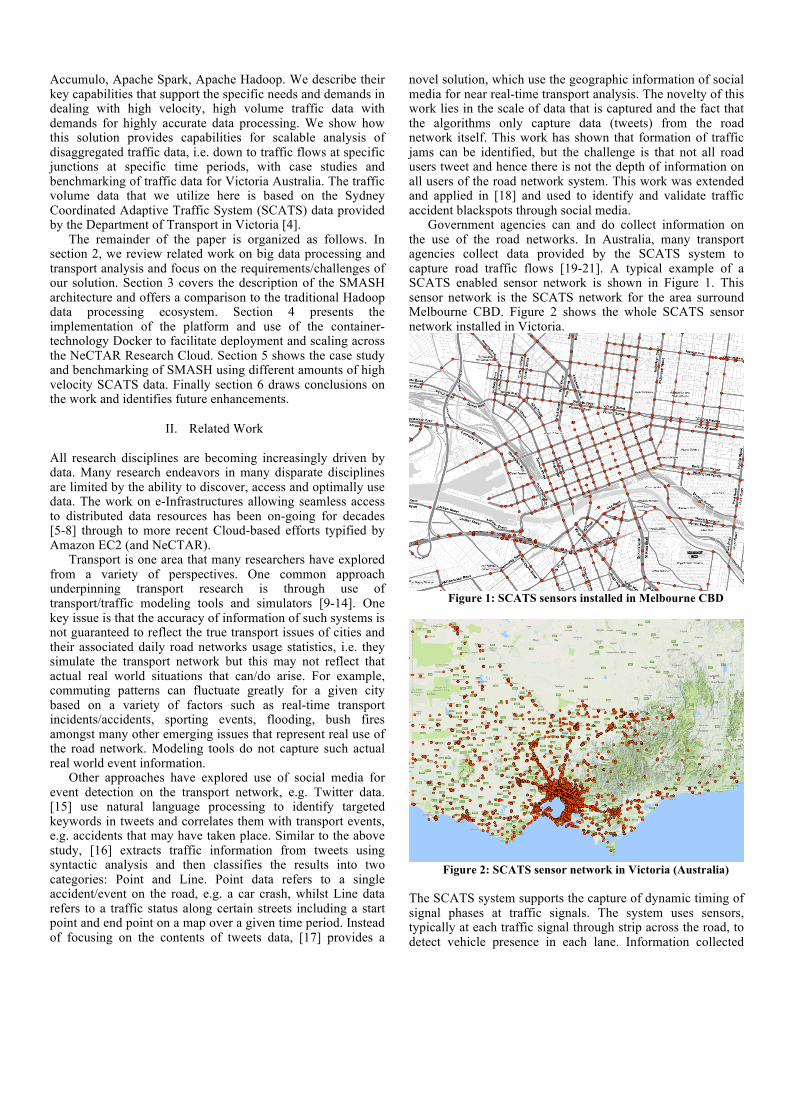
Government agencies can and do collect information on the use of the road networks. In Australia, many transport agencies collect data provided by the SCATS system to capture road traffic flows [19-21]. A typical example of a SCATS enabled sensor network is shown in Figure 1. This sensor network is the SCATS network for the area surround Melbourne CBD. Figure 2 shows the whole SCATS sensor network installed in Victoria.
Figure 1: SCATS sensors installed in Melbourne CBD
Figure 2: SCATS sensor network in Victoria (Australia)
The SCATS system supports the capture of dynamic timing of signal phases at traffic signals. The system uses sensors, typically at each traffic signal through strip across the road, to detect vehicle presence in each lane. Information collected
from vehicle sensors allows SCATS information (in principle) to be used to calculate and adjust the timing of traffic signals in the network for improving traffic throughput. A challenge with use of SCATS data is that they can be extremely large, e.g. data from a single intersection can include results on millions of cars that have passed over it. To tackle this, such data is often aggregated by time to provide statistics on the number of cars/lorries over given intersections, but such solutions do not lend themselves to real-time transport analysis and congestion identification. The real-time data processing demands scalable infrastructure and software to cope with the volume, velocity and veracity aspects of big traffic data.
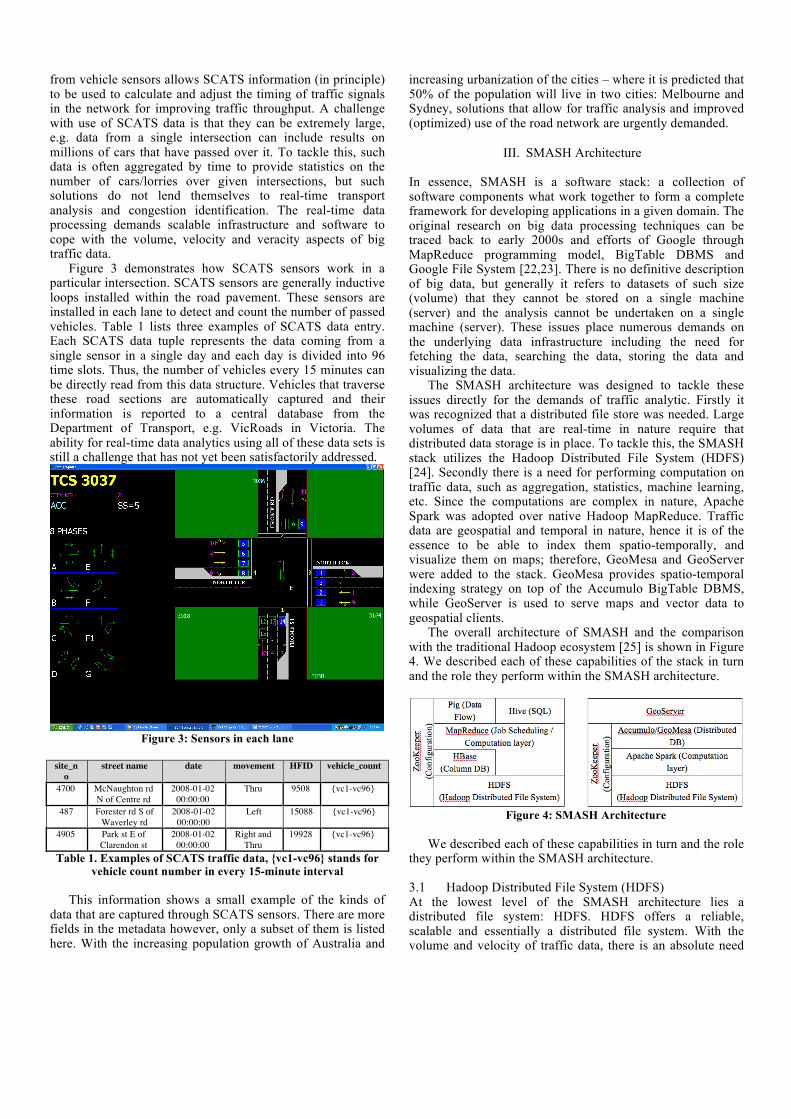
Figure 3 demonstrates how SCATS sensors work in a particular intersection. SCATS sensors are generally inductive loops installed within the road pavement. These sensors are installed in each lane to detect and count the number of passed vehicles. Table 1 lists three examples of SCATS data entry. Each SCATS data tuple represents the data coming from a single sensor in a single day and each day is divided into 96 time slots. Thus, the number of vehicles every 15 minutes can be directly read from this data structure. Vehicles that traverse these road sections are automatically captured and their information is reported to a central database from the Department of Transport, e.g. VicRoads in Victoria. The ability for real-time data analytics using all of these data sets is still a challenge that has not yet been satisfactorily addressed.
Figure 3: Sensors in each lane
site_n
o street name date movement HFID vehicle_count
4700 McNaughton rd N of Centre rd
2008-01-02 00:00:00
Thru 9508 {vc1-vc96}
487 Forester rd S of Waverley rd
2008-01-02 00:00:00
Left 15088 {vc1-vc96}
4905 Park st E of Clarendon st
2008-01-02 00:00:00
Right and Thru
19928 {vc1-vc96}
Table 1. Examples of SCATS traffic data, {vc1-vc96} stands for vehicle count number in every 15-minute interval
This information shows a small example of the kinds of
data that are captured through SCATS sensors. There are more fields in the metadata however, only a subset of them is listed here. With the increasing population growth of Australia and
increasing urbanization of the cities – where it is predicted that 50% of the population will live in two cities: Melbourne and Sydney, solutions that allow for traffic analysis and improved (optimized) use of the road network are urgently demanded.
III. SMASH Architecture
In essence, SMASH is a software stack: a collection of software components what work together to form a complete framework for developing applications in a given domain. The original research on big data processing techniques can be traced back to early 2000s and efforts of Google through MapReduce programming model, BigTable DBMS and Google File System [22,23]. There is no definitive description of big data, but generally it refers to datasets of such size (volume) that they cannot be stored on a single machine (server) and the analysis cannot be undertaken on a single machine (server). These issues place numerous demands on the underlying data infrastructure including the need for fetching the data, searching the data, storing the data and visualizing the data.
The SMASH architecture was designed to tackle these issues directly for the demands of traffic analytic. Firstly it was recognized that a distributed file store was needed. Large volumes of data that are real-time in nature require that distributed data storage is in place. To tackle this, the SMASH stack utilizes the Hadoop Distributed File System (HDFS) [24]. Secondly there is a need for performing computation on traffic data, such as aggregation, statistics, machine learning, etc. Since the computations are complex in nature, Apache Spark was adopted over native Hadoop MapReduce. Traffic data are geospatial and temporal in nature, hence it is of the essence to be able to index them spatio-temporally, and visualize them on maps; therefore, GeoMesa and GeoServer were added to the stack. GeoMesa provides spatio-temporal indexing strategy on top of the Accumulo BigTable DBMS, while GeoServer is used to serve maps and vector data to geospatial clients.
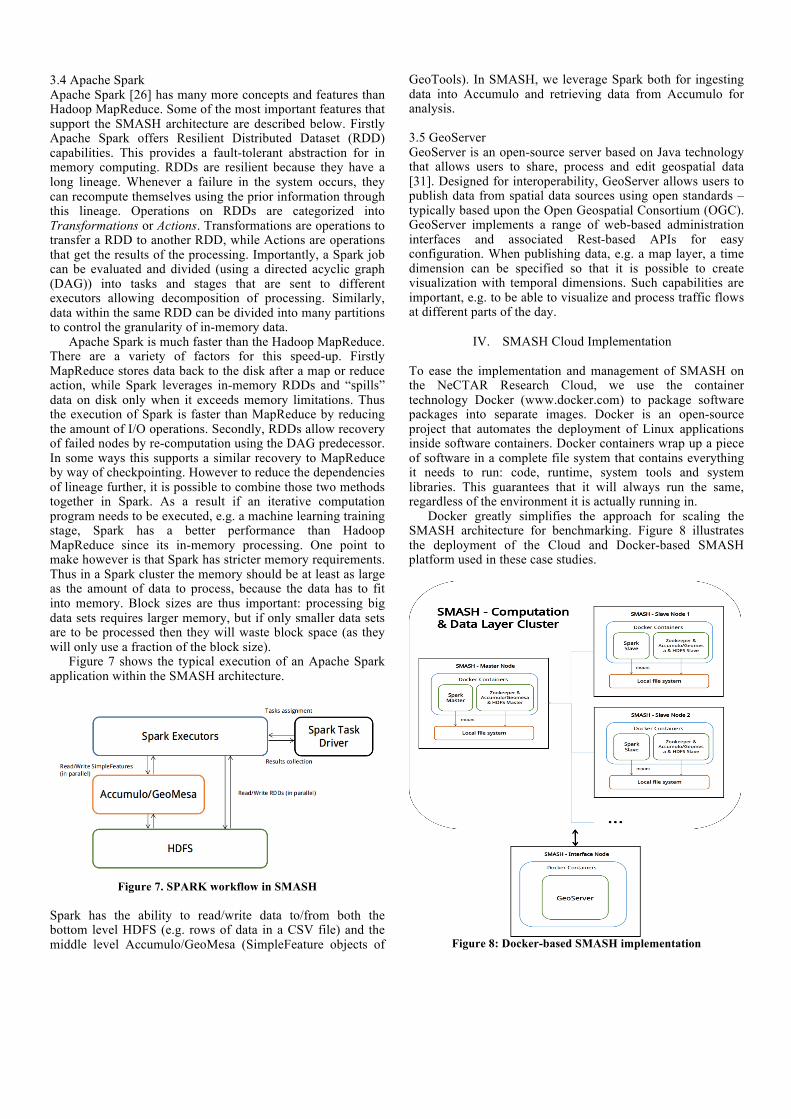
The overall architecture of SMASH and the comparison with the traditional Hadoop ecosystem [25] is shown in Figure 4. We described each of these capabilities of the stack in turn and the role they perform within the SMASH architecture.
Figure 4: SMASH Architecture
We described each of these capabilities in turn and the role
they perform within the SMASH architecture. 3.1 Hadoop Distributed File System (HDFS) At the lowest level of the SMASH architecture lies a distributed file system: HDFS. HDFS offers a reliable, scalable and essentially a distributed file system. With the volume and velocity of traffic data, there is an absolute need

to distribute the storage and access to the data. A single server cannot cope with large volumes of high velocity data hence spreading the ingestion of data and the subsequent storage across multiple servers is essential. A typical composition of a HDFS system is illustrated in Figure 5.
Figure 5: HDFS architecture
In HDFS, there essentially exists one namenode process and a set of datanode processes running on a group of machines. A namenode hosts the metadata of data chunks stored in the file system that indicate which datanode hosts which particular data chunk. HDFS chunks large files into small blocks (128 MB by default) then spreads and duplicates them across multiple machines (datanodes). HDFS components communicate with each other via TCP/IP sockets. HDFS also offers robust strategies to cope with single/multiple nodes failure. To tackle datanode failures, HDFS automatically replicates each data chunk to multiple datanodes according to Hadoop settings. Based on the replication settings of Hadoop, data can be guaranteed to be available should a given datanode fail. To tackle namenode failures, HDFS offers a secondary-namenode, which can be launched on a different machine to the namenode server. This component acts as a live backup of namenode and can take the place of a given namenode in case of a given namenode failure.
A core service provided by HDFS for data processing is MapReduce. MapReduce provides a common way to handle the processing of large amounts of data based on the idea of divide and conquer. A MapReduce job typically involves splitting an input dataset into independent data chunks, which can then be processed by the map tasks in parallel. This model of distributing the processing activities to separate servers means that it is highly scalable and hence suited to Cloud-like environments where more servers can be added on demand. The MapReduce framework normally involves a master JobTracker and one slave TaskTracker per node. The master is responsible for scheduling and monitoring slave tasks. A typical dataflow of MapReduce is shown in Figure 6.
The Hadoop MapReduce framework allows processing large amounts of data in parallel across a cluster of servers. It has been developed and applied as a mature technique for many years.
More recently Apache Spark is a new-generation, fast engine for large-scale data processing [26]. It offers improved performance over MapReduce through in memory data processing. We have included Apache Spark into the SMASH
architecture.
Figure 6: MapReduce model
3.2 ZooKeeper In setting up the SMASH software stack, capturing the detailed configuration information for the various software systems and tools is essential. Configuration, especially in distributed environments involving multiple systems and services, can require a lot of work to set up, update and manage. A wrong configuration can adversely impact upon performance and lead to unreliable systems. ZooKeeper is the most commonly used tool used to manage configuration information in the SMASH software stack [28].
ZooKeeper offers replicated synchronization services with eventual consistency offered for the tools and their configurations. It provides degrees of robustness by migrating multiple nodes as ensembles where clients can connect to any of them to get their associated configuration information. As long as the majority of nodes are working, the ensemble of ZooKeeper nodes is kept alive. This means that a master node can be dynamically chosen by consensus within the ensemble. If the master node fails, the role of the master can automatically migrate to another node. 3.3 Apache Accumulo/GeoMesa Accumulo is a sorted, distributed key/value data store that provides robust, scalable, high performance service [29]. It was inspired by the BigTable technology from Google, but has improved over time with the introduction of cell-based access control and server-side programming mechanisms that can be used to modify key/value pairs at various points in the data management process. Accumulo is one of the most popular NoSQL databases currently available.
GeoMesa is an open-source, distributed, spatio-temporal index built on top of the Accumulo column family store [30]. Leveraging a highly parallelized indexing strategy, GeoMesa aims to provide high levels of spatial querying and data manipulation. GeoMesa is capable of ingesting, indexing and querying billions of geometrical features. It is integrated into the GeoTools open-source library and can act as a data source for GeoServer by the use of bespoke plug-ins. GeoMesa implements an indexing strategy using a geo-hashing algorithm (three-dimensional Z-order curve), which combines three dimensions of traffic information (latitude, longitude and time) into a single dimension lexicographic key space in Accumulo.
3.4 Apache Spark Apache Spark [26] has many more concepts and features than Hadoop MapReduce. Some of the most important features that support the SMASH architecture are described below. Firstly Apache Spark offers Resilient Distributed Dataset (RDD) capabilities. This provides a fault-tolerant abstraction for in memory computing. RDDs are resilient because they have a long lineage. Whenever a failure in the system occurs, they can recompute themselves using the prior information through this lineage. Operations on RDDs are categorized into Transformations or Actions. Transformations are operations to transfer a RDD to another RDD, while Actions are operations that get the results of the processing. Importantly, a Spark job can be evaluated and divided (using a directed acyclic graph (DAG)) into tasks and stages that are sent to different executors allowing decomposition of processing. Similarly, data within the same RDD can be divided into many partitions to control the granularity of in-memory data.
Apache Spark is much faster than the Hadoop MapReduce. There are a variety of factors for this speed-up. Firstly MapReduce stores data back to the disk after a map or reduce action, while Spark leverages in-memory RDDs and “spills” data on disk only when it exceeds memory limitations. Thus the execution of Spark is faster than MapReduce by reducing the amount of I/O operations. Secondly, RDDs allow recovery of failed nodes by re-computation using the DAG predecessor. In some ways this supports a similar recovery to MapReduce by way of checkpointing. However to reduce the dependencies of lineage further, it is possible to combine those two methods together in Spark. As a result if an iterative computation program needs to be executed, e.g. a machine learning training stage, Spark has a better performance than Hadoop MapReduce since its in-memory processing. One point to make however is that Spark has stricter memory requirements. Thus in a Spark cluster the memory should be at least as large as the amount of data to process, because the data has to fit into memory. Block sizes are thus important: processing big data sets requires larger memory, but if only smaller data sets are to be processed then they will waste block space (as they will only use a fraction of the block size).
Figure 7 shows the typical execution of an Apache Spark application within the SMASH architecture.
Figure 7. SPARK workflow in SMASH
Spark has the ability to read/write data to/from both the bottom level HDFS (e.g. rows of data in a CSV file) and the middle level Accumulo/GeoMesa (SimpleFeature objects of
GeoTools). In SMASH, we leverage Spark both for ingesting data into Accumulo and retrieving data from Accumulo for analysis. 3.5 GeoServer GeoServer is an open-source server based on Java technology that allows users to share, process and edit geospatial data [31]. Designed for interoperability, GeoServer allows users to publish data from spatial data sources using open standards – typically based upon the Open Geospatial Consortium (OGC). GeoServer implements a range of web-based administration interfaces and associated Rest-based APIs for easy configuration. When publishing data, e.g. a map layer, a time dimension can be specified so that it is possible to create visualization with temporal dimensions. Such capabilities are important, e.g. to be able to visualize and process traffic flows at different parts of the day.
IV. SMASH Cloud Implementation To ease the implementation and management of SMASH on the NeCTAR Research Cloud, we use the container technology Docker (www.docker.com) to package software packages into separate images. Docker is an open-source project that automates the deployment of Linux applications inside software containers. Docker containers wrap up a piece of software in a complete file system that contains everything it needs to run: code, runtime, system tools and system libraries. This guarantees that it will always run the same, regardless of the environment it is actually running in.
Docker greatly simplifies the approach for scaling the SMASH architecture for benchmarking. Figure 8 illustrates the deployment of the Cloud and Docker-based SMASH platform used in these case studies.
Figure 8: Docker-based SMASH implementation
In Figure 8, the SMASH master node and (potentially) multiple slave nodes form the computation and data layers of SMASH. Components of these two layers run inside Docker containers. The local-file-system directory of the Cloud-based virtual machines (VMs) is mounted to those containers to host the HDFS data and snapshot information required for Zookeeper. The benefit of this approach is that the (containerized) SMASH components are free to be removed and/or upgraded without losing data or any previous system status. This separates the application and any essential data required at the system level. As long as those mounted directories are available, it is directly possible to recover a SMASH node with its most recent and up-to-date status.
A single node of GeoServer runs at the service level of SMASH. A GeoMesa run-time plugin is installed within this server so that it can serve the geographic information that is produced by the computation layer and stored in the data layer. This is the endpoint for data visualization. It is noted that researchers are free to build their own required views and publish it on GeoServer.
V. Benchmarking A SMASH cluster was deployed on the National eResearch Collaboration Tools and Resources (NeCTAR) Research Cloud. The whole SMASH software stack was deployed and run inside Docker instances on a range of Virtual Machines on the NeCTAR Research Cloud. To benchmark the performance we used a range of data sizes (from 1Gb through to 70Gb of SCATS data) and a different number of NeCTAR nodes, Specifically, the resources that were utilized included a master node (VM) with four CPUs offering 2600MHz + 512KB cache and 12GB RAM with 80GB attached storage (for HDFS). The slave nodes (VMs) each had two CPUs offering 2600MHz + 512KB cache with 8GB RAM and 60GB storage (for HDFS). All of the VMs were built using Ubuntu 16.04 LTS (Linux Kernel Version: 4.4.0-21-generic). All nodes were connected with a 10Gb backbone network. Docker version 1.11.2 was used and all containers were run in host mode.
With regards to the SMASH software stack, Spark v2.0.0 was used. Memory usage was limited to 4GB per worker to avoid issues with Accumulo during heavy data processing activities. The latest SMASH software stack includes Accumulo v1.6.5, GeoMesa v1.2.3, ZooKeeper v3.4.8, Hadoop v2.6.4 with data replication set to 2. All of the Spark tasks for benchmarking used the same resource allocation in Spark-submit with driver-memory of 3GB and executor-memory of 4GB.
With this infrastructure in place, the SMASH benchmarking undertaken focused on data ingestion and data aggregation and the impact on data sizes and nodes used for data processing. 5.1 Benchmark Data Ingestion In this case study, we explored the use of SMASH to ingest SCATS data into GeoMesa/Accumulo. Raw SCATS data was stored as two tables in two CSV files. A volume-table dataset containing the vehicle volumes from every sensor over given
time periods together with the sensor ID and date was used. The sensor-table dataset contains the sensor ID with its geo-information and sensor details. The sensor-table acts as a reference to the volume-table. The size of the volume-table (CSV file) can be huge and depends on the historic amount of SCATS data that has been collected. When importing SCATS data into GeoMesa/Accumulo, the ingesting work involves joining two major tables (using the sensor ID as the joint key) in plan text file and importing the result-table into Accumulo as indexed geospatial data. The size of each sensor-table (CSV file) was 5.3GB.
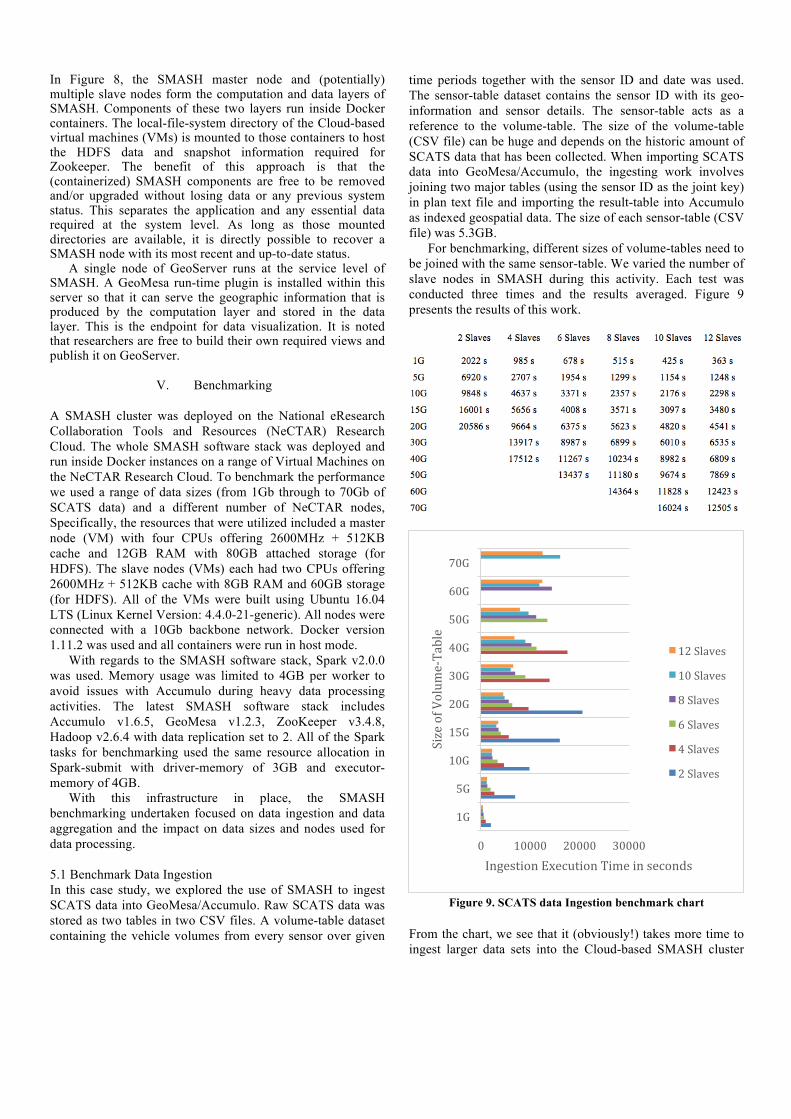
For benchmarking, different sizes of volume-tables need to be joined with the same sensor-table. We varied the number of slave nodes in SMASH during this activity. Each test was conducted three times and the results averaged. Figure 9 presents the results of this work.
Figure 9. SCATS data Ingestion benchmark chart
From the chart, we see that it (obviously!) takes more time to ingest larger data sets into the Cloud-based SMASH cluster
0 10000 20000 30000
1G
5G
10G
15G
20G
30G
40G
50G
60G
70G
IngestionExecutionTimeinseconds
SizeofVolum
e-Table
12Slaves
10Slaves
8Slaves
6Slaves
4Slaves
2Slaves
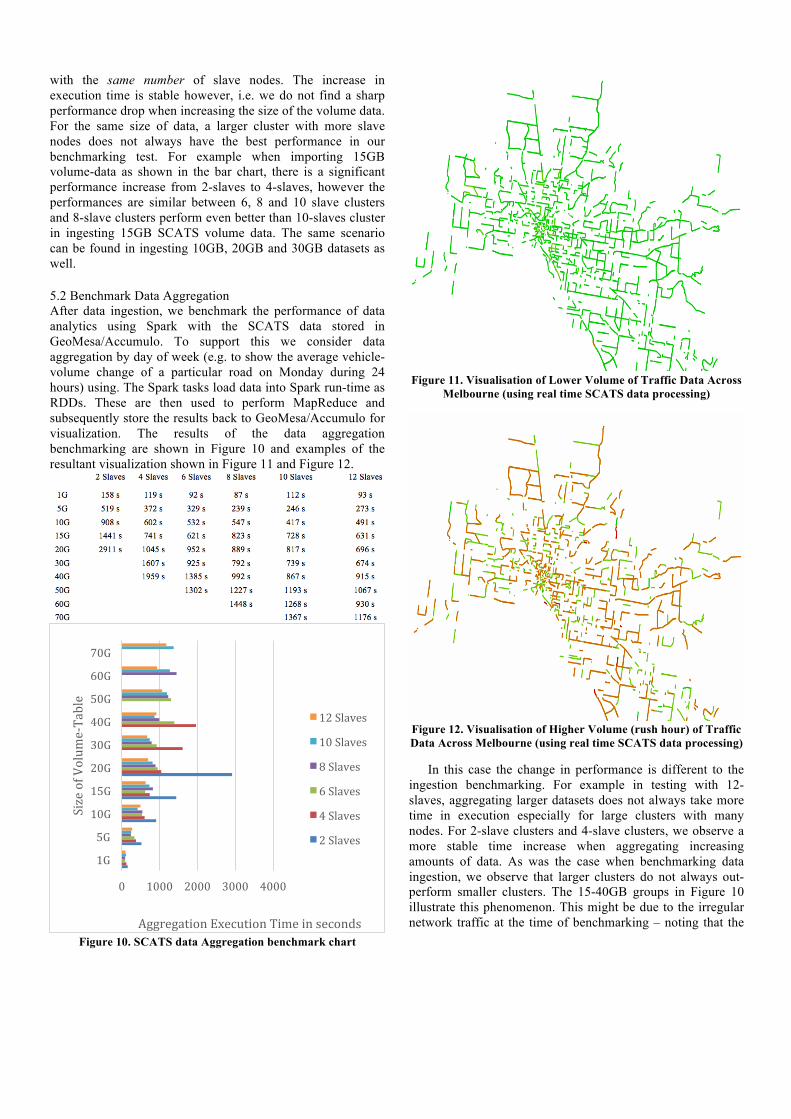
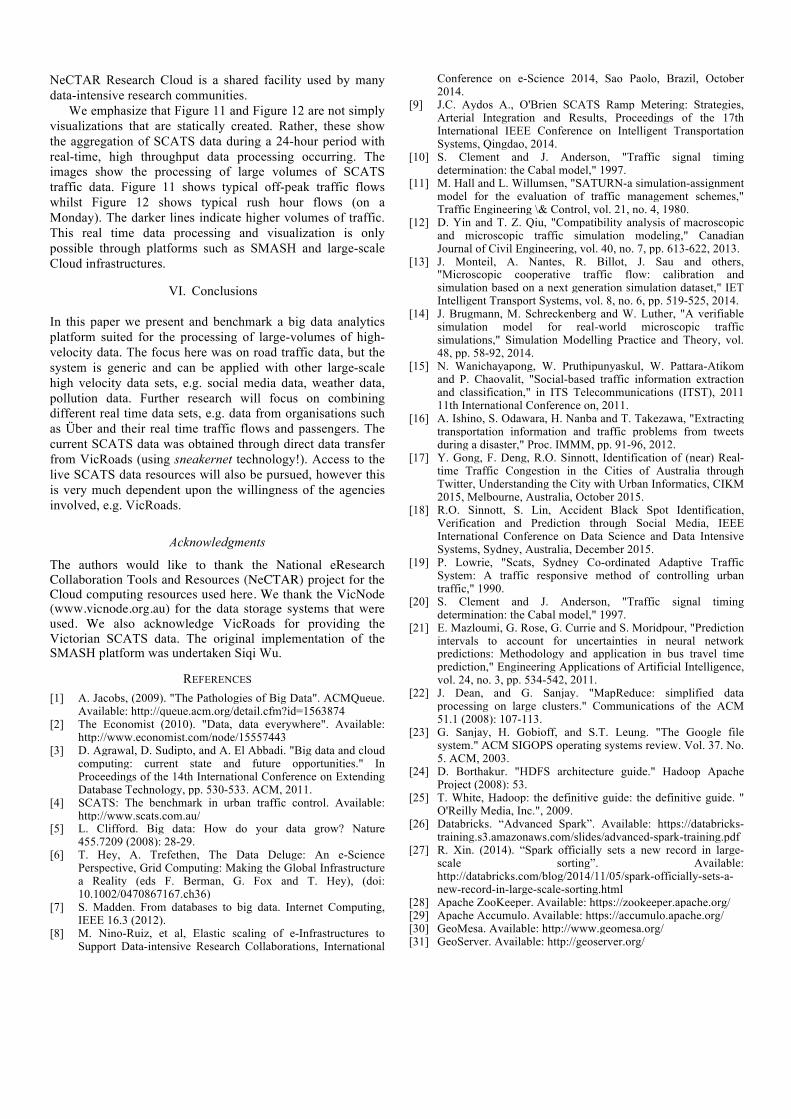
with the same number of slave nodes. The increase in execution time is stable however, i.e. we do not find a sharp performance drop when increasing the size of the volume data. For the same size of data, a larger cluster with more slave nodes does not always have the best performance in our benchmarking test. For example when importing 15GB volume-data as shown in the bar chart, there is a significant performance increase from 2-slaves to 4-slaves, however the performances are similar between 6, 8 and 10 slave clusters and 8-slave clusters perform even better than 10-slaves cluster in ingesting 15GB SCATS volume data. The same scenario can be found in ingesting 10GB, 20GB and 30GB datasets as well. 5.2 Benchmark Data Aggregation After data ingestion, we benchmark the performance of data analytics using Spark with the SCATS data stored in GeoMesa/Accumulo. To support this we consider data aggregation by day of week (e.g. to show the average vehicle-volume change of a particular road on Monday during 24 hours) using. The Spark tasks load data into Spark run-time as RDDs. These are then used to perform MapReduce and subsequently store the results back to GeoMesa/Accumulo for visualization. The results of the data aggregation benchmarking are shown in Figure 10 and examples of the resultant visualization shown in Figure 11 and Figure 12.
Figure 10. SCATS data Aggregation benchmark chart
Figure 11. Visualisation of Lower Volume of Traffic Data Across
Melbourne (using real time SCATS data processing)
Figure 12. Visualisation of Higher Volume (rush hour) of Traffic Data Across Melbourne (using real time SCATS data processing)
In this case the change in performance is different to the
ingestion benchmarking. For example in testing with 12-slaves, aggregating larger datasets does not always take more time in execution especially for large clusters with many nodes. For 2-slave clusters and 4-slave clusters, we observe a more stable time increase when aggregating increasing amounts of data. As was the case when benchmarking data ingestion, we observe that larger clusters do not always out-perform smaller clusters. The 15-40GB groups in Figure 10 illustrate this phenomenon. This might be due to the irregular network traffic at the time of benchmarking – noting that the
0 1000 2000 3000 4000
1G
5G
10G
15G
20G
30G
40G
50G
60G
70G
AggregationExecutionTimeinseconds
SizeofVolum
e-Table
12Slaves
10Slaves
8Slaves
6Slaves
4Slaves
2Slaves
NeCTAR Research Cloud is a shared facility used by many data-intensive research communities.
We emphasize that Figure 11 and Figure 12 are not simply visualizations that are statically created. Rather, these show the aggregation of SCATS data during a 24-hour period with real-time, high throughput data processing occurring. The images show the processing of large volumes of SCATS traffic data. Figure 11 shows typical off-peak traffic flows whilst Figure 12 shows typical rush hour flows (on a Monday). The darker lines indicate higher volumes of traffic. This real time data processing and visualization is only possible through platforms such as SMASH and large-scale Cloud infrastructures.
VI. Conclusions
In this paper we present and benchmark a big data analytics platform suited for the processing of large-volumes of high-velocity data. The focus here was on road traffic data, but the system is generic and can be applied with other large-scale high velocity data sets, e.g. social media data, weather data, pollution data. Further research will focus on combining different real time data sets, e.g. data from organisations such as Über and their real time traffic flows and passengers. The current SCATS data was obtained through direct data transfer from VicRoads (using sneakernet technology!). Access to the live SCATS data resources will also be pursued, however this is very much dependent upon the willingness of the agencies involved, e.g. VicRoads.
Acknowledgments
The authors would like to thank the National eResearch Collaboration Tools and Resources (NeCTAR) project for the Cloud computing resources used here. We thank the VicNode (www.vicnode.org.au) for the data storage systems that were used. We also acknowledge VicRoads for providing the Victorian SCATS data. The original implementation of the SMASH platform was undertaken Siqi Wu.
REFERENCES [1] A. Jacobs, (2009). "The Pathologies of Big Data". ACMQueue.
Available: http://queue.acm.org/detail.cfm?id=1563874 [2] The Economist (2010). "Data, data everywhere". Available:
http://www.economist.com/node/15557443 [3] D. Agrawal, D. Sudipto, and A. El Abbadi. "Big data and cloud
computing: current state and future opportunities." In Proceedings of the 14th International Conference on Extending Database Technology, pp. 530-533. ACM, 2011.
[4] SCATS: The benchmark in urban traffic control. Available: http://www.scats.com.au/
[5] L. Clifford. Big data: How do your data grow? Nature 455.7209 (2008): 28-29.
[6] T. Hey, A. Trefethen, The Data Deluge: An e-Science Perspective, Grid Computing: Making the Global Infrastructure a Reality (eds F. Berman, G. Fox and T. Hey), (doi: 10.1002/0470867167.ch36)
[7] S. Madden. From databases to big data. Internet Computing, IEEE 16.3 (2012).
[8] M. Nino-Ruiz, et al, Elastic scaling of e-Infrastructures to Support Data-intensive Research Collaborations, International
Conference on e-Science 2014, Sao Paolo, Brazil, October 2014.
[9] J.C. Aydos A., O'Brien SCATS Ramp Metering: Strategies, Arterial Integration and Results, Proceedings of the 17th International IEEE Conference on Intelligent Transportation Systems, Qingdao, 2014.
[10] S. Clement and J. Anderson, "Traffic signal timing determination: the Cabal model," 1997.
[11] M. Hall and L. Willumsen, "SATURN-a simulation-assignment model for the evaluation of traffic management schemes," Traffic Engineering \& Control, vol. 21, no. 4, 1980.
[12] D. Yin and T. Z. Qiu, "Compatibility analysis of macroscopic and microscopic traffic simulation modeling," Canadian Journal of Civil Engineering, vol. 40, no. 7, pp. 613-622, 2013.
[13] J. Monteil, A. Nantes, R. Billot, J. Sau and others, "Microscopic cooperative traffic flow: calibration and simulation based on a next generation simulation dataset," IET Intelligent Transport Systems, vol. 8, no. 6, pp. 519-525, 2014.
[14] J. Brugmann, M. Schreckenberg and W. Luther, "A verifiable simulation model for real-world microscopic traffic simulations," Simulation Modelling Practice and Theory, vol. 48, pp. 58-92, 2014.
[15] N. Wanichayapong, W. Pruthipunyaskul, W. Pattara-Atikom and P. Chaovalit, "Social-based traffic information extraction and classification," in ITS Telecommunications (ITST), 2011 11th International Conference on, 2011.
[16] A. Ishino, S. Odawara, H. Nanba and T. Takezawa, "Extracting transportation information and traffic problems from tweets during a disaster," Proc. IMMM, pp. 91-96, 2012.
[17] Y. Gong, F. Deng, R.O. Sinnott, Identification of (near) Real-time Traffic Congestion in the Cities of Australia through Twitter, Understanding the City with Urban Informatics, CIKM 2015, Melbourne, Australia, October 2015.
[18] R.O. Sinnott, S. Lin, Accident Black Spot Identification, Verification and Prediction through Social Media, IEEE International Conference on Data Science and Data Intensive Systems, Sydney, Australia, December 2015.
[19] P. Lowrie, "Scats, Sydney Co-ordinated Adaptive Traffic System: A traffic responsive method of controlling urban traffic," 1990.
[20] S. Clement and J. Anderson, "Traffic signal timing determination: the Cabal model," 1997.
[21] E. Mazloumi, G. Rose, G. Currie and S. Moridpour, "Prediction intervals to account for uncertainties in neural network predictions: Methodology and application in bus travel time prediction," Engineering Applications of Artificial Intelligence, vol. 24, no. 3, pp. 534-542, 2011.
[22] J. Dean, and G. Sanjay. "MapReduce: simplified data processing on large clusters." Communications of the ACM 51.1 (2008): 107-113.
[23] G. Sanjay, H. Gobioff, and S.T. Leung. "The Google file system." ACM SIGOPS operating systems review. Vol. 37. No. 5. ACM, 2003.
[24] D. Borthakur. "HDFS architecture guide." Hadoop Apache Project (2008): 53.
[25] T. White, Hadoop: the definitive guide: the definitive guide. " O'Reilly Media, Inc.", 2009.
[26] Databricks. “Advanced Spark”. Available: https://databricks-training.s3.amazonaws.com/slides/advanced-spark-training.pdf
[27] R. Xin. (2014). “Spark officially sets a new record in large-scale sorting”. Available: http://databricks.com/blog/2014/11/05/spark-officially-sets-a-new-record-in-large-scale-sorting.html
[28] Apache ZooKeeper. Available: https://zookeeper.apache.org/ [29] Apache Accumulo. Available: https://accumulo.apache.org/ [30] GeoMesa. Available: http://www.geomesa.org/ [31] GeoServer. Available: http://geoserver.org/