Embed Size (px)
Citation preview


The Demographics of Innovation

The Demographics ofInnovation
Why Demographics is a Key to theInnovation Race
JAMES LIANG
This edition first published 2018 2018 James Liang
Registered officeJohn Wiley & Sons Ltd, The Atrium, Southern Gate, Chichester, West Sussex, PO19 8SQ,United Kingdom
For details of our global editorial offices, for customer services and for information about howto apply for permission to reuse the copyright material in this book please see our website atwww.wiley.com.
All rights reserved. No part of this publication may be reproduced, stored in a retrieval system, ortransmitted, in any form or by any means, electronic, mechanical, photocopying, recording orotherwise, except as permitted by the UK Copyright, Designs and Patents Act 1988, without theprior permission of the publisher.
Wiley publishes in a variety of print and electronic formats and by print-on-demand. Somematerial included with standard print versions of this book may not be included in e-books or inprint-on-demand. If this book refers to media such as a CD or DVD that is not included in theversion you purchased, you may download this material at http://booksupport.wiley.com. Formore information about Wiley products, visit www.wiley.com.
Designations used by companies to distinguish their products are often claimed as trademarks.All brand names and product names used in this book are trade names, service marks,trademarks or registered trademarks of their respective owners. The publisher is not associatedwith any product or vendor mentioned in this book.
Limit of Liability/Disclaimer of Warranty: While the publisher and author have used their bestefforts in preparing this book, they make no representations or warranties with respect to theaccuracy or completeness of the contents of this book and specifically disclaim any impliedwarranties of merchantability or fitness for a particular purpose. It is sold on the understandingthat the publisher is not engaged in rendering professional services and neither the publisher northe author shall be liable for damages arising herefrom. If professional advice or other expertassistance is required, the services of a competent professional should be sought.
Library of Congress Cataloging-in-Publication Data
Names: Liang, James Jianzhang, author.Title: The demographics of innovation : why demographics is a key to the
innovation race / James Jianzhang Liang.Description: Hoboken : Wiley, 2018. | Includes bibliographical references and index. |Identifiers: LCCN 2017044554 (print) | LCCN 2017051971 (ebook) | ISBN
9781119408932 (pdf) | ISBN 9781119408949 (epub) | ISBN 9781119408925(hardback) | ISBN 9781119408932 (ePDF) | ISBN 9781119408963 (e-bk)
Subjects: LCSH: Technological innovations–Economic aspects. |Population–Economic aspects. | BISAC: BUSINESS & ECONOMICS / Banks &Banking.
Classification: LCC HC79.T4 (ebook) | LCC HC79.T4 L5345 2018 (print) | DDC338/.064–dc23
LC record available at https://lccn.loc.gov/2017044554
A catalogue record for this book is available from the British Library.
ISBN 978-1-119-40892-5 (hardcover) ISBN 978-1-119-40893-2 (ePDF)ISBN 978-1-119-40894-9 (ePub) ISBN 978-1-119-40896-3 (obook)
10 9 8 7 6 5 4 3 2 1
Cover design: CtripCover images: Leaves image: Teia/Shutterstock; People image: Leremy/Shutterstock
Set in 10/12 pt ITCGaramondStd-Lt by Thomson Digital, Noida, IndiaPrinted in Great Britain by TJ International Ltd, Padstow, Cornwall, UK
Contents
Acknowledgments vii
About the Author ix
Introduction xi
PART I THEORY AND POLICY 1
CHAPTER 1 Global Demographic Trends 3
CHAPTER 2 Demographics and Innovation 21
CHAPTER 3 Demographics and the Economy 63
CHAPTER 4 Resource and Environment 85
CHAPTER 5 Public Policy 107
PART II THE RACE OF INNOVATION 133
CHAPTER 6 Japan 135
CHAPTER 7 China 149
CHAPTER 8 The United States of America 173
CHAPTER 9 Europe 191
CHAPTER 10 India 209
Conclusion 225
Epilogue: Historical Competition Among Civilizations: An Essayon Transportation Technology, Demographics and the Race of Innovation 229
References 233
Index 235
v


Acknowledgments
First, and most importantly, I am very grateful to my advisor, Edward Lazear,who first introduced me to the field of labor economics at Stanford; special
thanks also go to the late Gary Becker, who encouraged me to work on thistopic during my postdoctoral study under his guidance at the University ofChicago. I benefited immensely from the collaboration with my fellowresearchers, Wenzheng Huang and Hui Wang, who co-authored many articleswith me on this topic. I am grateful to my research and executive assistants,ZhengYu Fang, Xiaomeng Xu, and Xinxin Wang, who helped with datagathering and analysis, and also to my friends, Wei Gu and Ted Fishman,who gave thoughtful feedback throughout the process.
vii

About the Author
James Liang is both a prominent business leader and an accomplishedeconomist. He is the co-founder and Executive Chairman of the Board of Ctrip.com (NASDAQ: CTRP), the largest online travel company in the world in grossmerchandising volume in 2016, and the largest online travel company in Chinasince 2003. Dr. Liang also served as Chief Executive Officer from 2000 to 2006and from 2013 to 2016.
Dr. Liang is a Research Professor in Economics at Peking University. Hereceived a PhD in Economics from Stanford University in 2011. He publishesacademic papers in top economics journals (such as The Quarterly Journal ofEconomics and the Journal of Political Economy) on a broad range of laboreconomic topics such as demographics, innovation, entrepreneurship, andproductivity. He has also written extensively on policies related to demographics and innovation. He is the author of China Needs More Babies, the firstbook published in mainland China that criticizes the “one-child policy.”
Prior to Ctrip.com, Dr. Liang held a number of technical and managerialpositions with Oracle Corporation from 1991 to 1999 in the United States andChina, including Head of the ERP Consulting Division of Oracle China from1997 to 1999. He received his master’s and bachelor’s degrees from GeorgiaInstitute of Technology. He also attended the “China Gifted Youth Class” atFudan University at the age of 15.
ix

Introduction
Since the Industrial Revolution, human society has undergone tremendouseconomic and social change. Economically, average per capita income
grew more than 10 times, and people in developed countries are 100 timeswealthier than they were 200 years ago. Historically, innovation has alwaysbeen the driving force for economic development, but it is only recently thattechnology companies have become the main engine of wealth generation. In2011, Apple overtook Exxon, an oil producer, to become the most valuablecompany in the world. In 2015, five of the top 10 most valuable companieswere technology companies founded in the last 40 years. The Chinese Internetgiant Alibaba.com is now the most valuable company in China, with overUS$250 billion in market capitalization, and is ranked only after the big fiveU.S. technology companies.
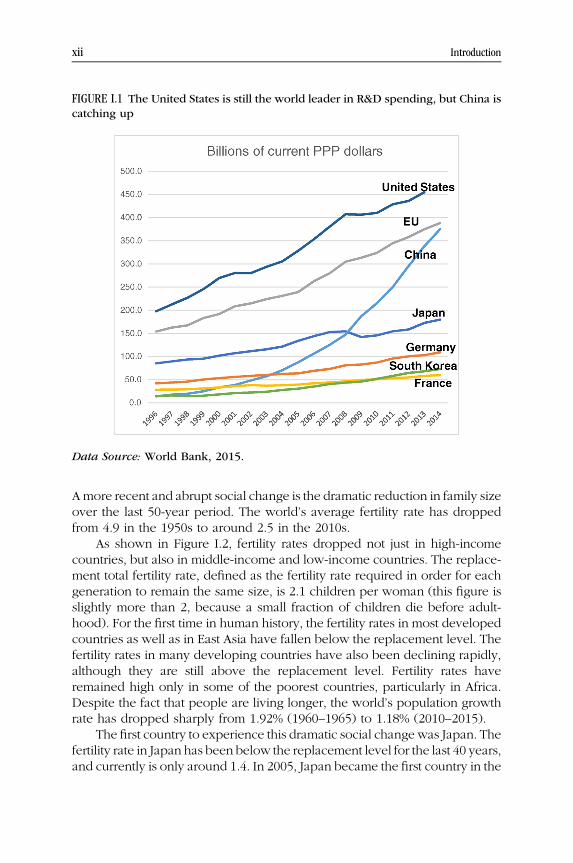
Equally dramatic has been the rise of China over the last 40 years. Chinahas transformed from a backward country to the second largest economyand the largest exporter in the world. Much more significantly, China iscatching up as a hotbed of innovation, even more quickly than its nearmiraculous emergence as a dominant exporter a few decades ago. China’soverall spending on research and development is growing at 15% a year(Figure I.1). This is much faster than its GDP growth. China already spendsmore on research and development than all the European countries combined, and will outspend the United States by 2020 on a purchasing powerparity (PPP) basis. Wealthy, developed nations such as the United States,Japan, as well as many of the European countries are naturally concernedwhether they can continue to reign supreme in the race of innovation that is setto shape the twenty-first century. These established players are all striving touncover what the best strategies for competing with emerging innovationpowerhouses like China and India are. For technology companies, the keysuccess factor is human resources; analogously, it is the view of this book thatdemographics, more than any other factor, is the ultimate determinant ofsuccess in innovation. This view has huge policy implications in areas such aseducation, immigration, as well as social policies such as, for example, supportoffered to growing families.
The largest social change of the last 100 years is in demographics. First,people today live longer lives. In the last 200 years, life expectancy indeveloped countries has doubled from 40 to 80 years and is still increasing.
xi
xii Introduction
FIGURE I.1 The United States is still the world leader in R&D spending, but China iscatching up
Data Source: World Bank, 2015.
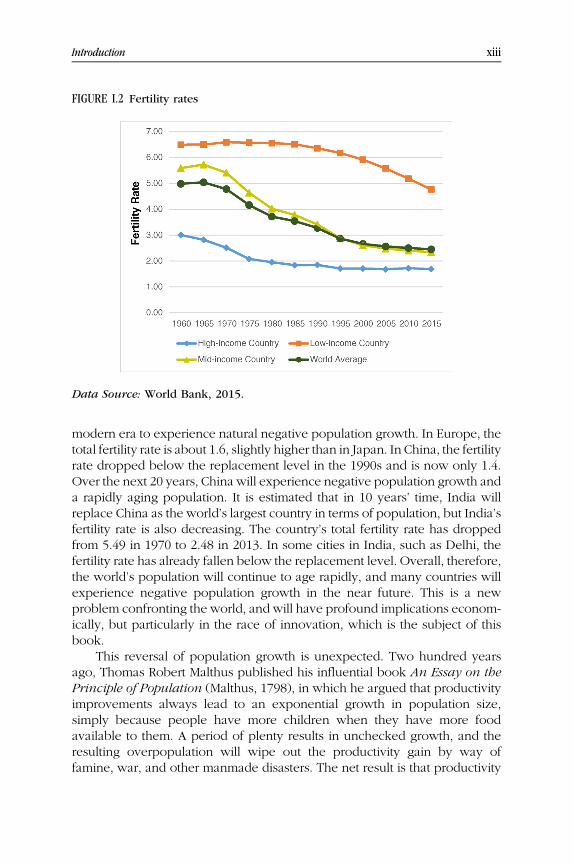
A more recent and abrupt social change is the dramatic reduction in family sizeover the last 50-year period. The world’s average fertility rate has droppedfrom 4.9 in the 1950s to around 2.5 in the 2010s.
As shown in Figure I.2, fertility rates dropped not just in high-incomecountries, but also in middle-income and low-income countries. The replacement total fertility rate, defined as the fertility rate required in order for eachgeneration to remain the same size, is 2.1 children per woman (this figure isslightly more than 2, because a small fraction of children die before adulthood). For the first time in human history, the fertility rates in most developedcountries as well as in East Asia have fallen below the replacement level. Thefertility rates in many developing countries have also been declining rapidly,although they are still above the replacement level. Fertility rates haveremained high only in some of the poorest countries, particularly in Africa.Despite the fact that people are living longer, the world’s population growthrate has dropped sharply from 1.92% (1960–1965) to 1.18% (2010–2015).
The first country to experience this dramatic social change was Japan. Thefertility rate in Japan has been below the replacement level for the last 40 years,and currently is only around 1.4. In 2005, Japan became the first country in the
Introduction xiii
FIGURE I.2 Fertility rates
Data Source: World Bank, 2015.
modern era to experience natural negative population growth. In Europe, thetotal fertility rate is about 1.6, slightly higher than in Japan. In China, the fertilityrate dropped below the replacement level in the 1990s and is now only 1.4.Over the next 20 years, China will experience negative population growth anda rapidly aging population. It is estimated that in 10 years’ time, India willreplace China as the world’s largest country in terms of population, but India’sfertility rate is also decreasing. The country’s total fertility rate has droppedfrom 5.49 in 1970 to 2.48 in 2013. In some cities in India, such as Delhi, thefertility rate has already fallen below the replacement level. Overall, therefore,the world’s population will continue to age rapidly, and many countries willexperience negative population growth in the near future. This is a newproblem confronting the world, and will have profound implications economically, but particularly in the race of innovation, which is the subject of thisbook.
This reversal of population growth is unexpected. Two hundred yearsago, Thomas Robert Malthus published his influential book An Essay on thePrinciple of Population (Malthus, 1798), in which he argued that productivityimprovements always lead to an exponential growth in population size,simply because people have more children when they have more foodavailable to them. A period of plenty results in unchecked growth, and theresulting overpopulation will wipe out the productivity gain by way offamine, war, and other manmade disasters. The net result is that productivity
xiv Introduction
improvement will only lead to growth in population but not in per capitaincome. Malthus’ ideas have very stubbornly retained currency, perhapsbecause examples of population fluctuation have been so well documentedin the natural world. In 1972, for example, a report entitled The Limits toGrowth by the Club of Rome predicted that a population explosion would leadto energy depletion and resource exhaustion in the subsequent decades.
These predictions have all been proven wrong. Over the last 200 years,both human productivity and population growth have increased. At the sametime, natural resources have not run out, as alternative resources and energysources have been developed. In fact, the price of natural resources hasremained relatively stable, and the value of natural resources relative to otherassets has declined rapidly. In addition, most developed countries, followingthe initial stage of swift industrial development, have solved or made significant steps in solving the problems of environmental pollution—once thoughtto be another potentially disastrous outcome of industrial growth.
Surprisingly, human society has encountered a situation that seems to becompletely opposite to what Malthusian economists predicted. In recentdecades, as a result of increased urbanization, industrialization, and resultingaffluence, people have started to have fewer children. This new demographicscenario has created a different set of social problems, such as labor shortages,aging populations, and a decline of economic dynamism.
There are, of course, many reasons why people choose to have fewerchildren. The main ones seem to be: a significant increase in the level ofwomen’s education, as well as their labor participation; the rising cost ofraising children; the reduction in the need for children to directly support theirparents in old age; and a modern lifestyle that focuses on individual fulfillment,which itself often competes with the time and effort required to raise children.These topics will be elaborated on in Chapter 1.
How will this unprecedented demographic development affect the globaleconomy (or economies) and society as a whole? Research on the impact ofdepopulation and aging is very limited, partly because this is a very newphenomenon. The mainstream economic view is that aging is mostly a publicfinance problem, as the aging population will impose a heavy burden on thepublic pension system. First, in an aging society, there will be more retireesrelative to the working population and expenditure on old age support perworker will increase. The increased expenditure will have to be financed byhigher taxes on the current workforce, or simply by postponing retirement.Moreover, consumption among the elderly is different from that of youngerpeople. Older people spend less on houses and cars, but more on medicalservices and travel. Consequently, a change in the overall industry andeconomic structure is inevitable. Finally, because an older population haslower income levels, but a higher consumption rate (i.e. a net negative savingsrate), capital markets are significantly impacted. Overall, therefore, an aging
xvIntroduction
population will have a profound impact on many industries and the macro-economy as a whole.
It is the view of the author that many negative aspects of an agingpopulation will be mild and manageable. For example, extending the retirement age can largely alleviate the problem of the burden on public pensions ina country where a large segment of the population is older but healthier andmore active than it would have been in the past. People today are not onlyliving longer but they remain, for the most part, willing participants in andcontributors to the economy. As the majority of jobs in the present day are notphysically intensive, it becomes far less challenging to raise the retirement ageby a few years.
I will argue in this book that the most fundamental and irreparableproblem of aging is the weakening of entrepreneurship and innovation,and a sort of degradation in the vitality of the human population taken as awhole. A 50-year-old may be just as productive as a 30-year-old, particularly when it comes to non-physical labor, but in terms of the ability to learnnew skills, or the willingness to take risks such as starting a new venture,the 30-year-old is a much more productive individual. Although medicaladvancements have allowed people to live longer, humans are still physically most capable in their 20s, and mentally most innovative and energeticin their 30s. More importantly, as Chapter 2 will show, inventors andscientists are most productive in their 30s; most entrepreneurs start theirfirms at this age.
My research shows that the negative effect of aging on innovation andentrepreneurship can be dramatic. In an aging society, not only is the numberof young people reduced, but their vitality itself is diminished. This is mostlybecause, in an aging society, the opportunities for promotion are blocked bythose who are older. In an aging society, because young workers occupyrelatively lower-level positions in organizations, they have lower social andpolitical power, fewer skills, and more limited access to financial resources. Iwill show, consequently, that their entrepreneurship vitality suffers. Byanalyzing data from Japan and other developed economies, I have foundthat entrepreneurial activity is much lower in countries with an aging population. For example, in Japan, where the population has been aging rapidly sincethe 1990s, entrepreneurship and innovation have declined dramatically. Thishas been, in my view, a contributing factor to a prolonged economic recessionexperienced by that country over the past 25 years.
In the future, economic competition among the leading countries willmostly be in the fiercely competitive field of innovation. How to boostinnovation and entrepreneurship will become the most important problemfacing every country. The purpose of this book is to share with the reader myfindings regarding the impact of demographic change on innovation and theeconomy. Furthermore, to help the reader, whether they be a policy maker or
xvi Introduction
simply someone wishing to better prepare themselves for the future, to makegood decisions in the present.
The first half of the book (Part I, from Chapter 1 to Chapter 5) will analyzethe theories and evidence on the impact of demographics on innovations, aswell as their policy implications. After a short overview of global demographictrends in Chapter 1, Chapter 2 strives to demonstrate that demographic factorsare the most important drivers fueling innovation capability. The three mostimportant demographic factors affecting innovation are analyzed in thischapter. In addition to aging, the size of the population and the geographicalconcentration of the population also have a fundamental impact on innovation. Large countries and cities, with easy access to a large consumer market aswell as a talent pool, have decisive advantages in innovation.
Chapter 3 discusses how demographics will impact other aspects of theeconomy, such as public finances, unemployment, and inflation. Chapter 4clarifies many misconceptions regarding the effects of demographics onvarious aspects of the economy, including the availability and consumptionof resources, as well as the impact on the environment. Chapter 5 discusses thepolicies that need to be implemented in order to maintain a growing innovative and young workforce. Such policy choices include a pro-fertility policy, aneducation policy, and an open immigration policy.
The second half of the book (Part II, from Chapter 6 to Chapter 10) willdiscuss the prospect of future economic competition among the majoreconomic powers, including Japan, China, the United States, Europe, andIndia. For the major economic powers, demographics and related policychoices are the critical success factors to win the race of innovation.

PART ITheory and Policy
1

CHAPTER 1Global Demographic Trends
In this chapter I will analyze demographic trends globally, as well as trends indifferent parts of the world, specifically focusing on developed countries,
middle-income countries, and developing countries.Prior to the Industrial Revolution, all countries had a slow population
growth that was coupled with high mortality and high birth rates. Because, inpre-industrial societies, the infant mortality rate was high and life expectancywas very low, parents needed to produce as many offspring as possible tomake sure that at least one child would reach adulthood.
Let us define some commonly used terms. The birth rate is the number ofbirths per 1,000 people, and the (total) fertility rate is the average number ofchildren per woman, measured by adding up the number of children perwoman in each age group at a given time in a country or region.
Over the last 200 years, as a result of the Industrial and TechnologicalRevolutions, the world economy has grown tremendously. Average per capitaincome grew from just a few hundred dollars to a few thousand dollarsglobally. As people became wealthier, they had more resources, which in turnenabled them to raise healthy offspring. Advances in medicine and health alsoresulted in a plummeting infant mortality rate. As a result, life expectancyincreased and the world’s population grew very rapidly. Although it took sometime, people gradually adjusted to the new reality, realizing that, with thelower infant mortality rate, it was no longer necessary to have as many childrento ensure that some would survive into adulthood. Consequently, the fertilityrate dropped as people became healthier and more affluent, much to thesurprise of economists and sociologists, who expected continuous populationexpansion.
Usually there is a one-generation time gap between decreasing infantmortality and fertility rates. So, when a country begins to become prosperous,a substantially lowered infant mortality rate and a very high fertility rate tend tocreate a population explosion. Only after 30 to 40 years, approximately onegeneration later, does the fertility rate begin to decline. Even when the fertility
3
4 The Demographics of Innovation
rate falls below the replacement level, the total population will typicallycontinue to grow for one to two generations, simply because people livelonger. In most middle- to high-income countries, the fertility rate has droppedbelow the replacement level at some point in the past, but the total populationis still growing, albeit more slowly. However, if fertility rates remain below thereplacement level for one to two generations, the population will eventuallybegin to shrink. That decline will accelerate over time and, meanwhile, withfewer offspring and longer life expectancy, the populations of most countrieswill age rapidly.
The pattern of demographic transition described above is typical of a postindustrial country. Fertility rates in wealthy European countries began todecline long before the two World Wars, and many of them suffered a heavypopulation loss during the wars. After a post-war baby boom in the 1950s and1960s, their fertility rates declined sharply throughout the 1970s and 1980s. Bythe 1990s their fertility rates had dropped below replacement levels, and it ispredicted that their population will begin shrinking (once immigration fromdifferent regions is excluded) by 2020. Fertility rates in Russia, Eastern Europe,and Southern Europe have dropped below 1.4, which means that the 0–4cohort is 30% smaller than the 31–34 cohort. Japan’s situation is even worse,with its fertility rate dropping below the replacement level as early as the1970s, and most recently to only 1.4. Japan was the first major country in theworld with a shrinking total population. China had a population explosionduring the 1970s and 1980s, as did many other developing countries, but nowhas a very low fertility rate of 1.3, partly due to its family planning policy. Thecountry’s population is expected to begin shrinking by 2030.
As industrialization and urbanization spread globally, more countries areexperiencing low and declining fertility rates. India has a fertility rate of 2.5,much lower than it was 10 years ago, and still declining. The only exceptionstend to be the least-developed countries (LDCs) (such as Nigeria), which arestill in the very early stages of their demographic transition cycle. Today, morethan half of the people in the world are living in a country that has a belowreplacement-level fertility rate.
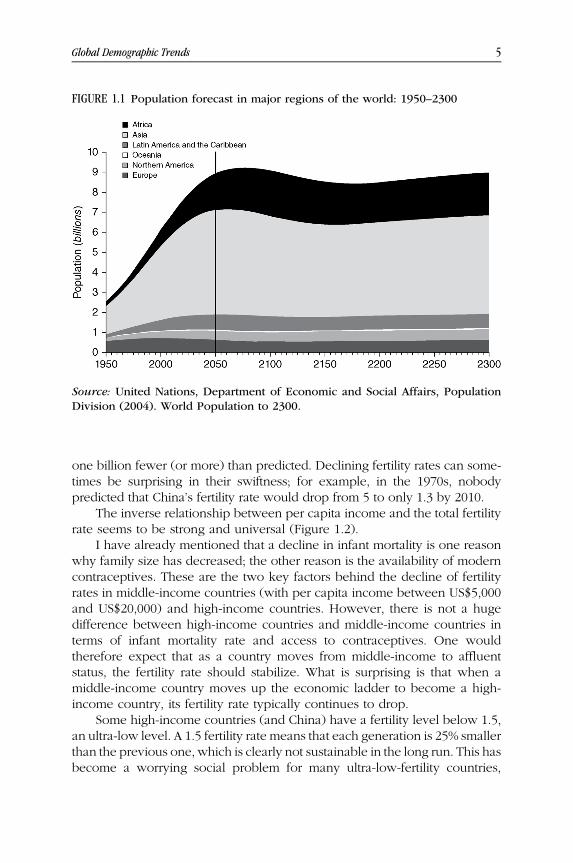
Figure 1.1 shows the population forecasts for the world. The total worldpopulation is at 7 billion and counting. However, over the next few decades,the population of many countries—including China—will peak and begin todecline. Even India, which will soon overtake China as the most populouscountry in the world, will start to have a below-replacement-level fertility ratein 20 years, and its population will peak in 2090. By that time, the worldpopulation is likely to peak at around 10 billion people. After that, the worldpopulation will start to stagnate or begin to decline.
These population forecasts are based on—and sensitive to—the predictions of future fertility. For example, if each woman, on average, has 0.2 childrenfewer (or more) than predicted, then the peak world population will be roughly
5Global Demographic Trends
FIGURE 1.1 Population forecast in major regions of the world: 1950–2300
Source: United Nations, Department of Economic and Social Affairs, PopulationDivision (2004). World Population to 2300.
one billion fewer (or more) than predicted. Declining fertility rates can sometimes be surprising in their swiftness; for example, in the 1970s, nobodypredicted that China’s fertility rate would drop from 5 to only 1.3 by 2010.
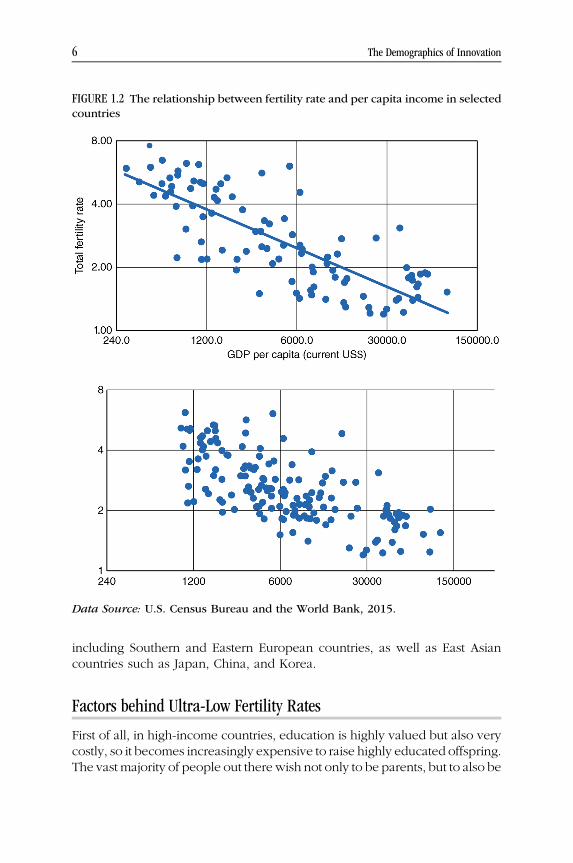
The inverse relationship between per capita income and the total fertilityrate seems to be strong and universal (Figure 1.2).
I have already mentioned that a decline in infant mortality is one reasonwhy family size has decreased; the other reason is the availability of moderncontraceptives. These are the two key factors behind the decline of fertilityrates in middle-income countries (with per capita income between US$5,000and US$20,000) and high-income countries. However, there is not a hugedifference between high-income countries and middle-income countries interms of infant mortality rate and access to contraceptives. One wouldtherefore expect that as a country moves from middle-income to affluentstatus, the fertility rate should stabilize. What is surprising is that when amiddle-income country moves up the economic ladder to become a high-income country, its fertility rate typically continues to drop.
Some high-income countries (and China) have a fertility level below 1.5,an ultra-low level. A 1.5 fertility rate means that each generation is 25% smallerthan the previous one, which is clearly not sustainable in the long run. This hasbecome a worrying social problem for many ultra-low-fertility countries,
6 The Demographics of Innovation
FIGURE 1.2 The relationship between fertility rate and per capita income in selectedcountries
Data Source: U.S. Census Bureau and the World Bank, 2015.
including Southern and Eastern European countries, as well as East Asiancountries such as Japan, China, and Korea.
Factors behind Ultra-Low Fertility Rates
First of all, in high-income countries, education is highly valued but also verycostly, so it becomes increasingly expensive to raise highly educated offspring.The vast majority of people out there wish not only to be parents, but to also be
7Global Demographic Trends
good parents. And, as a result, will avoid having children unless they arecertain that they can assure their children a high-quality education. Accordingto a report published in the Wall Street Journal in 2010, the cost of raising achild up until the age of 18 years in the United States is US$222,360, which isfour times higher than the average annual income. This figure does not includecollege tuition. In rich Asian countries, where parents typically put a great dealof emphasis on their children’s education, the cost is even higher, becauseparents usually not only pay for college tuition, but also invest a significantamount of money in tutoring, in order to give their children a competitiveadvantage in college admission.
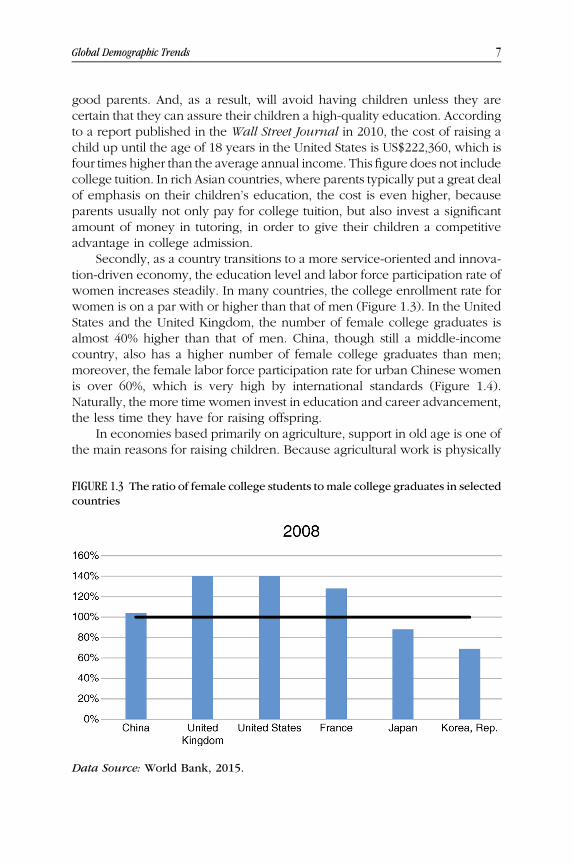
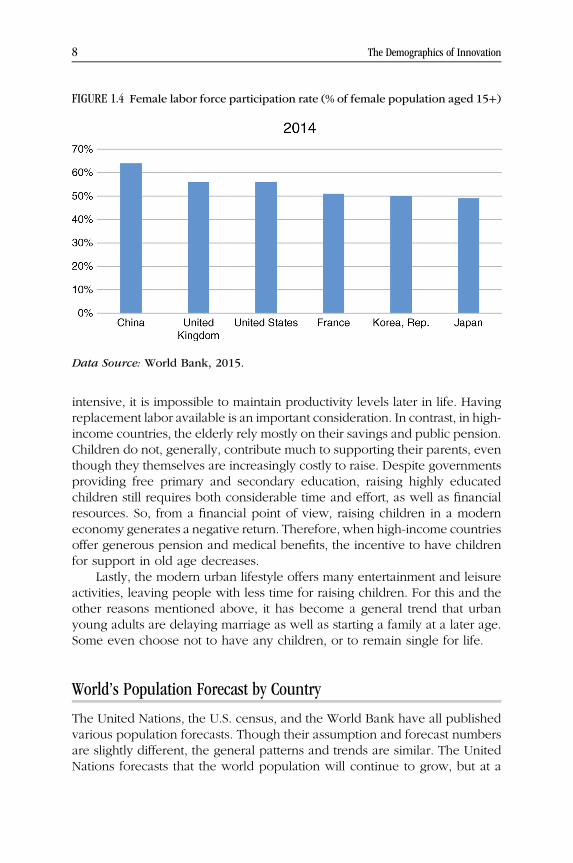
Secondly, as a country transitions to a more service-oriented and innovation-driven economy, the education level and labor force participation rate ofwomen increases steadily. In many countries, the college enrollment rate forwomen is on a par with or higher than that of men (Figure 1.3). In the UnitedStates and the United Kingdom, the number of female college graduates isalmost 40% higher than that of men. China, though still a middle-incomecountry, also has a higher number of female college graduates than men;moreover, the female labor force participation rate for urban Chinese womenis over 60%, which is very high by international standards (Figure 1.4).Naturally, the more time women invest in education and career advancement,the less time they have for raising offspring.
In economies based primarily on agriculture, support in old age is one ofthe main reasons for raising children. Because agricultural work is physically
FIGURE 1.3 The ratio of female college students to male college graduates in selectedcountries
Data Source: World Bank, 2015.
8 The Demographics of Innovation
FIGURE 1.4 Female labor force participation rate (% of female population aged 15+)
Data Source: World Bank, 2015.
intensive, it is impossible to maintain productivity levels later in life. Havingreplacement labor available is an important consideration. In contrast, in high-income countries, the elderly rely mostly on their savings and public pension.Children do not, generally, contribute much to supporting their parents, eventhough they themselves are increasingly costly to raise. Despite governmentsproviding free primary and secondary education, raising highly educatedchildren still requires both considerable time and effort, as well as financialresources. So, from a financial point of view, raising children in a moderneconomy generates a negative return. Therefore, when high-income countriesoffer generous pension and medical benefits, the incentive to have childrenfor support in old age decreases.
Lastly, the modern urban lifestyle offers many entertainment and leisureactivities, leaving people with less time for raising children. For this and theother reasons mentioned above, it has become a general trend that urbanyoung adults are delaying marriage as well as starting a family at a later age.Some even choose not to have any children, or to remain single for life.
World’s Population Forecast by Country
The United Nations, the U.S. census, and the World Bank have all publishedvarious population forecasts. Though their assumption and forecast numbersare slightly different, the general patterns and trends are similar. The UnitedNations forecasts that the world population will continue to grow, but at a
9Global Demographic Trends
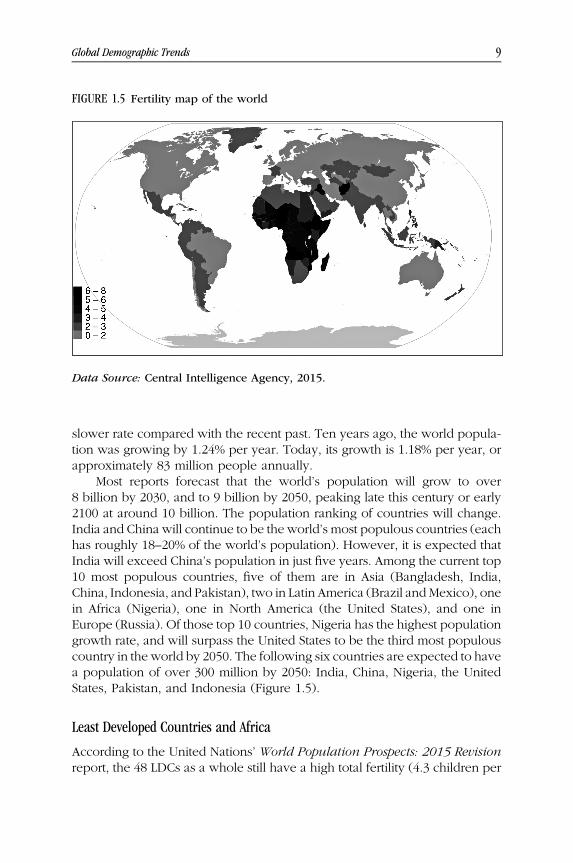
FIGURE 1.5 Fertility map of the world
Data Source: Central Intelligence Agency, 2015.
slower rate compared with the recent past. Ten years ago, the world population was growing by 1.24% per year. Today, its growth is 1.18% per year, orapproximately 83 million people annually.
Most reports forecast that the world’s population will grow to over8 billion by 2030, and to 9 billion by 2050, peaking late this century or early2100 at around 10 billion. The population ranking of countries will change.India and China will continue to be the world’s most populous countries (eachhas roughly 18–20% of the world’s population). However, it is expected thatIndia will exceed China’s population in just five years. Among the current top10 most populous countries, five of them are in Asia (Bangladesh, India,China, Indonesia, and Pakistan), two in Latin America (Brazil and Mexico), onein Africa (Nigeria), one in North America (the United States), and one inEurope (Russia). Of those top 10 countries, Nigeria has the highest populationgrowth rate, and will surpass the United States to be the third most populouscountry in the world by 2050. The following six countries are expected to havea population of over 300 million by 2050: India, China, Nigeria, the UnitedStates, Pakistan, and Indonesia (Figure 1.5).
Least Developed Countries and Africa
According to the United Nations’ World Population Prospects: 2015 Revisionreport, the 48 LDCs as a whole still have a high total fertility (4.3 children per