Embed Size (px)
Citation preview
16 THE DEEPER CAUSES OF THE FINANCIAL CRISIS: MORTGAGES ALONE CANNOT EXPLAIN IT SPRING 2013
The Deeper Causes of the Financial Crisis: Mortgages Alone Cannot Explain ItMARK ADELSON
MARK ADELSON
is chief strategy officer at The BondFactor Company, LLC, in New York, [email protected]
The all-in cost of the 2008 global financial crisis is huge. It must be reckoned in trillions of dollars, with numbers so big that they seem
more at home in a discussion of physics or astronomy than in finance. Depending on how it’s measured, the cost of the crisis appears to fall between $5 trillion and $15 trillion. For example, one measure of the cost is the decline in the aggregate value of the world’s stock mar-kets. After an initial drop of more than $35 trillion, the world’s stock markets have lev-eled off at between $10 trillion and $12 trillion below the pre-crisis peak.
By comparison, the losses on U.S. resi-dential mortgage loans at the onset of the crisis, including both already-realized losses and those yet to come, appear modest. This article estimates that all-in losses are between $750 billion and $2 trillion. Those are big num-bers—but not nearly big enough to explain the impact of the financial crisis. Although losses on residential mortgage loans may have served as the spark that ignited a powder keg of true underlying causes, the mortgage losses themselves are not one of the true causes.
If mortgage losses cannot explain the financial crisis, what can? The immediate causes seem to be financial firm behaviors, particularly high leverage and strong risk appetite. This assertion isn’t a great leap; a significant number of major financial f irms failed or
nearly failed in the early years of the crisis. However, identifying the immediate causes is only partly satisfying. It begs the question of what were their underlying drivers; what were the deeper causes? This article suggests five deeper causes.
In contrast to other articles that empha-size the immediate causes of the f inancial crisis, this one explores deeper causes, which all have roots stretching back decades. In other words, the foundations of the 2008 financial crisis were not laid in the early- or mid-2000s, but rather in the 1970s, 1980s, and 1990s.
An issue as large as the financial crisis nat-urally intersects with other, contemporaneous economic issues. An examination of the finan-cial crisis might naturally stray into considering such issues. This article, however, focuses solely on the 2008 financial crisis, steering clear of issues that include the U.S fiscal imbalance, the European sovereign debt crisis, ongoing economic stagnation in Japan, and developing asset bubbles in China. Including those issues in this discussion would add little substance to the analysis and would make the discussion far too lengthy.
This article is organized into six parts. The first is this introduction. The second part attempts to measure the magnitude of the financial crisis a few different ways. The third part addresses losses from defaults on U.S. resi-dential mortgage loans. The fourth considers
JPM-ADELSON.indd 16JPM-ADELSON.indd 16 4/11/13 5:01:00 PM4/11/13 5:01:00 PM
IT IS IL
LEGAL TO REPRODUCE THIS A
RTICLE IN
ANY FORMAT
Copyright © 2013
THE JOURNAL OF PORTFOLIO MANAGEMENT 17SPRING 2013
the immediate causes of the crisis, and the fifth suggests five deeper causes. The sixth part concludes.
THE COST OF THE FINANCIAL CRISIS
Reckoning the real cost of the financial crisis is a difficult matter. By any reasonable approach, it amounts to many trillions of dollars. The following discussion considers several approaches for quantifying the cost. Most of the approaches are incomplete. They capture only a single dimension of the cost of the financial crisis or they cover only a limited geographic region. None covers the full cost on a global basis.
Market Capitalization
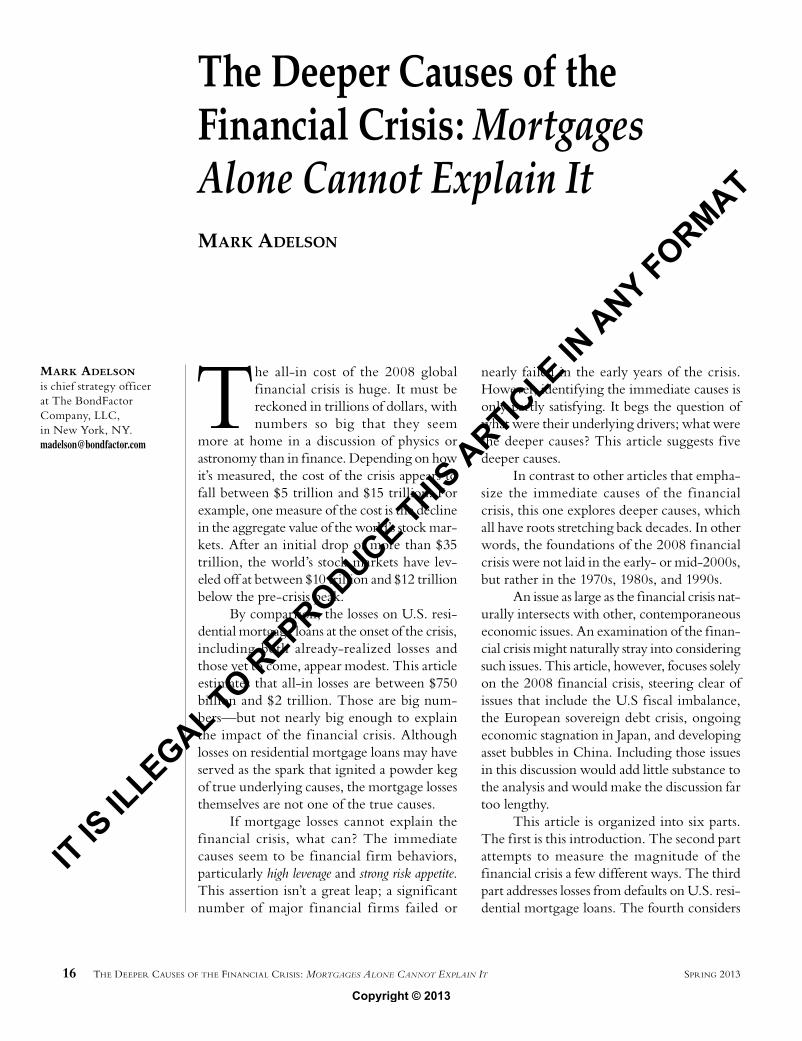
One way of measuring is to look at the aggregate market capitalization of the world’s equity exchanges, where the crisis brought about a temporary decline of roughly $37 trillion. After a partial recovery, the per-sisting erosion of equity values remains between $10 trillion and $12 trillion.
As shown in Exhibit 1, the market capitalization of the world’s equity markets peaked at roughly $62.5 tril-lion in the fourth quarter of 2007 and declined to a low of roughly $25.5 trillion in the first quarter of 2009. The
decline represented an erosion of roughly $37 trillion of equity value. The market capitalization subsequently recovered some of the lost ground, reaching $50 trillion in the fourth quarter of 2010. Since then, it has f luctu-ated between roughly $45 trillion and $55 trillion, so the world equity markets have a longer-term an erosion of roughly $10 trillion to $12 trillion of equity value.
World GDP
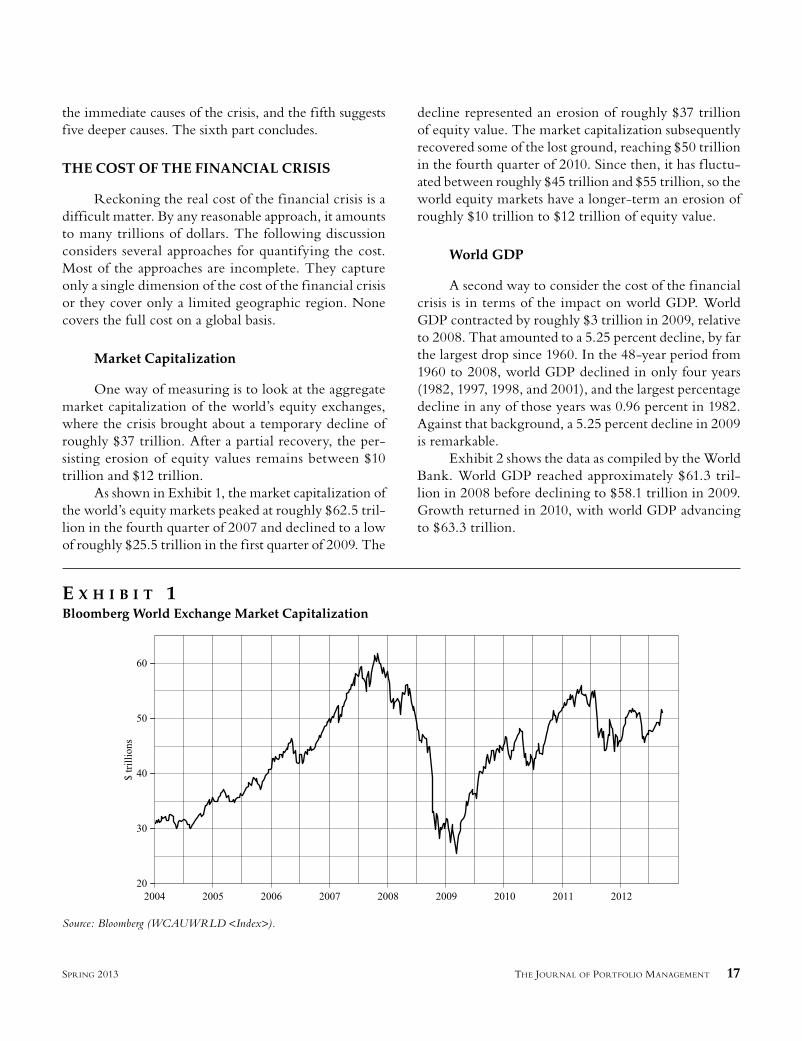
A second way to consider the cost of the financial crisis is in terms of the impact on world GDP. World GDP contracted by roughly $3 trillion in 2009, relative to 2008. That amounted to a 5.25 percent decline, by far the largest drop since 1960. In the 48-year period from 1960 to 2008, world GDP declined in only four years (1982, 1997, 1998, and 2001), and the largest percentage decline in any of those years was 0.96 percent in 1982. Against that background, a 5.25 percent decline in 2009 is remarkable.
Exhibit 2 shows the data as compiled by the World Bank. World GDP reached approximately $61.3 tril-lion in 2008 before declining to $58.1 trillion in 2009. Growth returned in 2010, with world GDP advancing to $63.3 trillion.
E X H I B I T 1Bloomberg World Exchange Market Capitalization
Source: Bloomberg (WCAUWRLD <Index>).
JPM-ADELSON.indd 17JPM-ADELSON.indd 17 4/11/13 5:01:00 PM4/11/13 5:01:00 PM
18 THE DEEPER CAUSES OF THE FINANCIAL CRISIS: MORTGAGES ALONE CANNOT EXPLAIN IT SPRING 2013
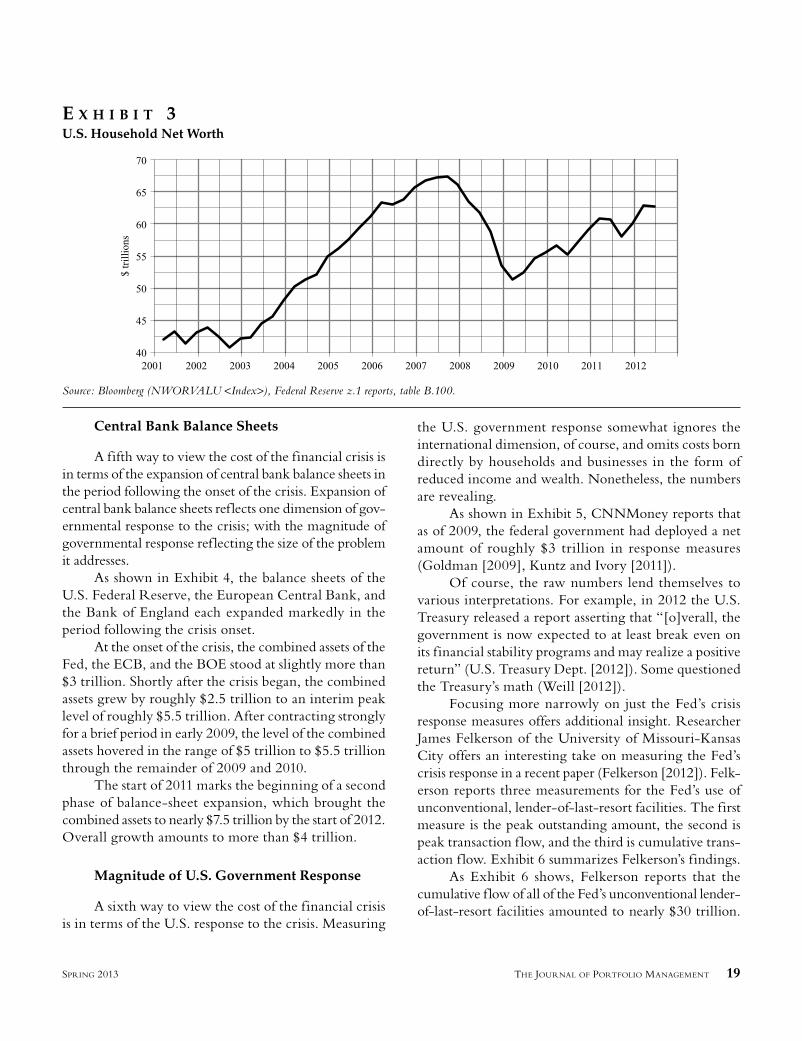
U.S. Household Wealth
A third way to consider the cost of the financial crisis is in terms of the loss of U.S. household wealth. This approach naturally excludes overseas effects, but it is nonetheless illustrative. U.S. household net worth experi-enced a temporary decline of more than $16 trillion and a persisting decline of more than $4 trillion.
As shown in Exhibit 3, U.S. household net worth peaked in 2007 at roughly $67.5 trillion. It declined by more than $16 trillion over 2008 and part of 2009 to a level of about $51.3 trillion. According to the Federal Reserve, the burst housing bubble meant the loss of $7 trillion of home equity. Household net worth has since recovered to nearly $63 trillion, but that is still more than $4 trillion below its 2007 peak (Board of Governors [2012], Krueger [2012]). A good portion of the recent rise in household net worth comes from stock market gains since the fourth quarter of 2011.
Even more striking, however, is the distribution of the decline in household net worth from 2007 to 2010 among American families. According to the latest Fed-eral Reserve Survey of Consumer Finances, the median net worth of American families declined from $126,400
in 2007 to $77,300 in 2010, a drop of nearly 39 percent. That decline pushed the median net worth down to roughly the same level as in 1992, wiping out nearly two decades of growth (Bricker et al. [2012]).
Significantly, the wealthiest and highest-income households were largely insulated from the decline, which fell primarily on middle- and working-class households: the shoulders least able to bear the burden. Those house-holds have experienced only a small share of the offset-ting stock-market growth since mid-2010.
Financial Sector Write-downs
A fourth way to gauge the impact of the crisis is by focusing on the financial sector. The IMF estimated in 2009 that banks and other financial firms would face $4.1 trillion in write-downs associated with the financial crisis (International Monetary Fund [2009]). Bloomberg reports that aggregate write-downs by financial firms around the world reached slightly more than $2 tril-lion by the end of the third quarter of 2011, and that firms had received nearly $1.6 trillion of capital infusions (Bloomberg WDCI function).
E X H I B I T 2World GDP
Source: World Bank (http://data.worldbank.org/indicator/NY.GDP.MKTP.CD).
JPM-ADELSON.indd 18JPM-ADELSON.indd 18 4/11/13 5:01:00 PM4/11/13 5:01:00 PM
THE JOURNAL OF PORTFOLIO MANAGEMENT 19SPRING 2013
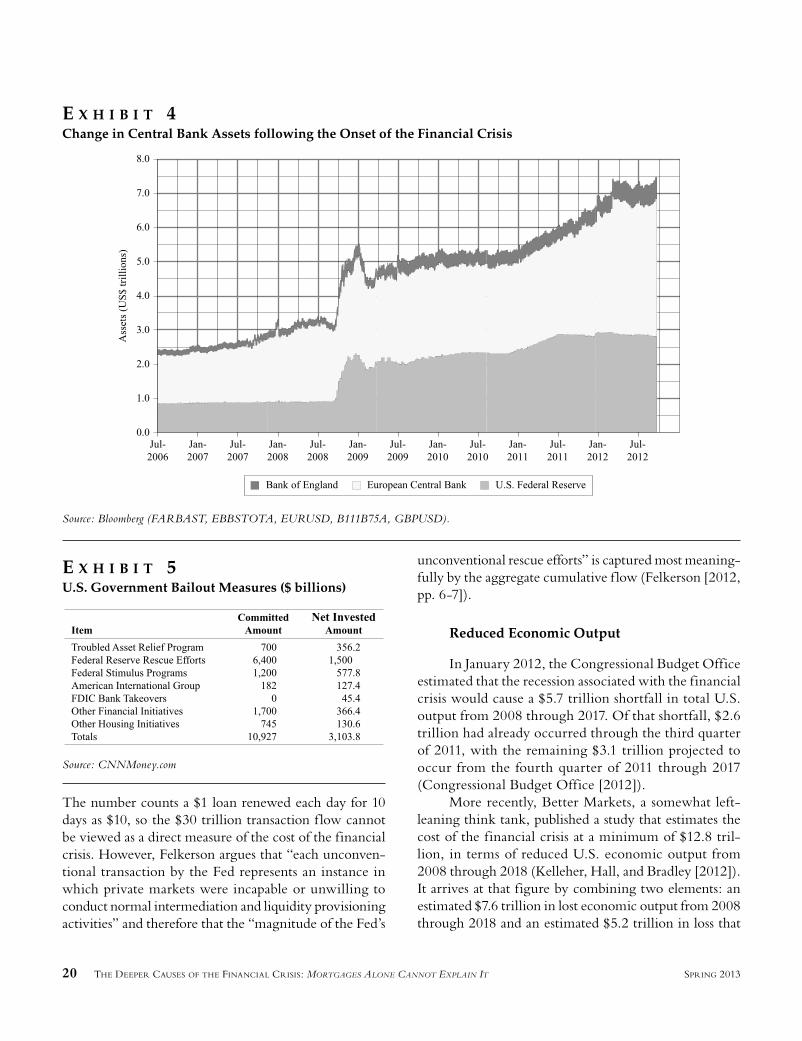
Central Bank Balance Sheets
A fifth way to view the cost of the financial crisis is in terms of the expansion of central bank balance sheets in the period following the onset of the crisis. Expansion of central bank balance sheets ref lects one dimension of gov-ernmental response to the crisis; with the magnitude of governmental response ref lecting the size of the problem it addresses.
As shown in Exhibit 4, the balance sheets of the U.S. Federal Reserve, the European Central Bank, and the Bank of England each expanded markedly in the period following the crisis onset.
At the onset of the crisis, the combined assets of the Fed, the ECB, and the BOE stood at slightly more than $3 trillion. Shortly after the crisis began, the combined assets grew by roughly $2.5 trillion to an interim peak level of roughly $5.5 trillion. After contracting strongly for a brief period in early 2009, the level of the combined assets hovered in the range of $5 trillion to $5.5 trillion through the remainder of 2009 and 2010.
The start of 2011 marks the beginning of a second phase of balance-sheet expansion, which brought the combined assets to nearly $7.5 trillion by the start of 2012. Overall growth amounts to more than $4 trillion.
Magnitude of U.S. Government Response
A sixth way to view the cost of the financial crisis is in terms of the U.S. response to the crisis. Measuring
the U.S. government response somewhat ignores the international dimension, of course, and omits costs born directly by households and businesses in the form of reduced income and wealth. Nonetheless, the numbers are revealing.
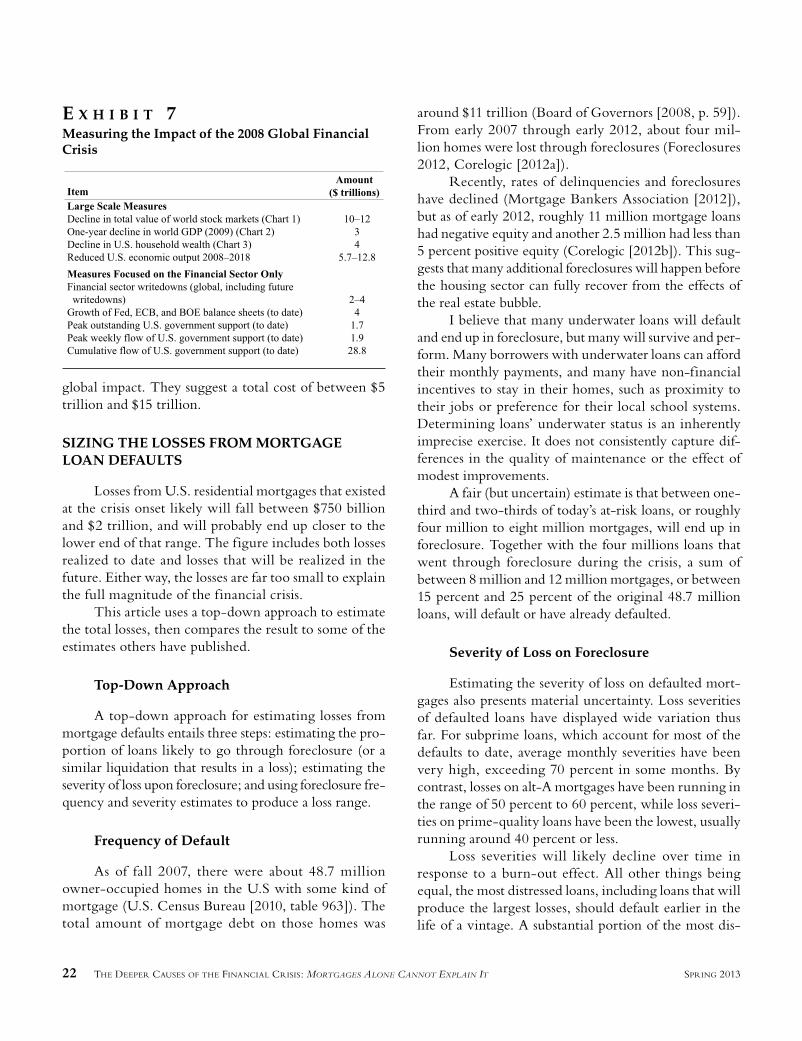
As shown in Exhibit 5, CNNMoney reports that as of 2009, the federal government had deployed a net amount of roughly $3 trillion in response measures (Goldman [2009], Kuntz and Ivory [2011]).
Of course, the raw numbers lend themselves to various interpretations. For example, in 2012 the U.S. Treasury released a report asserting that “[o]verall, the government is now expected to at least break even on its financial stability programs and may realize a positive return” (U.S. Treasury Dept. [2012]). Some questioned the Treasury’s math (Weill [2012]).
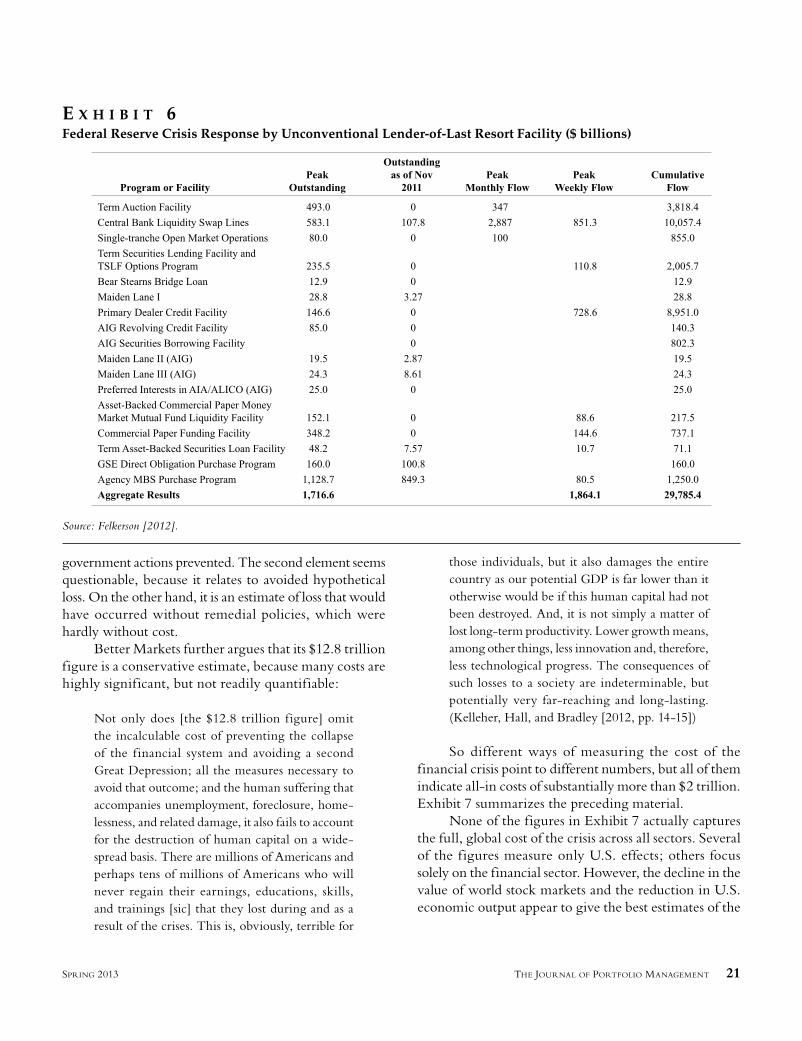
Focusing more narrowly on just the Fed’s crisis response measures offers additional insight. Researcher James Felkerson of the University of Missouri-Kansas City offers an interesting take on measuring the Fed’s crisis response in a recent paper (Felkerson [2012]). Felk-erson reports three measurements for the Fed’s use of unconventional, lender-of-last-resort facilities. The first measure is the peak outstanding amount, the second is peak transaction f low, and the third is cumulative trans-action f low. Exhibit 6 summarizes Felkerson’s findings.
As Exhibit 6 shows, Felkerson reports that the cumulative f low of all of the Fed’s unconventional lender-of-last-resort facilities amounted to nearly $30 trillion.
E X H I B I T 3U.S. Household Net Worth
Source: Bloomberg (NWORVALU <Index>), Federal Reserve z.1 reports, table B.100.
JPM-ADELSON.indd 19JPM-ADELSON.indd 19 4/11/13 5:01:00 PM4/11/13 5:01:00 PM
20 THE DEEPER CAUSES OF THE FINANCIAL CRISIS: MORTGAGES ALONE CANNOT EXPLAIN IT SPRING 2013
The number counts a $1 loan renewed each day for 10 days as $10, so the $30 trillion transaction f low cannot be viewed as a direct measure of the cost of the financial crisis. However, Felkerson argues that “each unconven-tional transaction by the Fed represents an instance in which private markets were incapable or unwilling to conduct normal intermediation and liquidity provisioning activities” and therefore that the “magnitude of the Fed’s
unconventional rescue efforts” is captured most meaning-fully by the aggregate cumulative f low (Felkerson [2012, pp. 6-7]).
Reduced Economic Output
In January 2012, the Congressional Budget Office estimated that the recession associated with the financial crisis would cause a $5.7 trillion shortfall in total U.S. output from 2008 through 2017. Of that shortfall, $2.6 trillion had already occurred through the third quarter of 2011, with the remaining $3.1 trillion projected to occur from the fourth quarter of 2011 through 2017 (Congressional Budget Office [2012]).
More recently, Better Markets, a somewhat left-leaning think tank, published a study that estimates the cost of the financial crisis at a minimum of $12.8 tril-lion, in terms of reduced U.S. economic output from 2008 through 2018 (Kelleher, Hall, and Bradley [2012]). It arrives at that figure by combining two elements: an estimated $7.6 trillion in lost economic output from 2008 through 2018 and an estimated $5.2 trillion in loss that
E X H I B I T 5U.S. Government Bailout Measures ($ billions)
Source: CNNMoney.com
E X H I B I T 4Change in Central Bank Assets following the Onset of the Financial Crisis
Source: Bloomberg (FARBAST, EBBSTOTA, EURUSD, B111B75A, GBPUSD).
JPM-ADELSON.indd 20JPM-ADELSON.indd 20 4/11/13 5:01:00 PM4/11/13 5:01:00 PM
THE JOURNAL OF PORTFOLIO MANAGEMENT 21SPRING 2013
government actions prevented. The second element seems questionable, because it relates to avoided hypothetical loss. On the other hand, it is an estimate of loss that would have occurred without remedial policies, which were hardly without cost.
Better Markets further argues that its $12.8 trillion figure is a conservative estimate, because many costs are highly significant, but not readily quantifiable:
Not only does [the $12.8 trillion figure] omit the incalculable cost of preventing the collapse of the f inancial system and avoiding a second Great Depression; all the measures necessary to avoid that outcome; and the human suffering that accompanies unemployment, foreclosure, home-lessness, and related damage, it also fails to account for the destruction of human capital on a wide-spread basis. There are millions of Americans and perhaps tens of millions of Americans who will never regain their earnings, educations, skills, and trainings [sic] that they lost during and as a result of the crises. This is, obviously, terrible for
those individuals, but it also damages the entire country as our potential GDP is far lower than it otherwise would be if this human capital had not been destroyed. And, it is not simply a matter of lost long-term productivity. Lower growth means, among other things, less innovation and, therefore, less technological progress. The consequences of such losses to a society are indeterminable, but potentially very far-reaching and long-lasting. (Kelleher, Hall, and Bradley [2012, pp. 14-15])
So different ways of measuring the cost of the financial crisis point to different numbers, but all of them indicate all-in costs of substantially more than $2 trillion. Exhibit 7 summarizes the preceding material.
None of the figures in Exhibit 7 actually captures the full, global cost of the crisis across all sectors. Several of the figures measure only U.S. effects; others focus solely on the financial sector. However, the decline in the value of world stock markets and the reduction in U.S. economic output appear to give the best estimates of the
E X H I B I T 6Federal Reserve Crisis Response by Unconventional Lender-of-Last Resort Facility ($ billions)
Source: Felkerson [2012].
JPM-ADELSON.indd 21JPM-ADELSON.indd 21 4/11/13 5:01:01 PM4/11/13 5:01:01 PM
22 THE DEEPER CAUSES OF THE FINANCIAL CRISIS: MORTGAGES ALONE CANNOT EXPLAIN IT SPRING 2013
global impact. They suggest a total cost of between $5 trillion and $15 trillion.
SIZING THE LOSSES FROM MORTGAGE LOAN DEFAULTS
Losses from U.S. residential mortgages that existed at the crisis onset likely will fall between $750 billion and $2 trillion, and will probably end up closer to the lower end of that range. The figure includes both losses realized to date and losses that will be realized in the future. Either way, the losses are far too small to explain the full magnitude of the financial crisis.
This article uses a top-down approach to estimate the total losses, then compares the result to some of the estimates others have published.
Top-Down Approach
A top-down approach for estimating losses from mortgage defaults entails three steps: estimating the pro-portion of loans likely to go through foreclosure (or a similar liquidation that results in a loss); estimating the severity of loss upon foreclosure; and using foreclosure fre-quency and severity estimates to produce a loss range.
Frequency of Default
As of fall 2007, there were about 48.7 million owner-occupied homes in the U.S with some kind of mortgage (U.S. Census Bureau [2010, table 963]). The total amount of mortgage debt on those homes was
around $11 trillion (Board of Governors [2008, p. 59]). From early 2007 through early 2012, about four mil-lion homes were lost through foreclosures (Foreclosures 2012, Corelogic [2012a]).
Recently, rates of delinquencies and foreclosures have declined (Mortgage Bankers Association [2012]), but as of early 2012, roughly 11 million mortgage loans had negative equity and another 2.5 million had less than 5 percent positive equity (Corelogic [2012b]). This sug-gests that many additional foreclosures will happen before the housing sector can fully recover from the effects of the real estate bubble.
I believe that many underwater loans will default and end up in foreclosure, but many will survive and per-form. Many borrowers with underwater loans can afford their monthly payments, and many have non-financial incentives to stay in their homes, such as proximity to their jobs or preference for their local school systems. Determining loans’ underwater status is an inherently imprecise exercise. It does not consistently capture dif-ferences in the quality of maintenance or the effect of modest improvements.
A fair (but uncertain) estimate is that between one-third and two-thirds of today’s at-risk loans, or roughly four million to eight million mortgages, will end up in foreclosure. Together with the four millions loans that went through foreclosure during the crisis, a sum of between 8 million and 12 million mortgages, or between 15 percent and 25 percent of the original 48.7 million loans, will default or have already defaulted.
Severity of Loss on Foreclosure
Estimating the severity of loss on defaulted mort-gages also presents material uncertainty. Loss severities of defaulted loans have displayed wide variation thus far. For subprime loans, which account for most of the defaults to date, average monthly severities have been very high, exceeding 70 percent in some months. By contrast, losses on alt-A mortgages have been running in the range of 50 percent to 60 percent, while loss severi-ties on prime-quality loans have been the lowest, usually running around 40 percent or less.
Loss severities will likely decline over time in response to a burn-out effect. All other things being equal, the most distressed loans, including loans that will produce the largest losses, should default earlier in the life of a vintage. A substantial portion of the most dis-
E X H I B I T 7Measuring the Impact of the 2008 Global Financial Crisis
JPM-ADELSON.indd 22JPM-ADELSON.indd 22 4/11/13 5:01:01 PM4/11/13 5:01:01 PM
THE JOURNAL OF PORTFOLIO MANAGEMENT 23SPRING 2013
tressed loans from the 2005, 2006, and 2007 vintages have already defaulted and gone through foreclosure, or are in the process. This suggests a plausible range for all-in severities of 45 percent to 65 percent.
Combining these frequency and severity ranges produces a rough, top-down estimate for a range of losses attributable to mortgage defaults, as follows:
• high end: $11 trillion in loans × 25% frequency × 65% severity ≈ $1.8 trillion
• low end: $11 trillion in loans × 15% frequency × 45% severity ≈ $750 billion
Third-Party Views
Somewhat surprisingly, there are few published estimates of the total amount of ultimate losses from mortgage defaults following the bursting of the housing bubble. Around mid-2008, in the early days of the crisis, PIMCO estimated that number at $1 trillion (Gross [2008]). Several months later, headlines indicated that the IMF had projected $1.4 trillion, but careful exami-nation of the IMF report indicates that this figure cov-ered much more than mortgage defaults. The report’s actual figure for mortgage losses was just $170 billion (International Monetary Fund [2008]).
In March 2012, noted mortgage researcher Laurie Goodman testified to a Senate subcommittee that between 7.4 million and 9.3 million U.S. residential mortgage loans have “yet to face foreclosure and eventual liquida-tion” (Goodman [2012]). When we combine Goodman’s estimate of future foreclosures with the severity range described above (45 percent to 65 percent) and the four million loans that have already been through foreclo-sure, we get a range for total losses of $1.2 trillion to $2 trillion.
In October 2010, Goodman estimated that losses would be $714 billion on the $2.9 trillion of first-lien mortgages that had been securitized in private-label MBS transactions from 2005 through 2007 (Goodman [2010]). She arrived at the $714 billion figure by applying customized default-rate and severity projections to dif-ferent loan categories. On an aggregate basis, covering all categories of loans, her analysis applied a default rate of 40 percent and a loss severity of 61 percent.
However, she ascribed significantly better perfor-mance to prime-quality loans than to others. Prime-quality loans accounted for roughly 17 percent of
Goodman’s loan population; she applied an overall default rate of 18 percent and a loss severity of 46 percent to that segment. For all other loans, her overall default rate was 45 percent and her severity was 62 percent.
A rough extrapolation of Goodman’s 2010 analysis to the entire $11 trillion universe of loans suggests total losses in the area of $1.5 trillion, with about $625 billion coming from prime-quality loans and about $875 billion coming from subprime and alt-A loans.
In December 2009, Barclays estimated that total losses on loans held in Fannie Mae or Freddie Mac port-folios or included in MBS issued by them would total around $275 billion (Setia et al. [2009]). For the period 2005 through 2007, originations of conforming mort-gage loans (i.e., those eligible for purchase and securiti-zation by Fannie Mae and Freddie Mae) constituted just 38 percent of total originations (2011 Mortgage Market Statistical Annual, vol. 2, p. 3). If the population of conforming loans from that period was representative of the entire population of loans from 2005 to 2007, and assuming that only negligible losses would come from earlier vintages, it implies an aggregate total loss amount of roughly $725 billion. However, non-conforming sub-prime and alt-A mortgage loans represented about 29 percent of originations from 2005 to 2007. If losses on subprime and alt-A loans run at twice the rate of losses on conforming loans, that implies an aggregate total loss amount of roughly $930 billion.
In May 2012, the Federal Housing Finance Agency reported that Fannie Mae and Freddie Mac had incurred losses (including provision for future losses) of $218 bil-lion on their single-family mortgage loans from 2008 through the third quarter of 2011 (Federal Housing Finance Agency [2012]). If the provision for future losses is sufficient to capture all or nearly all of future losses then, compared to Barclay’s estimate of $275 billion, the FHFA’s reported number of $218 implies a 21 per-cent improvement. Using the same approach as in the previous paragraph yields an implied aggregate total loss amount of roughly $600 billion by simple extrapola-tion, or an amount of roughly $740 billion, allowing for double the loss rates on subprime and alt-A loans.
Overall Range for Mortgage Losses
For third-party views, the $740 billion suggested by extrapolation from the May FHFA report is the reasonable low end of the range. The $2 trillion sug-
JPM-ADELSON.indd 23JPM-ADELSON.indd 23 4/11/13 5:01:02 PM4/11/13 5:01:02 PM
24 THE DEEPER CAUSES OF THE FINANCIAL CRISIS: MORTGAGES ALONE CANNOT EXPLAIN IT SPRING 2013
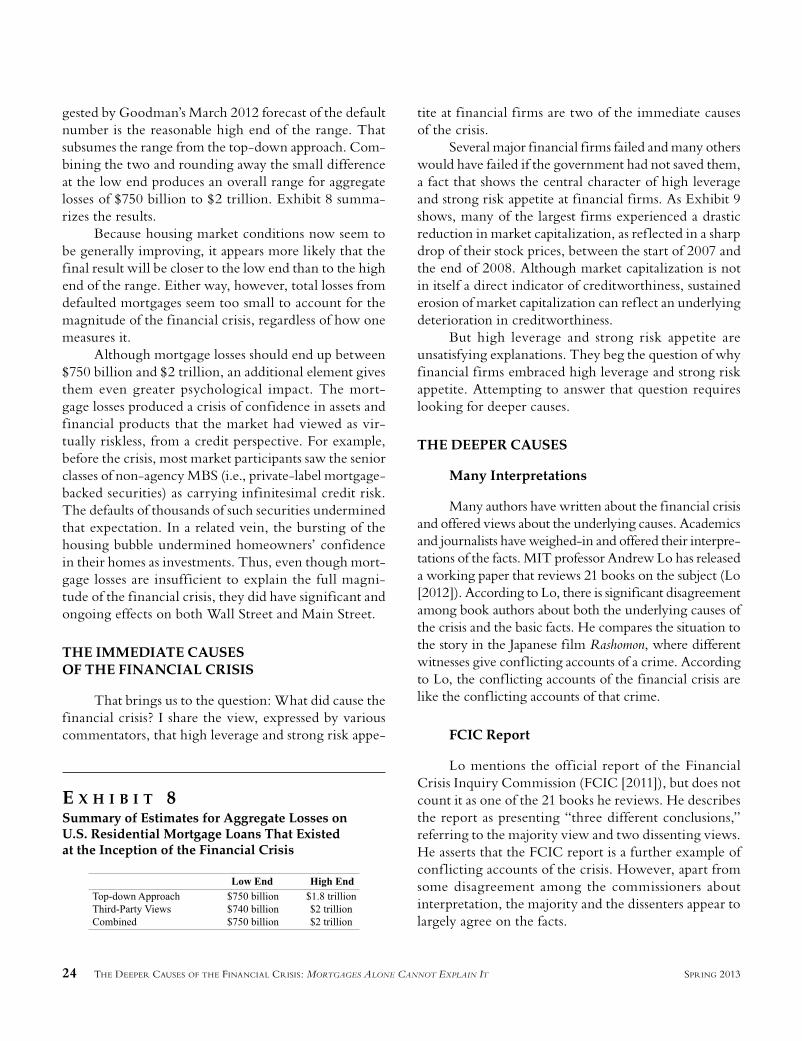
gested by Goodman’s March 2012 forecast of the default number is the reasonable high end of the range. That subsumes the range from the top-down approach. Com-bining the two and rounding away the small difference at the low end produces an overall range for aggregate losses of $750 billion to $2 trillion. Exhibit 8 summa-rizes the results.
Because housing market conditions now seem to be generally improving, it appears more likely that the final result will be closer to the low end than to the high end of the range. Either way, however, total losses from defaulted mortgages seem too small to account for the magnitude of the financial crisis, regardless of how one measures it.
Although mortgage losses should end up between $750 billion and $2 trillion, an additional element gives them even greater psychological impact. The mort-gage losses produced a crisis of confidence in assets and financial products that the market had viewed as vir-tually riskless, from a credit perspective. For example, before the crisis, most market participants saw the senior classes of non-agency MBS (i.e., private-label mortgage-backed securities) as carrying infinitesimal credit risk. The defaults of thousands of such securities undermined that expectation. In a related vein, the bursting of the housing bubble undermined homeowners’ confidence in their homes as investments. Thus, even though mort-gage losses are insufficient to explain the full magni-tude of the financial crisis, they did have significant and ongoing effects on both Wall Street and Main Street.
THE IMMEDIATE CAUSES OF THE FINANCIAL CRISIS
That brings us to the question: What did cause the financial crisis? I share the view, expressed by various commentators, that high leverage and strong risk appe-
tite at financial firms are two of the immediate causes of the crisis.
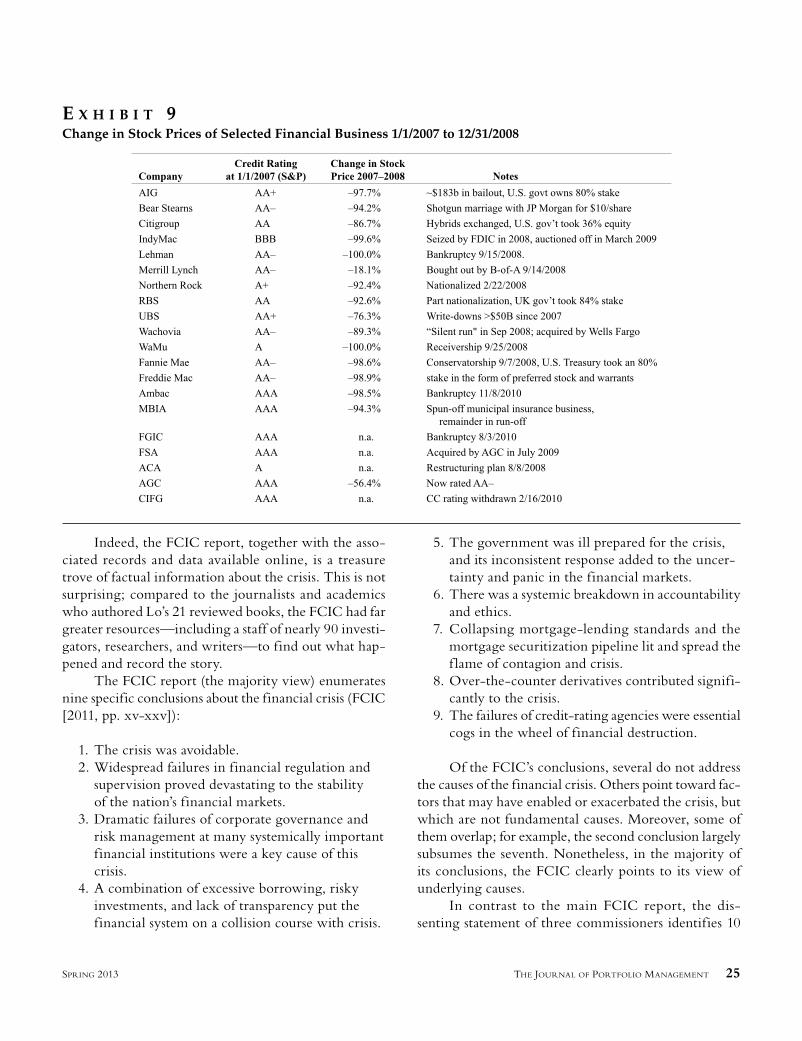
Several major financial firms failed and many others would have failed if the government had not saved them, a fact that shows the central character of high leverage and strong risk appetite at financial firms. As Exhibit 9 shows, many of the largest firms experienced a drastic reduction in market capitalization, as ref lected in a sharp drop of their stock prices, between the start of 2007 and the end of 2008. Although market capitalization is not in itself a direct indicator of creditworthiness, sustained erosion of market capitalization can ref lect an underlying deterioration in creditworthiness.
But high leverage and strong risk appetite are unsatisfying explanations. They beg the question of why financial firms embraced high leverage and strong risk appetite. Attempting to answer that question requires looking for deeper causes.
THE DEEPER CAUSES
Many Interpretations
Many authors have written about the financial crisis and offered views about the underlying causes. Academics and journalists have weighed-in and offered their interpre-tations of the facts. MIT professor Andrew Lo has released a working paper that reviews 21 books on the subject (Lo [2012]). According to Lo, there is significant disagreement among book authors about both the underlying causes of the crisis and the basic facts. He compares the situation to the story in the Japanese film Rashomon, where different witnesses give conf licting accounts of a crime. According to Lo, the conf licting accounts of the financial crisis are like the conf licting accounts of that crime.
FCIC Report
Lo mentions the official report of the Financial Crisis Inquiry Commission (FCIC [2011]), but does not count it as one of the 21 books he reviews. He describes the report as presenting “three different conclusions,” referring to the majority view and two dissenting views. He asserts that the FCIC report is a further example of conf licting accounts of the crisis. However, apart from some disagreement among the commissioners about interpretation, the majority and the dissenters appear to largely agree on the facts.
E X H I B I T 8Summary of Estimates for Aggregate Losses on U.S. Residential Mortgage Loans That Existed at the Inception of the Financial Crisis
JPM-ADELSON.indd 24JPM-ADELSON.indd 24 4/11/13 5:01:02 PM4/11/13 5:01:02 PM
THE JOURNAL OF PORTFOLIO MANAGEMENT 25SPRING 2013
Indeed, the FCIC report, together with the asso-ciated records and data available online, is a treasure trove of factual information about the crisis. This is not surprising; compared to the journalists and academics who authored Lo’s 21 reviewed books, the FCIC had far greater resources—including a staff of nearly 90 investi-gators, researchers, and writers—to find out what hap-pened and record the story.
The FCIC report (the majority view) enumerates nine specific conclusions about the financial crisis (FCIC [2011, pp. xv-xxv]):
1. The crisis was avoidable.2. Widespread failures in financial regulation and
supervision proved devastating to the stability of the nation’s financial markets.
3. Dramatic failures of corporate governance and risk management at many systemically important financial institutions were a key cause of this crisis.
4. A combination of excessive borrowing, risky investments, and lack of transparency put the financial system on a collision course with crisis.
5. The government was ill prepared for the crisis, and its inconsistent response added to the uncer-tainty and panic in the financial markets.
6. There was a systemic breakdown in accountability and ethics.
7. Collapsing mortgage-lending standards and the mortgage securitization pipeline lit and spread the f lame of contagion and crisis.
8. Over-the-counter derivatives contributed signifi-cantly to the crisis.
9. The failures of credit-rating agencies were essential cogs in the wheel of financial destruction.
Of the FCIC’s conclusions, several do not address the causes of the financial crisis. Others point toward fac-tors that may have enabled or exacerbated the crisis, but which are not fundamental causes. Moreover, some of them overlap; for example, the second conclusion largely subsumes the seventh. Nonetheless, in the majority of its conclusions, the FCIC clearly points to its view of underlying causes.
In contrast to the main FCIC report, the dis-senting statement of three commissioners identifies 10
E X H I B I T 9Change in Stock Prices of Selected Financial Business 1/1/2007 to 12/31/2008
JPM-ADELSON.indd 25JPM-ADELSON.indd 25 4/11/13 5:01:02 PM4/11/13 5:01:02 PM
26 THE DEEPER CAUSES OF THE FINANCIAL CRISIS: MORTGAGES ALONE CANNOT EXPLAIN IT SPRING 2013
specific items as causes of the crisis (FCIC [2012, pp. 417-419]):
1. the credit bubble, 2. the housing bubble, 3. non-traditional mortgages, 4. credit ratings and securitization, 5. financial institutions’ concentrated, correlated
risk, 6. leverage and liquidity risk, 7. risk of contagion, 8. common shock, 9. financial shock and panic,10. financial crisis causing economic crisis.
The dissenting view differs from the majority in considering international comparisons to a far greater degree. It emphasizes the formation of a credit bubble that extended far beyond the sphere of housing and resi-dential mortgages. Significantly, the dissent highlights the fact that derivatives, such as credit default swaps (CDS) cannot magnify losses, because each derivative contract is a zero-sum game. For every dollar of loss on one side of the contract, there is a dollar of gain on the other side. In addition, the dissent observes quite directly that declining home prices and losses from defaulting mortgages are not sufficient to explain the crisis:
The story so far involves significant lost housing wealth and diminished values of securities financing those homes. Yet even larger past wealth losses did not bring the global financial system to its knees. The key differences in this case were leverage and risk concentration. (FCIC [2011, p. 427])
One of the FCIC commissioners, Peter J. Wallison, penned a separate dissenting statement. He attempts to explain the crisis largely as a consequence of national housing policy and the development of “non-traditional” mortgage products (i.e., subprime and alt-A mortgages). None of the other nine commissioners joined in that dissent. Non-traditional mortgage products are merely a subset of the larger universe of residential mortgages. Thus, if the losses on all residential mortgage loans are not sufficient to explain the magnitude of the financial crisis, the impact of just a subset is also not a sufficient explanation.
Another Interpretation of Deeper Causes
This article adds another interpretation to the mix. In contrast to other studies, this article attempts to differ-entiate immediate causes from deeper causes. Doing so recognizes the possibility of a chain of causation leading to an event. Although every link in the chain may bear investigation, the ones at the very start of the process generally are the most important.
In my view, at least five deeper causes can poten-tially explain why many financial firms embraced high leverage and strong risk in the years leading up to the crisis:
1. securities firms converting from partnerships to corporations,
2. deregulation over the past 30 years,3. the quant movement,4. the spread of risk-taking culture through the
financial industry,5. globalization.
Each one might deserve an entire book; here, each receives a brief discussion.
Securities Firms Converting from Partnerships to Corporations
The change in organizational form explains the change in incentives and risk-taking behavior at those firms. After the change, non-owner employees became responsible for key risk decisions but had skewed incen-tives. Instead of taking risks with their own money, the employees could take risks with shareholders’ money.
Securities dealers started converting from partner-ships to corporations in the 1970s. The trend continued through 1999, when Goldman Sachs, the last major secu-rities firm in partnership form, converted to corporate status. The conversion meant that managers were no longer necessarily the firm’s owners. The separation of management from ownership gave rise to the classic prin-cipal–agent problem, especially when the firms came to have employees with responsibility for taking risks who did not also have substantial pre-existing equity stakes. These employees took risks with shareholders’ money. If the outcomes were positive, the employees reaped huge gains through incentive compensation schemes. If the outcomes were negative, employees’ downside was lim-
JPM-ADELSON.indd 26JPM-ADELSON.indd 26 4/11/13 5:01:03 PM4/11/13 5:01:03 PM
THE JOURNAL OF PORTFOLIO MANAGEMENT 27SPRING 2013
ited. They might get fired and have to get a new job, but their accumulated personal wealth was generally not at risk.
Michael Lewis embraces this point in the epilogue of The Big Short, where he asserts that the former CEO of Salomon
had done violence to the Wall Street social order—and got himself dubbed the King of Wall Street—when, in 1981, he’d turned Salomon Brothers from a private partnership into Wall Street’s first public corporation. (Lewis [2010])
Deregulation of Financial Services
Deregulation let f inancial f irm employees take new and greater risks.
Financial sector deregulation did not occur in iso-lation. It was part of a broader deregulation movement that started in the 1970s and affected many industries. Air travel, cable TV, electric power, interstate trucking, natural gas transmission, railroads, and telephone service are all examples of industries that experienced substan-tial deregulation over the past four decades. Financial industry deregulation was just part of the larger trend. Key milestones in financial regulation’s roll-back include the Depository Institutions Deregulation and Monetary Control Act of 1980, the Garn–St. Germain Deposi-tory Institutions Act of 1982, the Riegle–Neal Inter-state Banking and Branching Efficiency Act of 1994, the Private Securities Litigation Reform Act of 1995, the Gramm–Leach–Bliley Act, and the Commodity Futures Modernization Act of 2000.
The FCIC report identifies the deregulation move-ment as one element of its “failures in financial regula-tion” conclusion. The report states:
More than 30 years of deregulation and reli-ance on self-regulation by financial institutions, championed by former Federal Reserve chairman Alan Greenspan and others, supported by succes-sive administrations and Congresses, and actively pushed by the powerful f inancial industry at every turn, had stripped away key safeguards, which could have helped avoid catastrophe. This approach had opened up gaps in oversight of crit-ical areas with trillions of dollars at risk, such as
the shadow banking system and over-the-counter derivatives markets. In addition, the government permitted financial firms to pick their preferred regulators in what became a race to the weakest supervisor. (FCIC [2011, p. xviii])
Although certain steps along the path of financial deregulation were in themselves benign, the cumulative effect of successive steps was to enable firms to take dif-ferent and greater risks than they could before deregu-lation started. Over the period from 1970 to 2007, the f inancial industry experienced a metamorphosis that could not have occurred without deregulation. Firms that had been stodgy, strictly regulated, and risk-averse, ultimately were able to transform themselves into high-f lying risk takers, because of the removal of regulatory restraints.
Quant Movement
The third deeper cause is the quant movement: the proliferation of quantitative tools (particularly Monte Carlo simulations) for designing and analyzing financial products, as well as for risk management. Of course, quantitative models themselves are rarely a problem. It is over-reliance or the intentional misuse of such models that causes trouble.
One view is that the quant movement caused many finance professionals to mistakenly believe that quantita-tive tools had allowed them to conquer risk. The FCIC report takes a slightly more jaded view, implying that f inancial f irms used quantitative tools for “risk justi-fication” rather than for true risk management (FCIC [2011, p. xix]).
The heart of the problem associated with quantita-tive models was model risk: the risk that a model varies too much from the real world to produce useful results. Model risk might not have been a problem if financial professionals had retained skepticism about their quan-titative models’ reliability. However, that was not the case. In fact, the (sometimes false) appearance of rigor and precision tended to encourage excessive reliance on such models.
The issue of model risk is hardly new. More than 10 years ago, I offered the following comment:
Our mathematical models generally will fail to capture the impact of rare and severe situations
JPM-ADELSON.indd 27JPM-ADELSON.indd 27 4/11/13 5:01:03 PM4/11/13 5:01:03 PM
28 THE DEEPER CAUSES OF THE FINANCIAL CRISIS: MORTGAGES ALONE CANNOT EXPLAIN IT SPRING 2013
like the attack on the World Trade Center. Their rareness makes them outliers and their severity encourages us to discard them as aberrations. In building models, we allow ourselves to use biased samples that overweight good times. We artificially simplify non-stationary processes. We choose distribution forms that are convenient, even if their tails are too thin. If we find it too difficult to quantify a seemingly relevant factor, we are prone to simply ignore it. Political and social factors rarely appear as variables. And yet, all this is acceptable, provided that we appreciate our models’ limitations. We must not ask our models to carry more than they can bear. Certainly, after 9/11, we have to have heightened sensitivity to such issues. (Adelson [2002])
Moreover, heavy reliance on quantitative methods, especially Monte Carlo simulations, did not suddenly arise in 2000. The quant movement has roots that run all the way back to the Manhattan Project of the 1940s and through game-theory approaches to nuclear strategy in the 1950s and 1960s. The introduction of desktop computers in the business environment during the early 1980s brought with it the tools and approaches from these other disciplines.
Moreover, because of quantitative models’ rigor and apparent discipline, they managed to gain even greater acceptance through the 1990s and early 2000s. Interestingly, several notable failures, such as Long-Term Capital Management’s quantitative trading strategy and high losses in various structured finance sectors, did not seem to dampen the market’s growing enthusiasm for quantitative methods.
Significantly, products and activities that relied heavily on quantitative models were at the heart of how financial firms expanded their activities to take more and greater risks. Securitizations and derivatives were con-spicuous examples, but they were hardly the only ones.
Spread of Risk-Taking Culture into Traditionally Conservative Institutions
The combination of the first three deeper causes, together with high compensation for investment bank professionals, meant that other types of financial firms tried to emulate investment banks’ activities and behav-iors. They wanted the high compensation levels that
trading f loor professionals at investment banks were receiving. Many commercial banks created “Section 20” subsidiaries and branched into non-traditional shadow-banking activities to generate higher margins.
Those non-traditional activities brought with them not just incremental risk, but also complexity. In some cases, the activities themselves were benign, but invest-ment banks used them to increase leverage through off-balance sheet accounting (or similar means). Lowered regulatory firewalls allowed these behaviors to spread, and the quant movement provided an assurance that risk was properly controlled.
The FCIC report notes that investment banks greatly increased employee compensation levels in the 1980s and that commercial banks followed suit in order “to keep up” (FCIC [2011, p. 62]). In a separate pas-sage, the report describes how, following the removal of regulatory constraints in the late 1990s, the desire of commercial banks and insurance companies to embrace investment-banking activities realized full fruition:
The new regime encouraged growth and consoli-dation within and across banking, securities, and insurance. The bank-centered financial holding companies … could compete directly with the “big five” investment banks … in securitization, stock and bond underwriting, loan syndication, and trading in over-the-counter (OTC) deriva-tives. The biggest bank holding companies became major players in investment banking. The strat-egies of the largest commercial banks and their holding companies came to more closely resemble the strategies of investment banks. Each had advan-tages: commercial banks enjoyed greater access to insured deposits, and the investment banks enjoyed less regulation. Both prospered from the late 1990s until the outbreak of the financial crisis in 2007. (FCIC [2011, p. 56])
Globalization
Globalization promoted the international spread of high leverage and strong risk appetites among major financial firms throughout the developed world. Two particular aspects of globalization stand out: the partial homogenization of business cultures and practices, and
JPM-ADELSON.indd 28JPM-ADELSON.indd 28 4/11/13 5:01:03 PM4/11/13 5:01:03 PM
THE JOURNAL OF PORTFOLIO MANAGEMENT 29SPRING 2013
the removal of capital controls among the developed nations.
The removal of capital controls can be traced to the demise of the Bretton Woods system in 1971, when the U.S. dropped the gold standard. Until then, capital con-trols had somewhat restrained international capital f lows and may have served as barriers to the spread of capital market contagion. With the removal of capital controls, financial firms throughout the developed world became able to pursue the same strategies and take the same risks across international boundaries.
The homogenization of business practices and cul-tures came about through advances in computers, tele-communications, and air travel. Domestic capital markets gave way to an integrated global financial system. Finan-cial professionals around the globe increasingly pursued similar strategies. In the absence of capital controls, they could readily do so, and there are plentiful examples of non-U.S. financial firms expanding into risky non-traditional products and using shadow-banking activities to increase economic leverage.
Red Herrings
The search for deeper causes necessarily entails exploring blind alleys and dead ends. Factors that seem, at first blush, to be deeper causes often turn out to steps on the causal chain or merely contemporaneous events. A few might qualify as contributing factors, but that conclusion is debatable and, in any case, a contributing factor is hardly equivalent to a deeper cause. Here are several examples:
Excess Liquidity and the Hunt for Yield
Excess liquidity—a surfeit of investable funds—was not one of the deeper causes of the 2008 financial crisis. The release of large amounts of private savings into the international capital markets, largely from Asia and Eastern Europe, has unquestionably placed downward pressure on both benchmark yields and credit spreads. But bond–yield oscillations, by themselves, do not gener-ally precipitate financial crisis. Moreover, low benchmark yields are often viewed as a positive economic signal, because they mean that firms can raise capital at a lower cost. The same is often said of tight credit spreads.
Yields and spreads can be no more than incidental factors in explaining the financial crisis. Their levels
do not explain why risk appetites and leverage grew so strongly at financial firms. On the other hand, one can easily envision that changes in incentives and the regulatory environment (produced by the deeper causes discussed) could have produced a financial crisis in an environment with higher benchmark yields and wider credit spreads.
Fair-Value Accounting and the Related Markdowns
Likewise, changes in accounting standards, par-ticularly the introduction of fair-value accounting, were not a deeper cause of the 2008 financial crisis. Improved accounting standards may have hastened the revelation of problems at banks and f inancial f irms. However, that is hardly to say that the problems would not have come to light, or would not have actually existed, under older accounting standards. The accumulation of risk and leverage in financial institutions was not merely a perception, it was reality. The reality is what brought the crisis. Changes in accounting standards could have been no more than a minor factor in the timing of the crisis onset.
Shadow Banking: Securitization, Derivatives, Repos, and So On
Shadow-banking activities and products (securi-tization, derivatives, repo financing, and others) were clearly part of the causal chain of events associated with the 2008 financial crisis, but they were not a deeper cause. Shadow-banking activities were among the tools that financial firms used for taking risks and boosting leverage.
But f inancial f irms would have devised other tactics if those options had been unavailable. Financial firms will find ways to pursue strategies of aggressive risk taking and high leverage as long as there are both incentives for doing so and the means to do so under their regulatory framework.
Greed and a Breakdown of Business Ethics
Neither greed nor a breakdown of business ethics was a deeper cause of the 2008 financial crisis. People may debate whether greed is truly a vice, yet it has been a constant in human affairs for millennia. It certainly did
JPM-ADELSON.indd 29JPM-ADELSON.indd 29 4/11/13 5:01:03 PM4/11/13 5:01:03 PM
30 THE DEEPER CAUSES OF THE FINANCIAL CRISIS: MORTGAGES ALONE CANNOT EXPLAIN IT SPRING 2013
not appear as a new facet of the human condition in 1995, 2000, or 2005. The magic of capitalism is that it harnesses self-interested, utility-maximizing behavior (greed by a kinder name) to optimize the allocation of resources and maximize society’s output. Just as greed was not new in the lead-up to the crisis, capitalism’s ability to channel it did not suddenly evaporate in the mid-2000s.
Moreover, the idea of a sudden breakdown of busi-ness ethics in the financial industry seems to ignore the industry’s long history of shady practices. Our financial vocabulary would not include terms such as boiler room, bucket shop, insider trading, scalping, and front running if the financial world were ruled by niceness. Formalized laws and regulations, rather than informal ethics, are what actually constrain the behavior of market participants. Even Adam Smith recognized that markets need enforce-able rules to function properly. Although the notion of a breakdown of business ethics may not stand on its own, translating it into the idea of an inadequate regulatory framework can perhaps save it.
CONCLUSION
The magnitude of the 2008 financial crisis is too big to be explained by the total losses on U.S. residential mortgages. Although mortgage losses may have served as a trigger to unleash the crisis, its substantial proxi-mate causes lie in the behaviors of financial firms: high leverage and strong risk appetite. This is evident from the fact that many financial firms either failed or nearly failed in the early phases of the crisis. However, the firms’ behaviors did not come out of the blue. They came from a variety of deeper causes, several of which had roots stretching back several decades.
In the first volume of his history of World War II, Sir Winston Churchill starts his exposition at the conclusion of World War I. He explains how the causes of WW II lie in a sequence of events that start in 1919. After roughly three hundred pages of vivid history, he sums up:
Look back and see what we had successively accepted or thrown away: a Germany disarmed by a solemn treaty; a Germany rearmed in viola-tion of a solemn treaty; air superiority or even air parity cast away; the Rhineland forcibly occupied and the Siegfried Line built or building; the Ber-lin-Rome Axis established; Austria devoured and
digested by the Reich; Czechoslovakia deserted and ruined by the Munich Pact; its fortress line in German hands, its mighty arsenal of Skoda henceforward making munitions for the German armies; President Roosevelt’s effort to stabilize or bring to a head the European situation by the intervention of the United States waved aside with one hand, and Soviet Russia’s undoubted willingness to join the Western Powers and go all lengths to save Czechoslovakia ignored on the other; the services of thirty-five Czech divi-sions against the still unripened Germany [sic] Army cast away, when Great Britain could herself supply only two to strengthen the front in France; all gone with the wind. (Churchill [1948])
So it is with the 2008 financial crisis. Despite the appeal of proximate causes as an explanation for what happened, a real understanding can come only from probing for deeper causes. Those causes are not recent, transient events, but rather major trends that persisted and gradually changed the character of the financial industry over a period of decades.
Losses on U.S. residential mortgages were a result of deeper causes. They were not themselves a true cause of the crisis. The numbers simply don’t support the con-clusion that they could have been.
REFERENCES
2011 Mortgage Market Statistical Annual, Vol. 2. Bethesda, MD: Inside Mortgage Finance Publications, 2011.
Adelson. “How the Events of 9/11 Affect Thinking About Risk.” CMBS World (Summer 2002), pp. 54-59, 78-79.
Board of Governors of the Federal Reserve System. Flow of Funds Accounts of the United States, Flows and Outstand-ings, First Quarter 2008, Federal Reserve Statistical Release Z.1. June 5, 2008.
——. “The U.S. Housing Market: Current Conditions and Policy Considerations.” White paper, January 4, 2012.
Bricker, J., A. Kennickell, K. Moore, and J. Sabelhaus. “Changes in U.S. Family Finances from 2007 to 2010: Evi-dence from the Survey of Consumer Finances.” Federal Reserve Bulletin, Vol. 98, No. 2 ( June 2012), pp. 17-21.
JPM-ADELSON.indd 30JPM-ADELSON.indd 30 4/11/13 5:01:03 PM4/11/13 5:01:03 PM
THE JOURNAL OF PORTFOLIO MANAGEMENT 31SPRING 2013
Churchill, W.S. The Second World War. Volume I: The Gath-ering Storm. Boston: Houghton Miff lin, 1948, pp. 310-311.
Congressional Budget Office. “The Budget and Economic Outlook: Fiscal Years 2012 to 2022.” January 2012.
CoreLogic. “CoreLogic Reports More Than 860,000 Com-pleted Foreclosures Nationally in the Last Twelve Months.” Press release, March 25, 2012a.
——. “Corelogic Reports Negative Equity Increase in Q4 2011.” Press release, March 1, 2012b.
Federal Housing Finance Agency, Off ice of Inspector General. “Fannie Mae and Freddie Mac: Where the Tax-payer’s Money Went.” White paper WPR-2012-02, May 24, 2012.
Felkerson, J. “A Detailed Look at the Fed’s Crisis Response by Funding Facility and Recipient.” Levy Economics Institute of Bard College, Public Policy Brief No. 123, April 2012.
Financial Crisis Inquiry Commission (FCIC). Financial Crisis Inquiry Report, January 2011.
“Foreclosures (2012 Robosigning and Mortgage Servicing Settlement).” New York Times, Times Topics online, April 2, 2012. Available at http://topics.nytimes.com/top/reference/timestopics/subjects/f/foreclosures/index.html
Goldman, D. “CNNMoney.com’s Bailout Tracker.” CNNMoney.com November 16, 2009. Available at http://money.cnn.com/news/stor y supplement/economy/bailouttracker/index.html
Goodman, L. Testimony of Laurie S. Goodman, Amherst Secu-rities Group to the U.S. Senate Subcommittee on Housing, Transportation and Community Development, on Strength-ening the Housing Market and Minimizing Losses to Tax-payers, March 15, 2012.
——. “Robosigners and Other Servicing Failures: Protecting the Rights of RMBS Investors.” Presentation on Graise and Ellsworth conference call, October 27, 2010.
Gross, W. “Mooooooo!” PIMCO Investment Outlook, August 2008.
International Monetary Fund. Global Financial Stability Report, October 2008.
——. Global Financial Stability Report, April 2009.
Kelleher, D., S. Hall, and K. Bradley. “The Cost of the Wall Street-Caused Financial Collapse and Ongoing Economic Crisis Is More Than $12.8 Trillion.” Better Markets, Sep-tember 2012.
Krueger, A. “Statement for the Treasury Borrowing Advisory Committee of the Securities Industry and Financial Mar-kets Association.” Treasury Department press release, May 3, 2012.
Kuntz, P., and B. Ivry. “Fed Once-Secret Loan Crisis Data Compiled by Bloomberg Released to Public.” Bloomberg News, December 23, 2011.
Lewis, M. The Big Short—Inside the Doomsday Machine. New York: W.W. Norton, 2010.
Lo, A. “Reading about the Financial Crisis: A 21-Book Review.” Working paper, January 9, 2012.
Mortgage Bankers Association. “Delinquencies Decline in Latest MBS Mortgage Delinquency Survey.” Press release, May 16, 2012.
Setia, R., J. Ma, N. Strand, S. Velayudham, and D. Chen. “GSEs: Back to the Future.” Barclays Capital Interest Rates Research, December 11, 2009, p. 5.
U.S. Census Bureau. Statistical Abstract of the United States, 2010 edition.
U.S. Treasury Department. “The Financial Crisis Response in Charts.” April 2012. Available at www.treasury.gov/resource-center/data-chart-center/Documents/20120413_FinancialCrisisResponse.pdf
Weill, J. “Dream of Taxpayer Bailout Profit Is Just That.” Bloomberg News, April 19, 2012.
To order reprints of this article, please contact Dewey Palmieri at [email protected] or 212-224-3675.
JPM-ADELSON.indd 31JPM-ADELSON.indd 31 4/11/13 5:01:03 PM4/11/13 5:01:03 PM