Embed Size (px)
Citation preview

FEDERAL RESERVE BANK OF ST. LOUIS REVIEW NOVEMBER/DECEMBER 2007 491
The Decline in the U.S. Personal Saving Rate:Is It Real and Is It a Puzzle?
Massimo Guidolin and Elizabeth A. La Jeunesse
Since the mid-1990s, the national income and product accounts personal saving rate for theUnited States has been trending down, dropping into negative territory for three months duringthe past two years. This paper examines measurement problems surrounding two of the standarddefinitions of the personal saving rate. The authors conclude that, despite these measurementproblems, the recent decline of the U.S. personal saving rate to low levels seems to be a real eco-nomic phenomenon and may be a cause for concern for several reasons. After examining severalpossible explanations for the trend advanced in the recent literature, the authors conclude thatnone of them provides a compelling explanation for the steep decline and negative levels of theU.S. personal saving rate. (JEL D10, E21)
Federal Reserve Bank of St. Louis Review, November/December 2007, 89(6), pp. 491-514.
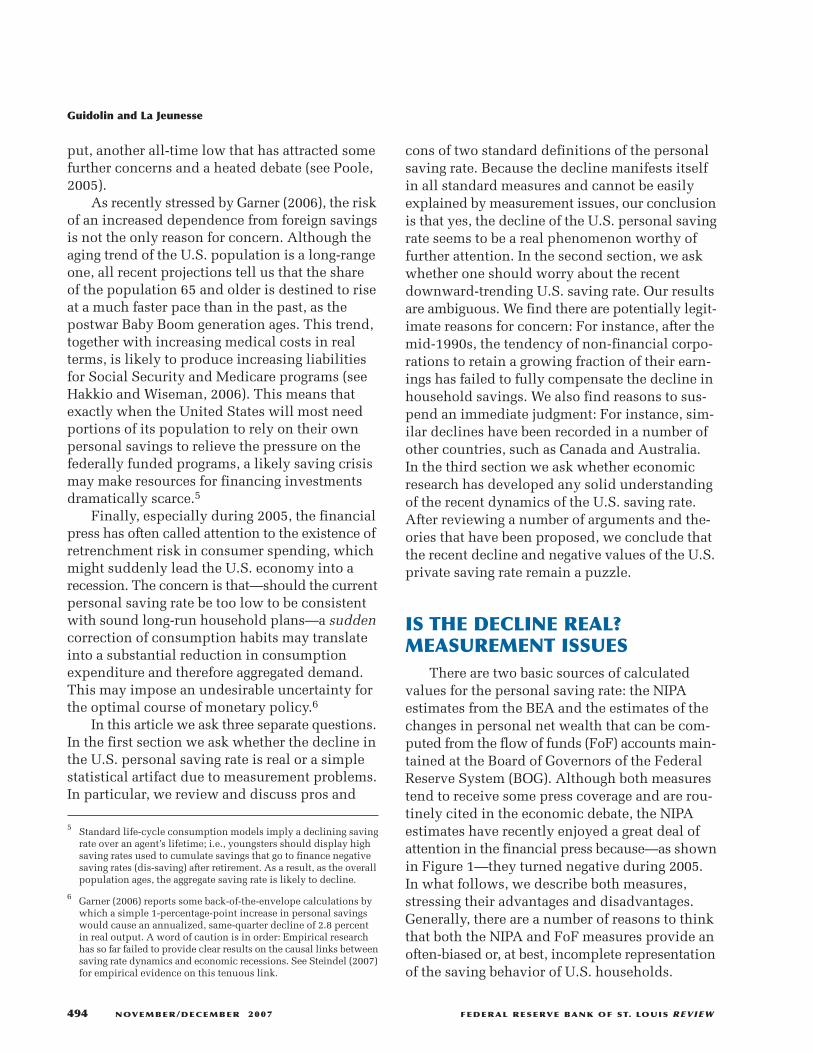
rate, as currently measured, is at its lowest levelsince 1933, the bleakest year of the GreatDepression. Of course, this historical comparisonis disturbing at a minimum. Moreover, monthlydata on household debt service payments as apercent of personal income have reached all timehighs (see Poole, 2007).
The strongly declining trend in Figure 1 posesa number of problems. Taken at face value, anegative personal saving rate simply means thatU.S. households are consuming more than theirafter-tax income allows them to. This tendencyseems to be structural: For instance, the U.S.personal saving rate has remained persistentlynon-positive since April 2005. One naturallywonders whether it really can be true that theUnited States has become a spendthrift nation.
On a deeper level, many researchers andcommentators have expressed a concern that therecent down-trending behavior of the U.S. per-sonal saving rate may pave the way to a structuraland persistent dependence of the U.S. economyon savings coming from foreign individuals and
The national income and productaccounts (NIPA) personal saving ratecomputed by the Bureau of EconomicAnalysis (BEA) includes households
and other nonprofit institutions and entities (suchas charities and churches), and it is calculatedsimply by taking the difference between dispos-able personal income (essentially, incomes of allkinds minus taxes) and personal consumptionexpenditures (outlays including non-mortgageinterest payments), then dividing this quantity(i.e., personal saving) by disposable personalincome (see Figure 1).1
In the past two decades, the widely reportedNIPA personal saving rate for the United Stateshas been trending down, dropping from averagesof around 9 percent in the 1980s, to approximately5 percent in the 1990s, to almost zero in the firstyears of the new century. Recent reports in themedia have alerted the public that the U.S. saving
1 In Figure 1, the dotted curve represents the NIPA personal savingrate reported by the BEA after the revision of July 31, 2007.
Massimo Guidolin is an assistant vice president and Elizabeth A. La Jeunesse was a senior research associate at the Federal Reserve Bank ofSt. Louis. The authors thank Bill Gavin, Bill Poole, and Bob Rasche for comments and encouragement on previous drafts of this manuscript.
© 2007, The Federal Reserve Bank of St. Louis. Articles may be reprinted, reproduced, published, distributed, displayed, and transmitted intheir entirety if copyright notice, author name(s), and full citation are included. Abstracts, synopses, and other derivative works may be madeonly with prior written permission of the Federal Reserve Bank of St. Louis.

firms, in the form of structural current accountdeficits.2 As argued by a number of authors (seePoole, 2005, for a review of the basic arguments),a situation in which the U.S. net internationalinvestment position keeps growing more negative
as a percentage of gross domestic product (GDP)is inconsistent with long-run equilibrium: In sucha situation, no debtor in the international financialmarket would be allowed to expand his position(as a percentage of output) without bounds.Because an adjustment is eventually inevitable,running a large current account deficit thenbecomes a risky strategy; hard landings—reduc-tions of the international net debt position basedon painful and disruptive adjustments in thedomestic economy—may not be ruled out ex ante.
From simple macroeconomic principles, it iswell known that the following accounting identitymust hold at all times:
private gross investment = personal saving+ business saving + net saving of the public sector
+ borrowing from foreigners (current account deficit)
In other words, a given level of investments(mostly by firms) may be financed by householdsavings, by public sector surpluses (when it col-lects more taxes than current expenditures and
Guidolin and La Jeunesse
492 NOVEMBER/DECEMBER 2007 FEDERAL RESERVE BANK OF ST. LOUIS REVIEW
2 From Poole (2007): “Reports in the financial press have discussedthe rapid accumulation of foreign exchange reserves by China, heldmostly in U.S. dollars, and speculated on the impact on U.S. interestrates and the dollar exchange rate should the Chinese choose todiversify a significant fraction of such holdings out of dollars.”According to economic theory, some uncertainty surrounds therelationship between running a large, persistently negative netinternational investment position and the future standard of livingof the citizens of a country. In complete and frictionless markets,capital should simply flow toward the most productive uses, i.e.to projects with positive net present value and with the highestmarginal return. Assuming that these projects systematically hap-pen “to appear” within the U.S. borders, capital should keep flow-ing without any limits and this would raise the standard of livingboth in the United States and abroad. Of course, in reality, inter-national capital markets are segmented and far from frictionless,and “states” (events) exist that—because large national economiesare involved—are hardly insurable. All of these factors corroboratethe contention that there are limits to the current account deficitsthat the United States may incur. For recent examples of papersthat have discussed the notion of an optimal external debt ratioon the basis of frictions and market incompleteness, see, e.g.,Fleming and Stein (2004) and Guimaraes (2007).
–4
–2
0
2
4
6
8
10
12
14
16
1970 1972 1974 1976 1978 1980 1982 1984 1986 1988 1990 1992 1994 1996 1998 2000 2002 2004 2006
July 31, 2007, Revision
Percent of Disposable Personal Income
Figure 1
NIPA: Personal Saving as a Percent of Disposable Personal Income (monthly, SA)
NOTE: Shaded bars indicate recessions.
SOURCE: Bureau of Economic Analysis.

transfers), and by foreign investment. Of course,firms themselves may elect to retain some of theircurrent earnings (profits) to finance future invest-ments. Usually we assume that the public sectorwill not be able to set aside consistent savings,whereas according to simple logic, firms ought tobe investing more resources than simply retainedearnings.3 This leaves only two other possiblesources of funds to finance gross investments:personal saving and borrowing from abroad.Consequently, because we have argued that it issensible to think that a country would want toavoid large current account (external) deficits forprotracted periods (to avoid building up massiveinternational debt positions),4 it is usually con-
sidered healthy (sustainable) that, at least in thelong-run,
private gross investment ≤ (personal saving+ business saving) � private saving,
i.e., that total private saving should at least covertotal gross investment, or
(1) private gross investment – business saving≤ personal saving.
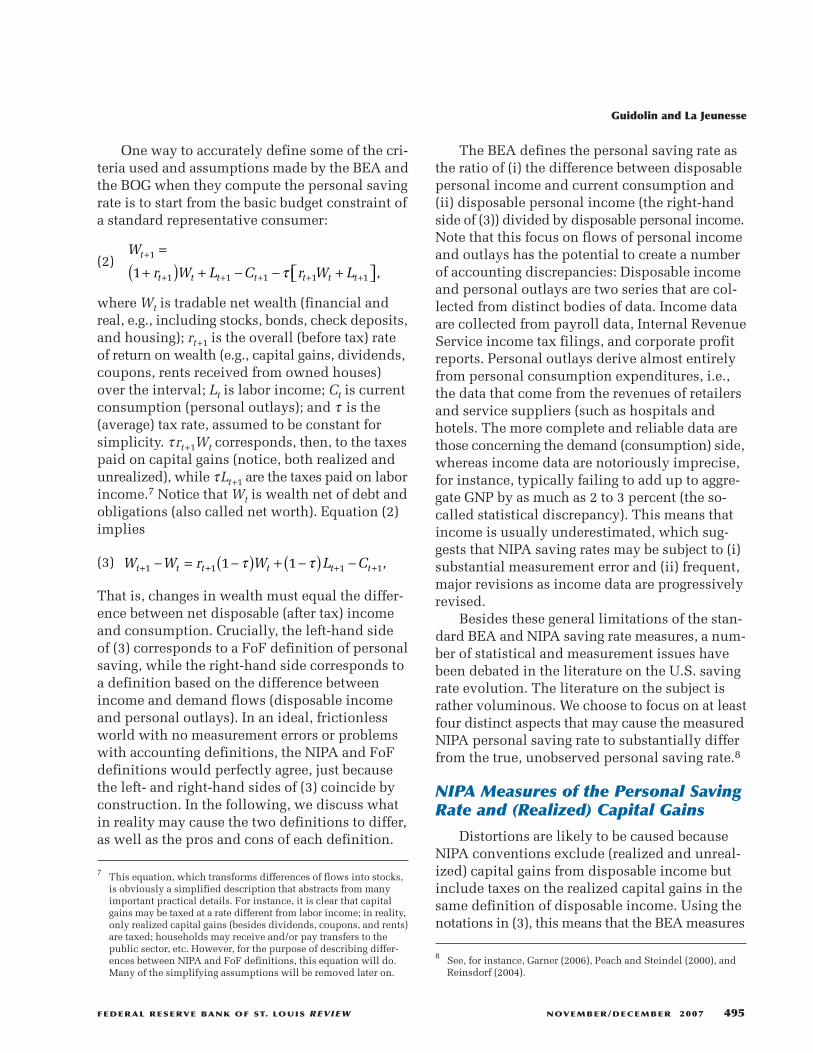
Given the presumption that the left-hand sidewill be positive most of the time, it is obviousthat this inequality cannot be satisfied when per-sonal saving turns negative for long periods oftime. In fact, Figure 2 shows that, since 1999,private gross investment has systematicallyexceeded private saving. Moreover, at the end of2005, the U.S. net international investment posi-tion was reported to be over –20 percent of out-
Guidolin and La Jeunesse
FEDERAL RESERVE BANK OF ST. LOUIS REVIEW NOVEMBER/DECEMBER 2007 493
–5
–3
–1
1
3
5
7
1983 1985 1987 1989 1991 1993 1995 1997 1999 2001 2003 2005
Percent of GNP
Figure 2
Private Saving Less Gross Investment as a Percent of GNP (quarterly, SA)
SOURCE: Bureau of Economic Analysis, Federal Reserve Board.
3 This does not mean that the saving of the public sector cannot bepositive, although it usually tends to be limited. For instance,between 1980 and 2006 the average ratio between public sectorsavings (budget surpluses) and GNP has been –2.2 percent. Addi-tionally, the recent debate on the future of the Medicare and SocialSecurity programs implies that most experts predict large andgrowing federal budget deficits (negative savings of the publicsector) for a few decades to come.
4 Using Gale and Sabelhaus’s (1999, p. 182) wording, this “breedsincreasing dependence on fickle foreign capital.”
put, another all-time low that has attracted somefurther concerns and a heated debate (see Poole,2005).
As recently stressed by Garner (2006), the riskof an increased dependence from foreign savingsis not the only reason for concern. Although theaging trend of the U.S. population is a long-rangeone, all recent projections tell us that the shareof the population 65 and older is destined to riseat a much faster pace than in the past, as thepostwar Baby Boom generation ages. This trend,together with increasing medical costs in realterms, is likely to produce increasing liabilitiesfor Social Security and Medicare programs (seeHakkio and Wiseman, 2006). This means thatexactly when the United States will most needportions of its population to rely on their ownpersonal savings to relieve the pressure on thefederally funded programs, a likely saving crisismay make resources for financing investmentsdramatically scarce.5
Finally, especially during 2005, the financialpress has often called attention to the existence ofretrenchment risk in consumer spending, whichmight suddenly lead the U.S. economy into arecession. The concern is that—should the currentpersonal saving rate be too low to be consistentwith sound long-run household plans—a suddencorrection of consumption habits may translateinto a substantial reduction in consumptionexpenditure and therefore aggregated demand.This may impose an undesirable uncertainty forthe optimal course of monetary policy.6
In this article we ask three separate questions.In the first section we ask whether the decline inthe U.S. personal saving rate is real or a simplestatistical artifact due to measurement problems.In particular, we review and discuss pros and
cons of two standard definitions of the personalsaving rate. Because the decline manifests itselfin all standard measures and cannot be easilyexplained by measurement issues, our conclusionis that yes, the decline of the U.S. personal savingrate seems to be a real phenomenon worthy offurther attention. In the second section, we askwhether one should worry about the recentdownward-trending U.S. saving rate. Our resultsare ambiguous. We find there are potentially legit-imate reasons for concern: For instance, after themid-1990s, the tendency of non-financial corpo-rations to retain a growing fraction of their earn-ings has failed to fully compensate the decline inhousehold savings. We also find reasons to sus-pend an immediate judgment: For instance, sim-ilar declines have been recorded in a number ofother countries, such as Canada and Australia.In the third section we ask whether economicresearch has developed any solid understandingof the recent dynamics of the U.S. saving rate.After reviewing a number of arguments and the-ories that have been proposed, we conclude thatthe recent decline and negative values of the U.S.private saving rate remain a puzzle.
IS THE DECLINE REAL?MEASUREMENT ISSUES
There are two basic sources of calculatedvalues for the personal saving rate: the NIPAestimates from the BEA and the estimates of thechanges in personal net wealth that can be com-puted from the flow of funds (FoF) accounts main-tained at the Board of Governors of the FederalReserve System (BOG). Although both measurestend to receive some press coverage and are rou-tinely cited in the economic debate, the NIPAestimates have recently enjoyed a great deal ofattention in the financial press because—as shownin Figure 1—they turned negative during 2005.In what follows, we describe both measures,stressing their advantages and disadvantages.Generally, there are a number of reasons to thinkthat both the NIPA and FoF measures provide anoften-biased or, at best, incomplete representationof the saving behavior of U.S. households.
5 Standard life-cycle consumption models imply a declining savingrate over an agent’s lifetime; i.e., youngsters should display highsaving rates used to cumulate savings that go to finance negativesaving rates (dis-saving) after retirement. As a result, as the overallpopulation ages, the aggregate saving rate is likely to decline.
6 Garner (2006) reports some back-of-the-envelope calculations bywhich a simple 1-percentage-point increase in personal savingswould cause an annualized, same-quarter decline of 2.8 percentin real output. A word of caution is in order: Empirical researchhas so far failed to provide clear results on the causal links betweensaving rate dynamics and economic recessions. See Steindel (2007)for empirical evidence on this tenuous link.
Guidolin and La Jeunesse
494 NOVEMBER/DECEMBER 2007 FEDERAL RESERVE BANK OF ST. LOUIS REVIEW
One way to accurately define some of the cri-teria used and assumptions made by the BEA andthe BOG when they compute the personal savingrate is to start from the basic budget constraint ofa standard representative consumer:
(2)
whereWt is tradable net wealth (financial andreal, e.g., including stocks, bonds, check deposits,and housing); rt+1 is the overall (before tax) rateof return on wealth (e.g., capital gains, dividends,coupons, rents received from owned houses)over the interval; Lt is labor income; Ct is currentconsumption (personal outlays); and τ is the(average) tax rate, assumed to be constant forsimplicity. τ rt+1Wt corresponds, then, to the taxespaid on capital gains (notice, both realized andunrealized), while τLt+1 are the taxes paid on laborincome.7 Notice thatWt is wealth net of debt andobligations (also called net worth). Equation (2)implies
(3)
That is, changes in wealth must equal the differ-ence between net disposable (after tax) incomeand consumption. Crucially, the left-hand sideof (3) corresponds to a FoF definition of personalsaving, while the right-hand side corresponds toa definition based on the difference betweenincome and demand flows (disposable incomeand personal outlays). In an ideal, frictionlessworld with no measurement errors or problemswith accounting definitions, the NIPA and FoFdefinitions would perfectly agree, just becausethe left- and right-hand sides of (3) coincide byconstruction. In the following, we discuss whatin reality may cause the two definitions to differ,as well as the pros and cons of each definition.
W W r W L Ct t t t t t+ + + +− = −( ) + −( ) −1 1 1 11 1τ τ ,
W
r W L C r W Lt
t t t t t t t
+
+ + + + +
=
+( ) + − − +
1
1 1 1 1 11 τ ,
The BEA defines the personal saving rate asthe ratio of (i) the difference between disposablepersonal income and current consumption and(ii) disposable personal income (the right-handside of (3)) divided by disposable personal income.Note that this focus on flows of personal incomeand outlays has the potential to create a numberof accounting discrepancies: Disposable incomeand personal outlays are two series that are col-lected from distinct bodies of data. Income dataare collected from payroll data, Internal RevenueService income tax filings, and corporate profitreports. Personal outlays derive almost entirelyfrom personal consumption expenditures, i.e.,the data that come from the revenues of retailersand service suppliers (such as hospitals andhotels. The more complete and reliable data arethose concerning the demand (consumption) side,whereas income data are notoriously imprecise,for instance, typically failing to add up to aggre-gate GNP by as much as 2 to 3 percent (the so-called statistical discrepancy). This means thatincome is usually underestimated, which sug-gests that NIPA saving rates may be subject to (i)substantial measurement error and (ii) frequent,major revisions as income data are progressivelyrevised.
Besides these general limitations of the stan-dard BEA and NIPA saving rate measures, a num-ber of statistical and measurement issues havebeen debated in the literature on the U.S. savingrate evolution. The literature on the subject israther voluminous. We choose to focus on at leastfour distinct aspects that may cause the measuredNIPA personal saving rate to substantially differfrom the true, unobserved personal saving rate.8
NIPA Measures of the Personal SavingRate and (Realized) Capital Gains
Distortions are likely to be caused becauseNIPA conventions exclude (realized and unreal-ized) capital gains from disposable income butinclude taxes on the realized capital gains in thesame definition of disposable income. Using thenotations in (3), this means that the BEAmeasures
Guidolin and La Jeunesse
FEDERAL RESERVE BANK OF ST. LOUIS REVIEW NOVEMBER/DECEMBER 2007 495
7 This equation, which transforms differences of flows into stocks,is obviously a simplified description that abstracts from manyimportant practical details. For instance, it is clear that capitalgains may be taxed at a rate different from labor income; in reality,only realized capital gains (besides dividends, coupons, and rents)are taxed; households may receive and/or pay transfers to thepublic sector, etc. However, for the purpose of describing differ-ences between NIPA and FoF definitions, this equation will do.Many of the simplifying assumptions will be removed later on.
8 See, for instance, Garner (2006), Peach and Steindel (2000), andReinsdorf (2004).
disposable income as �1 – τ �Lt+1 – ρt+1τWt andnot as �1 – τ �Lt+1 – rt+1�1 – τ �Wt, where ρt+1 ≠ rt+1is the realized rate of return on wealth (i.e., inclu-sive only of realized, actual capital gains that havebeen transformed into cash). The difference isgiven by the term
(4)
which may be sometimes substantial and—evenwhen ρt+1 = rt+1, that is, all capital gains are real-ized—never disappears as long as rt+1 ≠ 0. For-mally, this means that while the NIPA personalsaving rate is measured to be
the true (but unobserved) rate should be
A few straightforward manipulations show thatthe unobservable personal saving rate can bewritten as
(5)
For reasonable values of the quantities involved—essentially, when labor income represents a non-negligible fraction of total initial net worth forhouseholds and for plausible tax rates becausethe coefficient κ 0
t+1 < 1 will be relatively close to1, but less than 1, while κ 1
t+1 will be positive—st+1 > st+1NIPA follows.9 This means that, provided
s
L WL r W
t
t t t
t t
+
+ +
+ +
=
−( ) −−( ) + −( )
1
1 1
1 1
11 1
τ ρ ττ τ tt
tNIPA t t t t
t
sr W r
κ
ρ
+
++ ++
+ −
10
11 1
1 244444 344444
++
+ +
( )−( ) −
+
1
1 11
11
ττ ρ τ
κ
W
L Wt
t t t
t
1 24444 34444
+ + +
,
+ .s st tNIPA
t1 1 11; κ
sL r W C
L rtt t t t
t t+
+ +
+ +=
−( ) − −( ) −−( ) −1
1 1
1
1 11τ τ
τ 11 1 −( )τ Wt
.
sL W C
LtNIPA t t t t
t t+
+ + +
+=
−( ) − −−( ) −1
1 1 1
1
11τ ρ τ
τ ρ ++1τWt
,
r W r Wt t t t t+ + ++ −( )1 1 1ρ τ ,
that the average tax rate and (realized and total)rates of return on assets are not too large, the NIPApersonal saving rate is bound to systematicallyunderestimate the true personal saving rate.Approximating (5) for the simple case in whichρt+1 = rt+1 and ρt+1τ � 0, we obtain
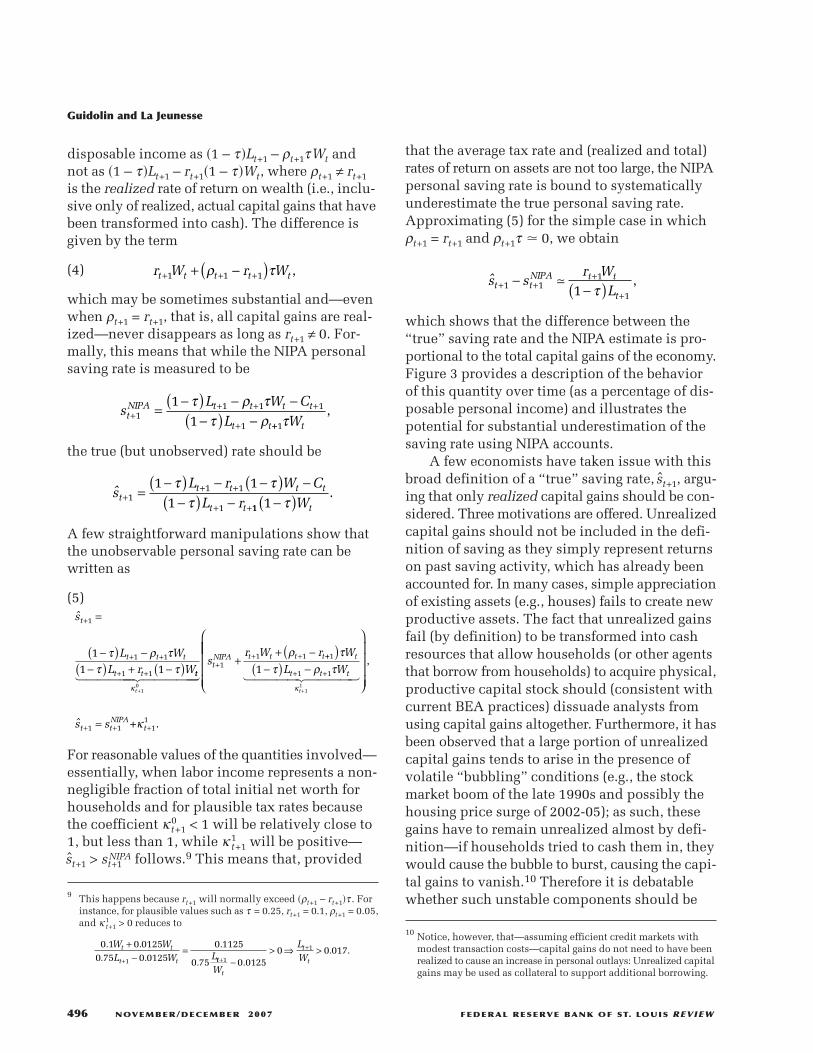
which shows that the difference between the“true” saving rate and the NIPA estimate is pro-portional to the total capital gains of the economy.Figure 3 provides a description of the behaviorof this quantity over time (as a percentage of dis-posable personal income) and illustrates thepotential for substantial underestimation of thesaving rate using NIPA accounts.
A few economists have taken issue with thisbroad definition of a “true” saving rate, st+1, argu-ing that only realized capital gains should be con-sidered. Three motivations are offered. Unrealizedcapital gains should not be included in the defi-nition of saving as they simply represent returnson past saving activity, which has already beenaccounted for. In many cases, simple appreciationof existing assets (e.g., houses) fails to create newproductive assets. The fact that unrealized gainsfail (by definition) to be transformed into cashresources that allow households (or other agentsthat borrow from households) to acquire physical,productive capital stock should (consistent withcurrent BEA practices) dissuade analysts fromusing capital gains altogether. Furthermore, it hasbeen observed that a large portion of unrealizedcapital gains tends to arise in the presence ofvolatile “bubbling” conditions (e.g., the stockmarket boom of the late 1990s and possibly thehousing price surge of 2002-05); as such, thesegains have to remain unrealized almost by defi-nition—if households tried to cash them in, theywould cause the bubble to burst, causing the capi-tal gains to vanish.10 Therefore it is debatablewhether such unstable components should be
s sr W
Lt tNIPA t t
t+ +
+
+−
−( )1 11
11;
τ,
9 This happens because rt+1 will normally exceed �ρt+1 – rt+1�τ . Forinstance, for plausible values such as τ = 0.25, rt+1 = 0.1, ρt+1 = 0.05,and κ 1
t+1 > 0 reduces to
0 1 0 01250 75 0 0125
0 1125
0 751
. .. .
.
.
W WL W L
t t
t t
+−
=+ tt
t
t
t
W
LW+
+
−> ⇒ >
1
1
0 01250 0 017
.. .
Guidolin and La Jeunesse
496 NOVEMBER/DECEMBER 2007 FEDERAL RESERVE BANK OF ST. LOUIS REVIEW
10 Notice, however, that—assuming efficient credit markets withmodest transaction costs—capital gains do not need to have beenrealized to cause an increase in personal outlays: Unrealized capitalgains may be used as collateral to support additional borrowing.

considered as part of private saving. Third, inthe empirical literature, considerable debate per-sists as to what fraction of such unrealized capitalgains might be actually increasing saving (thecomplement of the so-called “wealth effect” onconsumption).11 When only realized capital gainsare considered, the true (but unobserved) personalsaving rate is defined as
%sL W C
Ltt t t t
t t+
+ +
+ +=
−( ) + −( ) −−( ) +1
1 1
1
1 11τ ρ τ
τ ρ 11 1 −( )τ Wt
,
with the implication that
(6)
For reasonable values of the quantities involved,one can show that st+1 > st+1NIPA. Once more, theNIPA personal saving rate will systematicallyunderestimate the true personal saving rate. Asa first approximation, the amount of the bias isincreasing in (proportional to) both the amount ofrealized capital gains, ρt+1Wt, and in the amountof taxes paid on the realized capital gains.12
Figures 4 and 5 show that the recent decline inthe measured NIPA saving rate occurred simulta-
%s
L WL W
t
t t t
t t
+
+ +
+ +
=
−( ) −−( ) + −( )
1
1 1
1 1
11 1
τ ρ ττ ρ τ tt
tNIPA t t
t
t
sW
L
κ
ρτ
+
++
++
−( )1
0
11
11 244444 344444 11 1−
+ρ τt tW.
Guidolin and La Jeunesse
FEDERAL RESERVE BANK OF ST. LOUIS REVIEW NOVEMBER/DECEMBER 2007 497
11 In the empirical literature, estimates are rather heterogeneous.Among many others, Poterba (2000) reports a tiny 3 percent elastic-ity of consumption to wealth, while Parker (2000) finds 4 percent.Ludvigson and Steindel (1999) report that the elasticity is smalland the effect quickly dies out after one quarter. Such low estimatesof the elasticity of consumption to wealth imply that most of theunrealized capital gains might be converted into savings. On theother hand, Juster et al. (2006) found a massive 19 percent elasticityfor stock price increases, although the overall effect of wealthincreases is consistent with the standard 3 percent in the literature.Therefore the impact of capital gains on saving might be muchhigher for housing (and other assets) than it is for equities.
–10
–5
0
5
10
15
1954 1957 1960 1963 1966 1969 1972 1975 1978 1981 1984 1987 1990 1993 1996 1999 2002 2005
Percent of Disposable Personal Income
Figure 3
Total Capital Gains (Losses) as a Percent of Disposable Personal Income (eight-quarter movingaverage)
SOURCE: Federal Reserve Board.
12 Formal differentiation shows that the derivatives versus the taxrate and the realized capital gain rate of the term that is added tostNIPA inside the parenthesis are both positive.

Guidolin and La Jeunesse
498 NOVEMBER/DECEMBER 2007 FEDERAL RESERVE BANK OF ST. LOUIS REVIEW
–50
50
150
250
350
450
550
650
1954 1957 1960 1963 1966 1969 1972 1975 1978 1981 1984 1987 1990 1993 1996 1999 2002 2005
Total Realized Capital Gains
NIPA Personal Saving
$ Billions
Figure 4
NIPA Personal Saving and Total Realized Capital Gains (annual)
SOURCE: Bureau of Economic Analysis, U.S. Treasury.
0
20
40
60
80
100
120
140
1970 1972 1974 1976 1978 1980 1982 1984 1986 1988 1990 1992 1994 1996 1998 2000 2002 20040.0
0.2
0.4
0.6
0.8
1.0
1.2
1.4
1.6
1.8
2.0
$ Billions Percent
Taxes Paid by Individuals on Capital Gains
Percent of Disposable Personal Income
Figure 5
Capital Gains Tax Receipts Excluded from NIPA Disposable Personal Income (annual)
SOURCE: Bureau of Economic Analysis, U.S. Treasury.

neously with high realized capital gains and highcapital gains taxes. Therefore a possibility existsthat a substantial portion of the recent declinemay be simply imputed to increasing biases(underestimation) in NIPA measures. Moreover,the capital gains issue is likely to become increas-ingly important not just because stock marketgains have been substantial in recent years, butalso because companies are using more and moreshare repurchases (and not cash dividends) todistribute profits to the shareholders. Share repur-chases tend to increase stock prices, yieldingcapital gains to shareholders that do not appearin personal income. If companies increasinglyuse share repurchases instead of dividends—which seems to characterize recent data—theresult would be to create a growing downwardbias in the measured NIPA saving rate.
Notice, however, that the most recent dramaticdip in the measured NIPA saving rate (during2005) corresponds to a decline in the taxes paidon realized capital gains and—absent any majorfiscal reform—in the realized capital gains them-selves. In summary, although the NIPA measureof the personal saving rate is likely to underesti-mate the true, unobservable rate by a few percent-age points, and some logical inconsistencies existin the NIPA treatment of capital gains, it is diffi-cult to conclude that these discrepancies entirelyexplain the declining trend in the NIPA measureor—especially—the negative saving rates thathave been reported during 2005.
NIPA Measures of the Personal SavingRate and Pension Schemes
A second, obvious flaw of NIPA measures ofthe personal saving rate is that the methodologicalcriteria of the BEA exclude pension benefitsreceived as disposable income, but deduct frompersonal disposable income the contributionspaid into pension funds. Call the net pensionbenefits npbt+1, defined as the difference betweengross benefits (transfers) received (pbt+1) andcontributions �pct+1�, npbt+1 � pbt+1 – pct+1. Thencalculations similar to those performed aboveshow that, although the NIPA personal savingrate is calculated as
the true but unobserved personal saving rate is
Once more, if the ratio that precedes the sum inparenthesis is approximately 1, then, becausest+1 > st+1NIPA, the NIPA rate will systematicallyunderestimate the actual saving rate. Figure 6shows that the amount of net pension benefitsreceived by U.S. households has substantiallyincreased (as a percentage of the NIPA personaldisposable income) since the mid-1990s, peakingat roughly 4 percent in 2001. As a result, it is likelythat a portion of the downward-trending NIPAestimate of st+1 may be due to omitting pensionbenefits, although the quantitative relevance ofthe bias is probably of second-order importance.For instance, a quantitative estimate of the termpbt+1/�1 – τ�Lt+1 as of the end of 2005 was approxi-mately 14 percent.13
Another, different issue concerns the way inwhich the BEA treats defined benefits (DB) pen-sion plans when computing the personal savingrate. NIPA estimates treat defined contribution(DC) plans in a perfectly consistent way: Becausethe employee directly owns the assets and retainsa substantial amount of control, it seems correctfor NIPA to include employers’ contributions andcapital gains and income as personal income andto consider the plan’s administrative expensesas personal outlays. With DB plans, however,employers make the investment decisions andbear the investment risks. Moreover, DB planscan be a source of cash flows only upon retire-
%s
L W pcL
t
t t t t
t t
+
+ +
+ +
=−( ) − −
−( ) + −
1
1 1
1 1
11 1
τ ρ ττ ρ ττ
ρτ
( ) + −
++
−( )
+
++ +
W npb C
sW pb
L
t t t
tNIPA t t t
1
11 1
1 tt t t tW pc+ +− −
1 1ρ τ
.
sL W pc C
LtNIPA t t t t t
t+
+ + +
+=
−( ) − − −−( )1
1 1 111τ ρ τ
τ 11 1− −+ρ τt t tW pc,
Guidolin and La Jeunesse
FEDERAL RESERVE BANK OF ST. LOUIS REVIEW NOVEMBER/DECEMBER 2007 499
13 Notice that NIPA’s treatment of IRAs and 401(k) plan contributions,for example, is perfectly consistent: Because these defined contri-butions are not part of personal outlays (and, therefore, must beincluded in the difference between personal income and per-sonal outlays), they are correctly included in national savingcomputations.

ment and potential plan surpluses generally failto be passed on to the employees to increase theirpension benefits. These latter two features wouldsuggest that DB plans should be considered inNIPA estimates of the personal saving rate, yetthey are. In principle, if one thinks that in recentyears DB plans have generated large net losses tohouseholds (i.e., that the employers’ contributionshave been modest relative to capital losses andadministrative expenses), excluding DB pensionplans from NIPA calculations may increase themeasured personal saving rate over the actual(unknown) rate. A further issue is that, althoughinvestment income on DC plans is treated as per-sonal income, payments out of both DC and DBplans are not. However, such payments are subjectto income taxes and these taxes reduce measuredpersonal disposable income—and hence the sav-ing rate—at the time the retirement benefits arepaid.
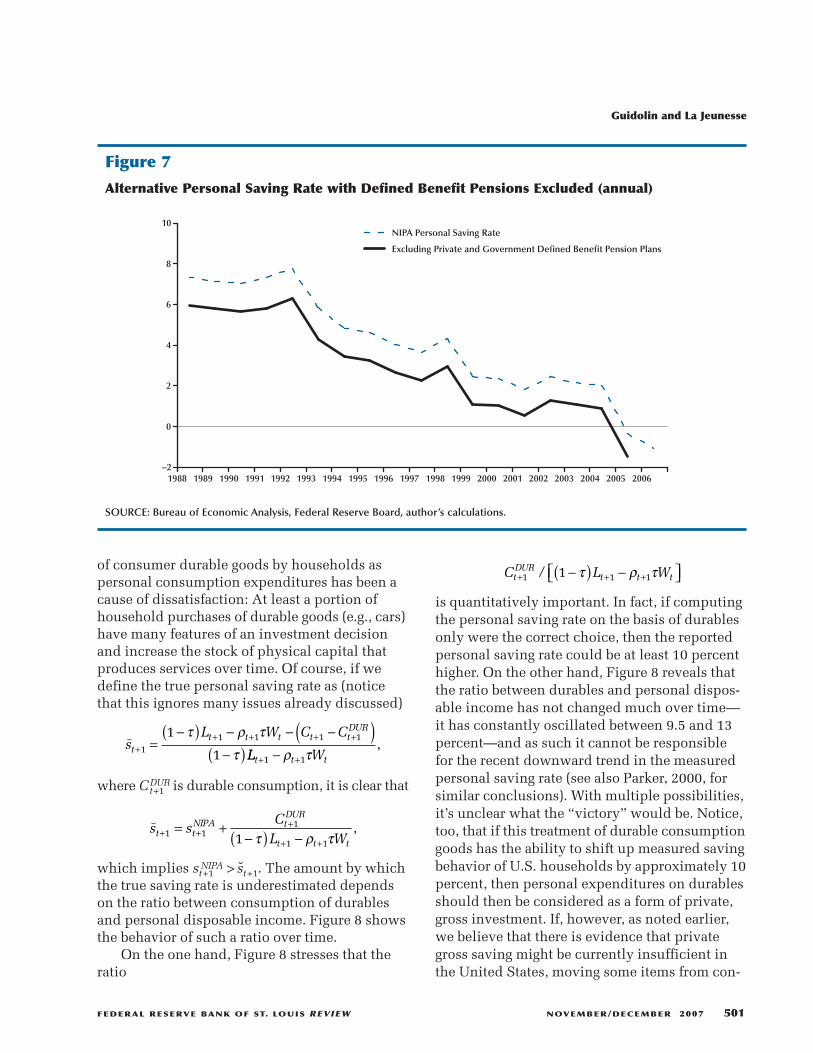
We therefore compute a modified NIPA savingrate that excludes DB pension plan-impliedincome and outlay components. First, we removefrom personal income the employer contributions
to DB plans as well as rental income, dividends,and interest; second, we add to personal incomethe benefits paid by DB plans net of employeecontributions; and third, we remove from per-sonal consumption expenditures the administra-tive expenses of DB pension. Figure 7 shows theresults. There are two obvious implications. First,excluding DB plans generates quantitative impli-cations of second-order importance. Second (andmore important), when DB incomes and outlaysare excluded, the implied personal saving rate isactually even lower than the official rate reportedby the BEA.14
Other Issues with the NIPA Measuresof the Personal Saving Rate
Economists and the financial press havefocused on a few other accounting issues in theirattempt to make sense of the recent decline (tonegative territory) of the U.S. personal saving rate.First, the BEA’s choice to consider net acquisitions
14 Reinsdorf (2007, p. 9) reaches similar conclusions with data up to2005.
Guidolin and La Jeunesse
500 NOVEMBER/DECEMBER 2007 FEDERAL RESERVE BANK OF ST. LOUIS REVIEW
0
50
100
150
200
250
300
350
1988 1989 1990 1991 1992 1993 1994 1995 1996 1997 1998 1999 2000 2001 2002 2003 2004 20051.0
1.5
2.0
2.5
3.0
3.5
4.0
4.5
$ Billions Percent
Net Pension Benefits
Net Pension Benefits as a Percent of Disposable Income
Figure 6
Net Pension Benefits (annual)
SOURCE: Bureau of Economic Analysis, U.S. Treasury.
of consumer durable goods by households aspersonal consumption expenditures has been acause of dissatisfaction: At least a portion ofhousehold purchases of durable goods (e.g., cars)have many features of an investment decisionand increase the stock of physical capital thatproduces services over time. Of course, if wedefine the true personal saving rate as (noticethat this ignores many issues already discussed)
where Ct+1DUR is durable consumption, it is clear that
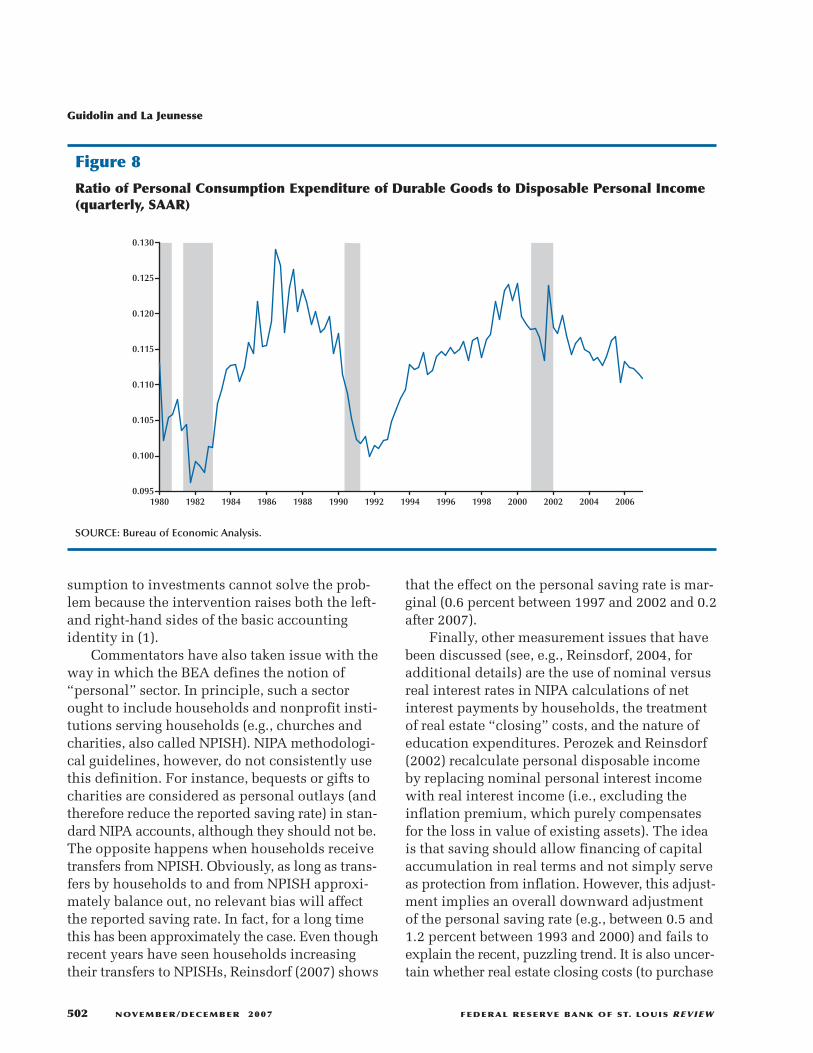
which implies st+1NIPA > st+1. The amount by whichthe true saving rate is underestimated dependson the ratio between consumption of durablesand personal disposable income. Figure 8 showsthe behavior of such a ratio over time.
On the one hand, Figure 8 stresses that theratio
(s s
CL Wt t
NIPA tDUR
t t t+ +
+
+ += +
−( ) −1 11
1 11 τ ρ τ,
(s
L W C Ct
t t t t tDUR
++ + + +=
−( ) − − −( )−( )1
1 1 1 11
1
τ ρ ττ LL Wt t t+ +−1 1ρ τ
,
is quantitatively important. In fact, if computingthe personal saving rate on the basis of durablesonly were the correct choice, then the reportedpersonal saving rate could be at least 10 percenthigher. On the other hand, Figure 8 reveals thatthe ratio between durables and personal dispos-able income has not changed much over time—it has constantly oscillated between 9.5 and 13percent—and as such it cannot be responsiblefor the recent downward trend in the measuredpersonal saving rate (see also Parker, 2000, forsimilar conclusions). With multiple possibilities,it’s unclear what the “victory” would be. Notice,too, that if this treatment of durable consumptiongoods has the ability to shift up measured savingbehavior of U.S. households by approximately 10percent, then personal expenditures on durablesshould then be considered as a form of private,gross investment. If, however, as noted earlier,we believe that there is evidence that privategross saving might be currently insufficient inthe United States, moving some items from con-
C L WtDUR
t t t+ + +−( ) − 1 1 11/ τ ρ τ
Guidolin and La Jeunesse
FEDERAL RESERVE BANK OF ST. LOUIS REVIEW NOVEMBER/DECEMBER 2007 501
–2
0
2
4
6
8
10
1988 1989 1990 1991 1992 1993 1994 1995 1996 1997 1998 1999 2000 2001 2002 2003 2004 2005 2006
NIPA Personal Saving Rate
Excluding Private and Government Defined Benefit Pension Plans
Percent
Figure 7
Alternative Personal Saving Rate with Defined Benefit Pensions Excluded (annual)
SOURCE: Bureau of Economic Analysis, Federal Reserve Board, author’s calculations.
sumption to investments cannot solve the prob-lem because the intervention raises both the left-and right-hand sides of the basic accountingidentity in (1).
Commentators have also taken issue with theway in which the BEA defines the notion of“personal” sector. In principle, such a sectorought to include households and nonprofit insti-tutions serving households (e.g., churches andcharities, also called NPISH). NIPA methodologi-cal guidelines, however, do not consistently usethis definition. For instance, bequests or gifts tocharities are considered as personal outlays (andtherefore reduce the reported saving rate) in stan-dard NIPA accounts, although they should not be.The opposite happens when households receivetransfers from NPISH. Obviously, as long as trans-fers by households to and from NPISH approxi-mately balance out, no relevant bias will affectthe reported saving rate. In fact, for a long timethis has been approximately the case. Even thoughrecent years have seen households increasingtheir transfers to NPISHs, Reinsdorf (2007) shows
that the effect on the personal saving rate is mar-ginal (0.6 percent between 1997 and 2002 and 0.2after 2007).
Finally, other measurement issues that havebeen discussed (see, e.g., Reinsdorf, 2004, foradditional details) are the use of nominal versusreal interest rates in NIPA calculations of netinterest payments by households, the treatmentof real estate “closing” costs, and the nature ofeducation expenditures. Perozek and Reinsdorf(2002) recalculate personal disposable incomeby replacing nominal personal interest incomewith real interest income (i.e., excluding theinflation premium, which purely compensatesfor the loss in value of existing assets). The ideais that saving should allow financing of capitalaccumulation in real terms and not simply serveas protection from inflation. However, this adjust-ment implies an overall downward adjustmentof the personal saving rate (e.g., between 0.5 and1.2 percent between 1993 and 2000) and fails toexplain the recent, puzzling trend. It is also uncer-tain whether real estate closing costs (to purchase
Guidolin and La Jeunesse
502 NOVEMBER/DECEMBER 2007 FEDERAL RESERVE BANK OF ST. LOUIS REVIEW
0.095
0.100
0.105
0.110
0.115
0.120
0.125
0.130
1980 1982 1984 1986 1988 1990 1992 1994 1996 1998 2000 2002 2004 2006
Figure 8
Ratio of Personal Consumption Expenditure of Durable Goods to Disposable Personal Income(quarterly, SAAR)
SOURCE: Bureau of Economic Analysis.

or mortgage a residence) should be consideredas current personal outlays or as investments.Reinsdorf (2004) concludes that the impact isquantitatively marginal. Education expendituresby households are treated by NIPA as current con-sumption expenditures, even though they obvi-ously increase the stock of human capital. Theirexclusion from personal outlays would increasemeasured personal saving but also increase grossprivate investments, which also does not seemto solve the puzzle under investigation.
Recently, NIPA revised its policies concern-ing the way in which stock options are treated.Currently, stock options are treated in a mannerconsistent with IRS practices: When exercised,options generate wage incomes to recipients andexpenses to corporations; however, holdings ofstock options fail to generate (non-realized) capitalgains before the option is exercised. This clearlycreates a potential for understating saving relativeto the perceptions of option holders. Yet, theNIPA measure of business profits usually fails toinclude stock options as a potential expenditurebefore expiration, and this also leads to the sys-tematic inflation of the estimates of business sav-ing, with compensating effects.15 In any event, theNIPA accounts show that total deferred compen-sations to workers (of which stock options are justone example) accounts for at most 0.3 percent ofpersonal income, and therefore hardly explainsthe recent, major swings in the saving rate.
The FoF Measure of the PersonalSaving Rate
Estimates of the assets and liabilities of thepersonal sector are available in the FoF accountsof the Federal Reserve BOG. These accounts alsoprovide estimates of holding gains and losses forassets such as real estate and corporate equities,including assets held indirectly through mutualfunds, pension funds, and life insurance con-
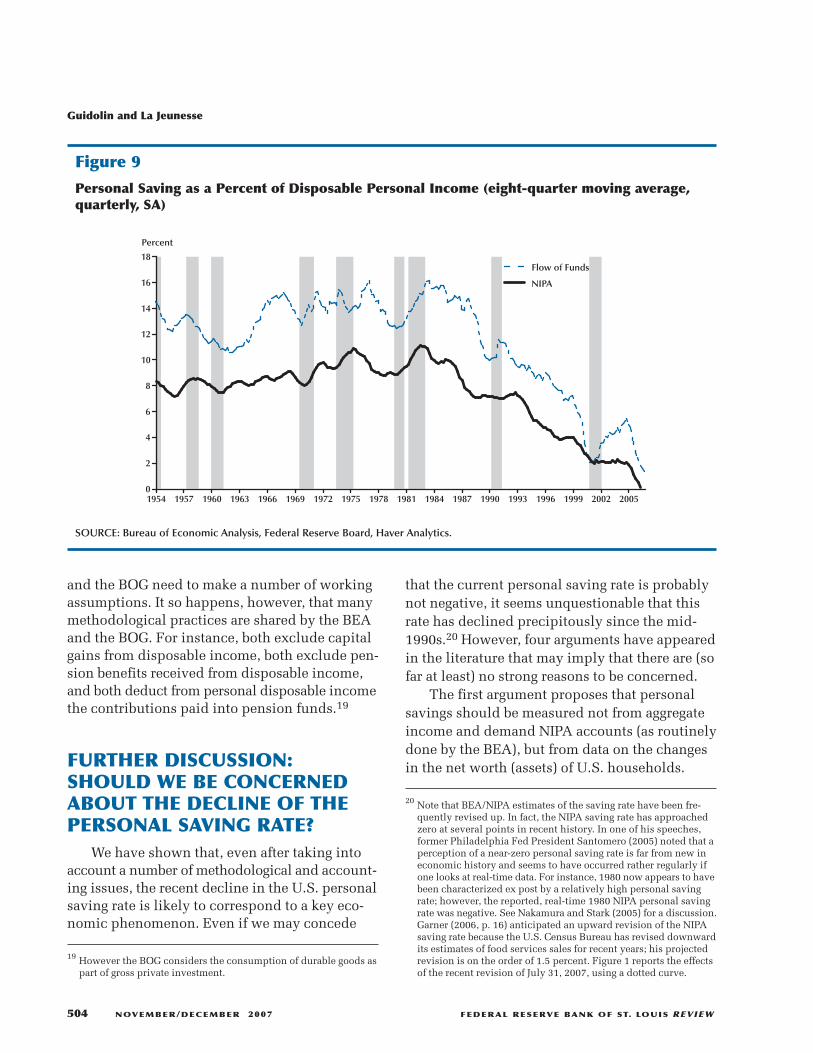
tracts. The main competing method to estimatethe saving rate can be derived from the FoFaccounts published by the BOG. In essence, weuse FoF data to estimate the left-hand side of (3).According to this FoF definition, the personalsaving rate is simply given by the ratio betweenthe change in the netwealth (net worth) of U.S.households and their disposable income. Ideally,the change in the value of the assets owned byU.S. households (net of their debt and obliga-tions) should be measured applying current mar-ket prices.16 Figure 9 compares this alternativenotion of the personal saving rate with the stan-dard NIPA estimate.17
Although over the sample period 1954-2006the two alternative measures provide rather differ-ent averages (11.3 percent for FoF statistics vs.7.3 percent for NIPA), their time-series behavioris quite similar; by the end of 2005, the FoF per-sonal saving rate also dips below 2 percent.18
Therefore it is clear that, although one feels com-pelled to provide an explanation for the recentdynamics of the saving rate when the FoF defini-tion is also adopted, it does not appear that adifference between –1 percent (based on NIPAcalculations) and +1.3 percent (based on FoFcalculations) at the end of 2006 is economicallymeaningful: The saving rate of U.S. householdsappears to be currently low and to have quicklytrended down after the mid-1990s.
What is the intuition for the finding that theFoF and NIPA estimates of the personal savingrate have been approximately identical (andsmall) after the turn of the century? In principle,this is a moot question because (3) tells us thatthe two measures should in principle give iden-tical results. In practice, this is an interestingquestion because it should be obvious that, whencalculating the quantities involved, both the BEA
Guidolin and La Jeunesse
FEDERAL RESERVE BANK OF ST. LOUIS REVIEW NOVEMBER/DECEMBER 2007 503
15 After 2003, the BEA began to incorporate stock-option adjustmentsin corporate profit estimates for the periods that are treated usingpublic financial reports. For example, the extrapolated corporateprofits estimates for 2002 and 2003 have been revised and—because the gains on exercised stock options declined from 2001to 2002—the result has been an increase in the BEA’s estimate ofcorporate profits for 2002.
16 However, debt instruments, such as bonds, are carried at bookvalue in the FoF accounts, so they are excluded from the calcula-tions of holding gains and losses.
17 To avoid devoting too much attention to high-frequency move-ments (induced by asset prices) that lack much economic meaning,we report eight-quarter moving averages of the seasonally adjustedFoF quarterly series.
18 The correlation between the two series is in fact almost perfect,0.96.
and the BOG need to make a number of workingassumptions. It so happens, however, that manymethodological practices are shared by the BEAand the BOG. For instance, both exclude capitalgains from disposable income, both exclude pen-sion benefits received from disposable income,and both deduct from personal disposable incomethe contributions paid into pension funds.19
FURTHER DISCUSSION:SHOULD WE BE CONCERNEDABOUT THE DECLINE OF THEPERSONAL SAVING RATE?
We have shown that, even after taking intoaccount a number of methodological and account-ing issues, the recent decline in the U.S. personalsaving rate is likely to correspond to a key eco-nomic phenomenon. Even if we may concede
that the current personal saving rate is probablynot negative, it seems unquestionable that thisrate has declined precipitously since the mid-1990s.20 However, four arguments have appearedin the literature that may imply that there are (sofar at least) no strong reasons to be concerned.
The first argument proposes that personalsavings should be measured not from aggregateincome and demand NIPA accounts (as routinelydone by the BEA), but from data on the changesin the net worth (assets) of U.S. households.
19 However the BOG considers the consumption of durable goods aspart of gross private investment.
Guidolin and La Jeunesse
504 NOVEMBER/DECEMBER 2007 FEDERAL RESERVE BANK OF ST. LOUIS REVIEW
0
2
4
6
8
10
12
14
16
18
1954 1957 1960 1963 1966 1969 1972 1975 1978 1981 1984 1987 1990 1993 1996 1999 2002 2005
Flow of Funds
NIPA
Percent
Figure 9
Personal Saving as a Percent of Disposable Personal Income (eight-quarter moving average,quarterly, SA)
SOURCE: Bureau of Economic Analysis, Federal Reserve Board, Haver Analytics.
20 Note that BEA/NIPA estimates of the saving rate have been fre-quently revised up. In fact, the NIPA saving rate has approachedzero at several points in recent history. In one of his speeches,former Philadelphia Fed President Santomero (2005) noted that aperception of a near-zero personal saving rate is far from new ineconomic history and seems to have occurred rather regularly ifone looks at real-time data. For instance, 1980 now appears to havebeen characterized ex post by a relatively high personal savingrate; however, the reported, real-time 1980 NIPA personal savingrate was negative. See Nakamura and Stark (2005) for a discussion.Garner (2006, p. 16) anticipated an upward revision of the NIPAsaving rate because the U.S. Census Bureau has revised downwardits estimates of food services sales for recent years; his projectedrevision is on the order of 1.5 percent. Figure 1 reports the effectsof the recent revision of July 31, 2007, using a dotted curve.
Additionally, and differently from the currentFoF practices of the BOG, this measure of savingsshould capture not only the acquisition cost ofnew assets, but also the sum of the acquisitioncosts and of the capital gains cumulated on thestock of existing wealth. For some types of appli-cations (and policy analysis) this seems to be anappropriate notion. For instance, if policymakersare concerned that a re-entrenchment effect maybe caused by retired households that need to cuttheir consumption because they are unable tosupport it, then there is little doubt that suchhouseholds would/could finance their standardsof living by selling assets in their net wealth, thus“cashing out” from their cumulated capital gains(see, e.g., Lusardi, 2000, p. 378).21 Many commen-tators have stressed that when capital gains areincluded in the picture, the U.S. personal saving
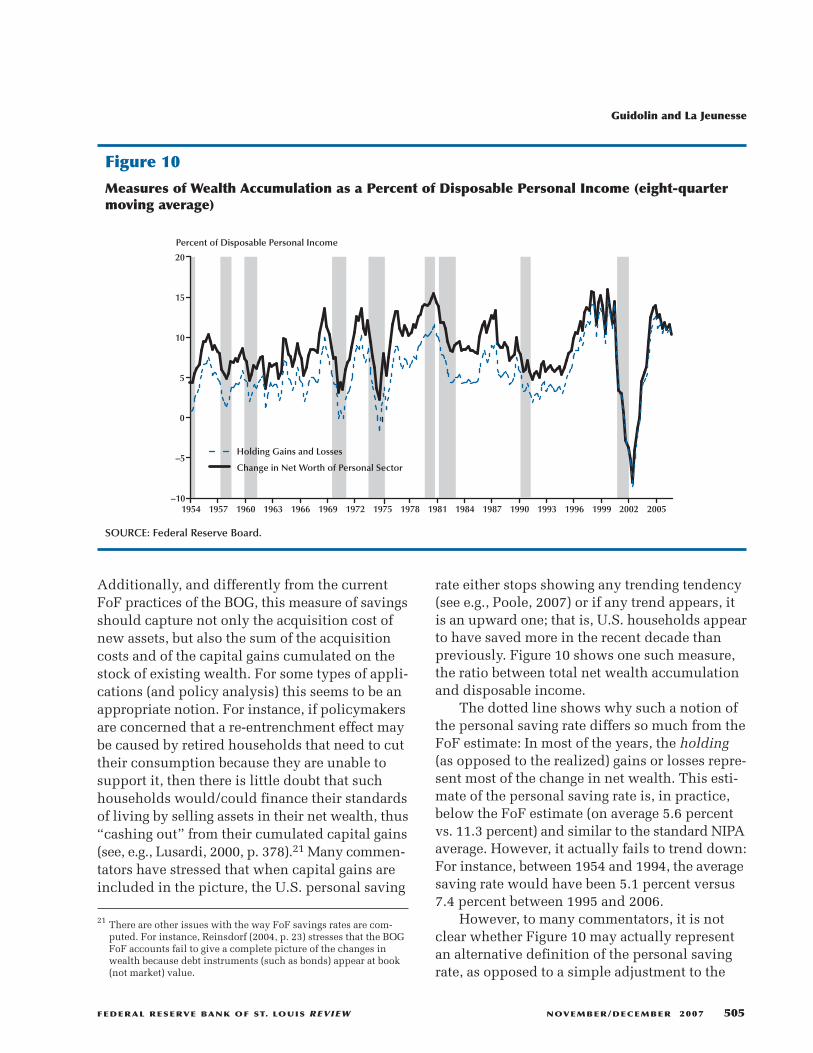
rate either stops showing any trending tendency(see e.g., Poole, 2007) or if any trend appears, itis an upward one; that is, U.S. households appearto have saved more in the recent decade thanpreviously. Figure 10 shows one such measure,the ratio between total net wealth accumulationand disposable income.
The dotted line shows why such a notion ofthe personal saving rate differs so much from theFoF estimate: In most of the years, the holding(as opposed to the realized) gains or losses repre-sent most of the change in net wealth. This esti-mate of the personal saving rate is, in practice,below the FoF estimate (on average 5.6 percentvs. 11.3 percent) and similar to the standard NIPAaverage. However, it actually fails to trend down:For instance, between 1954 and 1994, the averagesaving rate would have been 5.1 percent versus7.4 percent between 1995 and 2006.
However, to many commentators, it is notclear whether Figure 10 may actually representan alternative definition of the personal savingrate, as opposed to a simple adjustment to the
Guidolin and La Jeunesse
FEDERAL RESERVE BANK OF ST. LOUIS REVIEW NOVEMBER/DECEMBER 2007 505
21 There are other issues with the way FoF savings rates are com-puted. For instance, Reinsdorf (2004, p. 23) stresses that the BOGFoF accounts fail to give a complete picture of the changes inwealth because debt instruments (such as bonds) appear at book(not market) value.
–10
–5
0
5
10
15
20
1954 1957 1960 1963 1966 1969 1972 1975 1978 1981 1984 1987 1990 1993 1996 1999 2002 2005
Percent of Disposable Personal Income
Holding Gains and Losses
Change in Net Worth of Personal Sector
Figure 10
Measures of Wealth Accumulation as a Percent of Disposable Personal Income (eight-quartermoving average)
SOURCE: Federal Reserve Board.

standard FoF definition. Clearly (and even afterapplying eight-quarter moving-average smooth-ing!) the wealth accumulation measure remainsextremely volatile. This is natural because thenumerator mostly reflects the dynamics of assetprices—mainly stocks, bonds, and real estate—which easily manifest annualized volatilitiesexceeding 20 percent. Moreover, although 2005-06 turns out to have been a “thrifty” period (withaverage saving rates in excess of 12 percent), onewonders about the actual meaning of the –9 per-cent rate reached during 2002, in correspondencewith the burst of the tech stock bubble of the late1990s.
A second argument stresses that personal(household) savings cannot simply be assignedthe role of the main, dominant component ofprivate gross saving; (nonfinancial) businessesalso can and do retain a portion of their profitsto finance their investment activities. Earlier,we stressed that what really matters for healthygrowth is that private saving exceeds privateinvestment. This argument implies that the recentbehavior of U.S. households may not be a reason
for concern if, at the same time, U.S. nonfinancialfirms have happened to increase their saving.This proposition—that net private saving wouldbe roughly constant as a percentage of nationalincome as a result of a strong negative correlationbetween personal and business saving—is famousin economics (it is often called Denison’s law, fromDenison, 1958). Unfortunately, it does not suc-cessfully withstand serious empirical scrutiny.22
Figure 11 shows the recent movement of house-hold and business savings as a percentage of out-put. As previously stressed, gross private savingsbecame negative for long periods at the end of the1990s and between 2004 and 2005. This meansthat, although starting in the late 1990s there hasbeen a tendency for nonfinancial corporations toretain a growing fraction of their earnings, such atrend does not fully compensate for the apparent
22 Hendershott and Peek (1989) were the first to notice that such aninverse relationship between personal and business savings waslargely an artifact of measurement problems. Parker (2000, p. 322)stresses that NIPA accounts do a very ambiguous job at separatinghousehold savings from business savings. This may justify whydifferent researchers have reached a range of conclusions on thevalidity of Denison’s law after the mid-1990s.
Guidolin and La Jeunesse
506 NOVEMBER/DECEMBER 2007 FEDERAL RESERVE BANK OF ST. LOUIS REVIEW
–4
–3
–2
–1
0
1
2
3
4
5
6
7
8
1983 1985 1987 1989 1991 1993 1995 1997 1999 2001 2003 2005
Percent of GNP
Household
Nonfinancial Corporate
Total Private
Figure 11
Private Sector Financial Balances as a Percent of GNP (quarterly, SA)
SOURCE: Bureau of Economic Analysis, Federal Reserve Board.
“consumption boom” that has at the same timecharacterized the behavior of U.S. households.
A third argument refers mainly to FoF esti-mates of the personal saving rate and leads toconclude that such a measure—certainly to beconsidered superior to NIPA measures, the argu-ment goes—could be grossly underestimated atpresent. For instance, Hall (2000) has estimatedthat a large part of the increase in the net worthof U.S. households during the 1990s would havetaken the form of what he calls “e-capital,” a bodyof information-processing methods and organi-zational knowledge that has strongly increasedthe productivity of labor. Hall has argued that theaccumulation of such e-capital by householdswould have created a new, intangible type ofasset that should legitimately enter saving ratecalculations. Obviously, a similar phenomenonwould have involved U.S. firms that thereforewould have a much higher net saving rate thanrecorded by the BEA. From this perspective, the
recent decline in the U.S. personal saving ratewould simply hide a shift from savings in theform of accumulation of traditional assets (stocks,bonds, houses) to what we could call “e-assets.”In parallel, the net saving of U.S. businesses alsomight be substantially underestimated. Given thegrowing importance of information technologyin a globalized world, the decline in the personalsaving rate would actually reflect an encouragingdevelopment, likely to predict sustained produc-tivity growth. Although some of these innovativenotions of what constitutes an asset and whatconstitutes saving behavior are of key importance,at this point the estimates of the amount of annualinvestments as a percentage of GNP remain fairlyuncertain and probably insufficient to explainthe decline in the personal saving rate.
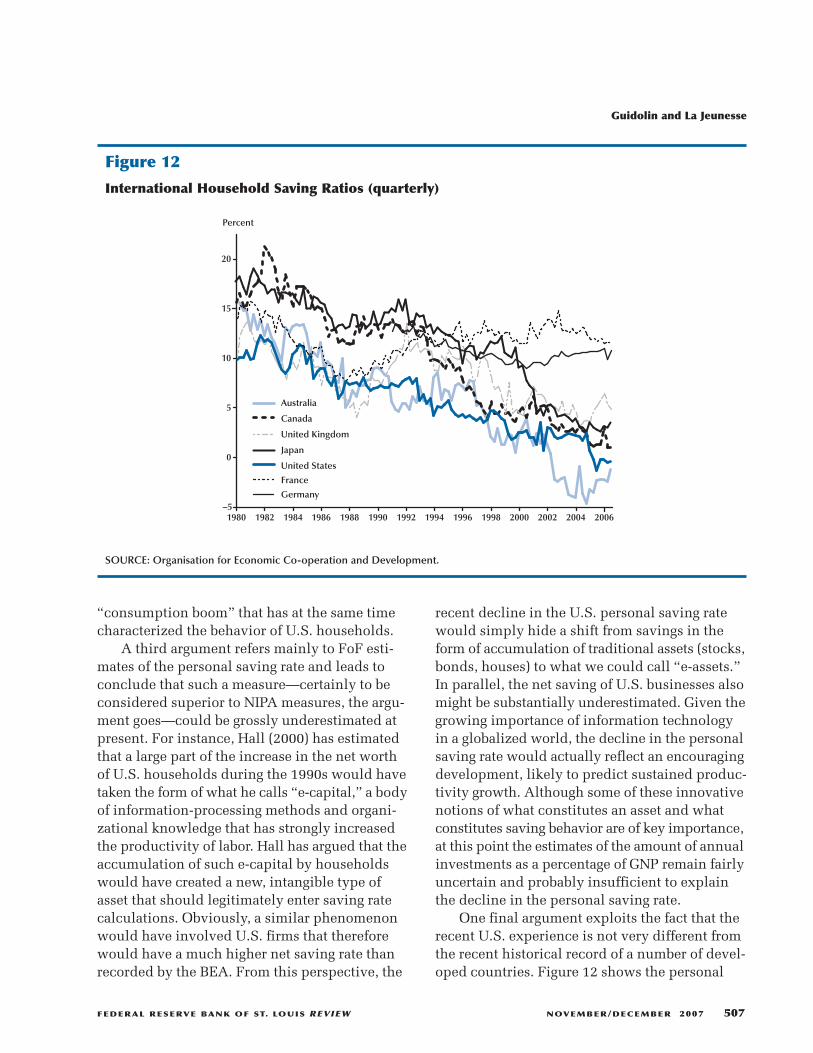
One final argument exploits the fact that therecent U.S. experience is not very different fromthe recent historical record of a number of devel-oped countries. Figure 12 shows the personal
Guidolin and La Jeunesse
FEDERAL RESERVE BANK OF ST. LOUIS REVIEW NOVEMBER/DECEMBER 2007 507
–5
0
5
10
15
20
1980 1982 1984 1986 1988 1990 1992 1994 1996 1998 2000 2002 2004 2006
Percent
Australia
Canada
United Kingdom
Japan
United States
France
Germany
Figure 12
International Household Saving Ratios (quarterly)
SOURCE: Organisation for Economic Co-operation and Development.
saving rates for seven different countries. Thesecomparisons should be accompanied by a wordof caution because different countries are knownto follow rather different national income account-ing procedures. For instance, while the BEA hasa rather complicated set of rules concerning impu-tations—that is, when a market value is placedon transactions that do not occur in the marketeconomy or that are not observable in its records—many other countries (e.g., Germany) are knownto mostly rely on market transactions for all thatconcerns their calculations of the saving rate.23
In spite of these qualifications, the recentdownward trend in the personal saving rateclearly has failed to involve only the UnitedStates: Similar dynamics also characterize, forinstance, Canada and Australia.24 In particular,the Australian saving rate has been negative since2002. Furthermore, the Canadian personal savingrate appears now close to zero (it is 1.4 percent),which is remarkable because between 1970 and1989 the Canadian rate had been 14 percentagainst 9 percent for the U.S. Thus, a gap of 5percentage points appears to have almost disap-peared in the past 17 years. In contrast, the evo-lution of both the U.K. and the German personalsaving rates have been markedly different fromthat in the United States. The German rate doesnot appear to be drifting down over time and inthe third quarter of 2005 was still exceeding 10percent. Of course, differences in the accountingmethodologies might explain a relevant portionof these differences. However, absent further evi-dence to explain the different behavior of U.S.,Canadian, and Australian personal saving rates,
the safest conclusion is that the recent level andevolution of the U.S. personal saving rate repre-sents a puzzle in search of a convincing economicexplanation, which is the subject of the followingsection.
THE DECLINE OF THE PERSONALSAVING RATE: IS IT A PUZZLE?
In economics, a phenomenon is said to rep-resent a puzzle when standard and generallyaccepted economic principles and theories failto provide a quantitatively satisfactory explana-tion for a set of empirical regularities. In thiscase, the empirical “stylized fact” consists of thelow and declining U.S. personal saving rate. Asshown in Figure 1, such a trend manifested itselfas early as in 1993. Therefore, economists andpolicymakers alike have had more than a decadeto develop theories and models that might some-how explain the recent, anomalous behavior ofthe U.S. personal saving rate. Additionally, itseems now to be received wisdom that the dropin the U.S. saving rate is just a reflection of acontemporaneous “consumption boom” that hasswept through the United States since the mid-1990s (see Figure 13). At least six different theo-ries/explanations for the recent dynamics of thepersonal U.S. saving rate have been put forth.We review them here.25
Wealth Effects
This theory is fairly simple and can be tracedback to early theories that stressed that a house-hold’s net worth ought to influence its consump-tion/saving patterns: The occurrence of pricerun-ups in equity (during the late 1990s) andreal estate (especially after 2001) markets havecreated bubble-like conditions in which highand growing capital gains (both realized andunrealized) together increase the current outlaysby U.S. households. Lusardi, Skinner, and Venti(2001) conclude that on the basis of the bulk of
23 Despite the general principle driving BEA practices that NIPAmeasures should reflect only market transactions in goods andservices, imputations are included in personal income and in otherNIPA aggregates, generally to keep the NIPA aggregates invariantto how certain activities are carried out. Specifically, six imputa-tions are included in the estimates of personal income: imputedpay-in-kind, employer-paid health and life insurance premiums,the net rental value of owner-occupied farms and the value of foodand fuel produced and consumed on farms, the net rental value ofowner–occupied nonfarm housing, the net margins on owner-builthousing, and the imputed interest paid by financial intermediariesexcept life insurance carriers. These imputations accounted forabout 8 percent of personal income at the national level in 2001.
24 The declining Japanese personal saving rate has received somedistinct attention in the academic literature (see, e.g., Horiokaand Watanabe, 1997).
Guidolin and La Jeunesse
508 NOVEMBER/DECEMBER 2007 FEDERAL RESERVE BANK OF ST. LOUIS REVIEW
25 Our review of the literature is necessarily incomplete. The mile-stones of the debate on the declining U.S. saving rate seem to beBosworth, Burtless, and Sabelhaus (1991), Browning and Lusardi(1996), Gale and Sabelhaus (1999), and Parker (2000).

the econometric evidence, the appreciating stockmarket wealth since 1988 may have reduced thepersonal saving rate between 3 and 5 percentagepoints. Dynan and Maki (2001) and Juster et al.(2006) have reported estimates from micro-leveldata that are consistent with this conclusion.Although this explanation is intuitively (andquantitatively) appealing, a number of researchershave expressed doubts. For instance, Parker (2000,p. 330) objects that the timing of recent bubblesseems to follow the decline of the U.S. saving rate.The rate kept declining even during 2001 and2002, when the stock market bubble burst andbillion of dollars of unrealized (paper) capitalgains were lost (see, e.g., Figure 4). Because therecent U.S. saving rate data imply an elasticity ofabout one-sixth, this means that the stock marketbull periods of the late 1990s should have gener-ated (but did not) a large response of consumption,whereas the strongest dip in the saving rate seemsto have occurred after 2002. Lettau and Ludvigson(2004) find that a vast majority of variation inasset wealth is purely transitory and as such tendsto have no impact whatsoever on consumer
spending, implying that wealth effects representa plausible explanation only if we believe thatmost stock and housing market booms in the pasttwo decades were largely due to permanent,structural shifts in the way assets are evaluated.Additionally, Poterba and Samwick (1995) andLudivgson and Steindel (1999) have shown thatthe structure of lagged effects connecting con-sumption to wealth changes are rather compli-cated and generally support only short-lived andweak effects. Finally, Lusardi, Skinner, and Venti(2001) correctly stress that although the declinein personal saving seems to have involved mostcohorts/types of households, only roughly halfof the U.S. population holds stocks. The fractionholding housing properties is only slightly higher.
Permanent Income Hypothesis(the “New Economy” Effect)
According to this theory, recent technologicaladvances and enormous increases in labor pro-ductivity would have led U.S. households toapply vigorous upward revisions to their perma-nent-income estimates (see, e.g., Greenwood and
Guidolin and La Jeunesse
FEDERAL RESERVE BANK OF ST. LOUIS REVIEW NOVEMBER/DECEMBER 2007 509
0.84
0.86
0.88
0.90
0.92
0.94
0.96
0.98
1.00
1980 1982 1984 1986 1988 1990 1992 1994 1996 1998 2000 2002 2004 2006
Figure 13
Rate of Personal Consumption Expenditure to Disposable Personal Income (quarterly, SAAR)
SOURCE: Bureau of Economic Analysis.
Jovanovic, 1999). In this case, the unobservableeffective saving rate perceived by households is
where Ypt+1 is some present discounted value of
the stream of future incomes (after taxes),
In words, The permanent income can be describedas a smoothly growing measure whose value cor-responds to the present value of all real resourcesavailable to a consumer. When Yp
t+1 > Yt+1, it ispossible for agents to perceive (and act upon)
In practice, the wealth-effects explanationstresses the effects of the increases in the networth of households, whereas the permanent-income theory relies more on revisions of theexpectations of future incomes. Although manyresearchers have noticed that this latter explana-tion is consistent with the fact that the high rateof growth of productivity has survived the reces-sion of 2002 (see, e.g., Parker, 2000, p. 319), mostrecent research has concluded that productivityeffects may explain, at most, 20 percent of therecent changes in the saving rate.
Financial Innovation
This model stresses that improvements in thecredit markets have made it possible to transformunrealized capital gains and future incomes intocurrent purchasing power (see, e.g., Carroll, 1997).Examples are “exotic” (interest-only) mortgagesand subprime rate loans and revolving debt withflexible payment features (e.g., credit cards andoverdraft plans on checking accounts). In thiscase, households do not need to perceive a higherstream of current incomes to increase consump-tion; a given level of permanent income becomeseasy to convert into current consumption as thefinancial innovation process progresses. Accord-ing to this model, U.S. households would haveplunged into increasing debt. For instance,
ˆ /s s Y C Yt tNIPA
t t t+ + + + +> −( )1 1 1 1 1; .
Y Y Ytp
tj
t jj+ + + +=+ ∑1 1 11; β .`
sY C
Yttp
t
tp+
+ +
+=
−1
1 1
1
,
Kennickell and Starr-McCluer (2000) show thatthe median amount of outstanding householddebt has almost doubled between the end of the1980s and the turn of the new millennium.Empirically, this explanation has been remarkablysuccessful. For instance, Parker (2000) concludesthat the increase in the debt/GDP ratio can explaina remarkable one-third of the observed declinein U.S. personal saving. Gokhale, Kotlikoff, andSabelhaus (1996) have noticed also that theincreasing annuitization of retirement incomein the United States may exert some downwardpressure on the NIPA saving rate. Yet, a few com-mentators have expressed reservations about theeffects of financial innovations. For instance,Lusardi et al. (2001) remark that the FoF accountsshow that the drop in the saving rate has muchmore to do with households’ failure to purchasesufficient financial assets than with their propen-sity to increase their financial liabilities.
Social Security Programs andMacroeconomic Stability
This explanation relies once more on themechanism of expectation formation. It stressesthat U.S. households, faced with the evidencethat Social Security, Medicare, and other govern-ment transfer programs work, have increasedtheir consumption levels, feeling that their ownpersonal saving might not be needed as much asthey age or experience other debilitating events.For instance, Lusardi et al. (2001) update originalcalculations in Gokhale, Kotlikoff, and Sabelhaus(1996) and observe that the entire growth in theratio of consumption to GDP between 1988 and2000 (roughly 2 percentage points) can beexplained by increases in medical care expendi-tures. This may reveal that consumption hasincreased simply because social programs are infact assumed to be paying for the additional expen-diture. Huggett and Ventura (2000) and Gustmanand Steinmeier (1999) have argued that especiallyhouseholds in the lowest wealth-distributionbrackets, which also tend to be relatively young,may rationally expect generous relative (post-“Baby Boom”) retirement benefits, either fromSocial Security or from other pension plans.
Guidolin and La Jeunesse
510 NOVEMBER/DECEMBER 2007 FEDERAL RESERVE BANK OF ST. LOUIS REVIEW

Another take on these expectations is that, ashouseholds and firms perceive declining macro-economic risks (e.g., of inflation) as a result ofsound economic policies, theymight progressivelyreduce their “precautionary saving” that is sup-posed to work as a buffer during “bad times.” Inthis respect (and paradoxically), a successfulFed policy might have contributed to long-runinstability through a progressive reduction ofprivate saving rates.26
Demographics
According to the life-cycle hypothesis ofconsumption, individuals save when young anddissave when old. If the American population isaging, a decline in the personal saving rate is tobe expected. Although there is now some empir-ical evidence that this explanation might providea good fit for the Japanese saving decline (see, e.g.,Horioka and Watanabe, 1997, and more recentlyChen, Imrohoroglu, and Imrohoroglu, 2007), theevidence for the United States is rather weak(see, e.g., Parker, 2000). Browning and Lusardi(1996) offer a rather compelling explanation forwhy aging cannot work as a main explanation:Aging happens too slowly to generate sufficientvariation to explain the U.S. case. Moreover,Lusardi, Skinner, and Venti (2001) do find thatthe demographic structure of the U.S. populationis shifting and that a significant group of house-holds have saving rates too low to be explainedby conventional life-cycle models. Notice, how-ever, that this is the opposite of a sensible expla-nation of the puzzle, because economists so farhave not been able to explain why exactly such acluster of households has difficulty recognizingthe need to save and calculating the amount ofsavings they need.27
Ricardian Equivalence
Consider a world in which Ricardian equiva-lence applies: Unless taxes are distortionary,higher taxes should induce households to saveless, given a steady level of public expendituresand hence higher public saving. As we notedearlier, a net increase in public sector savings hastaken place only between 1993 and 1999, whileprivate saving has kept sliding. Hall (1999) arguesthat most of the changes in the composition oftotal national saving between the 1980s and 1998may be explained by an application of Ricardianneutrality, which is consistent with the empiricalfindings in Tanzi and Zee (1998) for saving ratesand tax data for a panel of countries in theOrganisation for Economic Co-operation andDevelopment. However, in quantitative terms,Parker (2000) also rejects that households mightsimply be acting on the basis of expected, futurereductions of budget deficits, as the reductions tobe anticipated would have to be implausiblyhigh and historically unprecedented.
Trends in the Way CompaniesCompensate Shareholders
Financial economists have for decades alertedthe economics profession that—for a variety ofreasons, related to both institutions (corporategovernance mechanisms) and taxes—U.S. corpo-rations have become less and less inclined to paycash flows to stockholders in the form of divi-dends. The standard motto is that “dividends aredisappearing.” From this perspective, the pre-ferred way of compensating stockholders wouldincreasingly be stock repurchases (both directlyand as a part of tender offers) and swaps of stockswith bonds and other liquid securities. With acomplete shift away from dividends, the amountof stock repurchases by all U.S. non-financialcorporations has increased from $42 billion in2003 to $602 in 2006, an increase by a factor of 14!Currently, cash dividend payments are includedin the NIPA definition of disposable income, yetshare repurchases are not. Measurement of thesaving rate is further complicated because possi-ble taxes paid on the repurchase gains are takeninto account, reducing personal disposable
Guidolin and La Jeunesse
FEDERAL RESERVE BANK OF ST. LOUIS REVIEW NOVEMBER/DECEMBER 2007 511
26 This explanation can also be read as suggesting that U.S. house-holds are applying a higher level of (effective) subjective discountfactors when deciding optimal consumption patterns. Parker(2000, p. 331) observes that this is consistent with the recent evi-dence of high real interest rates in the United States.
27 A number of behavioral models have been proposed to interpretthis behavior. For instance, Laibson, Repetto, and Tobacman (1998)suggest that people may display hyperbolic rather than exponentialdiscount functions, which implies that short-run discount ratesare higher than long-term rates, so that decisionmaking appears tobe time inconsistent.
income. Simple math shows that, with the savingrate defined as st+1 = �Yt+1 – Ct+1�/Yt+1, if Yt+1 getsunderestimated, then st+1 will be unduly under-estimated. Recent estimates by Steindel (2007)show that almost one-third of the recent savingrate decline may be explained away by this struc-tural change in the way stockholders are compen-sated. However, the trend is rather recent and,although the saving rate has been falling at leastsince the early 1990s, these developments in theratio between cash dividends and stock repur-chases have assumed large proportions only inrecent years. Additionally, it may be argued thatonly a portion of a share repurchase actuallyrepresents a permanent income component.
CONCLUSIONSMany economists have stressed that a number
of flaws characterize the most widely known esti-mates of the U.S. personal saving rate. However,none of the problems of the measures currentlyused (NIPA and FoF rates) seems to fully accountfor the steep decline and the negative levelsreached by the U.S. saving rate after the mid-1990s. Moreover, even when the recent dynamicsof households’ net wealth, the saving of non-financial firms, and the declining saving rates ina number of developed countries are taken intoaccount, there is reason to be concerned about thelow level reached by the U.S. personal saving rateafter the mid-1990s. These concerns are spurredby the possibility that U.S. households may soonre-entrench and reduce their consumption expen-ditures. There are also long-term worries that theUnited States might either be prevented fromfinancing all of the available, positive net presentvalue investment opportunities or forced to accepta high and increasing dependence on foreignlending. Although we have reviewed a numberof concurring explanations that have been pro-posed for the declining propensity of U.S. house-holds to save, it seems that (sometimes on logicalgrounds, in other occasions on an empirical level)such theories remain insufficient to explain theentire magnitude of the recent transformation ofthe United States into a nation of spendthrifts. In
this sense, the U.S. personal saving rate remainsa puzzle.
REFERENCESBosworth, Barry; Burtless, Gary and Sabelhaus, John.“The Decline in Saving: Evidence from HouseholdSurveys.” Brooking Papers on Economic Activity,1991, No. 1, pp. 183-241.
Browning, Martin and Lusardi, Annamaria.“Household Saving: Micro Theories and MicroFacts.” Journal of Economic Literature, December1996, 34, pp. 1797-855.
Carroll, Christopher D. “Buffer-Stock Saving and theLife Cycle/Permanent Income Hypothesis.” TheQuarterly Journal of Economics, February 1997,112(1), pp. 1-55.
Chen, Kaiji; Imrohoroglu, Ayse and Imrohoroglu,Selahattin. “The Japanese Saving Rate between1960 and 2000: Productivity, Policy Changes, andDemographics.” Economic Theory, July 2007, 32(1),pp. 87-104.
Denison, Edward F. “A Note on Private Saving.”Review of Economics and Statistics, August 1958,40(3), pp. 261-67.
Dynan, Karen E. and Maki, Dean M. “Does StockMarket Wealth Matter for Consumption?” Financeand Economics Discussion Series No. 2001-23,Board of Governors of the Federal Reserve System,2001.
Fleming, Wendell H. and Stein, Jerome L. “StochasticOptimal Control, International Finance and Debt.”Journal of Banking and Finance, May 2004, 28(5),pp. 979-96.
Gale, William, G. and Sabelhaus, John. “Perspectiveson the Household Saving Rate.” Brooking Paperson Economic Activity, 1999, No. 1, pp. 181-222.
Garner, Alan C. “Should the Decline in the PersonalSaving Rate Be a Cause for Concern?” FederalReserve Bank of Kansas City Economic Review,Second Quarter 2006, pp. 5-28.
Guidolin and La Jeunesse
512 NOVEMBER/DECEMBER 2007 FEDERAL RESERVE BANK OF ST. LOUIS REVIEW

Gokhale, Jagadeesh; Kotlikoff, Laurence, J. andSabelhaus, John. “Understanding the PostwarDecline in U.S. Saving: A Cohort Analysis.”Brooking Papers on Economic Activity, 1996, No. 1,pp. 315-407.
Guimaraes, Bernardo. “Optimal External Debt andDefault.” Discussion Paper No. 6035, Center forEconomic Policy Research, January 2007.
Gustman, Alan L. and Steinmeier, Thomas L.“Effects of Pensions on Savings: Analysis withData from the Health and Retirement Study.”Carnegie-Rochester Conference Series on PublicPolicy, June 1999, 50, pp. 271-324.
Greenwood, Jeremy and Jovanovic, Boyan. “TheInformation-Technology Revolution and the StockMarket.” American Economic Review, May 1999,89(2), pp. 116-22.
Hakkio, Craig S. and Wiseman, Elisha J. “SocialSecurity and Medicare: The Impending FiscalChallenge.” Federal Reserve Bank of Kansas CityEconomic Review, First Quarter 2006, pp. 7-41.
Hall, Robert E. Comment on “Perspectives on theHousehold Saving Rate” by Gale and Sabelhaus,Brooking Papers on Economic Activity, 1999, No. 1,pp. 215-20.
Hall, Robert E. “E-Capital: The Link Between theStock Market and the Labor Market in the 1990s.”Brooking Papers on Economic Activity, 2000, No. 2,pp. 73-118.
Hendershott, Patric H. and Peek, Joe. “Aggregate U.S.Private Saving: Conceptual Measures and EmpiricalTests,” in Robert E. Lipsey and Helen Stone Tice,eds., The Measurement of Saving, Investment andWealth. Chicago: University of Chicago Press,1989, pp. 185-226.
Horioka, Charles Yuji and Watanabe, Wako–. “WhyDo People Save? A Micro-Analysis of Motives forHousehold Saving in Japan.” The EconomicJournal, May 1997, 107(442), pp. 537-52.
Huggett, Mark and Ventura, Gustavo. “UnderstandingWhy High Income Households Save More than
Low Income Households.” Journal of MonetaryEconomics, April 2000, 45(2), pp. 361-97.
Juster, Thomas F.; Lupton, Joseph P., Smith, James P.and Stafford, Frank. “The Decline in HouseholdSaving and the Wealth Effect.” The Review ofEconomics and Statistics, November 2006, 88(1),pp. 20-27.
Kennickell, Ann and Starr-McCluer, Martha. “RecentChanges in U.S. Family Finances: Results from the1998 Survey of Consumer Finances.” FederalReserve Bulletin, January 2000, pp. 1-29.
Laibson, David; Repetto, Andrea and Tobacman,Jeremy. “Self-Control and Saving for Retirement.”Brooking Papers on Economic Activity, 1998, No. 1,pp. 91-172.
Lettau, Martin and Ludvigson, Sydney C.“Understanding Trend and Cycle in Asset Values:Reevaluating the Wealth Effect on Consumption.”American Economic Review, March 2004, 94(1),pp. 276-99.
Ludvigson, Sydney and Steindel, Charles. “HowImportant Is the Stock Market Effect onConsumption?” Federal Reserve Bank of New YorkEconomic Policy Review, July 1999, 5(2), pp. 29-51.
Lusardi, Annamaria. “Spendthrift in America? OnTwo Decades of Decline in the U.S. Saving Rate:Comment,” in Ben S. Bernanke and Julio J.Rotemberg, eds., NBER Macroeconomics Annual1999. Cambridge, MA: MIT Press, 2000, pp. 374-86.
Lusardi, Annamaria; Skinner, Jonathan and Venti,Steven. “Saving Puzzles and Saving Policies in theUnited States.” Oxford Review of Economic Policy,Spring 2001, 17(1), pp. 95-115.
Nakamura, Leonard I. and Stark, Tom. “BenchmarkRevisions and the U.S. Personal Saving Rate.”Working Paper No. 05-6, Federal Reserve Bank ofPhiladelphia, April 2005.
Parker, Jonathan A. “Spendthrift in America? OnTwo Decades of Decline in the U.S. Saving Rate,”in Ben S. Bernanke and Julio J. Rotemberg, eds.,
Guidolin and La Jeunesse
FEDERAL RESERVE BANK OF ST. LOUIS REVIEW NOVEMBER/DECEMBER 2007 513

NBER Macroeconomics Annual 1999. Cambridge,MA: MIT Press, 2000, pp. 317-70.
Peach, Richard W. and Steindel, Charles. “A Nationof Spendthrifts? An Analysis of Trends in Personaland Gross Saving.” Federal Reserve Bank of NewYork Current Issues in Economics and Finance,September 2000, 6(10), pp. 1-6.
Perozek, Maria G. and Reinsdorf, Marshall B.“Alternative Measures of Personal Saving.” Surveyof Current Business, April 2002, 82(4), pp. 13-24.
Poole, William. “How Dangerous Is the U.S. CurrentAccount Deficit?” Economic Policy Lecture Series,Lindenwood University, St. Charles, MO,November 9, 2005; http://stlouisfed.org/news/speeches/2005/11_09_05.htm.
Poole, William. “U.S. Saving.” Presented at the CFASociety of Nebraska, Omaha, NE, February 15,2007; http://stlouisfed.org/news/speeches/2007/02_15_07.html.
Poterba, James M. “Stock Market Wealth andConsumption.” Journal of Economic Perspectives,Spring 2000, 14(2), pp. 99-118.
Poterba, James M. and Samwick, Andrew A. “StockOwnership Patterns, Stock Market Fluctuations,and Consumption.” Brooking Papers on EconomicActivity, 1995, No. 2, pp. 295-357.
Reinsdorf, Marshall B. “Alternative Measures ofPersonal Saving.” Survey of Current Business,September 2004, 84(9), pp. 17-26.
Reinsdorf, Marshall B. “Alternative Measures ofPersonal Saving.” Survey of Current Business,February 2007, 87(2), pp. 7-13.
Santomero, Anthony M. “Making Monetary Policy:What Do We Know and When Do We Know It?”Presented at the National Economists Club, April 7,2005; www.philadelphiafed.org/publicaffairs/speeches/santomero/2005/04-07-05_natl-economists-club.cfm.
Steindel, Charles. “How Worrisome Is a NegativeSaving Rate?” Federal Reserve Bank of New YorkCurrent Issues in Economics and Finance, May2007, 13(4), pp. 1-7.
Tanzi, Vito and Zee, Howell H. “Taxation and theHousehold Saving Rate: Evidence from OECDCountries.” IMF Working Paper No. 98/36,International Monetary Fund, March 1998.
Guidolin and La Jeunesse
514 NOVEMBER/DECEMBER 2007 FEDERAL RESERVE BANK OF ST. LOUIS REVIEW