Embed Size (px)
Citation preview
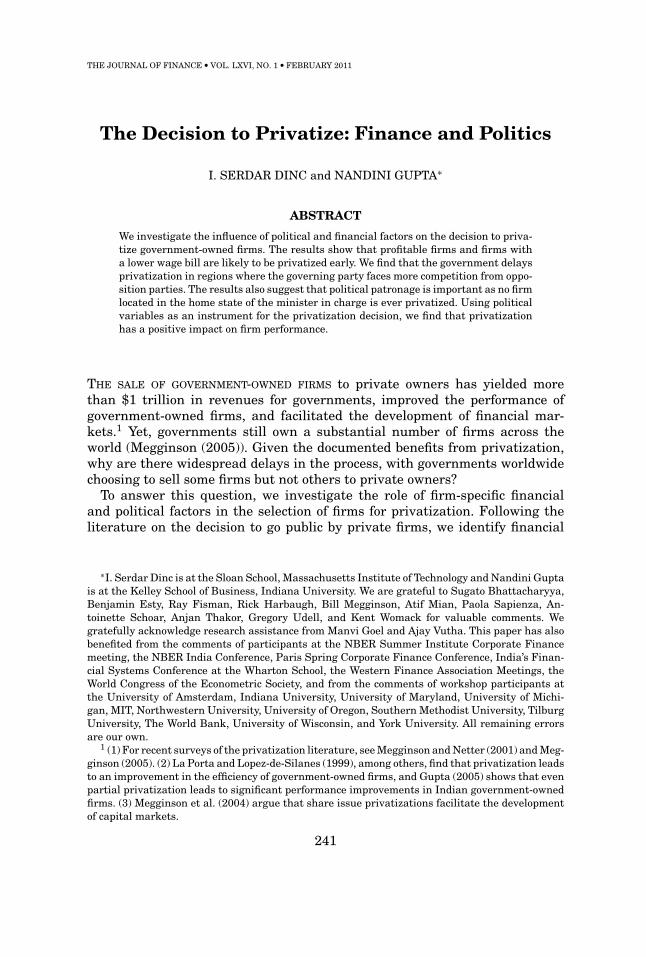
THE JOURNAL OF FINANCE • VOL. LXVI, NO. 1 • FEBRUARY 2011
The Decision to Privatize: Finance and Politics
I. SERDAR DINC and NANDINI GUPTA∗
ABSTRACT
We investigate the influence of political and financial factors on the decision to priva-tize government-owned firms. The results show that profitable firms and firms witha lower wage bill are likely to be privatized early. We find that the government delaysprivatization in regions where the governing party faces more competition from oppo-sition parties. The results also suggest that political patronage is important as no firmlocated in the home state of the minister in charge is ever privatized. Using politicalvariables as an instrument for the privatization decision, we find that privatizationhas a positive impact on firm performance.
THE SALE OF GOVERNMENT-OWNED FIRMS to private owners has yielded morethan $1 trillion in revenues for governments, improved the performance ofgovernment-owned firms, and facilitated the development of financial mar-kets.1 Yet, governments still own a substantial number of firms across theworld (Megginson (2005)). Given the documented benefits from privatization,why are there widespread delays in the process, with governments worldwidechoosing to sell some firms but not others to private owners?
To answer this question, we investigate the role of firm-specific financialand political factors in the selection of firms for privatization. Following theliterature on the decision to go public by private firms, we identify financial
∗I. Serdar Dinc is at the Sloan School, Massachusetts Institute of Technology and Nandini Guptais at the Kelley School of Business, Indiana University. We are grateful to Sugato Bhattacharyya,Benjamin Esty, Ray Fisman, Rick Harbaugh, Bill Megginson, Atif Mian, Paola Sapienza, An-toinette Schoar, Anjan Thakor, Gregory Udell, and Kent Womack for valuable comments. Wegratefully acknowledge research assistance from Manvi Goel and Ajay Vutha. This paper has alsobenefited from the comments of participants at the NBER Summer Institute Corporate Financemeeting, the NBER India Conference, Paris Spring Corporate Finance Conference, India’s Finan-cial Systems Conference at the Wharton School, the Western Finance Association Meetings, theWorld Congress of the Econometric Society, and from the comments of workshop participants atthe University of Amsterdam, Indiana University, University of Maryland, University of Michi-gan, MIT, Northwestern University, University of Oregon, Southern Methodist University, TilburgUniversity, The World Bank, University of Wisconsin, and York University. All remaining errorsare our own.
1 (1) For recent surveys of the privatization literature, see Megginson and Netter (2001) and Meg-ginson (2005). (2) La Porta and Lopez-de-Silanes (1999), among others, find that privatization leadsto an improvement in the efficiency of government-owned firms, and Gupta (2005) shows that evenpartial privatization leads to significant performance improvements in Indian government-ownedfirms. (3) Megginson et al. (2004) argue that share issue privatizations facilitate the developmentof capital markets.
241
242 The Journal of Finance R©
characteristics of firms that are likely to influence the decision to privatize.2
However, the decision to sell government-owned firms is likely to depend notonly on financial factors, but also on political costs and benefits. While thebenefits of privatization, such as revenues from sale, financial market devel-opment, and efficiency gains, tend to be dispersed across the population, thecosts of privatization, such as layoffs of surplus workers and the loss of pri-vate benefits of control for politicians, tend to be concentrated among a smallgroup.3 To understand how these concentrated costs can slow down the processof privatization, we investigate the role of political competition and patronagein the privatization decision.
Since the adverse effects of privatization, such as layoffs, are likely to beconcentrated in the region where a firm operates, the governing party maylose votes in that region because of opposition from interest groups that areadversely affected, such as the local employees of government-owned firms.Privatization may also be perceived negatively by the public as an inequitabletransfer of publicly owned assets to private owners, which can result in a loss ofvotes in the region. Since any decrease in voter support is likely to matter morefor the governing party if it is in a competitive race with opposition partiesin a region, we expect the government to delay privatization in regions wherethe governing and opposition parties face a close race. This is consistent withthe argument that politicians may allocate public funds to pivotal regions toachieve electoral goals (Lindbeck and Weibull (1987) and Dixit and Londregan(1996)).
Since politicians obtain private benefits from controlling government-ownedfirms (Shleifer and Vishny (1994) and Dinc (2005)), we also consider the roleof political patronage in the privatization decision. For example, politicianscan influence the hiring decisions of government-owned firms to favor sup-porters. Theory suggests that politicians may target government programs toreward supporters with patronage (Cox and McCubbins (1986) and Perssonand Tabellini (2002)). Hence, rent-seeking politicians may delay privatizationin regions where their supporters are based.
To evaluate the effect of financial and political factors on the privatizationdecision, we use firm-level data on Indian firms that include both privatizedfirms and those that remain fully government-owned. In many countries, dataon the latter are not available. The data provide financial information for 92%of the firms owned by the federal government for the fiscal years 1990 to2004. We observe all the privatizations that have occurred since the start of
2 Pagano, Panetta, and Zingales (1998) investigate the determinants of the decision to go publicby private firms. For a recent survey of the IPO literature, see Ritter and Welch (2002).
3 Ahmed and Varshney (2008) discuss why privatization has been difficult to implement in India,whereas other policies, such as stock market liberalization, have not: “Within economic policy. . .
some issues are more likely to arouse mass contestation than others. Privatization, a change inlabor laws, withdrawal of agricultural subsidies . . . Either a large number of people are negativelyaffected in the short run (agriculture), or those so affected, even when not in large numbers, arewell organized in unions (privatization and labor laws). It should now be clear why India’s decisionmakers have . . . achieved limited privatization” (p. 22).
The Decision to Privatize 243
the program in 1991, the majority of which were undertaken by the CongressParty government (1991 to 1995), and a smaller number by the BharatiyaJanata Party (BJP) government (1999 to 2003). Thus, the political results aredrawn mainly from the first privatizing government.
To investigate the role of politics, we collect electoral data for each of the543 electoral districts in India from all the federal elections held since thestart of the privatization program in 1991. We then hand-collect data on theaddress of the main operations of each firm, and use digital geographic mappingtechniques to match firms to electoral districts at varying distances aroundtheir location.
Using India as the empirical context for studying the politics of financial re-forms has several advantages. First, it is a multiparty democracy with robustpolitical competition among its political parties. For example, the ruling partyin the federal government was voted out of power in four out of five electionsheld between 1991 and 2004. Second, since this is a single-country study, wecan control for institutional differences across countries such as legal systemsand colonial legacies. Third, by using India as the empirical context, we canexploit regional differences across the different Indian electoral districts. Theconsiderable political, demographic, ethnic, and socioeconomic diversity acrossthe Indian subcontinent leads to significant variation in support for the differ-ent political parties across the regions.
The results suggest that, similar to the IPO decision of private firms, largerfirms are more likely to be privatized early. We also find that privatization issignificantly delayed for firms with a large wage bill, suggesting that employ-ees of firms with a large workforce may block privatization. Unlike privatefirm IPOs, political factors also play an important role in the privatizationdecision. In particular, we find that privatization is significantly delayed if afirm is located in a politically competitive constituency where the governingand opposition party alliances have won a similar share of the vote. For ex-ample, the rate of privatization is about 1.5 times higher for a firm locatedin a constituency at the 75th percentile of political competition compared to afirm located at the 25th percentile, where the lower percentile indicates a morecompetitive region. We find that the government also delays the privatizationof firms that are located in districts where the opposition party has more votersupport. These results suggest that the government acts to minimize the ef-fects of a political backlash by delaying privatization in districts where thegoverning party faces more competition from the opposition.4 Hence, the dis-persed benefits and concentrated costs of privatization appear to significantlyinfluence the pattern of privatization sales.
We check the robustness of the results in several ways. In particular, thespecifications control for firm-level sales, profitability, and wages; year andindustry effects; the relative importance of the firm to the region; and regionaldifferences in income, education, urbanization, and growth.
4 Describing how the political costs of privatization can lead to delays, one Indian Prime Ministernoted, “If I do it [privatization] immediately, I get into trouble. I get trouble from the workers. Iget trouble from the political parties. I get trouble from the general public” (The Financial Times,Steadily Doing It His Own Way-–P. V. Narasimha Rao, March, 11, 1994).
244 The Journal of Finance R©
To investigate the role of political patronage in the privatization decision,we examine whether retaining control over a firm is a greater priority for thepolitician in charge of the firm if the firm is located in the home state of thatpolitician. We find that no firm located in the state from which the ministerwith jurisdiction over that firm is elected is ever privatized. This result suggeststhat political patronage has a significant impact on the privatization decision.
Our results suggest that firm characteristics, such as sales and workforce,are significantly related to which firms are privatized. While there is a largeliterature documenting that privatization leads to significant improvements inthe performance of government-owned firms (Megginson and Netter (2001) andGupta (2005)), the majority of these studies do not account for the endogenousselection of firms for privatization based on their performance. Using politicalcompetition as an instrument, we correct for endogeneity of the privatizationdecision to firm characteristics, and find that privatized firms experience sig-nificant improvements in productivity and efficiency compared to firms thatremain fully government-owned.
There is a growing empirical literature on the political economy of finan-cial market reforms.5 For example, Jones et al. (1999) show that governmentsadopt terms of sale that are consistent with political objectives; Clarke andCull (2002) find that the political affiliation of the government does not have arobust impact on the probability of bank privatization in Argentina; Bortolottiand Pinotti (2008) show that privatization is delayed in democracies with pro-portional electoral systems; and Dastidar, Fisman, and Khanna (2007) showthat there is policy irreversibility in the privatization process in India. In therelated context of banking sector policy, Kroszner and Strahan (1999) find thatinterest groups may influence the pattern of banking sector deregulation acrossthe different U.S. states; Sapienza (2004) shows that Italian government-ownedbanks charge lower interest rates in areas where the government is politicallystrong; and Brown and Dinc (2005) document that governments are less likelyto take over failing banks prior to an election.
Our paper contributes to the political economy of finance literature in sev-eral ways. First, the literature considers how differences in political institu-tions are correlated with patterns in privatization, such as methods of sale.Our focus is different since we use data on both privatized firms and those thatremain government-owned to study how firms are selected for privatization ina competitive democracy. Second, the political economy of finance literature isimplicitly motivated by the incentives of politicians. By investigating the roleof political competition, we provide a direct test of this underlying assumptionand show how politicians’ incentives shape financial market policy. Third, we
5 The question of how a government that maximizes revenues will sequence the sale of firms isinvestigated theoretically in an auction model by Chakraborty, Gupta, and Harbaugh (2006), andempirically using Czech data by Gupta, Ham, and Svejnar (2008). Governments may also privatizegradually for strategic reasons. For example, Perotti (1995) argues that governments may retainan ownership stake to signal to investors their commitment to not implement policies that areadverse to the firm. Last, Biais and Perotti (2002) argue that share issue privatizations may createmore support among the median voter for the policies of conservative governments.
The Decision to Privatize 245
identify and connect politicians to the firms they control so as to provide thefirst test of how political patronage affects privatization. Fourth, the literaturestudying the effects of privatization often assumes that firms are selected ran-domly for privatization, but our results indicate that privatization is likely tobe endogenous to firm characteristics. We show that political variables may beused as instruments to correct for this endogeneity. These political measuresare also likely to be useful for evaluating the impact of other endogenouslyimplemented reforms, such as banking sector and foreign investment deregu-lation.
The paper is organized as follows. In Section I, we describe the Indian politicalsystem and the privatization program, in Section II, we describe hypothesesbased on the financial and political factors likely to affect the privatizationdecision, and in Section III, we describe the data. Section IV presents theregression results and Section V describes robustness checks. In Section VI,we discuss the impact of privatization, and in Section VII, we conclude.
I. Background on Privatization and the Political System in India
A. Government-Owned Firms
In the postindependence era, government ownership of firms in India wasjustified by concerns that the private sector would not undertake projectsrequiring large investments with long gestation periods. In the late 1960s,there was a period of rapid nationalization of firms in all sectors, and by1991, gross capital formation in federal government-owned firms accountedfor 40% of total gross capital formation in the economy (Ministry of Finance(1996)).
We focus on firms owned by the federal government, which account for about85% of the total assets of all government-owned companies (Gupta (2005)).Government-owned firms are typically overstaffed and their workers often earnmore than workers in privately owned firms. For example, in 2003 over 10% ofworkers in the organized sector were employed in federal government-ownedfirms (Ministry of Finance (2004)),6 and their average wages were twice as highas in the private sector (Panagariya (2008)). This large wage difference suggestswhy government firm workers vigorously oppose privatization. Describing thisopposition, a news article reported that “Over 25,000 ONGC [Oil and NaturalGas Commission] staff observed ‘black day’ and their union leaders went onhunger strike to mark their protest over the privatisation move,” (The FinancialTimes, ONGC Staff Fight Change, September 17, 1993). In 2004, over one-thirdof the federal government–owned firms were loss-making and performed farworse in comparison to private firms in the same industry (Public EnterpriseSurvey (2005–06)).
6 Total employment in the organized sector in 2003 was 27 million workers, about 7% to 8% of thetotal workforce (Ministry of Finance (2004)). The organized sector refers to registered companiesthat are legally required to submit financial statements.
246 The Journal of Finance R©
B. Political System
The most populous democracy in the world, India has a parliamentary sys-tem where representatives are directly elected to the Lok Sabha, the lowerhouse in the federal government. Representatives are elected from 543 single-member districts distributed across 35 states, and the political party or allianceof parties that wins the majority of districts forms the national government.There has been no redistricting in India since 1971 because of a constitutionalamendment enacted in 1976 that postponed redistricting until after the 2000census, and the electoral districts remain the same throughout our sample pe-riod (Election Commission of India (2007)). We include electoral data on fiveelections to the federal government held since the start of the privatizationprogram in 1991, namely, the elections held in 1991, 1996, 1998, 1999, and2004.
On average, about 450 political parties participate in the elections. It iscommon for national political parties to establish alliances with each other andsmaller regional parties before the elections in order to increase their chancesof obtaining a majority. Hence, we study the electoral performance of politicalparty alliances. Following India’s independence from the United Kingdom in1947, the main political party was the ideologically center-left Congress Party.The economic reforms of 1991 were initiated by the Congress Party, which alongwith its allies won the 1991 elections and remained in power until the 1996elections. The ideologically right-wing BJP was the main opposition during thisperiod with the second largest number of seats.
Between 1996 and 1998, there were successive short-lived governments,which collapsed due to a lack of support from coalition members. Followingthe 1999 elections, a new coalition led by the BJP formed the government andremained in power until 2004, with the Congress Party alliance as the mainopposition. In the 2004 elections, the Congress Party and its allies obtained awinning majority with the BJP as the main opposition.
C. Privatization Process
In response to a balance of payments crisis in 1991, India undertook sweep-ing economic reforms that included deregulation and privatization. Out of 280nonfinancial firms owned by the federal government, 50 firms were privatizedbetween fiscal years 1991 to 2006.7 The list of firms to be privatized was de-cided at the Cabinet level and every government produced its own list. Theprivatization program was initiated by the Congress government in 1991, andafter a brief hiatus was continued by the BJP government when it came tooffice in 1999. Below, we describe the official policies and actual progress madeby the Congress and BJP governments.
First Phase (1991 to 1996): The official policy of the Congress governmentcalled for a reduction in government ownership in most firms in nonstrate-gic industries. The “Committee on Disinvestment of Shares in Public Sector
7 Fiscal year t starts in April of calendar year t and runs through March of calendar year t + 1.
The Decision to Privatize 247
Units” recommended in 1993 that government ownership be reduced to 26%,the minimum equity holding necessary for certain voting powers, in most non-strategic industries (Department of Disinvestment (2007)). However, in 1991,the Finance Minister said that the government would privatize only up to20% of equity to provide market discipline and raise money for the treasury(Department of Disinvestment (2007)).
The Congress government undertook partial privatizations where it soldminority equity stakes in 40 firms without transferring management control.While some of these firms sold equity multiple times, we restrict our analysisto the first sale to avoid the endogeneity that may arise if past equity salesaffect the probability of subsequent sales. Like many countries around theworld (La Porta, Lopez de Silanes, and Shleifer (2002) and Boubakri, Cos-set, and Guedhami (2005)), the majority of the privatizations undertakenby the Indian governments involved the sale of minority equity stakes incapital markets. Although the government continued to hold a majority ofshares, these firms became subject to market monitoring.8 Partially priva-tized firms are also more likely to sell majority stakes subsequently (Gupta(2005)). Hence, politicians have an incentive to resist partial privatizations bothbecause increased monitoring reduces patronage opportunities, and becausethese firms are candidates for the eventual sale of majority stakes to privateowners.
Privatization is deeply unpopular in India, as is demonstrated by the factthat it is officially referred to as “disinvestment.” Despite the fact that boththe Congress and BJP have undertaken some privatization, neither has anideological commitment to privatization and both parties have used antipriva-tization rhetoric to gain political advantage when in opposition. For example,the conservative BJP frequently attacked the Congress government’s priva-tization plans (Reuters News, Opposition Attacks India Disinvestment Pro-gramme, September 10, 1992), and even joined forces with labor unions toprotest privatization (Reuters News, India’s 250,000 Steel Workers Set NationalStrike, September 6, 1993). In 2004, sensing a public backlash against theBJP’s reform agenda, the Congress Party ran and won on a platform of limitedprivatizations.
Acknowledging the role of electoral politics, the Congress government PrimeMinister noted that, “If you face immediate political problems—elections infour states—it is hard to push ahead . . . We had to worry about the prospects ofunemployment if public sector units faced closure” (Asia Times, India’s ReformArchitect Looks on from the Sidelines, April 8, 1997).
8 Gupta (2005) shows that partially privatized Indian firms experience significant improvementsin performance relative to firms that remain fully government-owned, and the improvements arepositively related to the amount of equity sold. In contrast, in a “before-after” analysis of partiallyprivatized Chinese firms, Sun and Tong (2003) find that returns on sales decrease. However, usinga different sample of Chinese firms, Song and Yao (2004) find that earnings increase followingpartial privatization.
248 The Journal of Finance R©
Second Phase (1999 to 2003): Following the defeat of the Congress govern-ment in 1996, the privatization program remained in hiatus until the election ofthe BJP to the national government in 1999.9 The BJP government establisheda new “Department for Disinvestment,” which declared that the governmentwould undertake majority sale privatizations with the transfer of managementcontrol in all nonstrategic industries. Between 1999 and 2003, the BJP govern-ment privatized 10 firms that had not previously sold equity. The privatizationsundertaken by the BJP government include the sale of majority stakes and thetransfer of management control to private owners in 17 firms, some of whichhad previously been partially privatized. We also consider the control transferprivatizations separately.
Political considerations may explain why so few privatizations were under-taken by the BJP, since the opposition Congress Party campaigned againstit. In fact, attributing the defeat of the BJP-led National Democratic Alliancegovernment in the 2004 elections to its disinvestment [privatization] program,a major newspaper’s editorial opined, “The Indian voters . . . were rejecting theNational Democratic Alliance [NDA] government, which, as one poll slogan hadit, stood for the “National Disinvestment Agency” (The Hindu, Mass Media vs.Mass Reality, May 14, 2004).
Following the BJP’s defeat, a coalition led by the Congress Party formedthe government in 2004 with the stated policy that it would not privatize anyprofitable firms (Department of Disinvestment (2007)). During its tenure from2004 to 2008, the Congress-led government privatized just one new firm, in2004.
II. The Role of Financial and Political Factors in the Decisionto Privatize
In this section, we develop empirical predictions about the main financial andpolitical factors that are likely to affect the decision to privatize. To develop pre-dictions about financial factors that may influence the privatization process,we draw upon the literature on why private firms go public (Pagano, Paneta,and Zingales (1998) and Ritter and Welch (2002)). However, a major differencebetween the IPOs of private firms and the privatization of government-ownedfirms is that political factors are likely to play a significant role in the lattercase. We also develop hypotheses regarding the role of politics in the privatiza-tion decision, which we test using firm-level data on both privatized firms andfirms that remain fully government-owned.
9 Two short-lived governments sold equity in four firms between 1996 and 1998, including theglobal depository receipt issues in international markets of firms in the oil and telecommunicationssectors. Since these firms had previously sold equity between 1991 and 1995, to avoid endogeneitythey are not included again in the regression analysis.
The Decision to Privatize 249
A. Financial Factors: Firm Size and Profitability
If investors are less informed than issuers about the value of a company, thenthere may be adverse selection in the quality of firms that choose to go public(Leland and Pyle (1977)). Chemmanur and Fulghieri (1999) have argued thatthe cost of adverse selection is likely to be greater for younger and smaller firms,which is supported by the results of Pagano et al. (1998), who find that smallerfirms are less likely to go public. In the privatization context, Megginson et al.(2004) compare methods of sale in a cross-country sample of privatized firmsand find that larger firms are more likely to be privatized through the sale ofshares on public rather than private capital markets. Hence, we investigatewhether firm size has an impact on the privatization decision.
Governments may prefer to privatize more profitable firms first to increaseproceeds from privatization (Gupta, Ham, and Svejnar (2008)), and to buildpublic support with successful initial sales (Dewenter and Malatesta (1997)).However, the evidence also suggests that unprofitable firms experience thegreatest efficiency improvements following privatization (Claessens, Djankov,and Pohl (1997) and Frydman et al. (1999)). Hence, this relationship will de-pend on the relative emphasis placed by the government on proceeds and publicsupport over firm efficiency.
B. Political Factors
We investigate the role of politics using a political economy framework inwhich the benefits of privatization, such as sale proceeds, are likely to be dis-persed across the population, while the costs of privatization, such as layoffs,tend to be concentrated among a small group. To understand how these concen-trated costs may slow down privatization, we investigate the role of electoralconsiderations and political patronage on the decision to privatize.
Theory suggests that politicians may target public funds to pivotal regionswith swing voters to win elections (Lindbeck and Weibull (1987), Dixit andLondregan (1996), and Persson and Tabellini (2002)). Empirically, Bertrandet al. (2007) show that politically connected French firms create more jobsin politically competitive regions, and Dahlberg and Johansson (2002) findthat the distribution of grants in Sweden is concentrated in regions withmore swing voters. We investigate whether the privatization decision is af-fected by the closeness of the election in the political competition hypothesisbelow.
Rent-seeking politicians may also allocate public funds to reward supporterswith patronage (Cox and McCubbins (1986) and Persson and Tabellini (2002)).For example, Ansolabehere and Snyder (2007) show that governing partiesskew the distribution of public funds in favor of regions that support them. Weinvestigate whether politicians use government firms to benefit their support-ers in the patronage hypothesis below. Note that politicians may target bothregions that support them as well as regions that are politically competitive(Ansolabehere and Snyder (2007)).
250 The Journal of Finance R©
B.1. Political Competition and Strength
The costs of privatization, such as layoffs, are likely to be geographicallyconcentrated in the region where a firm operates. As a result, voter supportfor the governing party in that region may decrease because of oppositionfrom government workers in the region, and negative public perceptions aboutprivatization. The effect of a political backlash on electoral outcomes is likelyto be greater if the governing and opposition parties have similar levels ofvoter support. When the governing party faces strong competition from theopposition, a decrease in support may cause it to lose seats from that region.Correspondingly, if the governing party has far more or far less support thanthe opposition, then a political backlash may not have much impact on theelection. Thus, if political competition matters in the privatization decision, itfollows that the government will prefer to delay privatization in regions wherethe governing and opposition parties are in a close race.
The governing party may also choose to minimize the effects of a voter back-lash by delaying the privatization of firms located in constituencies where thegoverning party does not have strong support, or where the opposition partydoes. Alternatively, the government may choose to reward its supporters bydelaying privatization in regions where the governing party has strong sup-port. Hence, the question of the effect of the governing and opposition party’spolitical strength on the privatization decision is an empirical one. Note thatsupport for the governing and opposition parties is negatively correlated butmay not be exactly correlated in a multiparty system.
B.2. Political Patronage
It has been argued that a principal cause of inefficiency in government-ownedfirms is interference by politicians in the operations of the firm (Shleifer andVishny (1994)). For example, politicians can influence the hiring and purchasedecisions of government-owned firms so that they favor political supporters.If rent-seeking politicians obtain private benefits from controlling these firms(Boycko, Shleifer, and Vishny (1996) and Dinc (2005)), then any loss in thesebenefits following privatization may influence the decision to privatize. To ex-amine if political patronage affects the privatization decision, we investigatewhether rent-seeking politicians reward their supporters by delaying privati-zation in their home states.
III. Data
A. Financial Data
We observe financial data for 259 of the 280 manufacturing and nonfinan-cial service sector companies owned by the federal government of India. Toavoid attrition bias, we do not require the panel to be balanced. The data arecollected by the Centre for Monitoring the Indian Economy from company an-nual reports. We exclude three companies located in the state of Jammu and
The Decision to Privatize 251
Kashmir, where the elections were not always held during the sample perioddue to political unrest. Indian firms have to post profits for at least 3 out of theimmediately preceding 5 years to be able to list on the stock market (Securitiesand Exchange Board of India (2000), page 11). We restrict the sample to firmsthat post positive profits for 3 years preceding privatization, for all years except1999 to 2003. Between 1999 and 2003, firms were privatized through privateasset sales and did not need to meet these listing requirements to qualify forprivatization. The results do not change if we impose the listing requirementfor the entire sample.
The data used in the main regression analysis start in fiscal year 1990, 1 yearprior to the launch of the economic reforms of 1991, and end in fiscal year 2004(March 2005). Data on privatization transactions come from the DisinvestmentCommission of the Government of India, and from news sources. We also hand-collect data on the address of the main operations of each firm, which involvedcontacting many of these companies individually. About 80% of companies havetheir main operations located in only one electoral constituency. For companieswith multiple plants in different locations, we define the main plant as the onewith the largest asset base and use its location as the location for the firm.
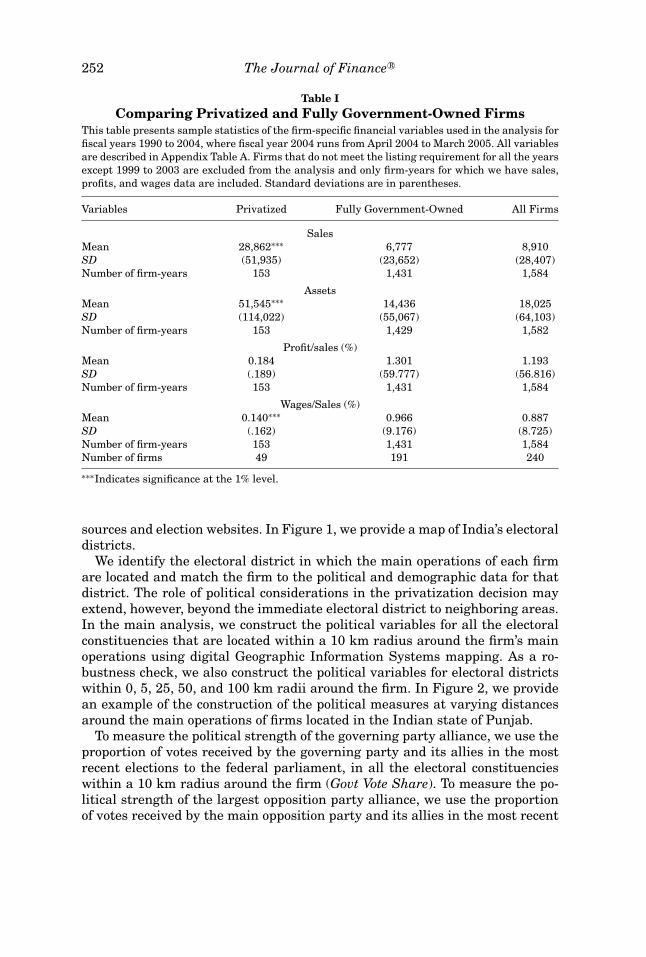
We observe financial data for 49 of the 50 federal government-owned firmsthat were privatized between 1991 and 2004. Table I provides sample statisticsfor the main variables used in the analysis and compares privatized firms withfirms that remain fully government-owned during this period. We include eachprivatized firm only until the year of privatization, defined as the first sale toprivate owners, in order to avoid capturing the effect of privatization on firmcharacteristics. All firms that remain fully government-owned are followeduntil the end of fiscal year 2004, or the latest year that data are available.
Comparing the preprivatization characteristics of privatized firms to firmsthat remain fully government-owned, we note several differences. In Table I,we report that the average annual sales of privatized firms are more than fourtimes larger than the average sales of firms not chosen for privatization, withthe difference significant at the 1% level. This comparison does not captureany performance improvements due to privatization because the privatizedcompanies are included in the sample only until the year in which they firstsell equity. Privatized companies also have lower wage expenses on averagecompared to their fully government-owned counterparts, as measured by theratio of the total wage bill to sales. We control for these differences by includingthese firm characteristics in all the regressions.
B. Political Data
We collect electoral data for each of the 543 single-member electoral districtson the vote shares obtained by national and regional political parties in allthe elections to the federal government held since the start of the privatiza-tion program in 1991 until 2004. These data are obtained from the ElectionCommission of India, which is in charge of conducting the elections. Infor-mation on which parties belong to the main alliances is obtained from press
252 The Journal of Finance R©
Table IComparing Privatized and Fully Government-Owned Firms
This table presents sample statistics of the firm-specific financial variables used in the analysis forfiscal years 1990 to 2004, where fiscal year 2004 runs from April 2004 to March 2005. All variablesare described in Appendix Table A. Firms that do not meet the listing requirement for all the yearsexcept 1999 to 2003 are excluded from the analysis and only firm-years for which we have sales,profits, and wages data are included. Standard deviations are in parentheses.
Variables Privatized Fully Government-Owned All Firms
SalesMean 28,862∗∗∗ 6,777 8,910SD (51,935) (23,652) (28,407)Number of firm-years 153 1,431 1,584
AssetsMean 51,545∗∗∗ 14,436 18,025SD (114,022) (55,067) (64,103)Number of firm-years 153 1,429 1,582
Profit/sales (%)Mean 0.184 1.301 1.193SD (.189) (59.777) (56.816)Number of firm-years 153 1,431 1,584
Wages/Sales (%)Mean 0.140∗∗∗ 0.966 0.887SD (.162) (9.176) (8.725)Number of firm-years 153 1,431 1,584Number of firms 49 191 240
∗∗∗Indicates significance at the 1% level.
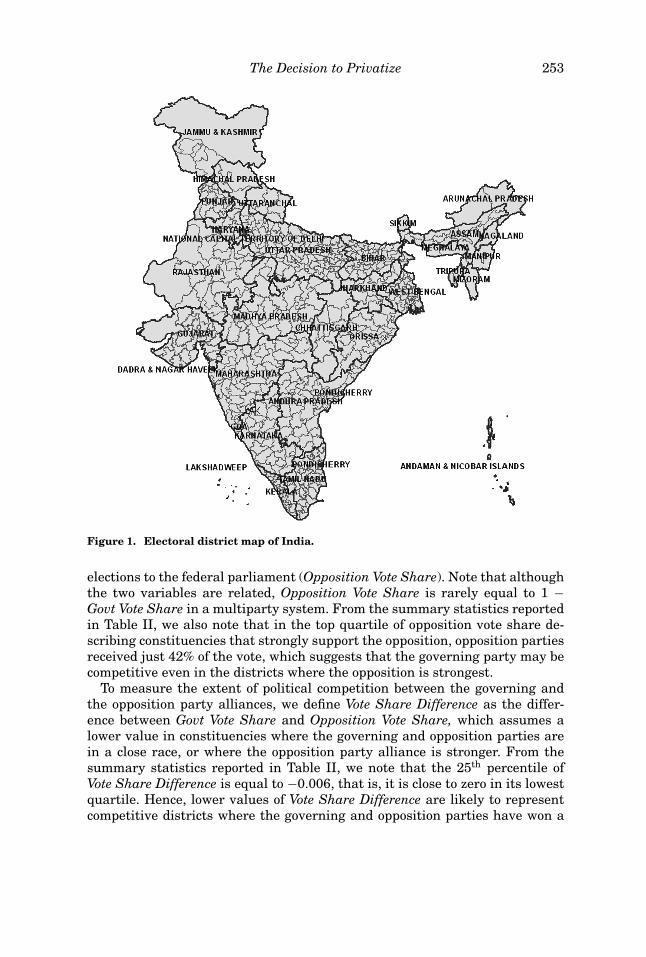
sources and election websites. In Figure 1, we provide a map of India’s electoraldistricts.
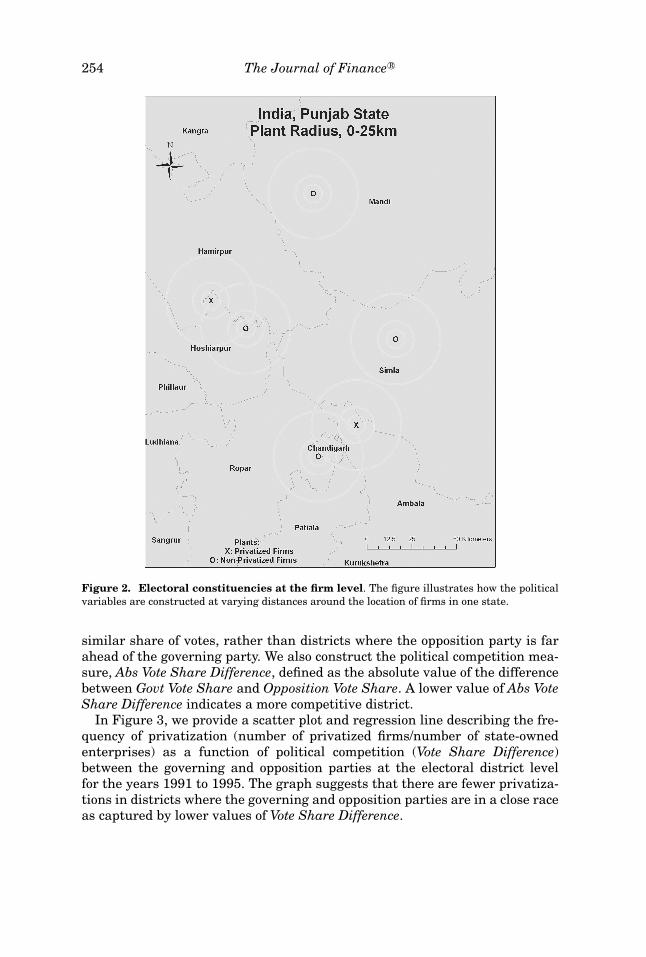
We identify the electoral district in which the main operations of each firmare located and match the firm to the political and demographic data for thatdistrict. The role of political considerations in the privatization decision mayextend, however, beyond the immediate electoral district to neighboring areas.In the main analysis, we construct the political variables for all the electoralconstituencies that are located within a 10 km radius around the firm’s mainoperations using digital Geographic Information Systems mapping. As a ro-bustness check, we also construct the political variables for electoral districtswithin 0, 5, 25, 50, and 100 km radii around the firm. In Figure 2, we providean example of the construction of the political measures at varying distancesaround the main operations of firms located in the Indian state of Punjab.
To measure the political strength of the governing party alliance, we use theproportion of votes received by the governing party and its allies in the mostrecent elections to the federal parliament, in all the electoral constituencieswithin a 10 km radius around the firm (Govt Vote Share). To measure the po-litical strength of the largest opposition party alliance, we use the proportionof votes received by the main opposition party and its allies in the most recent
The Decision to Privatize 253
Figure 1. Electoral district map of India.
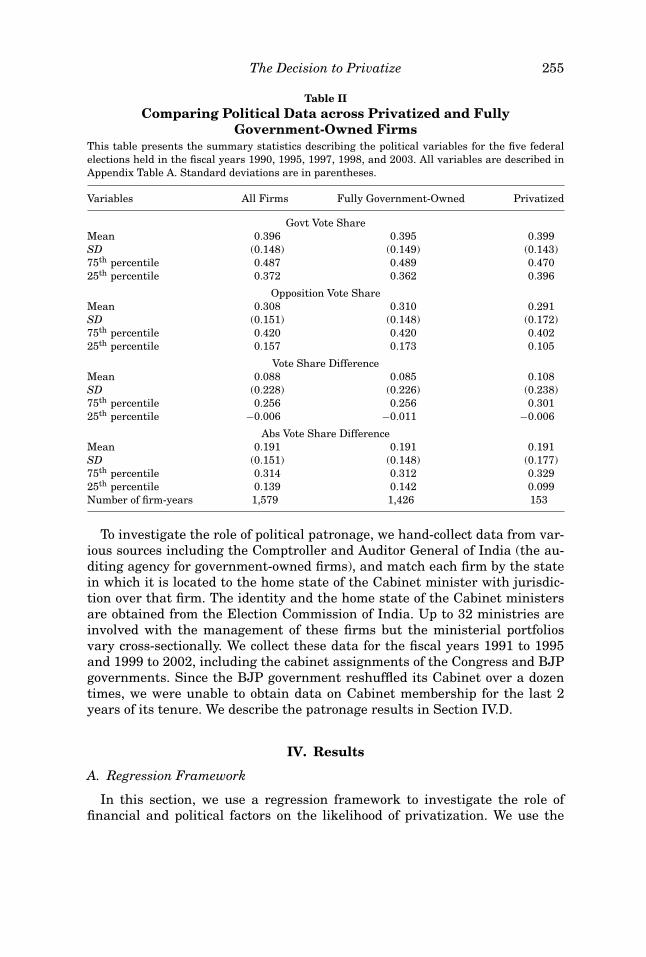
elections to the federal parliament (Opposition Vote Share). Note that althoughthe two variables are related, Opposition Vote Share is rarely equal to 1 −Govt Vote Share in a multiparty system. From the summary statistics reportedin Table II, we also note that in the top quartile of opposition vote share de-scribing constituencies that strongly support the opposition, opposition partiesreceived just 42% of the vote, which suggests that the governing party may becompetitive even in the districts where the opposition is strongest.
To measure the extent of political competition between the governing andthe opposition party alliances, we define Vote Share Difference as the differ-ence between Govt Vote Share and Opposition Vote Share, which assumes alower value in constituencies where the governing and opposition parties arein a close race, or where the opposition party alliance is stronger. From thesummary statistics reported in Table II, we note that the 25th percentile ofVote Share Difference is equal to −0.006, that is, it is close to zero in its lowestquartile. Hence, lower values of Vote Share Difference are likely to representcompetitive districts where the governing and opposition parties have won a
254 The Journal of Finance R©
Figure 2. Electoral constituencies at the firm level. The figure illustrates how the politicalvariables are constructed at varying distances around the location of firms in one state.
similar share of votes, rather than districts where the opposition party is farahead of the governing party. We also construct the political competition mea-sure, Abs Vote Share Difference, defined as the absolute value of the differencebetween Govt Vote Share and Opposition Vote Share. A lower value of Abs VoteShare Difference indicates a more competitive district.
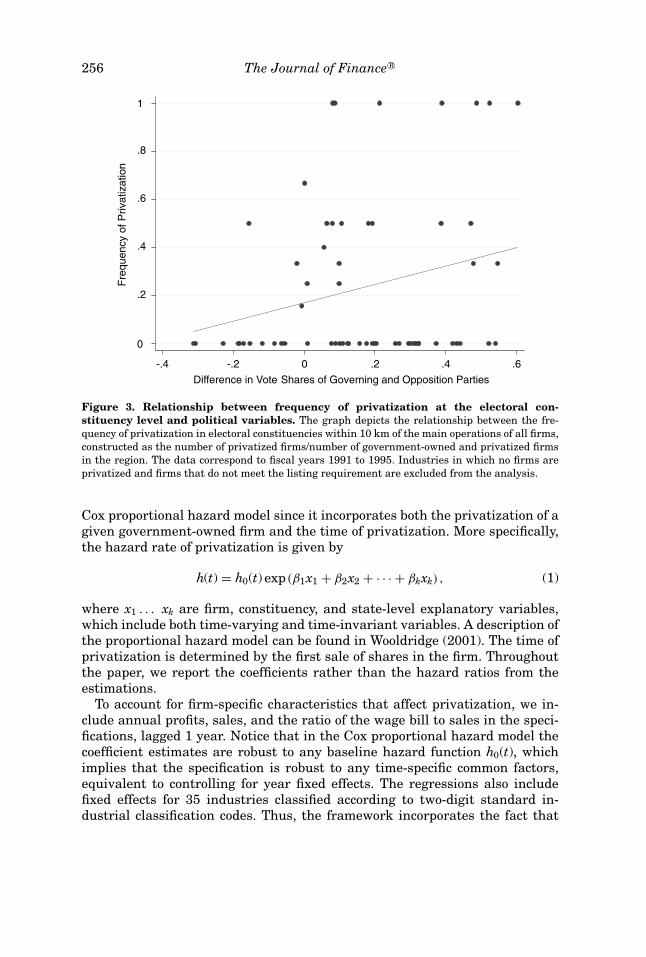
In Figure 3, we provide a scatter plot and regression line describing the fre-quency of privatization (number of privatized firms/number of state-ownedenterprises) as a function of political competition (Vote Share Difference)between the governing and opposition parties at the electoral district levelfor the years 1991 to 1995. The graph suggests that there are fewer privatiza-tions in districts where the governing and opposition parties are in a close raceas captured by lower values of Vote Share Difference.
The Decision to Privatize 255
Table IIComparing Political Data across Privatized and Fully
Government-Owned FirmsThis table presents the summary statistics describing the political variables for the five federalelections held in the fiscal years 1990, 1995, 1997, 1998, and 2003. All variables are described inAppendix Table A. Standard deviations are in parentheses.
Variables All Firms Fully Government-Owned Privatized
Govt Vote ShareMean 0.396 0.395 0.399SD (0.148) (0.149) (0.143)75th percentile 0.487 0.489 0.47025th percentile 0.372 0.362 0.396
Opposition Vote ShareMean 0.308 0.310 0.291SD (0.151) (0.148) (0.172)75th percentile 0.420 0.420 0.40225th percentile 0.157 0.173 0.105
Vote Share DifferenceMean 0.088 0.085 0.108SD (0.228) (0.226) (0.238)75th percentile 0.256 0.256 0.30125th percentile −0.006 −0.011 −0.006
Abs Vote Share DifferenceMean 0.191 0.191 0.191SD (0.151) (0.148) (0.177)75th percentile 0.314 0.312 0.32925th percentile 0.139 0.142 0.099Number of firm-years 1,579 1,426 153
To investigate the role of political patronage, we hand-collect data from var-ious sources including the Comptroller and Auditor General of India (the au-diting agency for government-owned firms), and match each firm by the statein which it is located to the home state of the Cabinet minister with jurisdic-tion over that firm. The identity and the home state of the Cabinet ministersare obtained from the Election Commission of India. Up to 32 ministries areinvolved with the management of these firms but the ministerial portfoliosvary cross-sectionally. We collect these data for the fiscal years 1991 to 1995and 1999 to 2002, including the cabinet assignments of the Congress and BJPgovernments. Since the BJP government reshuffled its Cabinet over a dozentimes, we were unable to obtain data on Cabinet membership for the last 2years of its tenure. We describe the patronage results in Section IV.D.
IV. Results
A. Regression Framework
In this section, we use a regression framework to investigate the role offinancial and political factors on the likelihood of privatization. We use the
256 The Journal of Finance R©
0
.2
.4
.6
.8
1
Fre
quency o
f P
rivatization
-.4 -.2 0 .2 .4 .6
Difference in Vote Shares of Governing and Opposition Parties
Figure 3. Relationship between frequency of privatization at the electoral con-stituency level and political variables. The graph depicts the relationship between the fre-quency of privatization in electoral constituencies within 10 km of the main operations of all firms,constructed as the number of privatized firms/number of government-owned and privatized firmsin the region. The data correspond to fiscal years 1991 to 1995. Industries in which no firms areprivatized and firms that do not meet the listing requirement are excluded from the analysis.
Cox proportional hazard model since it incorporates both the privatization of agiven government-owned firm and the time of privatization. More specifically,the hazard rate of privatization is given by
h(t) = h0(t) exp (β1x1 + β2x2 + · · · + βkxk) , (1)
where x1 . . . xk are firm, constituency, and state-level explanatory variables,which include both time-varying and time-invariant variables. A description ofthe proportional hazard model can be found in Wooldridge (2001). The time ofprivatization is determined by the first sale of shares in the firm. Throughoutthe paper, we report the coefficients rather than the hazard ratios from theestimations.
To account for firm-specific characteristics that affect privatization, we in-clude annual profits, sales, and the ratio of the wage bill to sales in the speci-fications, lagged 1 year. Notice that in the Cox proportional hazard model thecoefficient estimates are robust to any baseline hazard function h0(t), whichimplies that the specification is robust to any time-specific common factors,equivalent to controlling for year fixed effects. The regressions also includefixed effects for 35 industries classified according to two-digit standard in-dustrial classification codes. Thus, the framework incorporates the fact that
The Decision to Privatize 257
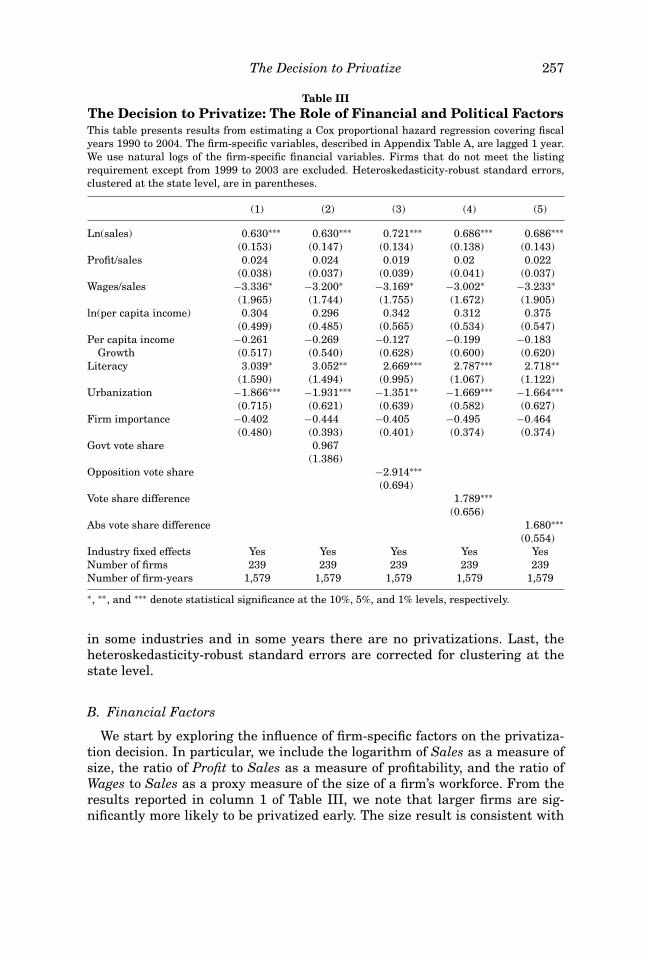
Table IIIThe Decision to Privatize: The Role of Financial and Political FactorsThis table presents results from estimating a Cox proportional hazard regression covering fiscalyears 1990 to 2004. The firm-specific variables, described in Appendix Table A, are lagged 1 year.We use natural logs of the firm-specific financial variables. Firms that do not meet the listingrequirement except from 1999 to 2003 are excluded. Heteroskedasticity-robust standard errors,clustered at the state level, are in parentheses.
(1) (2) (3) (4) (5)
Ln(sales) 0.630∗∗∗ 0.630∗∗∗ 0.721∗∗∗ 0.686∗∗∗ 0.686∗∗∗(0.153) (0.147) (0.134) (0.138) (0.143)
Profit/sales 0.024 0.024 0.019 0.02 0.022(0.038) (0.037) (0.039) (0.041) (0.037)
Wages/sales −3.336∗ −3.200∗ −3.169∗ −3.002∗ −3.233∗(1.965) (1.744) (1.755) (1.672) (1.905)
ln(per capita income) 0.304 0.296 0.342 0.312 0.375(0.499) (0.485) (0.565) (0.534) (0.547)
Per capita income −0.261 −0.269 −0.127 −0.199 −0.183Growth (0.517) (0.540) (0.628) (0.600) (0.620)
Literacy 3.039∗ 3.052∗∗ 2.669∗∗∗ 2.787∗∗∗ 2.718∗∗(1.590) (1.494) (0.995) (1.067) (1.122)
Urbanization −1.866∗∗∗ −1.931∗∗∗ −1.351∗∗ −1.669∗∗∗ −1.664∗∗∗(0.715) (0.621) (0.639) (0.582) (0.627)
Firm importance −0.402 −0.444 −0.405 −0.495 −0.464(0.480) (0.393) (0.401) (0.374) (0.374)
Govt vote share 0.967(1.386)
Opposition vote share −2.914∗∗∗(0.694)
Vote share difference 1.789∗∗∗(0.656)
Abs vote share difference 1.680∗∗∗(0.554)
Industry fixed effects Yes Yes Yes Yes YesNumber of firms 239 239 239 239 239Number of firm-years 1,579 1,579 1,579 1,579 1,579
∗, ∗∗, and ∗∗∗ denote statistical significance at the 10%, 5%, and 1% levels, respectively.
in some industries and in some years there are no privatizations. Last, theheteroskedasticity-robust standard errors are corrected for clustering at thestate level.
B. Financial Factors
We start by exploring the influence of firm-specific factors on the privatiza-tion decision. In particular, we include the logarithm of Sales as a measure ofsize, the ratio of Profit to Sales as a measure of profitability, and the ratio ofWages to Sales as a proxy measure of the size of a firm’s workforce. From theresults reported in column 1 of Table III, we note that larger firms are sig-nificantly more likely to be privatized early. The size result is consistent with
258 The Journal of Finance R©
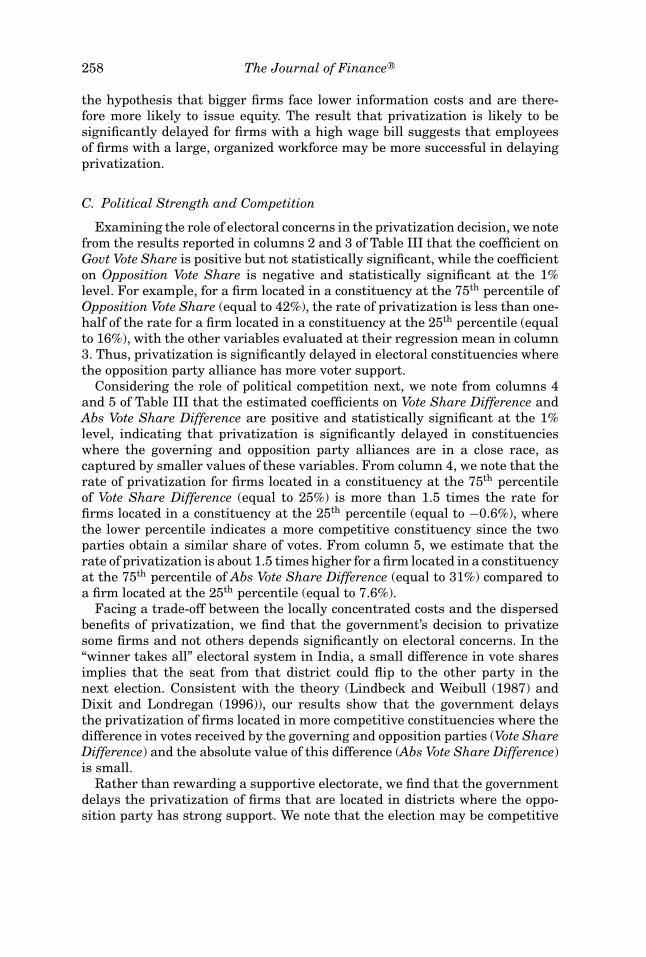
the hypothesis that bigger firms face lower information costs and are there-fore more likely to issue equity. The result that privatization is likely to besignificantly delayed for firms with a high wage bill suggests that employeesof firms with a large, organized workforce may be more successful in delayingprivatization.
C. Political Strength and Competition
Examining the role of electoral concerns in the privatization decision, we notefrom the results reported in columns 2 and 3 of Table III that the coefficient onGovt Vote Share is positive but not statistically significant, while the coefficienton Opposition Vote Share is negative and statistically significant at the 1%level. For example, for a firm located in a constituency at the 75th percentile ofOpposition Vote Share (equal to 42%), the rate of privatization is less than one-half of the rate for a firm located in a constituency at the 25th percentile (equalto 16%), with the other variables evaluated at their regression mean in column3. Thus, privatization is significantly delayed in electoral constituencies wherethe opposition party alliance has more voter support.
Considering the role of political competition next, we note from columns 4and 5 of Table III that the estimated coefficients on Vote Share Difference andAbs Vote Share Difference are positive and statistically significant at the 1%level, indicating that privatization is significantly delayed in constituencieswhere the governing and opposition party alliances are in a close race, ascaptured by smaller values of these variables. From column 4, we note that therate of privatization for firms located in a constituency at the 75th percentileof Vote Share Difference (equal to 25%) is more than 1.5 times the rate forfirms located in a constituency at the 25th percentile (equal to −0.6%), wherethe lower percentile indicates a more competitive constituency since the twoparties obtain a similar share of votes. From column 5, we estimate that therate of privatization is about 1.5 times higher for a firm located in a constituencyat the 75th percentile of Abs Vote Share Difference (equal to 31%) compared toa firm located at the 25th percentile (equal to 7.6%).
Facing a trade-off between the locally concentrated costs and the dispersedbenefits of privatization, we find that the government’s decision to privatizesome firms and not others depends significantly on electoral concerns. In the“winner takes all” electoral system in India, a small difference in vote sharesimplies that the seat from that district could flip to the other party in thenext election. Consistent with the theory (Lindbeck and Weibull (1987) andDixit and Londregan (1996)), our results show that the government delaysthe privatization of firms located in more competitive constituencies where thedifference in votes received by the governing and opposition parties (Vote ShareDifference) and the absolute value of this difference (Abs Vote Share Difference)is small.
Rather than rewarding a supportive electorate, we find that the governmentdelays the privatization of firms that are located in districts where the oppo-sition party has strong support. We note that the election may be competitive
The Decision to Privatize 259
even in districts where the opposition is strong. For example, in constituencieswhere the opposition party vote share is in the 75th percentile of the sample,these parties won just 42% of the vote, or less than a majority (Table II).
In addition to electoral factors, we investigate the influence of location-specific demographic characteristics such as state-level income (Ln Per CapitaIncome) and growth opportunities (Per Capita Income Growth, the annualchange in per capita income) on the decision to privatize. At the electoraldistrict level, we consider the literacy and urbanization rates in a 10 km radiusaround the firm’s main operations. From the results reported in Table III, itappears that the privatization rate is significantly higher in districts with amore literate population, suggesting that educated voters may favor reforms.Privatization is significantly delayed in more urban districts, which indicates astronger presence of organized labor in industrialized urban areas rather thanagricultural rural districts. The political results are robust to these regionaldifferences in socioeconomic characteristics.
The government may also delay privatization in a region with manygovernment-owned firms because there will be more workers opposed to priva-tization in that region. To investigate this possibility, we consider the relativesize of a firm in an electoral constituency with the variable Firm Importance,the ratio of a firm’s sales to the total sales of all government-owned firms inthe region. As reported in Table III, the estimated coefficient on this variableis negative but not statistically significant.
D. Political Patronage
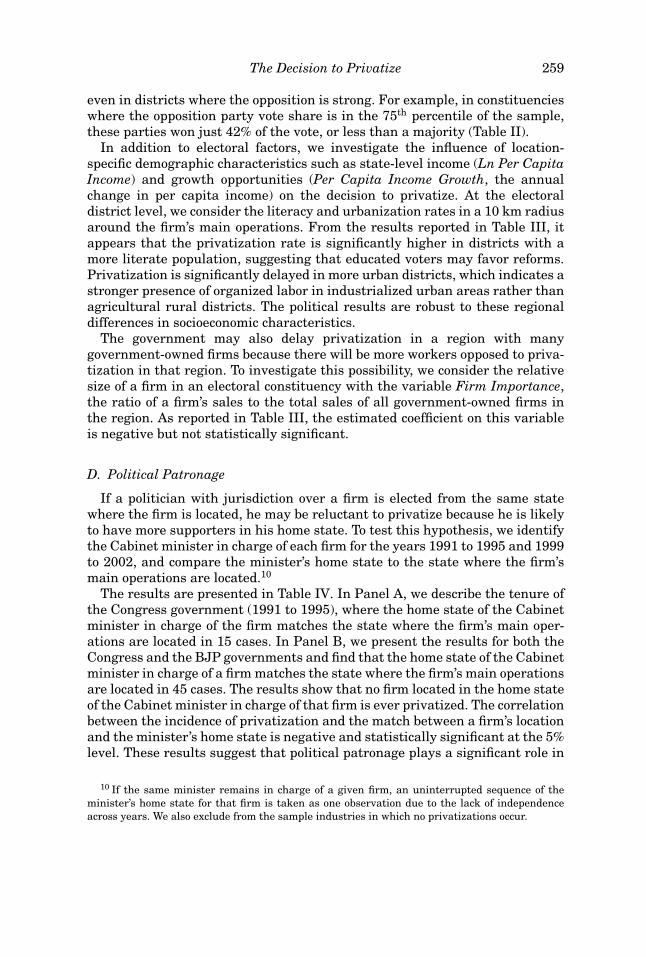
If a politician with jurisdiction over a firm is elected from the same statewhere the firm is located, he may be reluctant to privatize because he is likelyto have more supporters in his home state. To test this hypothesis, we identifythe Cabinet minister in charge of each firm for the years 1991 to 1995 and 1999to 2002, and compare the minister’s home state to the state where the firm’smain operations are located.10
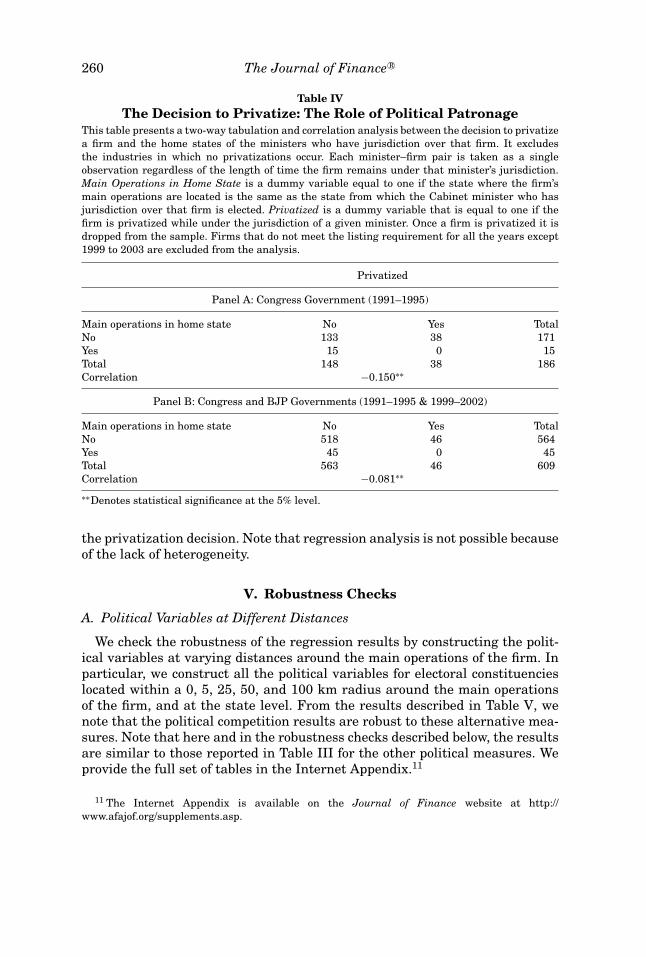
The results are presented in Table IV. In Panel A, we describe the tenure ofthe Congress government (1991 to 1995), where the home state of the Cabinetminister in charge of the firm matches the state where the firm’s main oper-ations are located in 15 cases. In Panel B, we present the results for both theCongress and the BJP governments and find that the home state of the Cabinetminister in charge of a firm matches the state where the firm’s main operationsare located in 45 cases. The results show that no firm located in the home stateof the Cabinet minister in charge of that firm is ever privatized. The correlationbetween the incidence of privatization and the match between a firm’s locationand the minister’s home state is negative and statistically significant at the 5%level. These results suggest that political patronage plays a significant role in
10 If the same minister remains in charge of a given firm, an uninterrupted sequence of theminister’s home state for that firm is taken as one observation due to the lack of independenceacross years. We also exclude from the sample industries in which no privatizations occur.
260 The Journal of Finance R©
Table IVThe Decision to Privatize: The Role of Political Patronage
This table presents a two-way tabulation and correlation analysis between the decision to privatizea firm and the home states of the ministers who have jurisdiction over that firm. It excludesthe industries in which no privatizations occur. Each minister–firm pair is taken as a singleobservation regardless of the length of time the firm remains under that minister’s jurisdiction.Main Operations in Home State is a dummy variable equal to one if the state where the firm’smain operations are located is the same as the state from which the Cabinet minister who hasjurisdiction over that firm is elected. Privatized is a dummy variable that is equal to one if thefirm is privatized while under the jurisdiction of a given minister. Once a firm is privatized it isdropped from the sample. Firms that do not meet the listing requirement for all the years except1999 to 2003 are excluded from the analysis.
Privatized
Panel A: Congress Government (1991–1995)
Main operations in home state No Yes TotalNo 133 38 171Yes 15 0 15Total 148 38 186Correlation −0.150∗∗
Panel B: Congress and BJP Governments (1991–1995 & 1999–2002)
Main operations in home state No Yes TotalNo 518 46 564Yes 45 0 45Total 563 46 609Correlation −0.081∗∗
∗∗Denotes statistical significance at the 5% level.
the privatization decision. Note that regression analysis is not possible becauseof the lack of heterogeneity.
V. Robustness Checks
A. Political Variables at Different Distances
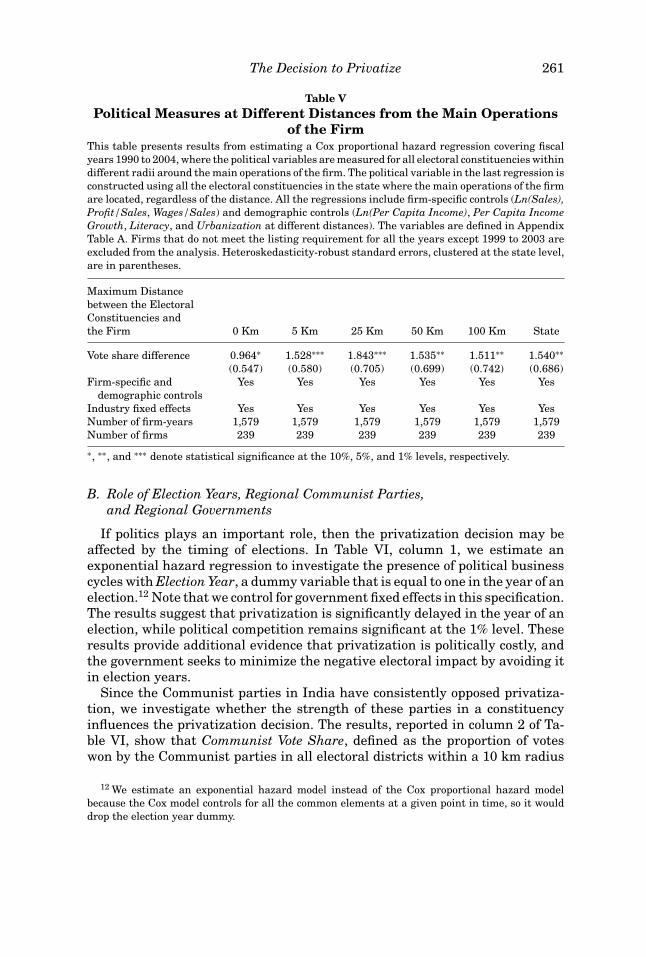
We check the robustness of the regression results by constructing the polit-ical variables at varying distances around the main operations of the firm. Inparticular, we construct all the political variables for electoral constituencieslocated within a 0, 5, 25, 50, and 100 km radius around the main operationsof the firm, and at the state level. From the results described in Table V, wenote that the political competition results are robust to these alternative mea-sures. Note that here and in the robustness checks described below, the resultsare similar to those reported in Table III for the other political measures. Weprovide the full set of tables in the Internet Appendix.11
11 The Internet Appendix is available on the Journal of Finance website at http://www.afajof.org/supplements.asp.
The Decision to Privatize 261
Table VPolitical Measures at Different Distances from the Main Operations
of the FirmThis table presents results from estimating a Cox proportional hazard regression covering fiscalyears 1990 to 2004, where the political variables are measured for all electoral constituencies withindifferent radii around the main operations of the firm. The political variable in the last regression isconstructed using all the electoral constituencies in the state where the main operations of the firmare located, regardless of the distance. All the regressions include firm-specific controls (Ln(Sales),Profit/Sales, Wages/Sales) and demographic controls (Ln(Per Capita Income), Per Capita IncomeGrowth, Literacy, and Urbanization at different distances). The variables are defined in AppendixTable A. Firms that do not meet the listing requirement for all the years except 1999 to 2003 areexcluded from the analysis. Heteroskedasticity-robust standard errors, clustered at the state level,are in parentheses.
Maximum Distancebetween the ElectoralConstituencies andthe Firm 0 Km 5 Km 25 Km 50 Km 100 Km State
Vote share difference 0.964∗ 1.528∗∗∗ 1.843∗∗∗ 1.535∗∗ 1.511∗∗ 1.540∗∗(0.547) (0.580) (0.705) (0.699) (0.742) (0.686)
Firm-specific anddemographic controls
Yes Yes Yes Yes Yes Yes
Industry fixed effects Yes Yes Yes Yes Yes YesNumber of firm-years 1,579 1,579 1,579 1,579 1,579 1,579Number of firms 239 239 239 239 239 239
∗, ∗∗, and ∗∗∗ denote statistical significance at the 10%, 5%, and 1% levels, respectively.
B. Role of Election Years, Regional Communist Parties,and Regional Governments
If politics plays an important role, then the privatization decision may beaffected by the timing of elections. In Table VI, column 1, we estimate anexponential hazard regression to investigate the presence of political businesscycles with Election Year, a dummy variable that is equal to one in the year of anelection.12 Note that we control for government fixed effects in this specification.The results suggest that privatization is significantly delayed in the year of anelection, while political competition remains significant at the 1% level. Theseresults provide additional evidence that privatization is politically costly, andthe government seeks to minimize the negative electoral impact by avoiding itin election years.
Since the Communist parties in India have consistently opposed privatiza-tion, we investigate whether the strength of these parties in a constituencyinfluences the privatization decision. The results, reported in column 2 of Ta-ble VI, show that Communist Vote Share, defined as the proportion of voteswon by the Communist parties in all electoral districts within a 10 km radius
12 We estimate an exponential hazard model instead of the Cox proportional hazard modelbecause the Cox model controls for all the common elements at a given point in time, so it woulddrop the election year dummy.
262 The Journal of Finance R©
Table VIElection Years, Communist Parties, and Regional Politics
This table presents results from estimating exponential and Cox proportional hazard regressions ofthe government’s decision to privatize, covering fiscal years 1990 to 2004. All variables are describedin Appendix Table A. Firms that do not meet the listing requirement for all the years except 1999to 2003 are excluded from the analysis. The first regression also includes government fixed effects.Heteroskedasticity-robust standard errors, clustered at the state level, are in parentheses.
(1) (2) (3)
Ln(sales) 0.702∗∗∗ 0.693∗∗∗ 0.685∗∗∗(0.126) (0.137) (0.138)
Profit/sales 0.018 0.016 0.02(0.046) (0.040) (0.041)
Wages/sales −3.126∗ −3.049∗ −2.987∗(1.693) (1.689) (1.666)
Election year −1.801∗(1.038)
Communist vote share 0.87(1.065)
State assembly majority −0.292(0.718)
Vote share difference 1.813∗∗ 1.700∗∗ 1.756∗∗∗(0.705) (0.705) (0.666)
Demographics controls Yes Yes YesIndustry fixed effects Yes Yes YesNumber of firms 239 239 239Number of firm-years 1,579 1,579 1,579Hazard model Exponential Cox Cox
∗, ∗∗, and ∗∗∗ denote statistical significance at the 10%, 5%, and 1% levels, respectively.
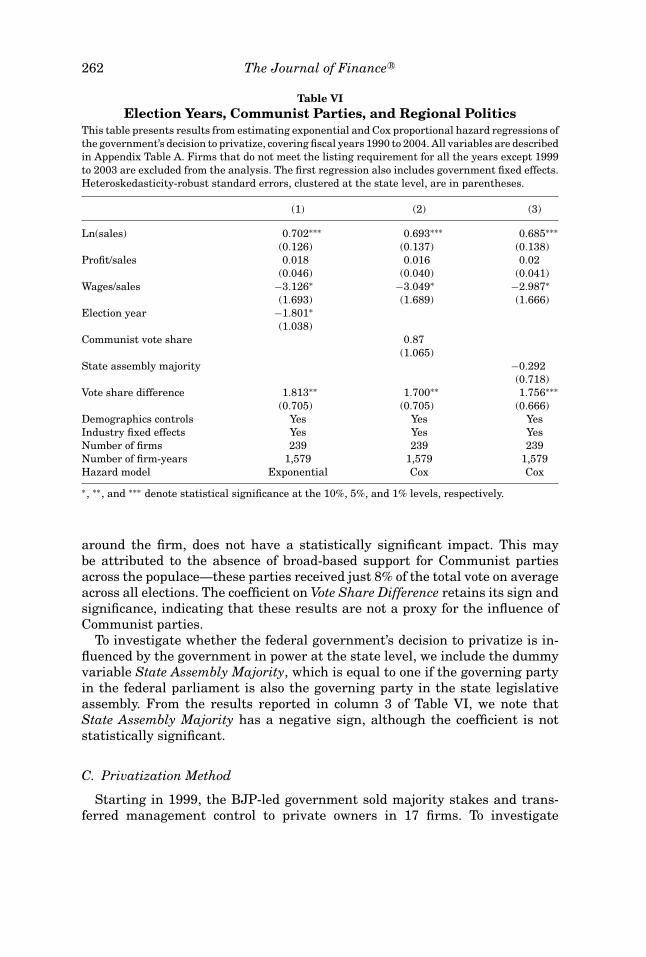
around the firm, does not have a statistically significant impact. This maybe attributed to the absence of broad-based support for Communist partiesacross the populace—these parties received just 8% of the total vote on averageacross all elections. The coefficient on Vote Share Difference retains its sign andsignificance, indicating that these results are not a proxy for the influence ofCommunist parties.
To investigate whether the federal government’s decision to privatize is in-fluenced by the government in power at the state level, we include the dummyvariable State Assembly Majority, which is equal to one if the governing partyin the federal parliament is also the governing party in the state legislativeassembly. From the results reported in column 3 of Table VI, we note thatState Assembly Majority has a negative sign, although the coefficient is notstatistically significant.
C. Privatization Method
Starting in 1999, the BJP-led government sold majority stakes and trans-ferred management control to private owners in 17 firms. To investigate
The Decision to Privatize 263
Table VIIPrivatization with the Transfer of Management Control (1999–2003)
This table presents the results from estimating a Cox proportional hazard regression of the gov-ernment’s decision to sell majority stakes and transfer management control in 17 firms startingin 1999. The political variables are constructed using data from the 1999 federal elections and thevariables are described in Appendix Table A. Heteroskedasticity-robust standard errors, clusteredat the state level, are in parentheses.
(1) (2)
Ln(sales) 0.169 0.167(0.197) (0.203)
Profit/sales −0.309 −0.280(0.251) (0.238)
Wages/sales −3.767 −4.014∗(2.390) (2.180)
Ln(per capita income) 0.202 0.291(0.442) (0.531)
Per capita income growth −1.329∗ −1.371∗(0.734) (0.727)
Literacy 3.557∗ 5.034∗(2.025) (2.982)
Urbanization −2.663 −3.584∗∗(1.736) (1.391)
Firm importance −0.356 −0.490(0.893) (0.915)
Vote share difference 2.422∗(1.305)
Industry fixed effects Yes YesNumber of firms 223 223Number of firm-years 878 878
∗ and ∗∗ denote statistical significance at the 10% and 5% levels, respectively.
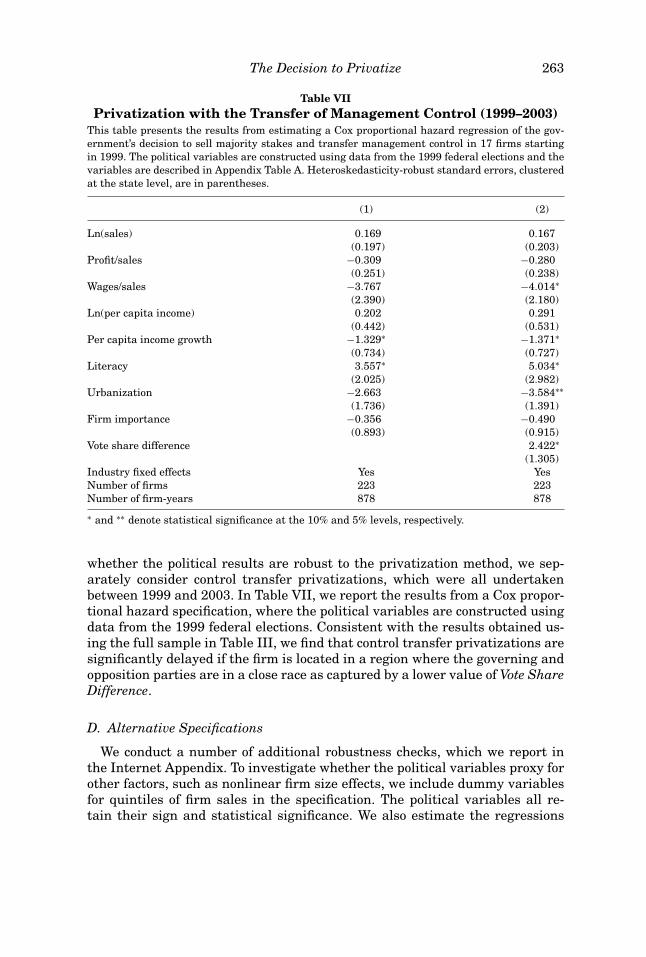
whether the political results are robust to the privatization method, we sep-arately consider control transfer privatizations, which were all undertakenbetween 1999 and 2003. In Table VII, we report the results from a Cox propor-tional hazard specification, where the political variables are constructed usingdata from the 1999 federal elections. Consistent with the results obtained us-ing the full sample in Table III, we find that control transfer privatizations aresignificantly delayed if the firm is located in a region where the governing andopposition parties are in a close race as captured by a lower value of Vote ShareDifference.
D. Alternative Specifications
We conduct a number of additional robustness checks, which we report inthe Internet Appendix. To investigate whether the political variables proxy forother factors, such as nonlinear firm size effects, we include dummy variablesfor quintiles of firm sales in the specification. The political variables all re-tain their sign and statistical significance. We also estimate the regressions
264 The Journal of Finance R©
with the firm-specific variables winsorized a total of 5% to mitigate the ef-fect of potential outliers and find that the coefficients on the political vari-ables are similar in sign and statistical significance to those in Table III.Last, we investigate whether the political results are robust to restrictingthe sample to the 15 largest Indian states and find that the estimated coef-ficients on the political variables retain their sign and are highly statisticallysignificant.
VI. Impact of Privatization on Firm Performance
Our results suggest that firms’ financial characteristics have a significantimpact on the government’s decision to privatize. This raises an identificationissue for evaluating the effect of privatization on firm performance. For exam-ple, if the government is more likely to privatize profitable firms, then compar-ing the performance of privatized firms to firms that remain government-ownedmay overstate the impact of privatization on profitability. Our analysis providesa potential identification strategy using political variables as an instrument forthe privatization decision.
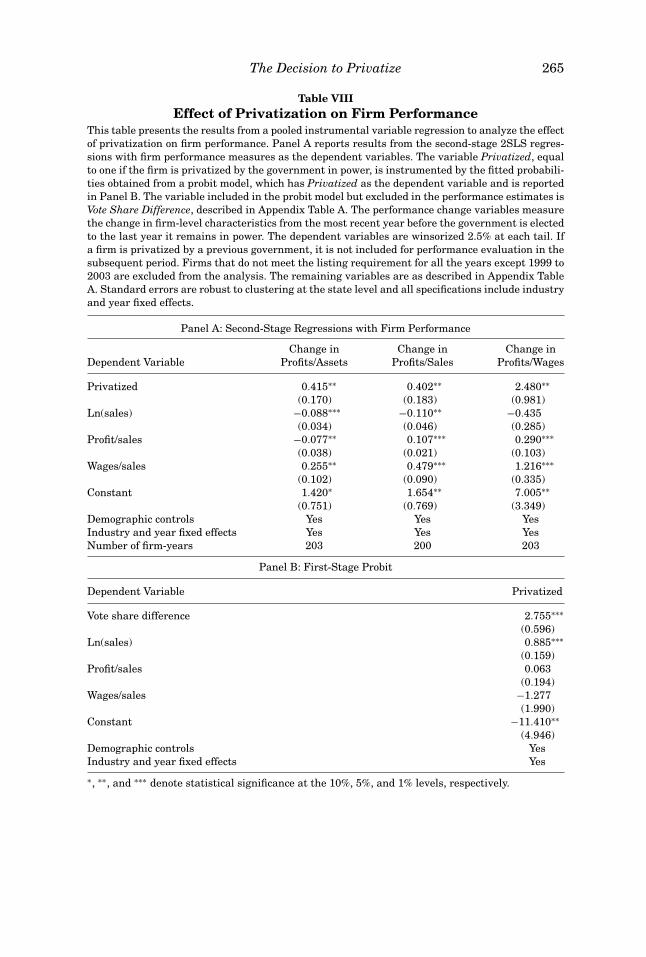
We estimate a two-stage least squares treatment effects regression by poolingdata from the Congress (1991 to 1995) and BJP years (1999 to 2003), and usingthe political competition measure Vote Share Difference as an instrument for thevariable Privatized, which takes the value of one if the firm is privatized by thegovernment in power.13 The regressions also include all the firm-specific anddemographic controls in Table III, as well as industry and year fixed effects.14
The control group is firms that have not been privatized. From the first-stageprobit regression results reported in Panel B of Table VIII, we note that VoteShare Difference has a positive and highly statistically significant impact (atthe 1% level) on the probability of privatization.
In the second-stage regressions, the dependent variables capture the changein firm performance during the tenure of a particular government, and arewinsorized 2.5% at each tail to mitigate the effect of outliers. If a firm wasprivatized by a previous government, it is dropped from the sample in thesubsequent period.
The results from the second stage of the instrumental variable regressionare reported in Panel A of Table VIII. From columns 1 to 3, we note thatcompared to firms that remain fully government-owned, privatized firms ex-perience a significant increase in productivity and profitability. Specifically,Profits/Sales, Profits/Assets, and Profits/Wages increase significantly follow-ing privatization. Using political variables to address the endogeneity of the
13 We follow Wooldridge (2007, p. 4) and fit a probit model with Privatized as the dependentvariable, we then use the fitted probabilities from this model as an instrument for Privatized in a2SLS estimation.
14 The regressions include two observations for each firm, one from the Congress period and theother from the BJP era. The exception is firms that are privatized by the Congress government,which are dropped from the sample in the subsequent BJP years to avoid endogeneity.
The Decision to Privatize 265
Table VIIIEffect of Privatization on Firm Performance
This table presents the results from a pooled instrumental variable regression to analyze the effectof privatization on firm performance. Panel A reports results from the second-stage 2SLS regres-sions with firm performance measures as the dependent variables. The variable Privatized, equalto one if the firm is privatized by the government in power, is instrumented by the fitted probabili-ties obtained from a probit model, which has Privatized as the dependent variable and is reportedin Panel B. The variable included in the probit model but excluded in the performance estimates isVote Share Difference, described in Appendix Table A. The performance change variables measurethe change in firm-level characteristics from the most recent year before the government is electedto the last year it remains in power. The dependent variables are winsorized 2.5% at each tail. Ifa firm is privatized by a previous government, it is not included for performance evaluation in thesubsequent period. Firms that do not meet the listing requirement for all the years except 1999 to2003 are excluded from the analysis. The remaining variables are as described in Appendix TableA. Standard errors are robust to clustering at the state level and all specifications include industryand year fixed effects.
Panel A: Second-Stage Regressions with Firm Performance
Change in Change in Change inDependent Variable Profits/Assets Profits/Sales Profits/Wages
Privatized 0.415∗∗ 0.402∗∗ 2.480∗∗(0.170) (0.183) (0.981)
Ln(sales) −0.088∗∗∗ −0.110∗∗ −0.435(0.034) (0.046) (0.285)
Profit/sales −0.077∗∗ 0.107∗∗∗ 0.290∗∗∗(0.038) (0.021) (0.103)
Wages/sales 0.255∗∗ 0.479∗∗∗ 1.216∗∗∗(0.102) (0.090) (0.335)
Constant 1.420∗ 1.654∗∗ 7.005∗∗(0.751) (0.769) (3.349)
Demographic controls Yes Yes YesIndustry and year fixed effects Yes Yes YesNumber of firm-years 203 200 203
Panel B: First-Stage Probit
Dependent Variable Privatized
Vote share difference 2.755∗∗∗(0.596)
Ln(sales) 0.885∗∗∗(0.159)
Profit/sales 0.063(0.194)
Wages/sales −1.277(1.990)
Constant −11.410∗∗(4.946)
Demographic controls YesIndustry and year fixed effects Yes
∗, ∗∗, and ∗∗∗ denote statistical significance at the 10%, 5%, and 1% levels, respectively.
266 The Journal of Finance R©
privatization decision to firm characteristics, our results suggest that priva-tization leads to a significant improvement in the efficiency and profitabilityof government-owned firms. Thus, the instrumental variable analysis allowsus to distinguish the impact of privatization on firm performance from theendogenous selection of better firms for privatization.
VII. Conclusion
Based on the fact that most privatizing governments sell government-owned firms over time or not at all, we investigate whether firm-specificfactors and the political objectives of the government are likely to affectthe pattern of privatization. Using data on Indian government-owned firms,which includes both privatized firms and firms that remain fully government-owned, we use digital geographic mapping techniques to match firms basedon their location to electoral constituencies at varying distances around themain operations of the firms. We find that the decision to privatize is af-fected by firm-level financial characteristics and location-specific electoralconsiderations.
While the benefits of privatization, such as efficiency improvements, are dis-persed across the population, the costs are likely to be geographically concen-trated among a small group, such as the local employees of government firms.The public too may perceive privatization negatively as an unequal transfer ofpublic assets to private owners. This could result in a decrease in voter supportfor the governing party in the region where the firm is located. The effect of abacklash on electoral outcomes will be greater if the governing party faces aclose race with other political parties in that region.
The results suggest that larger firms and firms with a smaller wage bill aremore likely to be privatized early. We also find that political factors play amajor role in the decision to privatize. In particular, privatization is signifi-cantly delayed if the main operations of a firm are located in electoral districtswhere the opposition party alliance is stronger, and where the governing andopposition party alliances face a close race. The evidence also suggests thatthe private benefits that politicians obtain from controlling government-ownedfirms can influence the decision to privatize. In particular, we show that nogovernment-owned firm located in the home state of the politician in charge isever privatized.
Last, our work has implications for the literature on privatization that stud-ies the effect of privatization by assuming (often implicitly) that firms areselected randomly for privatization. This paper shows that selection for pri-vatization is not random. Using political competition as an instrument forthe privatization decision, we find that the sale of government-owned firmsleads to significant improvements in the profitability and efficiency of thesefirms.
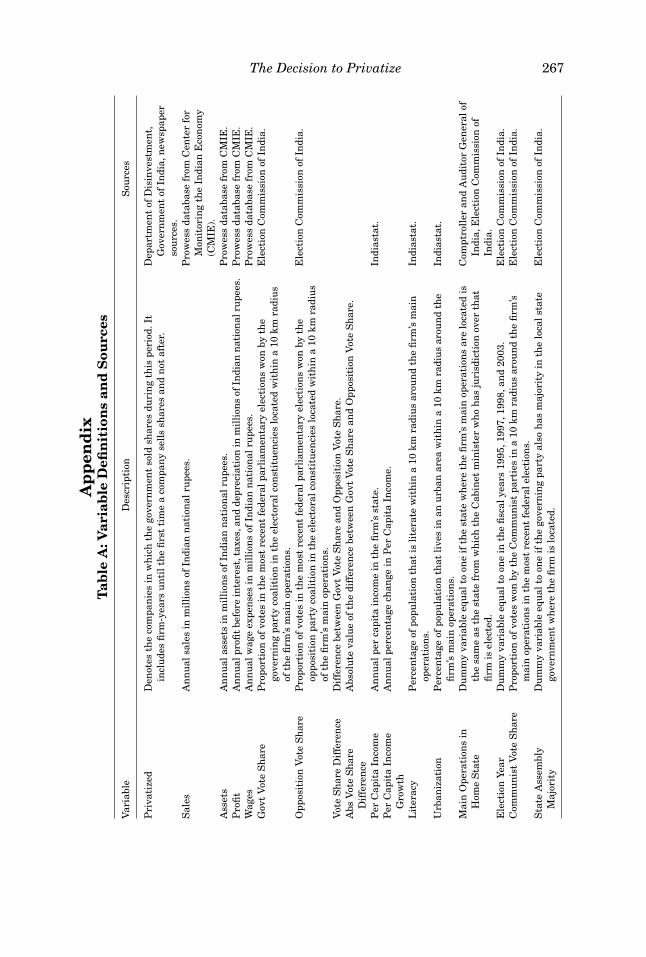
The Decision to Privatize 267A
pp
end
ixT
able
A:V
aria
ble
Defi
nit
ion
san
dS
ourc
es
Var
iabl
eD
escr
ipti
onS
ourc
es
Pri
vati
zed
Den
otes
the
com
pan
ies
inw
hic
hth
ego
vern
men
tso
ldsh
ares
duri
ng
this
peri
od.I
tin
clu
des
firm
-yea
rsu
nti
lth
efi
rst
tim
ea
com
pan
yse
lls
shar
esan
dn
otaf
ter.
Dep
artm
ent
ofD
isin
vest
men
t,G
over
nm
ent
ofIn
dia,
new
spap
erso
urc
es.
Sal
esA
nn
ual
sale
sin
mil
lion
sof
Indi
ann
atio
nal
rupe
es.
Pro
wes
sda
taba
sefr
omC
ente
rfo
rM
onit
orin
gth
eIn
dian
Eco
nom
y(C
MIE
).A
sset
sA
nn
ual
asse
tsin
mil
lion
sof
Indi
ann
atio
nal
rupe
es.
Pro
wes
sda
taba
sefr
omC
MIE
.P
rofi
tA
nn
ual
profi
tbe
fore
inte
rest
,tax
es,a
nd
depr
ecia
tion
inm
illi
ons
ofIn
dian
nat
ion
alru
pees
.P
row
ess
data
base
from
CM
IE.
Wag
esA
nn
ual
wag
eex
pen
ses
inm
illi
ons
ofIn
dian
nat
ion
alru
pees
.P
row
ess
data
base
from
CM
IE.
Gov
tV
ote
Sh
are
Pro
port
ion
ofvo
tes
inth
em
ost
rece
nt
fede
ralp
arli
amen
tary
elec
tion
sw
onby
the
gove
rnin
gpa
rty
coal
itio
nin
the
elec
tora
lcon
stit
uen
cies
loca
ted
wit
hin
a10
kmra
diu
sof
the
firm
’sm
ain
oper
atio
ns.
Ele
ctio
nC
omm
issi
onof
Indi
a.
Opp
osit
ion
Vot
eS
har
eP
ropo
rtio
nof
vote
sin
the
mos
tre
cen
tfe
dera
lpar
liam
enta
ryel
ecti
ons
won
byth
eop
posi
tion
part
yco
alit
ion
inth
eel
ecto
ralc
onst
itu
enci
eslo
cate
dw
ith
ina
10km
radi
us
ofth
efi
rm’s
mai
nop
erat
ion
s.
Ele
ctio
nC
omm
issi
onof
Indi
a.
Vot
eS
har
eD
iffe
ren
ceD
iffe
ren
cebe
twee
nG
ovt
Vot
eS
har
ean
dO
ppos
itio
nV
ote
Sh
are.
Abs
Vot
eS
har
eD
iffe
ren
ceA
bsol
ute
valu
eof
the
diff
eren
cebe
twee
nG
ovt
Vot
eS
har
ean
dO
ppos
itio
nV
ote
Sh
are.
Per
Cap
ita
Inco
me
An
nu
alpe
rca
pita
inco
me
inth
efi
rm’s
stat
e.In
dias
tat.
Per
Cap
ita
Inco
me
Gro
wth
An
nu
alpe
rcen
tage
chan
gein
Per
Cap
ita
Inco
me.
Lit
erac
yP
erce
nta
geof
popu
lati
onth
atis
lite
rate
wit
hin
a10
kmra
diu
sar
oun
dth
efi
rm’s
mai
nop
erat
ion
s.In
dias
tat.
Urb
aniz
atio
nP
erce
nta
geof
popu
lati
onth
atli
ves
inan
urb
anar
eaw
ith
ina
10km
radi
us
arou
nd
the
firm
’sm
ain
oper
atio
ns.
Indi
asta
t.
Mai
nO
pera
tion
sin
Hom
eS
tate
Du
mm
yva
riab
leeq
ual
toon
eif
the
stat
ew
her
eth
efi
rm’s
mai
nop
erat
ion
sar
elo
cate
dis
the
sam
eas
the
stat
efr
omw
hic
hth
eC
abin
etm
inis
ter
wh
oh
asju
risd
icti
onov
erth
atfi
rmis
elec
ted.
Com
ptro
ller
and
Au
dito
rG
ener
alof
Indi
a,E
lect
ion
Com
mis
sion
ofIn
dia.
Ele
ctio
nYe
arD
um
my
vari
able
equ
alto
one
inth
efi
scal
year
s19
95,1
997,
1998
,an
d20
03.
Ele
ctio
nC
omm
issi
onof
Indi
a.C
omm
un
ist
Vot
eS
har
eP
ropo
rtio
nof
vote
sw
onby
the
Com
mu
nis
tpa
rtie
sin
a10
kmra
diu
sar
oun
dth
efi
rm’s
mai
nop
erat
ion
sin
the
mos
tre
cen
tfe
dera
lele
ctio
ns.
Ele
ctio
nC
omm
issi
onof
Indi
a.
Sta
teA
ssem
bly
Maj
orit
yD
um
my
vari
able
equ
alto
one
ifth
ego
vern
ing
part
yal
soh
asm
ajor
ity
inth
elo
cals
tate
gove
rnm
ent
wh
ere
the
firm
islo
cate
d.E
lect
ion
Com
mis
sion
ofIn
dia.
268 The Journal of Finance R©
REFERENCESAhmed, Sadiq, and Ashutosh Varshney, 2008, Battles half won: The political economy of India’s
growth and economic policy since independence, World Bank Working paper No. 15.Ansolabehere, Stephen, and James Snyder Jr., 2007, Party control of state government and
the distribution of public expenditures, Scandinavian Journal of Economics 108, 547–569.
Bertrand, Marianne, Francis Kramarz, Antoinette Schoar, and David Thesmar, 2007, Politicians,firms and the political business cycle: Evidence from France, Working paper, University ofChicago.
Biais, Bruno, and Enrico Perotti, 2002, Machiavellian privatization, American Economic Review92, 240–258.
Bortolotti, Bernardo, and Paolo Pinotti, 2008, Delayed privatization, Bank of Italy Working paperNo. 663.
Boubakri, Narjess, Jean-Claude Cosset, and Omrane Guedhami, 2005, Post-privatization corporategovernance: The role of ownership structure and investor protection, Journal of FinancialEconomics 76, 369–399.
Boycko, Maxim, Andrei Shleifer, and Robert Vishny, 1996, A theory of privatization, EconomicJournal 106, 309–319.
Brown, Craig, and Serdar Dinc, 2005, The politics of bank failures: Evidence from emerging mar-kets, Quarterly Journal of Economics 120, 1413–1444.
Chakraborty, Archishman, Nandini Gupta, and Rick Harbaugh, 2006, Best foot forward or bestfor last in a sequential auction, RAND Journal of Economics 37, 176–194.
Chemmanur, Thomas, and Paolo Fulghieri, 1999, A theory of the going public decision, Review ofFinancial Studies 12, 249–279.
Claessens, Stijn, Simeon Djankov, and Gerhard Pohl, 1997, Determinants of performance of man-ufacturing firms in seven European transition economies, WDI Working paper No. 74.
Clarke, George, and Robert Cull, 2002, Political and economic determinants of the likelihood ofprivatizing Argentine public banks, Journal of Law and Economics 45, 165–197.
Cox, Gary, and Matthew McCubbins, 1986, Electoral politics as a redistributive game, Journal ofPolitics 48, 370–389.
Dahlberg, Matz, and Eva Johansson, 2002, On the vote purchasing behavior of incumbent govern-ments, American Political Science Review 96, 27–40.
Dastidar, Sidhartha, Raymond Fisman, and Tarun Khanna, 2007, Limits to policy reversal: Evi-dence from Indian privatizations, NBER Working paper No. 13427, Columbia University.
Department of Disinvestment, Government of India, 2007, Evolution of Disinvestment Policy inIndia (Government of India, New Delhi, India), http://www.divest.nic.in/evolutionp.htm.
Dewenter, Kathryn, and Paul Malatesta, 1997, Public offerings of state-owned and privately-ownedenterprises: An international comparison, Journal of Finance 52, 1659–1679.
Dinc, Serdar, 2005, Politicians and banks: Political influences on government-owned banks inemerging markets, Journal of Financial Economics 77, 453–479.
Dixit, Avinash, and John Londregan, 1996, The determinants of success of special interests inredistributive politics, Journal of Politics 58, 1132–1155.
Election Commission of India, Government of India, 2007, Delimitation of Constituencies, http://eci.nic.in/eci main/Eci Publications/books/deli/DPACO-76.pdf.
Frydman, Roman, Cheryl Gray, Marek Hessel, and Andrzej Rapaczynski, 1999, When does pri-vatization work? The impact of private ownership on corporate performance in transitioneconomies, Quarterly Journal of Economics 114, 1153–1191.
Gupta, Nandini, 2005, Partial privatization and firm performance, Journal of Finance 60,987–1015.
Gupta, Nandini, John Ham, and Jan Svejnar, 2008, Priorities and sequencing in privatization:Evidence from Czech firm panel data, European Economic Review 52, 183–208.
Jones, Steven, William Megginson, Robert Nash, and Jeffry Netter, 1999, Share issue privatiza-tions as financial means to political and economic ends, Journal of Financial Economics 53,217–253.
The Decision to Privatize 269
Kroszner, Randall, and Philip Strahan, 1999, What drives deregulation? Economics and politicsof the relaxation of bank branching restrictions in the United States, Quarterly Journal ofEconomics 114, 1437–1467.
La Porta, Rafael, and Florencio Lopez-de-Silanes, 1999, The benefits of privatization: Evidencefrom Mexico, Quarterly Journal of Economics 114, 1193–1242.
La Porta, Rafael, Florencio Lopez-de-Silanes, and Andrei Shleifer, 2002, Government ownershipof banks, Journal of Finance 57, 265–301.
Leland, Hayne, and David Pyle, 1977, Informational asymmetries, financial structure, and finan-cial intermediation, Journal of Finance 32, 371–387.
Lindbeck, Assar, and Jorgen Weibull, 1987, Balanced-budget redistribution as the outcome ofpolitical competition, Public Choice 52, 273–297.
Megginson, William, 2005, The Financial Economics of Privatization (Oxford University Press,New York).
Megginson, William, Robert Nash, Jeffry Netter, and Annette Poulsen, 2004, The choice of pub-lic versus private capital markets: Evidence from privatizations, Journal of Finance 59,2835–2870.
Megginson, William, and Jeffry Netter, 2001, From state to market: A survey of empirical studieson privatization, Journal of Economic Literature 39, 321–389.
Ministry of Finance, Government of India, 1996, Economic Survey of India (Government of India,New Delhi, India).
Ministry of Finance, Government of India, 2004, Economic Survey of India (Government of India,New Delhi, India).
Pagano, Marco, Fabio Panetta, and Luigi Zingales, 1998, Why do companies go public? An empiricalanalysis, Journal of Finance 53, 27–64.
Panagariya, Arvind, 2008, India: An Emerging Giant (Oxford University Press, New York).Perotti, Enrico, 1995, Credible privatization, American Economic Review 85, 847–859.Persson, Torsen, and Guido Tabellini, 2002, Political Economics: Explaining Economic Policy (MIT
Press, Cambridge).Ritter, Jay, and Ivo Welch, 2002, A review of IPO activity, pricing, and allocations, Journal of
Finance 57, 1795–1828.Sapienza, Paola, 2004, The effects of government ownership on bank lending, Journal of Financial
Economics 72, 357–384.Securities and Exchange Board of India, Government of India, 2000, Disclosure and Investor
Protection Guidelines (Government of India, New Delhi, India).Shleifer, Andrei, and Robert Vishny, 1994, Politicians and firms, Quarterly Journal of Economics
109, 995–1025.Song, Ligang, and Yang Yao, 2004, The impact of privatization on firm performance in China,
CCER Working paper No. E2004005.Sun, Qian, and Wilson Tong, 2003, China share issue privatization: The extent of its success,
Journal of Financial Economics 70, 183–222.Wooldridge, Jeffrey, 2001, Econometric Analysis of Cross Section and Panel Data (MIT Press,
Cambridge).Wooldridge, Jeffrey, 2007, What’s new in econometrics? NBER Lecture.

270 The Journal of Finance R©