Embed Size (px)
Citation preview
Sustainable Construction –the Data
prepared byNigel HowardCentre for Sustainable Construction
March 2000 CR258/99
© Copyright BRE 2000
Constructing the Future
BRE
Bucknalls Lane Garston Watford
WD2 7JR
Tel: 01923 664000 Fax: 01923 664010
Email: [email protected]
© BRE copyright 2000
Centre for Sustainable Construction
Sustainable Construction – the Data
Prepared by: Nigel Howard
Centre for Sustainable Construction
March 2000 CR 258/99
SUSTAINABLE CONSTRUCTION DATA BRE Client Report number CR 258/99
CONTENTS
Sustainable Construction – the Data 11 Introduction 12 Background 13 Objective 24 Approach 25 Results 2
5.1 Economic Perspectives 35.2 Construction Materials 105.3 Construction Activity 165.4 Building Operation 185.5 Transport Infrastructure 215.6 Recycling and Disposal 235.7 Social Perspectives 27
6 Conclusions 407 References 41
SUSTAINABLE CONSTRUCTION DATA BRE Client Report number CR 258/99
EXECUTIVE SUMMARY
This work was undertaken by BRE between January and March 1999 on behalf of theDETR as a component of a project entitled “Sustainable Construction - Developing anIndustry Agenda”. The objectives of this study were to:• marshal key available data on the social, economic, environmental and resource
implications of construction• determine the important factors and interrelationships between sustainability
issues and construction
The research identifies the characteristics of the construction industry in terms of theeconomy, society, construction activity and materials, building operation, andtransport and waste implications. The combined performance of these issuesrepresents the sustainability of construction and the built environment.
This work provides a timely source of background information from which manygroups can draw in devising their strategies and action plans for improving thesustainability of UK construction and for responding to the Governments ownstrategy.
This project was funded by the Department of the Environment, Transport and theRegions. The views expressed here are not necessarily those of the Secretary ofState for the Environment, Transport and the regions.
SUSTAINABLE CONSTRUCTION DATA BRE Client Report number CR 258/99
1
Sustainable Construction – the Data
1 Introduction
This work was undertaken between January and March 1999 on behalf of the DETR asa component of a project entitled “Sustainable Construction - Developing an IndustryAgenda” – SC 4234 (cc 1667). The project was undertaken under the auspices of theCentre for Sustainable Construction and draws on expertise from across BRE andfrom BRE associate contractors on the following aspects:
♦ Energy and Water♦ Waste & Recycling♦ Land Use♦ Social♦ Economic
♦ Materials
2 Background
The DETR are responsible for implementing government policy on sustainableconstruction. In current government policy, sustainability is described as:
♦ Social progress that meets the needs of everyone.♦ Economic growth♦ Effective protection of the environment♦ Efficient use of resources
DETR have consulted widely with the construction industry to ascertain the industry’sviews on sustainable construction and how best to promote it effectively. The DETR‘Strategy for More Sustainable Construction’ leads policy development in this field.
Sustainable construction is an inherently complex subject, with a very large range ofvariables that interact, and are often contradictory. Objective studies have oftenshown that many of the interactions are counter-intuitive and there are manymisconceptions about sustainable construction issues perceived by the industry.
For example, it is commonly held as self-evident that waste recycling will substantiallyreduce the quantities of materials extracted. Objective studies show that thequantities of waste arising from demolition are too small compared to the currentdemand for materials for recycling to dramatically reduce the quantities of materialextracted. Recycling is nonetheless very important as a strategy for preservinglandfill capacity.
Hence, there is a need for objectively compiled data on sustainable construction inorder to counteract misconceptions and inform new thinking on sustainableconstruction.
SUSTAINABLE CONSTRUCTION DATA BRE Client Report number CR 258/99
2
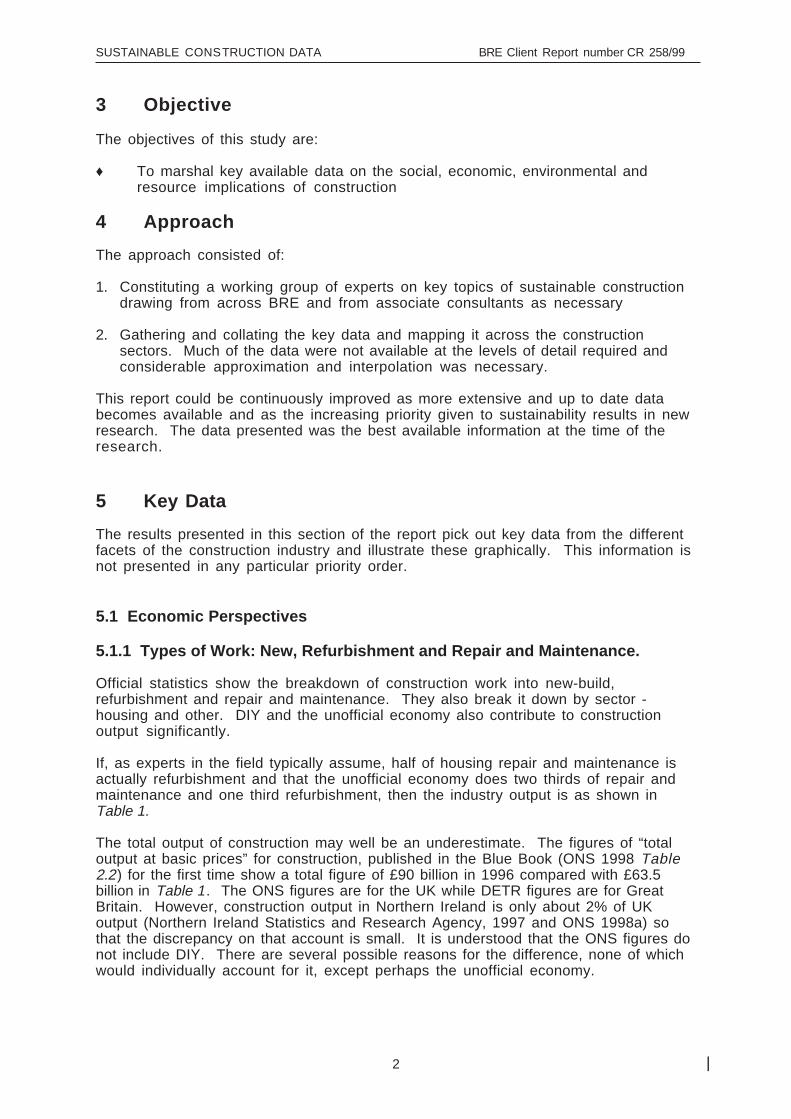
3 Objective
The objectives of this study are:
♦ To marshal key available data on the social, economic, environmental andresource implications of construction
4 Approach
The approach consisted of:
1. Constituting a working group of experts on key topics of sustainable constructiondrawing from across BRE and from associate consultants as necessary
2. Gathering and collating the key data and mapping it across the constructionsectors. Much of the data were not available at the levels of detail required andconsiderable approximation and interpolation was necessary.
This report could be continuously improved as more extensive and up to date databecomes available and as the increasing priority given to sustainability results in newresearch. The data presented was the best available information at the time of theresearch.
5 Key Data
The results presented in this section of the report pick out key data from the differentfacets of the construction industry and illustrate these graphically. This information isnot presented in any particular priority order.
5.1 Economic Perspectives
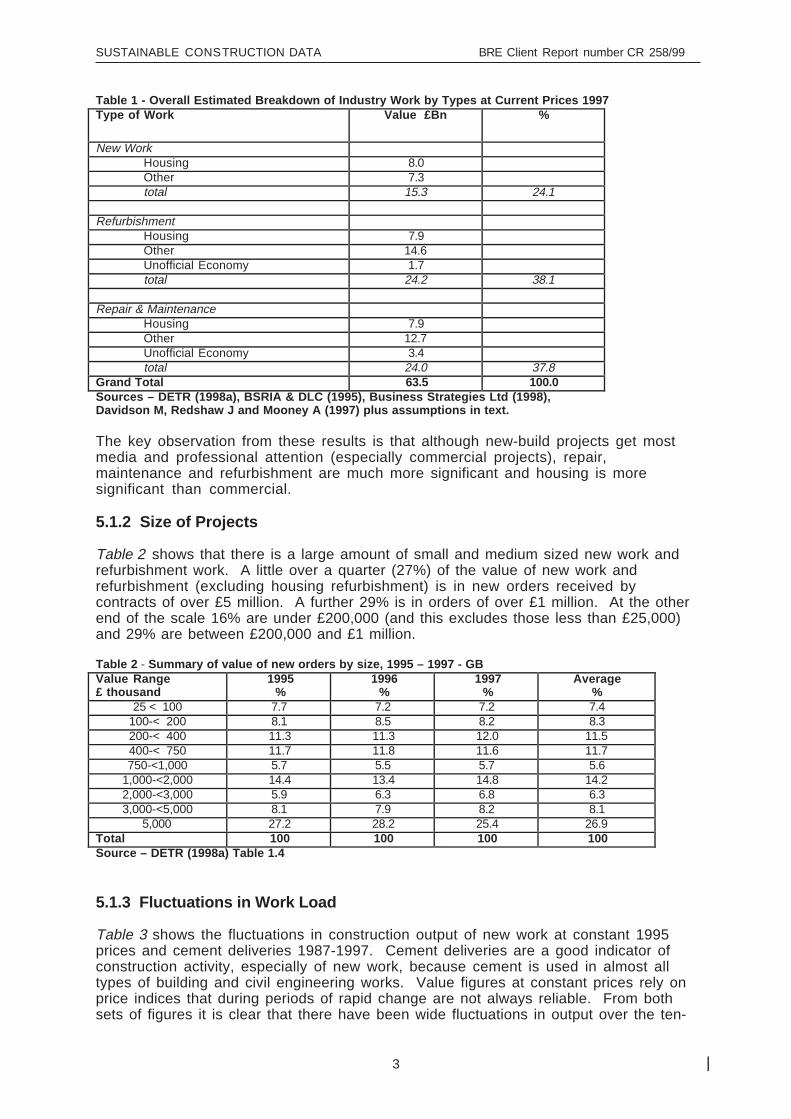
5.1.1 Types of Work: New, Refurbishment and Repair and Maintenance.
Official statistics show the breakdown of construction work into new-build,refurbishment and repair and maintenance. They also break it down by sector -housing and other. DIY and the unofficial economy also contribute to constructionoutput significantly.
If, as experts in the field typically assume, half of housing repair and maintenance isactually refurbishment and that the unofficial economy does two thirds of repair andmaintenance and one third refurbishment, then the industry output is as shown inTable 1.
The total output of construction may well be an underestimate. The figures of “totaloutput at basic prices” for construction, published in the Blue Book (ONS 1998 Table2.2) for the first time show a total figure of £90 billion in 1996 compared with £63.5billion in Table 1. The ONS figures are for the UK while DETR figures are for GreatBritain. However, construction output in Northern Ireland is only about 2% of UKoutput (Northern Ireland Statistics and Research Agency, 1997 and ONS 1998a) sothat the discrepancy on that account is small. It is understood that the ONS figures donot include DIY. There are several possible reasons for the difference, none of whichwould individually account for it, except perhaps the unofficial economy.
SUSTAINABLE CONSTRUCTION DATA BRE Client Report number CR 258/99
3
Table 1 - Overall Estimated Breakdown of Industry Work by Types at Current Prices 1997 Type of Work Value £Bn %
New WorkHousing 8.0Other 7.3total 15.3 24.1
RefurbishmentHousing 7.9Other 14.6Unofficial Economy 1.7total 24.2 38.1
Repair & MaintenanceHousing 7.9Other 12.7Unofficial Economy 3.4total 24.0 37.8
Grand Total 63.5 100.0Sources – DETR (1998a), BSRIA & DLC (1995), Business Strategies Ltd (1998),Davidson M, Redshaw J and Mooney A (1997) plus assumptions in text.
The key observation from these results is that although new-build projects get mostmedia and professional attention (especially commercial projects), repair,maintenance and refurbishment are much more significant and housing is moresignificant than commercial.
5.1.2 Size of Projects
Table 2 shows that there is a large amount of small and medium sized new work andrefurbishment work. A little over a quarter (27%) of the value of new work andrefurbishment (excluding housing refurbishment) is in new orders received bycontracts of over £5 million. A further 29% is in orders of over £1 million. At the otherend of the scale 16% are under £200,000 (and this excludes those less than £25,000)and 29% are between £200,000 and £1 million.
Table 2 - Summary of value of new orders by size, 1995 – 1997 - GBValue Range£ thousand
1995%
1996%
1997%
Average%
25 < 100 7.7 7.2 7.2 7.4100-< 200 8.1 8.5 8.2 8.3200-< 400 11.3 11.3 12.0 11.5400-< 750 11.7 11.8 11.6 11.7750-<1,000 5.7 5.5 5.7 5.6
1,000-<2,000 14.4 13.4 14.8 14.22,000-<3,000 5.9 6.3 6.8 6.33,000-<5,000 8.1 7.9 8.2 8.1
5,000 27.2 28.2 25.4 26.9Total 100 100 100 100Source – DETR (1998a) Table 1.4
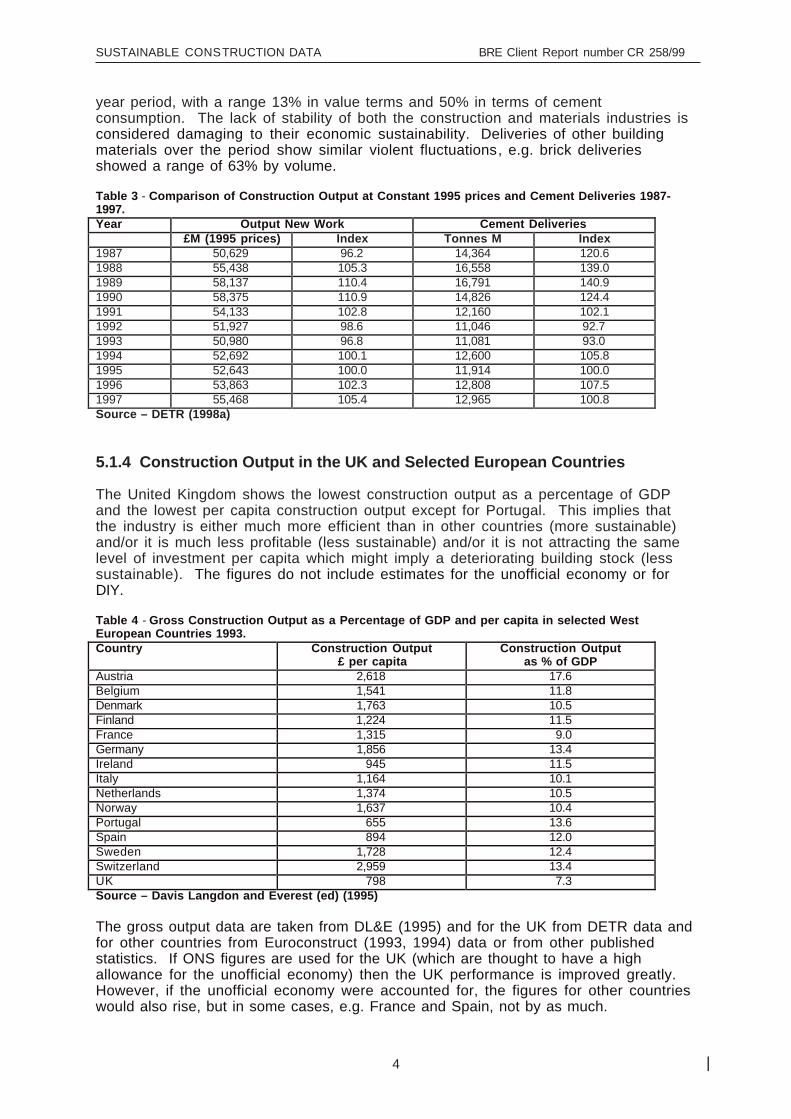
5.1.3 Fluctuations in Work Load
Table 3 shows the fluctuations in construction output of new work at constant 1995prices and cement deliveries 1987-1997. Cement deliveries are a good indicator ofconstruction activity, especially of new work, because cement is used in almost alltypes of building and civil engineering works. Value figures at constant prices rely onprice indices that during periods of rapid change are not always reliable. From bothsets of figures it is clear that there have been wide fluctuations in output over the ten-
SUSTAINABLE CONSTRUCTION DATA BRE Client Report number CR 258/99
4
year period, with a range 13% in value terms and 50% in terms of cementconsumption. The lack of stability of both the construction and materials industries isconsidered damaging to their economic sustainability. Deliveries of other buildingmaterials over the period show similar violent fluctuations, e.g. brick deliveriesshowed a range of 63% by volume.
Table 3 - Comparison of Construction Output at Constant 1995 prices and Cement Deliveries 1987-1997.Year Output New Work Cement Deliveries
£M (1995 prices) Index Tonnes M Index1987 50,629 96.2 14,364 120.61988 55,438 105.3 16,558 139.01989 58,137 110.4 16,791 140.91990 58,375 110.9 14,826 124.41991 54,133 102.8 12,160 102.11992 51,927 98.6 11,046 92.71993 50,980 96.8 11,081 93.01994 52,692 100.1 12,600 105.81995 52,643 100.0 11,914 100.01996 53,863 102.3 12,808 107.51997 55,468 105.4 12,965 100.8Source – DETR (1998a)
5.1.4 Construction Output in the UK and Selected European Countries
The United Kingdom shows the lowest construction output as a percentage of GDPand the lowest per capita construction output except for Portugal. This implies thatthe industry is either much more efficient than in other countries (more sustainable)and/or it is much less profitable (less sustainable) and/or it is not attracting the samelevel of investment per capita which might imply a deteriorating building stock (lesssustainable). The figures do not include estimates for the unofficial economy or forDIY.
Table 4 - Gross Construction Output as a Percentage of GDP and per capita in selected WestEuropean Countries 1993.Country Construction Output
£ per capitaConstruction Output
as % of GDPAustria 2,618 17.6Belgium 1,541 11.8Denmark 1,763 10.5Finland 1,224 11.5France 1,315 9.0Germany 1,856 13.4Ireland 945 11.5Italy 1,164 10.1Netherlands 1,374 10.5Norway 1,637 10.4Portugal 655 13.6Spain 894 12.0Sweden 1,728 12.4Switzerland 2,959 13.4UK 798 7.3Source – Davis Langdon and Everest (ed) (1995)
The gross output data are taken from DL&E (1995) and for the UK from DETR data andfor other countries from Euroconstruct (1993, 1994) data or from other publishedstatistics. If ONS figures are used for the UK (which are thought to have a highallowance for the unofficial economy) then the UK performance is improved greatly.However, if the unofficial economy were accounted for, the figures for other countrieswould also rise, but in some cases, e.g. France and Spain, not by as much.
SUSTAINABLE CONSTRUCTION DATA BRE Client Report number CR 258/99
5
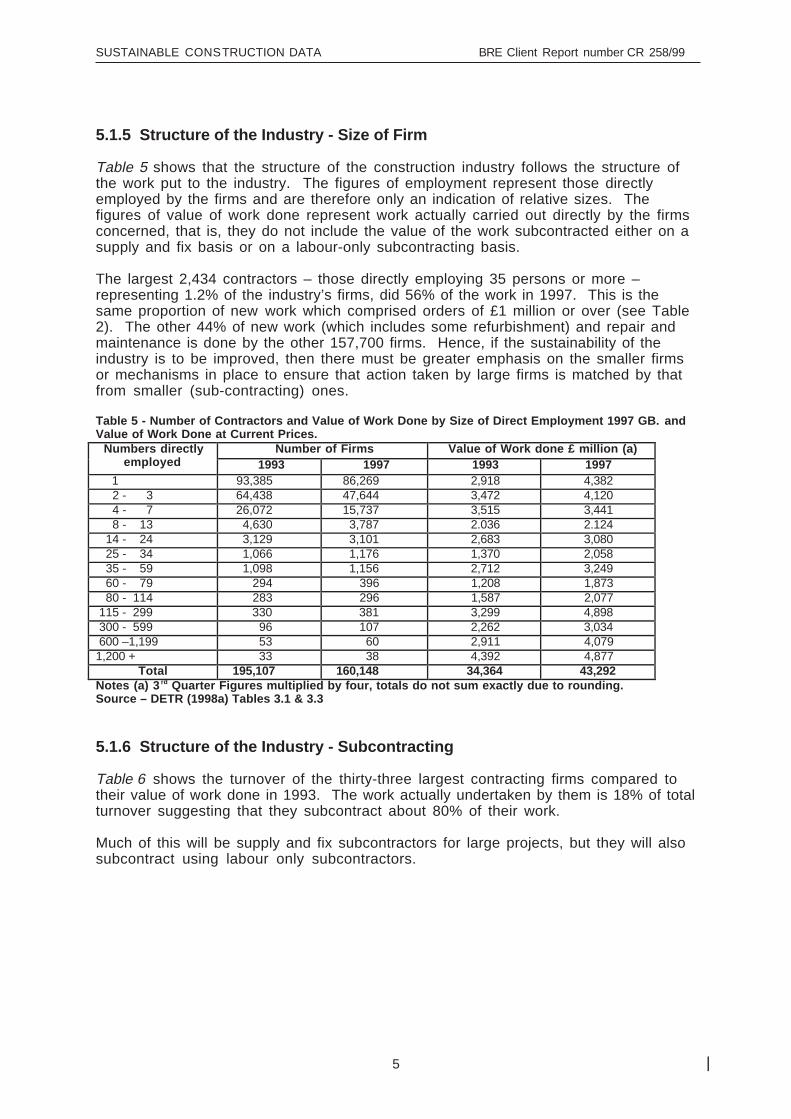
5.1.5 Structure of the Industry - Size of Firm
Table 5 shows that the structure of the construction industry follows the structure ofthe work put to the industry. The figures of employment represent those directlyemployed by the firms and are therefore only an indication of relative sizes. Thefigures of value of work done represent work actually carried out directly by the firmsconcerned, that is, they do not include the value of the work subcontracted either on asupply and fix basis or on a labour-only subcontracting basis.
The largest 2,434 contractors – those directly employing 35 persons or more –representing 1.2% of the industry’s firms, did 56% of the work in 1997. This is thesame proportion of new work which comprised orders of £1 million or over (see Table2). The other 44% of new work (which includes some refurbishment) and repair andmaintenance is done by the other 157,700 firms. Hence, if the sustainability of theindustry is to be improved, then there must be greater emphasis on the smaller firmsor mechanisms in place to ensure that action taken by large firms is matched by thatfrom smaller (sub-contracting) ones.
Table 5 - Number of Contractors and Value of Work Done by Size of Direct Employment 1997 GB. andValue of Work Done at Current Prices.
Number of Firms Value of Work done £ million (a)Numbers directlyemployed 1993 1997 1993 1997
1 93,385 86,269 2,918 4,382 2 - 3 64,438 47,644 3,472 4,120 4 - 7 26,072 15,737 3,515 3,441 8 - 13 4,630 3,787 2.036 2.124 14 - 24 3,129 3,101 2,683 3,080 25 - 34 1,066 1,176 1,370 2,058 35 - 59 1,098 1,156 2,712 3,249 60 - 79 294 396 1,208 1,873 80 - 114 283 296 1,587 2,077 115 - 299 330 381 3,299 4,898 300 - 599 96 107 2,262 3,034 600 –1,199 53 60 2,911 4,0791,200 + 33 38 4,392 4,877
Total 195,107 160,148 34,364 43,292Notes (a) 3 rd Quarter Figures multiplied by four, totals do not sum exactly due to rounding.Source – DETR (1998a) Tables 3.1 & 3.3
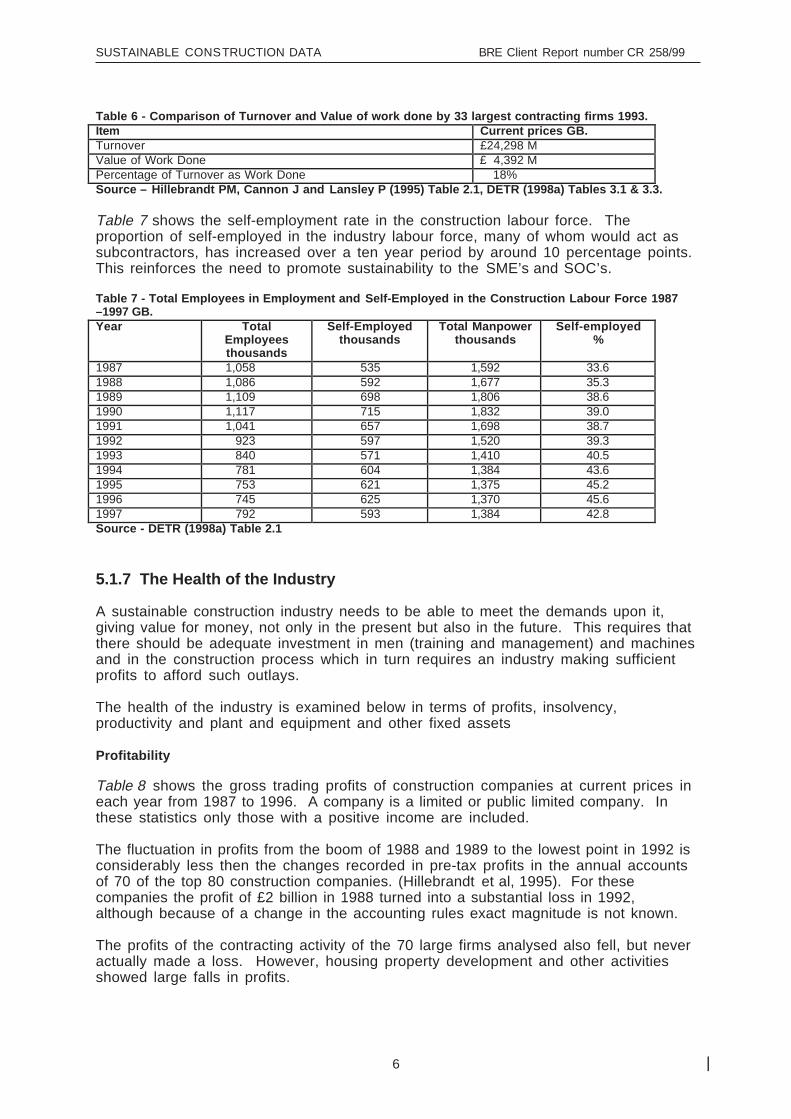
5.1.6 Structure of the Industry - Subcontracting
Table 6 shows the turnover of the thirty-three largest contracting firms compared totheir value of work done in 1993. The work actually undertaken by them is 18% of totalturnover suggesting that they subcontract about 80% of their work.
Much of this will be supply and fix subcontractors for large projects, but they will alsosubcontract using labour only subcontractors.
SUSTAINABLE CONSTRUCTION DATA BRE Client Report number CR 258/99
6
Table 6 - Comparison of Turnover and Value of work done by 33 largest contracting firms 1993.Item Current prices GB.Turnover £24,298 MValue of Work Done £ 4,392 MPercentage of Turnover as Work Done 18%Source – Hillebrandt PM, Cannon J and Lansley P (1995) Table 2.1, DETR (1998a) Tables 3.1 & 3.3.
Table 7 shows the self-employment rate in the construction labour force. Theproportion of self-employed in the industry labour force, many of whom would act assubcontractors, has increased over a ten year period by around 10 percentage points.This reinforces the need to promote sustainability to the SME’s and SOC’s.
Table 7 - Total Employees in Employment and Self-Employed in the Construction Labour Force 1987–1997 GB.Year Total
Employeesthousands
Self-Employedthousands
Total Manpowerthousands
Self-employed%
1987 1,058 535 1,592 33.61988 1,086 592 1,677 35.31989 1,109 698 1,806 38.61990 1,117 715 1,832 39.01991 1,041 657 1,698 38.71992 923 597 1,520 39.31993 840 571 1,410 40.51994 781 604 1,384 43.61995 753 621 1,375 45.21996 745 625 1,370 45.61997 792 593 1,384 42.8Source - DETR (1998a) Table 2.1
5.1.7 The Health of the Industry
A sustainable construction industry needs to be able to meet the demands upon it,giving value for money, not only in the present but also in the future. This requires thatthere should be adequate investment in men (training and management) and machinesand in the construction process which in turn requires an industry making sufficientprofits to afford such outlays.
The health of the industry is examined below in terms of profits, insolvency,productivity and plant and equipment and other fixed assets
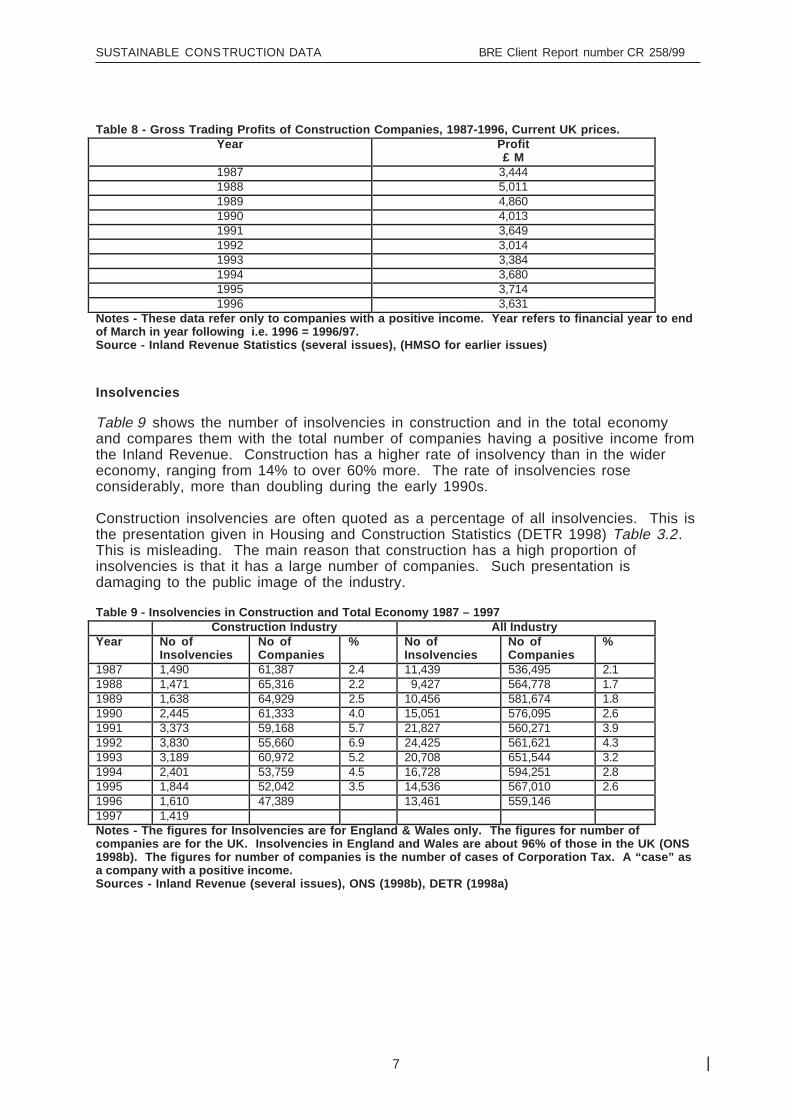
Profitability
Table 8 shows the gross trading profits of construction companies at current prices ineach year from 1987 to 1996. A company is a limited or public limited company. Inthese statistics only those with a positive income are included.
The fluctuation in profits from the boom of 1988 and 1989 to the lowest point in 1992 isconsiderably less then the changes recorded in pre-tax profits in the annual accountsof 70 of the top 80 construction companies. (Hillebrandt et al, 1995). For thesecompanies the profit of £2 billion in 1988 turned into a substantial loss in 1992,although because of a change in the accounting rules exact magnitude is not known.
The profits of the contracting activity of the 70 large firms analysed also fell, but neveractually made a loss. However, housing property development and other activitiesshowed large falls in profits.
SUSTAINABLE CONSTRUCTION DATA BRE Client Report number CR 258/99
7
Table 8 - Gross Trading Profits of Construction Companies, 1987-1996, Current UK prices.Year Profit
£ M1987 3,4441988 5,0111989 4,8601990 4,0131991 3,6491992 3,0141993 3,3841994 3,6801995 3,7141996 3,631
Notes - These data refer only to companies with a positive income. Year refers to financial year to endof March in year following i.e. 1996 = 1996/97.Source - Inland Revenue Statistics (several issues), (HMSO for earlier issues)
Insolvencies
Table 9 shows the number of insolvencies in construction and in the total economyand compares them with the total number of companies having a positive income fromthe Inland Revenue. Construction has a higher rate of insolvency than in the widereconomy, ranging from 14% to over 60% more. The rate of insolvencies roseconsiderably, more than doubling during the early 1990s.
Construction insolvencies are often quoted as a percentage of all insolvencies. This isthe presentation given in Housing and Construction Statistics (DETR 1998) Table 3.2.This is misleading. The main reason that construction has a high proportion ofinsolvencies is that it has a large number of companies. Such presentation isdamaging to the public image of the industry.
Table 9 - Insolvencies in Construction and Total Economy 1987 – 1997Construction Industry All Industry
Year No ofInsolvencies
No ofCompanies
% No ofInsolvencies
No ofCompanies
%
1987 1,490 61,387 2.4 11,439 536,495 2.11988 1,471 65,316 2.2 9,427 564,778 1.71989 1,638 64,929 2.5 10,456 581,674 1.81990 2,445 61,333 4.0 15,051 576,095 2.61991 3,373 59,168 5.7 21,827 560,271 3.91992 3,830 55,660 6.9 24,425 561,621 4.31993 3,189 60,972 5.2 20,708 651,544 3.21994 2,401 53,759 4.5 16,728 594,251 2.81995 1,844 52,042 3.5 14,536 567,010 2.61996 1,610 47,389 13,461 559,1461997 1,419Notes - The figures for Insolvencies are for England & Wales only. The figures for number ofcompanies are for the UK. Insolvencies in England and Wales are about 96% of those in the UK (ONS1998b). The figures for number of companies is the number of cases of Corporation Tax. A “case” asa company with a positive income.Sources - Inland Revenue (several issues), ONS (1998b), DETR (1998a)
SUSTAINABLE CONSTRUCTION DATA BRE Client Report number CR 258/99
8
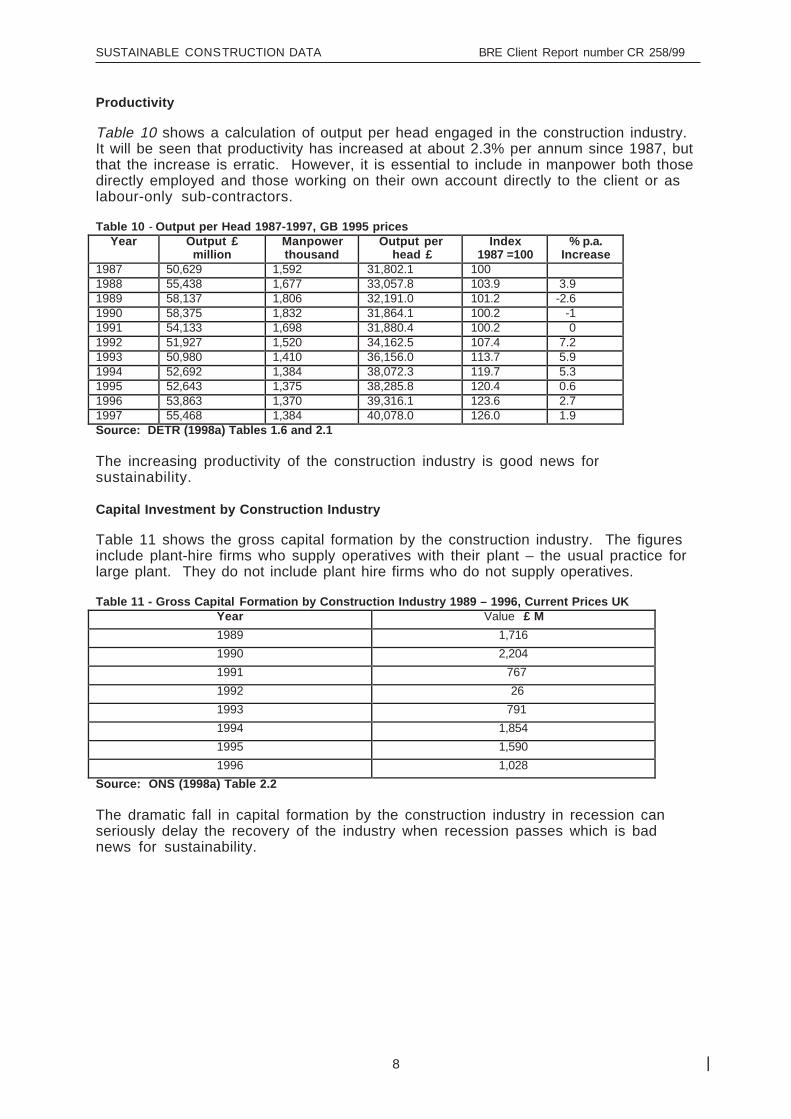
Productivity
Table 10 shows a calculation of output per head engaged in the construction industry.It will be seen that productivity has increased at about 2.3% per annum since 1987, butthat the increase is erratic. However, it is essential to include in manpower both thosedirectly employed and those working on their own account directly to the client or aslabour-only sub-contractors.
Table 10 - Output per Head 1987-1997, GB 1995 pricesYear Output £
millionManpowerthousand
Output perhead £
Index1987 =100
% p.a.Increase
1987 50,629 1,592 31,802.1 1001988 55,438 1,677 33,057.8 103.9 3.91989 58,137 1,806 32,191.0 101.2 -2.61990 58,375 1,832 31,864.1 100.2 -11991 54,133 1,698 31,880.4 100.2 01992 51,927 1,520 34,162.5 107.4 7.21993 50,980 1,410 36,156.0 113.7 5.91994 52,692 1,384 38,072.3 119.7 5.31995 52,643 1,375 38,285.8 120.4 0.61996 53,863 1,370 39,316.1 123.6 2.71997 55,468 1,384 40,078.0 126.0 1.9Source: DETR (1998a) Tables 1.6 and 2.1
The increasing productivity of the construction industry is good news forsustainability.
Capital Investment by Construction Industry
Table 11 shows the gross capital formation by the construction industry. The figuresinclude plant-hire firms who supply operatives with their plant – the usual practice forlarge plant. They do not include plant hire firms who do not supply operatives.
Table 11 - Gross Capital Formation by Construction Industry 1989 – 1996, Current Prices UKYear Value £ M
1989 1,716
1990 2,204
1991 767
1992 26
1993 791
1994 1,854
1995 1,590
1996 1,028
Source: ONS (1998a) Table 2.2
The dramatic fall in capital formation by the construction industry in recession canseriously delay the recovery of the industry when recession passes which is badnews for sustainability.
SUSTAINABLE CONSTRUCTION DATA BRE Client Report number CR 258/99
10
5.2 Construction Materials and Resources
These are discussed in terms of:• Resources – land, energy, transport, minerals and timber• Pollution – acid gasses, CO2, photochemical ozone creation• Wastes and recycling
5.2.1 Resources
The construction industry is the largest consumer of resources of all UK industries, bothdirectly and from its supply chain of materials producers, fabricators and stockists. About 6tonnes of materials are consumed per person per year. However, most of the resourcesconsumed are massively abundant minerals or renewable wood.
For the less abundant resources, there doesn’t appear to be any consistent data andforecasting supply and demand for scarce resources continues to be problematic. Equally,scarcity is already accounted for in the prices of commodities and is therefore subject tomarket mechanisms. Environmental economists argue that the market reacts too little andtoo late in its price signals for scarce resources.
5.2.2 Land as a Resource
Detailed statistics on the land coverage of the built environment are lacking, and estimatesmade from different sources do not correlate to accurately account for total urban land use.Using average housing density data with total housing stock statistics gives an estimate ofabout 20 - 40% of urban land use given over to housing and associated parks and gardensetc.
From the total length of road network it is possible to estimate the land use by roads alone.However, estimates vary from 40 – 60% of urban land use, depending on assumptions, suchas the average width of a road. This leaves approximately 20% of urban land use forcommunity space, railways, vacant land etc.
Overall land use is dominated by agricultural uses – 76 -77% at either UK or England levelwith forest and woodland accounting for 10-11% and urban and unspecified accounting forabout 13% (DETR 1998b).
The rural land use statistics also reveal some 35% of land devoted to National Parks inEngland, areas of outstanding natural beauty and greenbelt land, although some areas arecounted in more than one category (ONS 1997b).
Land use change from rural to urban has been reasonably constant at some 6,000 hectaresper annum over the past 10 years (for England), some 0.05% of land per annum. The finaluse following that change varies year on year, but residential use is always the largestcomponent - about 45%; transport & utilities next at about 25%; industry and commerce nextat about 13%; community services and vacant make up the remainder in roughly equalproportions at about 8% each.
Land use change is projected to accelerate slightly and by 2016 urban land use is expectedto rise to about 12% of all land (for England) (equivalent to a rate of 6,800 hectares perannum between 1991 and 2016) (DoE 1996).
Since urban land use has a large ecological footprint – i.e. needs a very large area ofcultivated and natural landscape to provide food and remediate man’s wastes and pollution,increasing proportions of urban land use reduce sustainability.
SUSTAINABLE CONSTRUCTION DATA BRE Client Report number CR 258/99
11
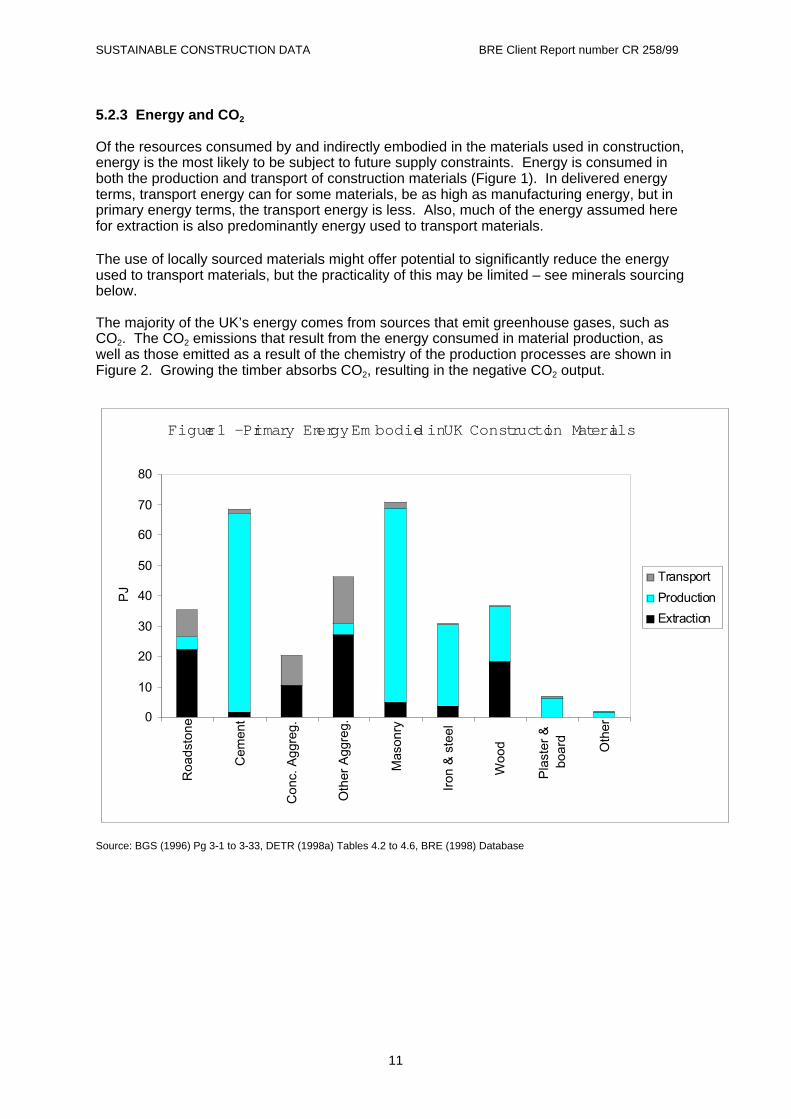
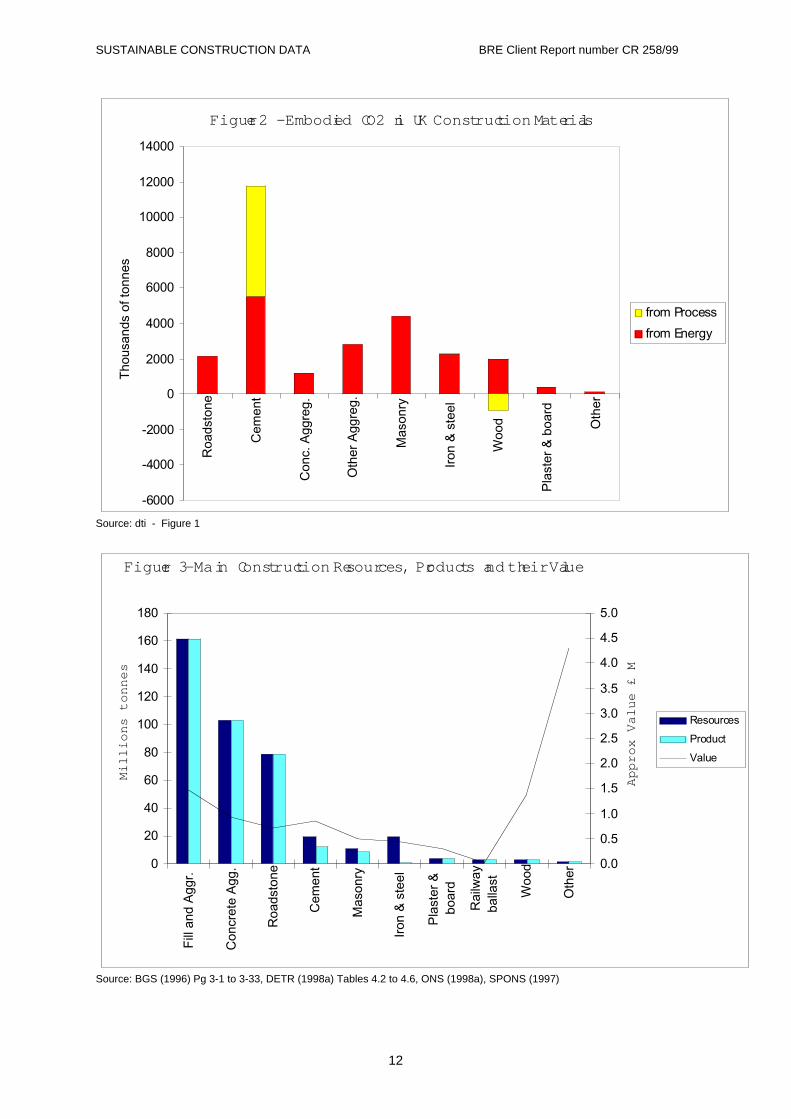
5.2.3 Energy and CO 2
Of the resources consumed by and indirectly embodied in the materials used in construction,energy is the most likely to be subject to future supply constraints. Energy is consumed inboth the production and transport of construction materials (Figure 1). In delivered energyterms, transport energy can for some materials, be as high as manufacturing energy, but inprimary energy terms, the transport energy is less. Also, much of the energy assumed herefor extraction is also predominantly energy used to transport materials.
The use of locally sourced materials might offer potential to significantly reduce the energyused to transport materials, but the practicality of this may be limited – see minerals sourcingbelow.
The majority of the UK’s energy comes from sources that emit greenhouse gases, such asCO2. The CO2 emissions that result from the energy consumed in material production, aswell as those emitted as a result of the chemistry of the production processes are shown inFigure 2. Growing the timber absorbs CO2, resulting in the negative CO2 output.
Source: BGS (1996) Pg 3-1 to 3-33, DETR (1998a) Tables 4.2 to 4.6, BRE (1998) Database
Figure 1 - Primary En ergy Em bodied in UK Const ructi on Mat erials
0
10
20
30
40
50
60
70
80
Roa
dsto
ne
Cem
ent
Con
c. A
ggre
g.
Oth
er A
ggre
g.
Mas
onry
Iron
& s
teel
Woo
d
Pla
ster
&bo
ard
Oth
er
PJ
Transport
Production
Extraction
SUSTAINABLE CONSTRUCTION DATA BRE Client Report number CR 258/99
12
Source: dti - Figure 1
Source: BGS (1996) Pg 3-1 to 3-33, DETR (1998a) Tables 4.2 to 4.6, ONS (1998a), SPONS (1997)
Figure 2 - Embodied CO2 in UK Construction Materia ls
-6000
-4000
-2000
0
2000
4000
6000
8000
10000
12000
14000
Roa
dsto
ne
Cem
ent
Con
c. A
ggre
g.
Oth
er A
ggre
g.
Mas
onry
Iron
& s
teel
Woo
d
Pla
ster
& b
oard
Oth
er
Tho
usan
ds o
f ton
nes
from Process
from Energy
Figure 3 - Main Const ruction Resour ces, Product s and their Value
0
20
40
60
80
100
120
140
160
180
Fill
and
Agg
r.
Con
cret
e A
gg.
Roa
dsto
ne
Cem
ent
Mas
onry
Iron
& s
teel
Pla
ster
&bo
ard
Rai
lway
balla
st
Woo
d
Oth
er
Mill
ion
s to
nn
es
0.0
0.5
1.0
1.5
2.0
2.5
3.0
3.5
4.0
4.5
5.0A
pp
rox
Va
lue
£ M
Resources
Product
Value
SUSTAINABLE CONSTRUCTION DATA BRE Client Report number CR 258/99
13
Source: BGS (1995) Pg 1-12 (1994 data), BGS (1996) Pg 1-8 (1994 data)Assumption - That 20 years of reserves are "proven" and planned at any time
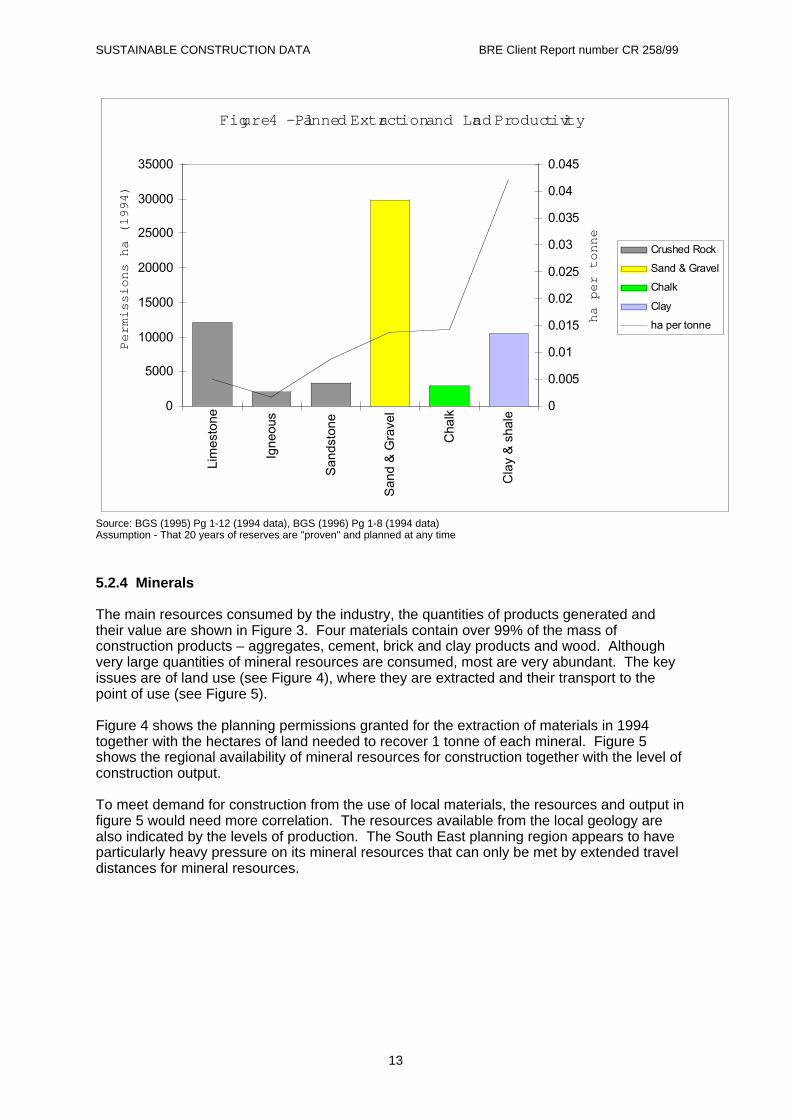
5.2.4 Minerals
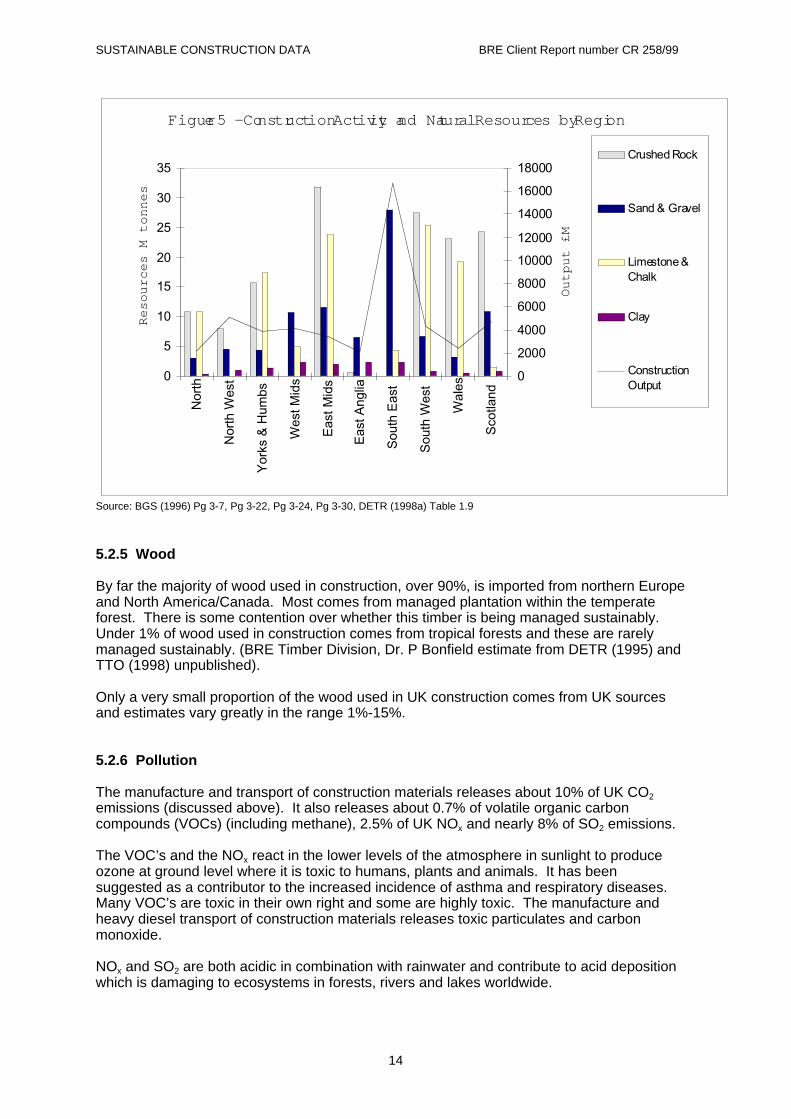
The main resources consumed by the industry, the quantities of products generated andtheir value are shown in Figure 3. Four materials contain over 99% of the mass ofconstruction products – aggregates, cement, brick and clay products and wood. Althoughvery large quantities of mineral resources are consumed, most are very abundant. The keyissues are of land use (see Figure 4), where they are extracted and their transport to thepoint of use (see Figure 5).
Figure 4 shows the planning permissions granted for the extraction of materials in 1994together with the hectares of land needed to recover 1 tonne of each mineral. Figure 5shows the regional availability of mineral resources for construction together with the level ofconstruction output.
To meet demand for construction from the use of local materials, the resources and output infigure 5 would need more correlation. The resources available from the local geology arealso indicated by the levels of production. The South East planning region appears to haveparticularly heavy pressure on its mineral resources that can only be met by extended traveldistances for mineral resources.
Figure 4 - Planned Extract ion and Land Product ivity
0
5000
10000
15000
20000
25000
30000
35000
Lim
esto
ne
Igne
ous
San
dsto
ne
San
d &
Gra
vel
Cha
lk
Cla
y &
sha
le
Pe
rmis
sio
ns
ha
(1
99
4)
0
0.005
0.01
0.015
0.02
0.025
0.03
0.035
0.04
0.045
ha
pe
r to
nn
e Crushed Rock
Sand & Gravel
Chalk
Clay
ha per tonne
SUSTAINABLE CONSTRUCTION DATA BRE Client Report number CR 258/99
14
Source: BGS (1996) Pg 3-7, Pg 3-22, Pg 3-24, Pg 3-30, DETR (1998a) Table 1.9
5.2.5 Wood
By far the majority of wood used in construction, over 90%, is imported from northern Europeand North America/Canada. Most comes from managed plantation within the temperateforest. There is some contention over whether this timber is being managed sustainably.Under 1% of wood used in construction comes from tropical forests and these are rarelymanaged sustainably. (BRE Timber Division, Dr. P Bonfield estimate from DETR (1995) andTTO (1998) unpublished).
Only a very small proportion of the wood used in UK construction comes from UK sourcesand estimates vary greatly in the range 1%-15%.
5.2.6 Pollution
The manufacture and transport of construction materials releases about 10% of UK CO2
emissions (discussed above). It also releases about 0.7% of volatile organic carboncompounds (VOCs) (including methane), 2.5% of UK NOx and nearly 8% of SO2 emissions.
The VOC’s and the NOx react in the lower levels of the atmosphere in sunlight to produceozone at ground level where it is toxic to humans, plants and animals. It has beensuggested as a contributor to the increased incidence of asthma and respiratory diseases.Many VOC’s are toxic in their own right and some are highly toxic. The manufacture andheavy diesel transport of construction materials releases toxic particulates and carbonmonoxide.
NOx and SO2 are both acidic in combination with rainwater and contribute to acid depositionwhich is damaging to ecosystems in forests, rivers and lakes worldwide.
Figure 5 - Constr uct ion Activity and Natural Resources by Region
0
5
10
15
20
25
30
35
Nor
th
Nor
th W
est
Yor
ks &
Hum
bs
Wes
t Mid
s
Eas
t Mid
s
Eas
t Ang
lia
Sou
th E
ast
Sou
th W
est
Wal
es
Sco
tland
Re
sou
rce
s M
to
nn
es
0
2000
4000
6000
8000
10000
12000
14000
16000
18000
Ou
tpu
t £
M
Crushed Rock
Sand & Gravel
Limestone &Chalk
Clay
ConstructionOutput
SUSTAINABLE CONSTRUCTION DATA BRE Client Report number CR 258/99
15
There remains uncertainty about the methane emissions associated with the flooding ofvalleys for hydroelectric schemes and for water storage. This represents a paradox forrenewable electricity and sustaining water supplies (see 5.4.2).
The energy used to manufacture and transport construction materials is usually measuredas the embodied energy of the materials used. BRE consultancy services and analysis ofthe sensitivity of a building’s embodied energy to design and specification, suggest thatabout 50% savings in embodied energy can be achieved from appropriate design andspecification. The savings in consequential pollution emissions are likely to be similar.
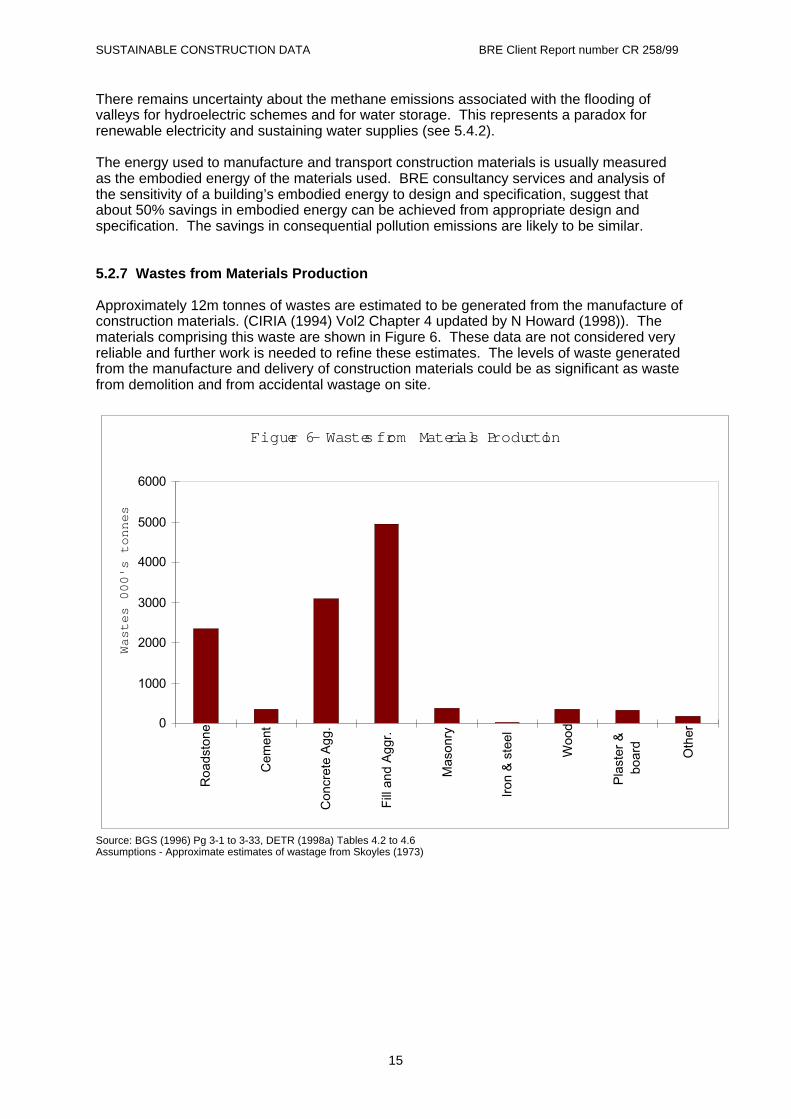
5.2.7 Wastes from Materials Production
Approximately 12m tonnes of wastes are estimated to be generated from the manufacture ofconstruction materials. (CIRIA (1994) Vol2 Chapter 4 updated by N Howard (1998)). Thematerials comprising this waste are shown in Figure 6. These data are not considered veryreliable and further work is needed to refine these estimates. The levels of waste generatedfrom the manufacture and delivery of construction materials could be as significant as wastefrom demolition and from accidental wastage on site.
Source: BGS (1996) Pg 3-1 to 3-33, DETR (1998a) Tables 4.2 to 4.6Assumptions - Approximate estimates of wastage from Skoyles (1973)
Figure 6 - Wastes from Materi als Producti on
0
1000
2000
3000
4000
5000
6000
Roa
dsto
ne
Cem
ent
Con
cret
e A
gg.
Fill
and
Agg
r.
Mas
onry
Iron
& s
teel
Woo
d
Pla
ster
&bo
ard
Oth
er
Wa
ste
s 0
00
's to
nn
es
SUSTAINABLE CONSTRUCTION DATA BRE Client Report number CR 258/99
16
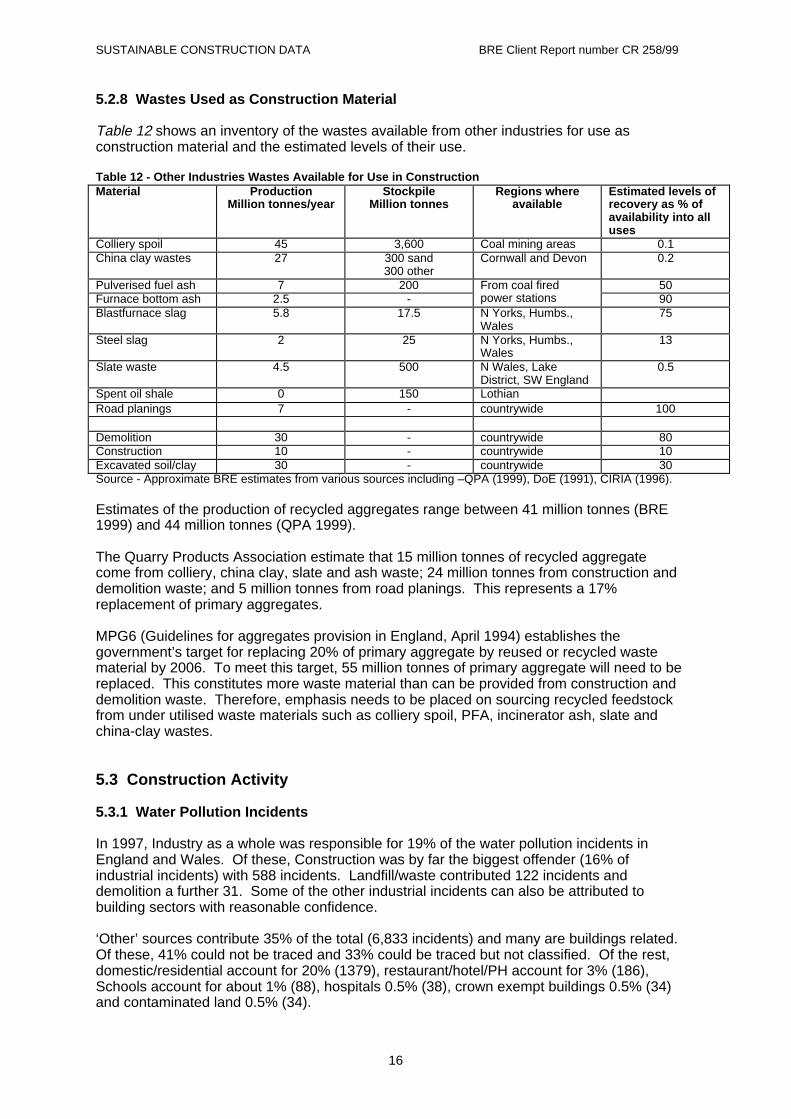
5.2.8 Wastes Used as Construction Material Table 12 shows an inventory of the wastes available from other industries for use asconstruction material and the estimated levels of their use. Table 12 - Other Industries Wastes Available for Use in Construction Material Production
Million tonnes/year Stockpile
Million tonnes Regions where
available Estimated levels ofrecovery as % ofavailability into alluses
Colliery spoil 45 3,600 Coal mining areas 0.1 China clay wastes 27 300 sand
300 other Cornwall and Devon 0.2
Pulverised fuel ash 7 200 50 Furnace bottom ash 2.5 -
From coal firedpower stations 90
Blastfurnace slag 5.8 17.5 N Yorks, Humbs.,Wales
75
Steel slag 2 25 N Yorks, Humbs.,Wales
13
Slate waste 4.5 500 N Wales, LakeDistrict, SW England
0.5
Spent oil shale 0 150 Lothian Road planings 7 - countrywide 100 Demolition 30 - countrywide 80 Construction 10 - countrywide 10 Excavated soil/clay 30 - countrywide 30 Source - Approximate BRE estimates from various sources including –QPA (1999), DoE (1991), CIRIA (1996). Estimates of the production of recycled aggregates range between 41 million tonnes (BRE1999) and 44 million tonnes (QPA 1999). The Quarry Products Association estimate that 15 million tonnes of recycled aggregatecome from colliery, china clay, slate and ash waste; 24 million tonnes from construction anddemolition waste; and 5 million tonnes from road planings. This represents a 17%replacement of primary aggregates. MPG6 (Guidelines for aggregates provision in England, April 1994) establishes thegovernment’s target for replacing 20% of primary aggregate by reused or recycled wastematerial by 2006. To meet this target, 55 million tonnes of primary aggregate will need to bereplaced. This constitutes more waste material than can be provided from construction anddemolition waste. Therefore, emphasis needs to be placed on sourcing recycled feedstockfrom under utilised waste materials such as colliery spoil, PFA, incinerator ash, slate andchina-clay wastes.
5.3 Construction Activity
5.3.1 Water Pollution Incidents
In 1997, Industry as a whole was responsible for 19% of the water pollution incidents inEngland and Wales. Of these, Construction was by far the biggest offender (16% ofindustrial incidents) with 588 incidents. Landfill/waste contributed 122 incidents anddemolition a further 31. Some of the other industrial incidents can also be attributed tobuilding sectors with reasonable confidence.
‘Other’ sources contribute 35% of the total (6,833 incidents) and many are buildings related.Of these, 41% could not be traced and 33% could be traced but not classified. Of the rest,domestic/residential account for 20% (1379), restaurant/hotel/PH account for 3% (186),Schools account for about 1% (88), hospitals 0.5% (38), crown exempt buildings 0.5% (34)and contaminated land 0.5% (34).
SUSTAINABLE CONSTRUCTION DATA BRE Client Report number CR 258/99
17
Agriculture accounts for about 10% of substantiated incidents, but relatively few involvebuildings (estimated 3% of total agricultural incidents). Specific data for private factories,private offices, private warehouses and shops are not explicitly identified. However, asignificant proportion of industrial incidents are almost certainly factory and warehouserelated. About 1000 incidents (29%) are in these categories (EA series 1997).
5.3.2 Noise Pollution
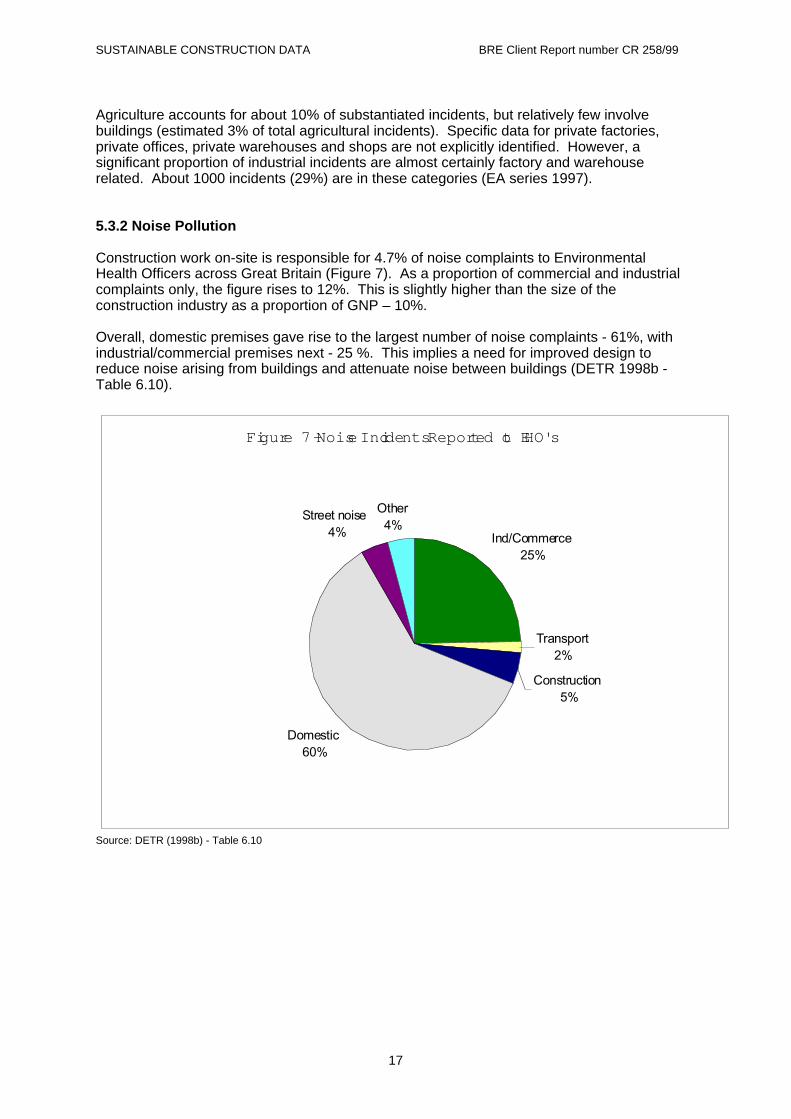
Construction work on-site is responsible for 4.7% of noise complaints to EnvironmentalHealth Officers across Great Britain (Figure 7). As a proportion of commercial and industrialcomplaints only, the figure rises to 12%. This is slightly higher than the size of theconstruction industry as a proportion of GNP – 10%.
Overall, domestic premises gave rise to the largest number of noise complaints - 61%, withindustrial/commercial premises next - 25 %. This implies a need for improved design toreduce noise arising from buildings and attenuate noise between buildings (DETR 1998b -Table 6.10).
Source: DETR (1998b) - Table 6.10
Figure 7 - Noise Incidents Reported to EHO's
Ind/Commerce25%
Transport2%
Construction5%
Domestic60%
Street noise4%
Other4%
SUSTAINABLE CONSTRUCTION DATA BRE Client Report number CR 258/99
18
5.3.3 Dust Pollution
Although the construction industry has a reputation for causing dust nuisance at sites, nocomprehensive data could be found to substantiate this and establish its extent. Availableair quality data (DETR 1998b), describes particulate emissions from industrial processes andtransport. This aspect may require further basic measurement and research.
5.4 Buildings Operation
5.4.1 Energy
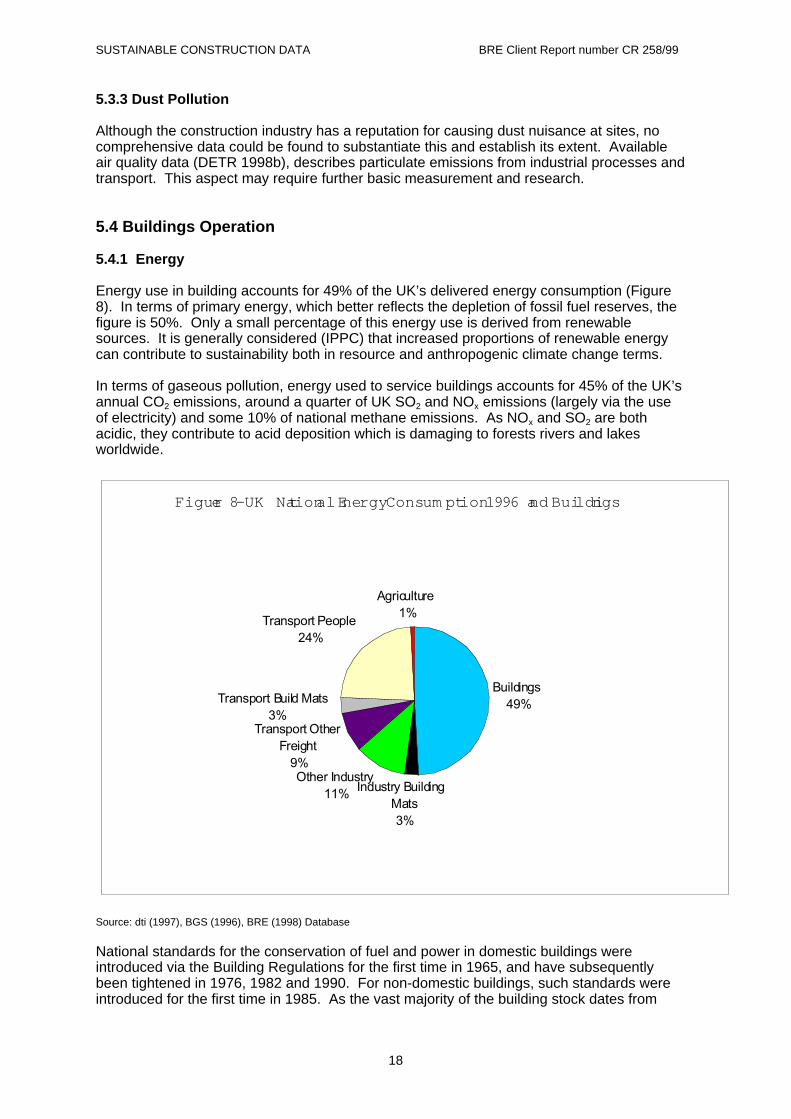
Energy use in building accounts for 49% of the UK’s delivered energy consumption (Figure8). In terms of primary energy, which better reflects the depletion of fossil fuel reserves, thefigure is 50%. Only a small percentage of this energy use is derived from renewablesources. It is generally considered (IPPC) that increased proportions of renewable energycan contribute to sustainability both in resource and anthropogenic climate change terms.
In terms of gaseous pollution, energy used to service buildings accounts for 45% of the UK’sannual CO2 emissions, around a quarter of UK SO2 and NOx emissions (largely via the useof electricity) and some 10% of national methane emissions. As NOx and SO2 are bothacidic, they contribute to acid deposition which is damaging to forests rivers and lakesworldwide.
Source: dti (1997), BGS (1996), BRE (1998) Database
National standards for the conservation of fuel and power in domestic buildings wereintroduced via the Building Regulations for the first time in 1965, and have subsequentlybeen tightened in 1976, 1982 and 1990. For non-domestic buildings, such standards wereintroduced for the first time in 1985. As the vast majority of the building stock dates from
Figure 8 - UK National Energy Consum ption 1996 and Buildings
Buildings49%
Industry Building Mats3%
Other Industry11%
Transport Other Freight
9%
Transport Build Mats3%
Transport People24%
Agriculture1%
SUSTAINABLE CONSTRUCTION DATA BRE Client Report number CR 258/99
19
before this time (65% for housing and 80% for non-domestic buildings) there is considerablescope for reducing energy consumption in the existing building stock.
5.4.2 Water
For water supplies to be sustainable, extraction from the aquifer must not exceed the rate ofreplenishment from rainfall. This implies the need to control consumption and design forrainfall to returned to the ground through soak-away strategies rather than run-off to sewersand hence into rivers.
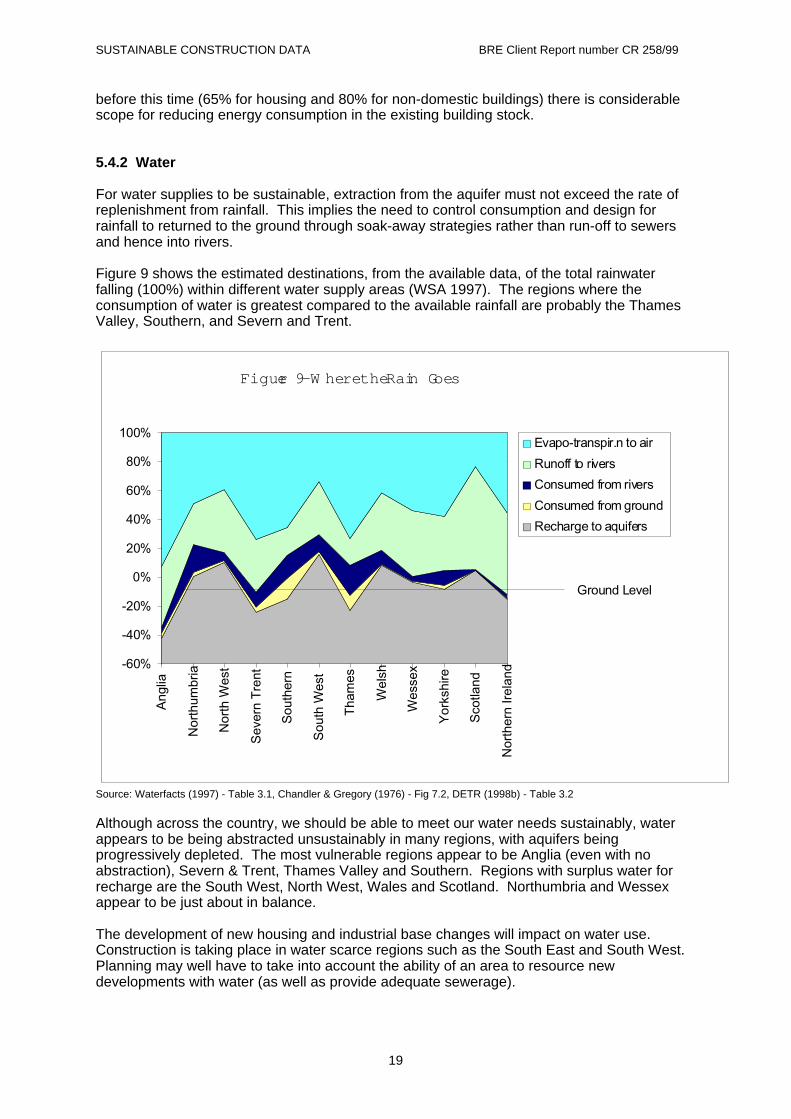
Figure 9 shows the estimated destinations, from the available data, of the total rainwaterfalling (100%) within different water supply areas (WSA 1997). The regions where theconsumption of water is greatest compared to the available rainfall are probably the ThamesValley, Southern, and Severn and Trent.
Source: Waterfacts (1997) - Table 3.1, Chandler & Gregory (1976) - Fig 7.2, DETR (1998b) - Table 3.2
Although across the country, we should be able to meet our water needs sustainably, waterappears to be being abstracted unsustainably in many regions, with aquifers beingprogressively depleted. The most vulnerable regions appear to be Anglia (even with noabstraction), Severn & Trent, Thames Valley and Southern. Regions with surplus water forrecharge are the South West, North West, Wales and Scotland. Northumbria and Wessexappear to be just about in balance.
The development of new housing and industrial base changes will impact on water use.Construction is taking place in water scarce regions such as the South East and South West.Planning may well have to take into account the ability of an area to resource newdevelopments with water (as well as provide adequate sewerage).
Figure 9 - W here the Rain Goes
-60%
-40%
-20%
0%
20%
40%
60%
80%
100%
Ang
lia
Nor
thum
bria
Nor
th W
est
Sev
ern
Tre
nt
Sou
ther
n
Sou
th W
est
Tha
mes
Wel
sh
Wes
sex
Yor
kshi
re
Sco
tland
Nor
ther
n Ir
elan
d
Evapo-transpir.n to air
Runoff to rivers
Consumed from rivers
Consumed from ground
Recharge to aquifers
Ground Level
SUSTAINABLE CONSTRUCTION DATA BRE Client Report number CR 258/99
20
Sustainability of the water resources will be greatly affected by climate change. Climatechange modelling predicts ‘wetter winters and drier summers’. Although annual precipitationfor the UK is predicted to increase, much of the increase will occur in bursts of high intensityrainfall which will tend to run off via rivers rather than go into storage or permeate intoaquifers. Hence, climate change is likely to bring both greater flooding and more frequentdrought.
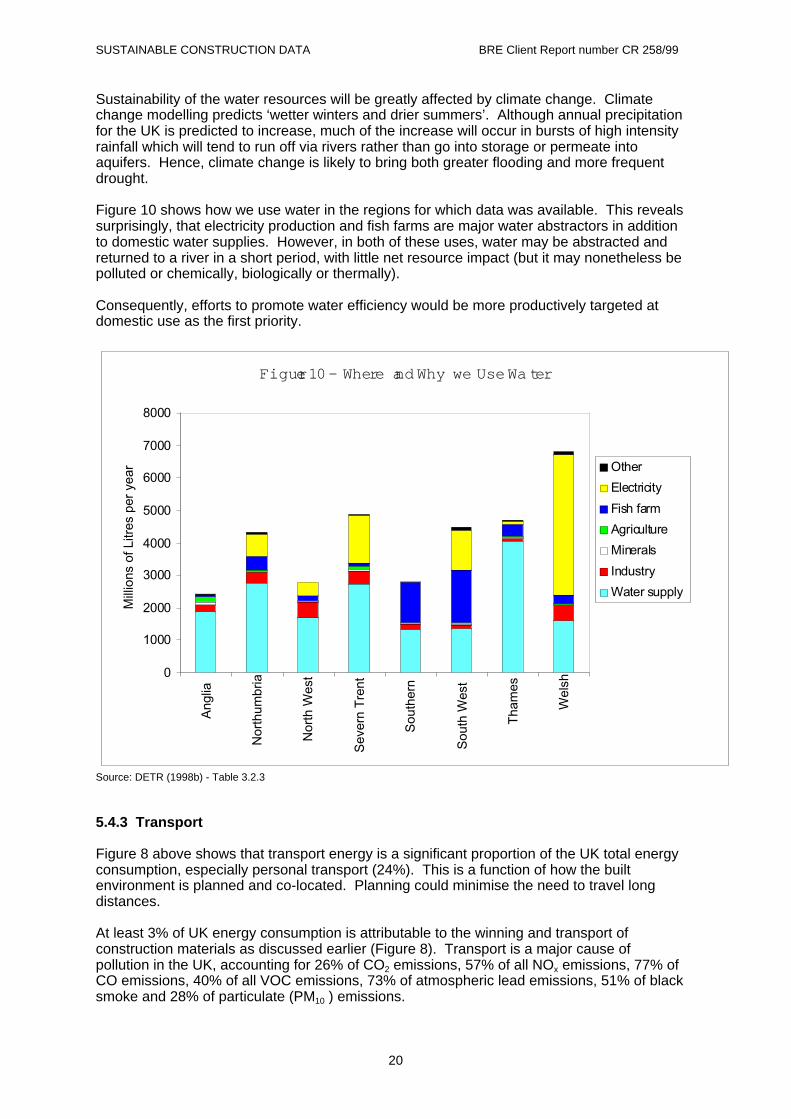
Figure 10 shows how we use water in the regions for which data was available. This revealssurprisingly, that electricity production and fish farms are major water abstractors in additionto domestic water supplies. However, in both of these uses, water may be abstracted andreturned to a river in a short period, with little net resource impact (but it may nonetheless bepolluted or chemically, biologically or thermally).
Consequently, efforts to promote water efficiency would be more productively targeted atdomestic use as the first priority.
Source: DETR (1998b) - Table 3.2.3
5.4.3 Transport
Figure 8 above shows that transport energy is a significant proportion of the UK total energyconsumption, especially personal transport (24%). This is a function of how the builtenvironment is planned and co-located. Planning could minimise the need to travel longdistances.
At least 3% of UK energy consumption is attributable to the winning and transport ofconstruction materials as discussed earlier (Figure 8). Transport is a major cause ofpollution in the UK, accounting for 26% of CO2 emissions, 57% of all NOx emissions, 77% ofCO emissions, 40% of all VOC emissions, 73% of atmospheric lead emissions, 51% of blacksmoke and 28% of particulate (PM10 ) emissions.
Figure 10 - Where a nd Why we Use Wa ter
0
1000
2000
3000
4000
5000
6000
7000
8000
Ang
lia
Nor
thum
bria
Nor
th W
est
Sev
ern
Tre
nt
Sou
ther
n
Sou
th W
est
Tha
mes
Wel
sh
Mill
ions
of L
itres
per
yea
r Other
Electricity
Fish farm
Agriculture
Minerals
Industry
Water supply
SUSTAINABLE CONSTRUCTION DATA BRE Client Report number CR 258/99
21
Although the number of road traffic accidents has only declined marginally over the last 20years, the number of fatalities has fallen by 40%. In 1994, the UK had the lowest death rateper passenger km from road traffic accidents apart from Sweden. The number of accidentsin 1996 was 235,939 of which 17% were serious and 1.4% were fatal, accounting for justover 1% of all deaths in the UK.
Transport is also noisy and causes vibration and subsidence damage to roads and otherstructures. In towns and cities, noise and pollution from cars is cited most often as thereason for needing air-conditioned buildings and this in turn results in buildings that consumetypically twice as much energy (especially electricity) and cause three times as much CO2
and other pollution.
Staff commuting to inner city offices that have no car parks and are well served with publictransport use half as much energy as staff commuting by car. The key factor has proved tobe the availability of car parking. Where provided, singly occupied cars are almostuniversally the preferred method of transport.
5.5 Transport Infrastructure
5.5.1 Roads
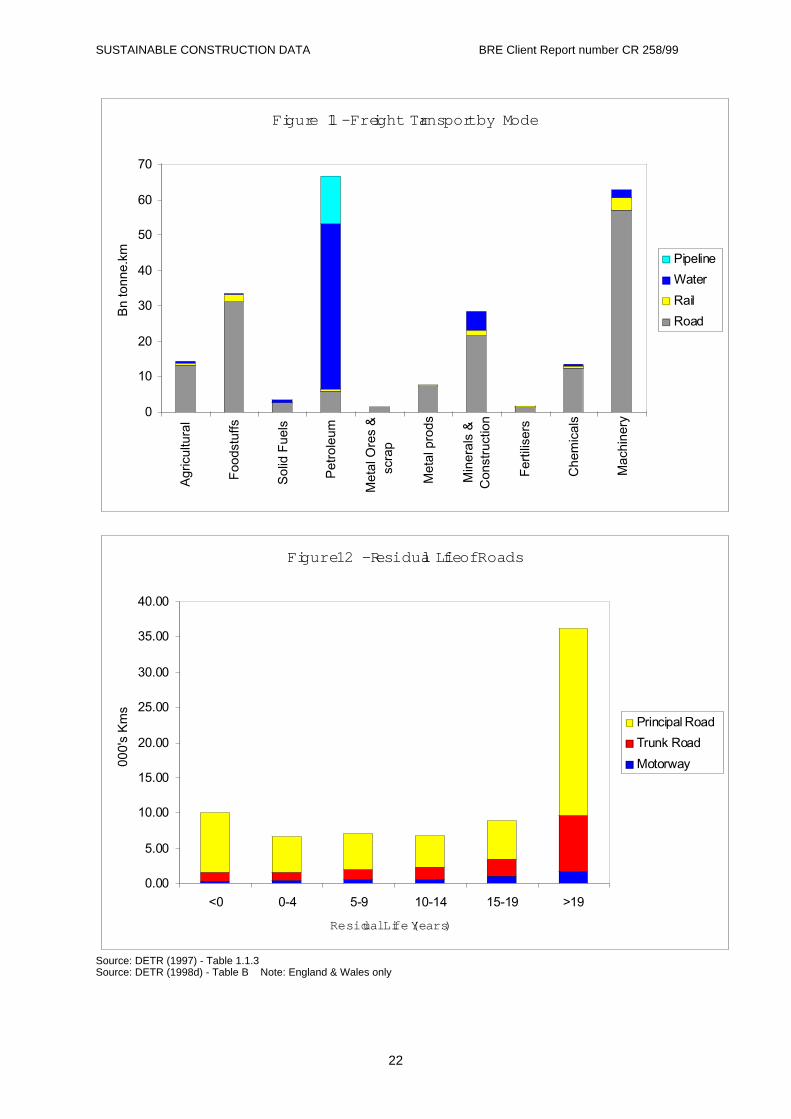
According to TRRL, “vehicles with high axle loadings (mostly heavy goods vehicles, but alsosome public service vehicles) are responsible for virtually all pavement wear”. Ironically, thiswill include vehicles that move construction materials (14% of freight transport movements).Figure 11 shows that heavy freight transport of most commodities is dominated by roadtransport.
Movement of heavy freight by sea is very energy efficient and should be optimised, but thiscannot deliver materials to their final destinations. Rail freight can also be energy efficientcompared to road haulage and much faster than by sea, but is again hampered by not beingable to deliver to final destinations. The movement of construction materials by rail accountsfor 5.7% of total construction movements (t.km) (DETR (1997). Further investigation of theprospects for modal shifts in the transport of construction materials and minerals and othercommodities is recommended. This would be more energy efficient and less polluting andprolong the lives of existing roads.
Figure 12 shows that although on average, the road network is in fairly good condition, (50%has a residual life of over 19 years), 13.3% is in need of immediate attention. Levels ofinvestment in new roads have declined rapidly in recent years, but are still double the levelsof investment in rail.
SUSTAINABLE CONSTRUCTION DATA BRE Client Report number CR 258/99
22
Source: DETR (1997) - Table 1.1.3Source: DETR (1998d) - Table B Note: England & Wales only
Figure 11 - Freight Transpor t by Mode
0
10
20
30
40
50
60
70
Agr
icul
tura
l
Foo
dstu
ffs
Sol
id F
uels
Pet
role
um
Met
al O
res
&sc
rap
Met
al p
rods
Min
eral
s &
Con
stru
ctio
n
Fer
tilis
ers
Che
mic
als
Mac
hine
ry
Bn
tonn
e.km Pipeline
Water
Rail
Road
Figure 12 - Residua l Life of Roads
0.00
5.00
10.00
15.00
20.00
25.00
30.00
35.00
40.00
<0 0-4 5-9 10-14 15-19 >19
Residual Life (Years)
000'
s K
ms
Principal Road
Trunk Road
Motorway
SUSTAINABLE CONSTRUCTION DATA BRE Client Report number CR 258/99
23
5.6 Recycling and Disposal
Approximately 40% of all construction and related wastes are believed to arise from therepair, maintenance and new build of domestic buildings, the remainder coming from otherconstruction sectors.
5.6.1 Construction Waste
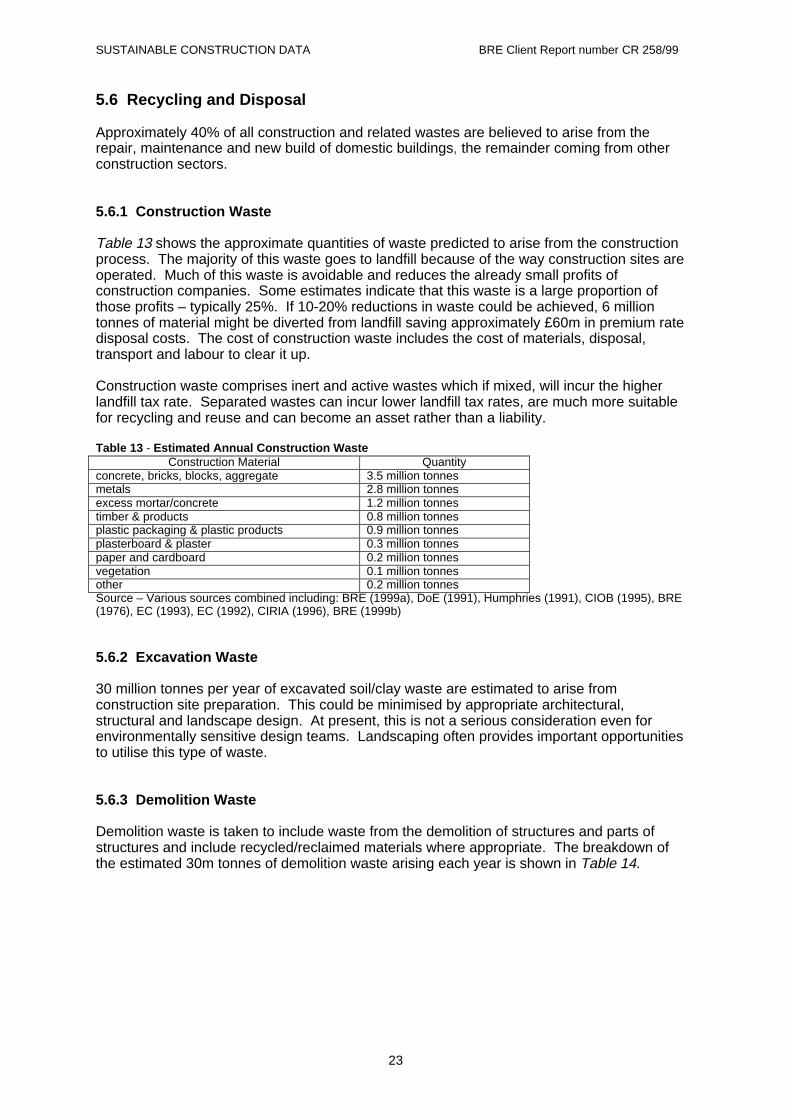
Table 13 shows the approximate quantities of waste predicted to arise from the constructionprocess. The majority of this waste goes to landfill because of the way construction sites areoperated. Much of this waste is avoidable and reduces the already small profits ofconstruction companies. Some estimates indicate that this waste is a large proportion ofthose profits – typically 25%. If 10-20% reductions in waste could be achieved, 6 milliontonnes of material might be diverted from landfill saving approximately £60m in premium ratedisposal costs. The cost of construction waste includes the cost of materials, disposal,transport and labour to clear it up.
Construction waste comprises inert and active wastes which if mixed, will incur the higherlandfill tax rate. Separated wastes can incur lower landfill tax rates, are much more suitablefor recycling and reuse and can become an asset rather than a liability.
Table 13 - Estimated Annual Construction Waste Construction Material Quantity
concrete, bricks, blocks, aggregate 3.5 million tonnes metals 2.8 million tonnes excess mortar/concrete 1.2 million tonnes timber & products 0.8 million tonnes plastic packaging & plastic products 0.9 million tonnes plasterboard & plaster 0.3 million tonnes paper and cardboard 0.2 million tonnes vegetation 0.1 million tonnes other 0.2 million tonnes Source – Various sources combined including: BRE (1999a), DoE (1991), Humphries (1991), CIOB (1995), BRE(1976), EC (1993), EC (1992), CIRIA (1996), BRE (1999b)
5.6.2 Excavation Waste 30 million tonnes per year of excavated soil/clay waste are estimated to arise fromconstruction site preparation. This could be minimised by appropriate architectural,structural and landscape design. At present, this is not a serious consideration even forenvironmentally sensitive design teams. Landscaping often provides important opportunitiesto utilise this type of waste. 5.6.3 Demolition Waste Demolition waste is taken to include waste from the demolition of structures and parts ofstructures and include recycled/reclaimed materials where appropriate. The breakdown ofthe estimated 30m tonnes of demolition waste arising each year is shown in Table 14.
SUSTAINABLE CONSTRUCTION DATA BRE Client Report number CR 258/99
24
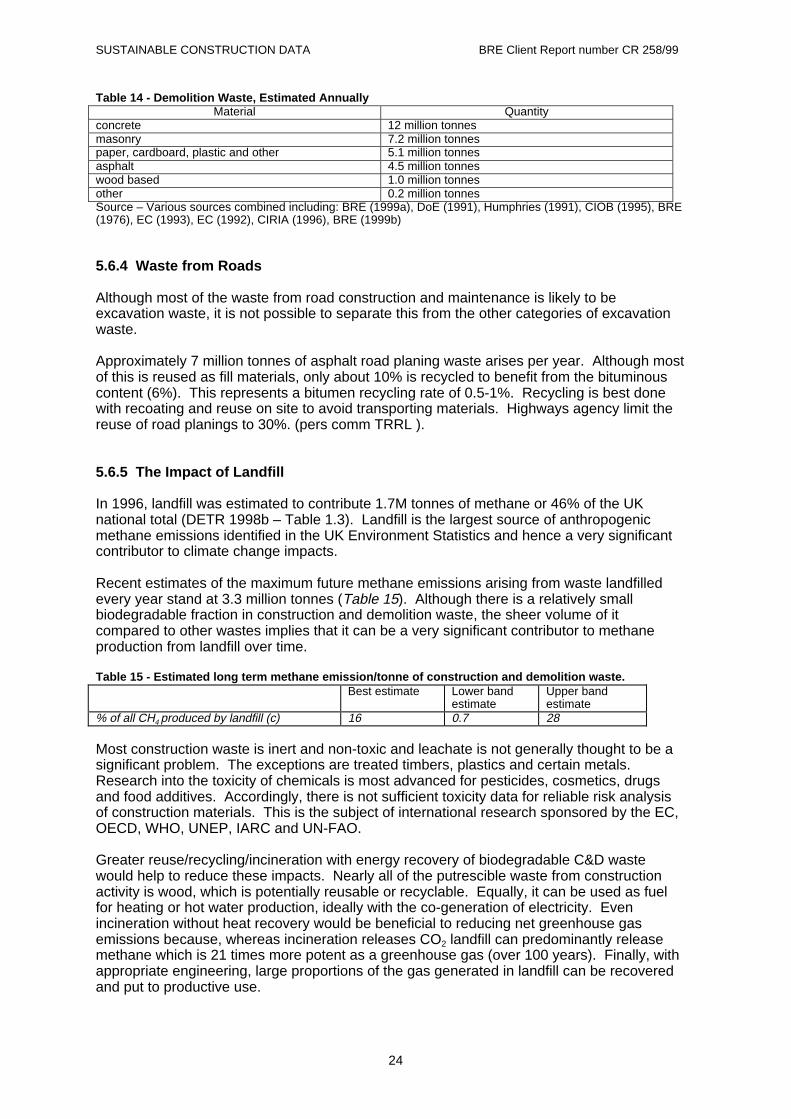
Table 14 - Demolition Waste, Estimated Annually Material Quantity
concrete 12 million tonnes masonry 7.2 million tonnes paper, cardboard, plastic and other 5.1 million tonnes asphalt 4.5 million tonnes wood based 1.0 million tonnes other 0.2 million tonnes Source – Various sources combined including: BRE (1999a), DoE (1991), Humphries (1991), CIOB (1995), BRE(1976), EC (1993), EC (1992), CIRIA (1996), BRE (1999b) 5.6.4 Waste from Roads Although most of the waste from road construction and maintenance is likely to beexcavation waste, it is not possible to separate this from the other categories of excavationwaste. Approximately 7 million tonnes of asphalt road planing waste arises per year. Although mostof this is reused as fill materials, only about 10% is recycled to benefit from the bituminouscontent (6%). This represents a bitumen recycling rate of 0.5-1%. Recycling is best donewith recoating and reuse on site to avoid transporting materials. Highways agency limit thereuse of road planings to 30%. (pers comm TRRL ). 5.6.5 The Impact of Landfill In 1996, landfill was estimated to contribute 1.7M tonnes of methane or 46% of the UKnational total (DETR 1998b – Table 1.3). Landfill is the largest source of anthropogenicmethane emissions identified in the UK Environment Statistics and hence a very significantcontributor to climate change impacts. Recent estimates of the maximum future methane emissions arising from waste landfilledevery year stand at 3.3 million tonnes (Table 15). Although there is a relatively smallbiodegradable fraction in construction and demolition waste, the sheer volume of itcompared to other wastes implies that it can be a very significant contributor to methaneproduction from landfill over time. Table 15 - Estimated long term methane emission/tonne of construction and demolition waste. Best estimate Lower band
estimate Upper bandestimate
% of all CH4 produced by landfill (c) 16 0.7 28 Most construction waste is inert and non-toxic and leachate is not generally thought to be asignificant problem. The exceptions are treated timbers, plastics and certain metals.Research into the toxicity of chemicals is most advanced for pesticides, cosmetics, drugsand food additives. Accordingly, there is not sufficient toxicity data for reliable risk analysisof construction materials. This is the subject of international research sponsored by the EC,OECD, WHO, UNEP, IARC and UN-FAO. Greater reuse/recycling/incineration with energy recovery of biodegradable C&D wastewould help to reduce these impacts. Nearly all of the putrescible waste from constructionactivity is wood, which is potentially reusable or recyclable. Equally, it can be used as fuelfor heating or hot water production, ideally with the co-generation of electricity. Evenincineration without heat recovery would be beneficial to reducing net greenhouse gasemissions because, whereas incineration releases CO2 landfill can predominantly releasemethane which is 21 times more potent as a greenhouse gas (over 100 years). Finally, withappropriate engineering, large proportions of the gas generated in landfill can be recoveredand put to productive use.
SUSTAINABLE CONSTRUCTION DATA BRE Client Report number CR 258/99
25
The full impact of landfilling C&D waste will only be quantifiable when information on thequantity and nature of the biodegradable component of construction and demolition wastegoing to landfill is available and the transport, noise, dust and other impacts have beenevaluated. 5.6.6 The Recycling Industry Approximately 24 million tonnes of inert C&D waste is recycled per annum. The averagetransport distance to the recycling site and back to the customer is 25km each way. Further information on recycled aggregate is presented in 5.2.8. Recent work being carriedout by the Environment Agency & minerals Planning department of the DETR will give amore accurate picture of the amount and type of inert waste recycling occurring throughoutthe UK. Timber recycling is increasing with new markets being sought in horticulture and energyrecovery. The chipboard manufacturers are all now replacing virgin feedstock with up to25% recycled wood fibre. The main constraints to this market are the location and quality ofthe material arising. Other materials such as plastics, cardboard and paper are not reaching the recycling sectorfrom construction and demolition works. This would require greater segregation and thecreation of collection systems that are currently not available. Metals recycling involves traditional recycling routes such as scrap yards. Metal fromconstruction and refurbishment is far less likely to be recycled than that arising fromdemolition. 5.6.7 The Reclamation Industry Approximately 3 million tonnes of C&D waste is reclaimed as per Table 16. 30% of thismaterial is reclaimed within 30km of its source, 60% within 150km and 10% beyond 150kmdistance (including import and export). Greater reuse of materials in mainstream construction would further increase the amount ofmaterials being reclaimed. Reclamation involves less processing, greater employment andis often a more efficient use of resources than recycling.
SUSTAINABLE CONSTRUCTION DATA BRE Client Report number CR 258/99
26
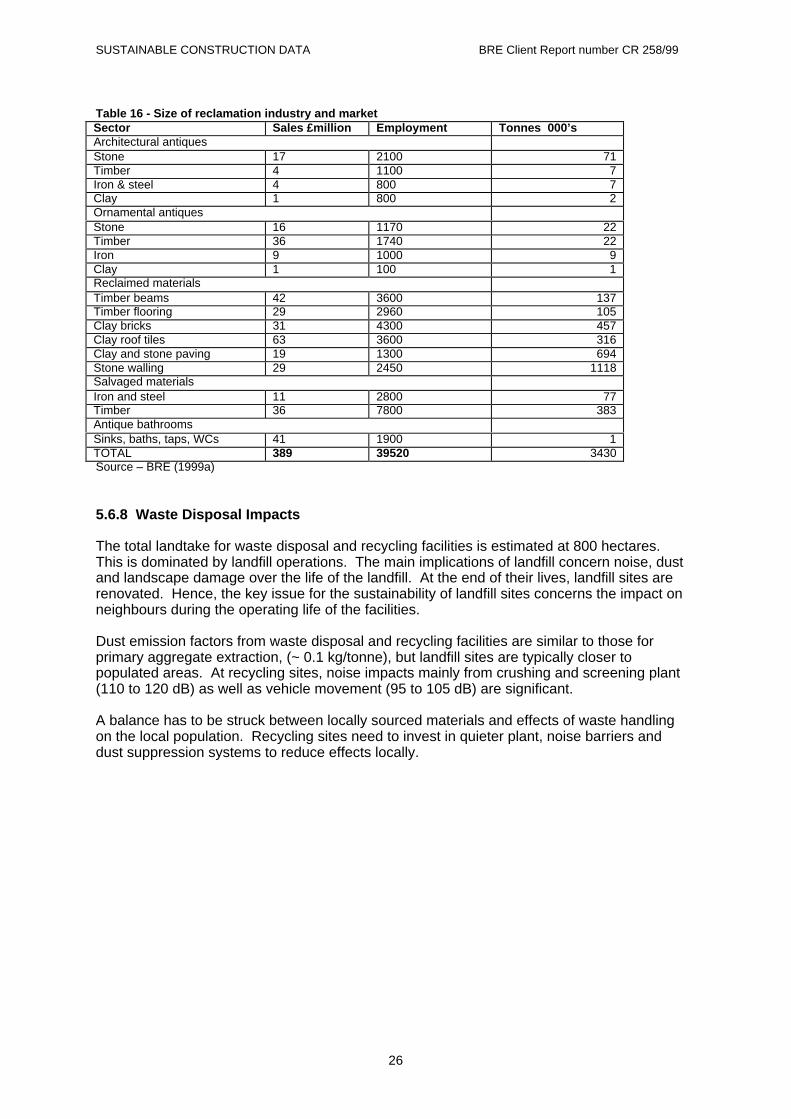
Table 16 - Size of reclamation industry and market Sector Sales £million Employment Tonnes 000’s Architectural antiques Stone 17 2100 71 Timber 4 1100 7 Iron & steel 4 800 7 Clay 1 800 2 Ornamental antiques Stone 16 1170 22 Timber 36 1740 22 Iron 9 1000 9 Clay 1 100 1 Reclaimed materials Timber beams 42 3600 137 Timber flooring 29 2960 105 Clay bricks 31 4300 457 Clay roof tiles 63 3600 316 Clay and stone paving 19 1300 694 Stone walling 29 2450 1118 Salvaged materials Iron and steel 11 2800 77 Timber 36 7800 383 Antique bathrooms Sinks, baths, taps, WCs 41 1900 1 TOTAL 389 39520 3430 Source – BRE (1999a)
5.6.8 Waste Disposal Impacts The total landtake for waste disposal and recycling facilities is estimated at 800 hectares.This is dominated by landfill operations. The main implications of landfill concern noise, dustand landscape damage over the life of the landfill. At the end of their lives, landfill sites arerenovated. Hence, the key issue for the sustainability of landfill sites concerns the impact onneighbours during the operating life of the facilities. Dust emission factors from waste disposal and recycling facilities are similar to those forprimary aggregate extraction, (~ 0.1 kg/tonne), but landfill sites are typically closer topopulated areas. At recycling sites, noise impacts mainly from crushing and screening plant(110 to 120 dB) as well as vehicle movement (95 to 105 dB) are significant. A balance has to be struck between locally sourced materials and effects of waste handlingon the local population. Recycling sites need to invest in quieter plant, noise barriers anddust suppression systems to reduce effects locally.

SUSTAINABLE CONSTRUCTION DATA BRE Client Report number CR 258/99
27
5.7 Social Perspectives
The construction industry moulds the environment in which we live by creating the cities,towns, villages and buildings that constitute our communities. It also creates theinfrastructure and communications networks that define the scope of our communities.Essential social requirements are the provision of decent and affordable housing for all,security of the built environment and mobility for all. The construction industry alsocontributes to our economy and provides employment. Equally, it has a large impact on theenvironment, especially locally, and also has significant social, community and spiritualimplications (e.g. landscape damage and restoration).
In addition, construction activity itself constitutes a community which employs people,provides working conditions and educates its workforce. Many of these aspects are difficultto measure objectively and for this reason, it has proved difficult to assess the socialimplications of construction.
5.7.1 Decent and Affordable Housing
In 1996, 116,870 households (0.59% of the total), were accepted by local authorities asrequiring re-housing. In addition to the thousands of people sleeping on the streets, about42,500 households were in temporary accommodation. Of the total homeless households,54% have dependent children, 11% have a pregnant member, 32% are vulnerable elderly,young, mentally ill or physically handicapped or victims of domestic violence or otheremergencies and are classified as priority A for housing (Wilcox 1998).
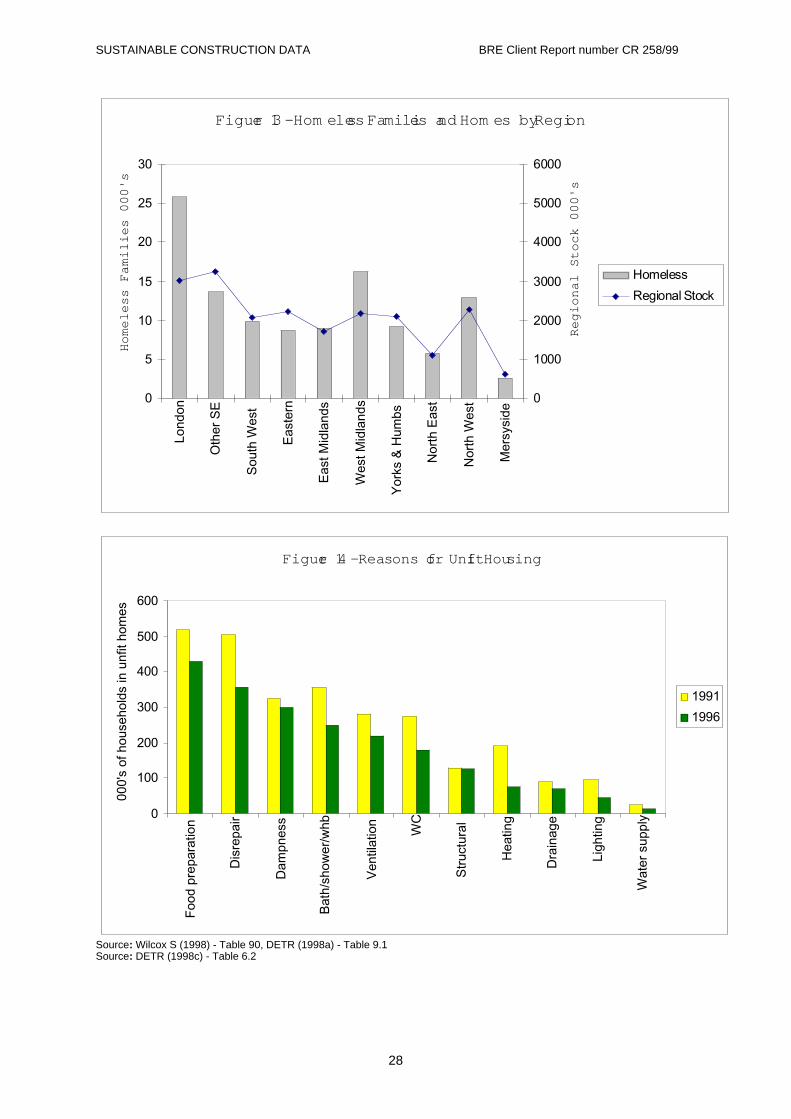
Figure 13 shows the distribution of homeless families compared to the regional distribution ofhouseholds. According to the English House Condition Survey (1996), about 1% of allhomes are vacant at any point in time. The vacant homes could house the homeless 7times over. Measures to streamline the process of moving home might be able to reducethe number of vacant homes at any time sufficiently to house many and perhaps all of thehomeless (DETR 1998c).
Also, the English House Condition Survey identifies approximately 2 million families as livingin 1.5million homes (7.6% of the stock) which were judged unfit for human habitation in1991. This is similar to the situation in 1989. Although about a third of unfit homes hadbeen renovated or demolished between these years, a further 500,000 homes had fallenunfit.
The main reasons for unfitness in 1991 and 1996 are shown in figure 14.
SUSTAINABLE CONSTRUCTION DATA BRE Client Report number CR 258/99
28
Source: Wilcox S (1998) - Table 90, DETR (1998a) - Table 9.1Source: DETR (1998c) - Table 6.2
Figure 13 - Hom eless Famili es and Hom es by Region
0
5
10
15
20
25
30Lo
ndon
Oth
er S
E
Sou
th W
est
Eas
tern
Eas
t Mid
land
s
Wes
t Mid
land
s
Yor
ks &
Hum
bs
Nor
th E
ast
Nor
th W
est
Mer
sysi
de
Ho
me
less
Fa
mili
es
00
0's
0
1000
2000
3000
4000
5000
6000
Re
gio
na
l Sto
ck 0
00
's
Homeless
Regional Stock
Figure 14 - Reasons f or Unfit Housing
0
100
200
300
400
500
600
Foo
d pr
epar
atio
n
Dis
repa
ir
Dam
pnes
s
Bat
h/sh
ower
/whb
Ven
tilat
ion
WC
Str
uctu
ral
Hea
ting
Dra
inag
e
Ligh
ting
Wat
er s
uppl
y
000'
s of
hou
seho
lds
in u
nfit
hom
es
1991
1996
SUSTAINABLE CONSTRUCTION DATA BRE Client Report number CR 258/99
29
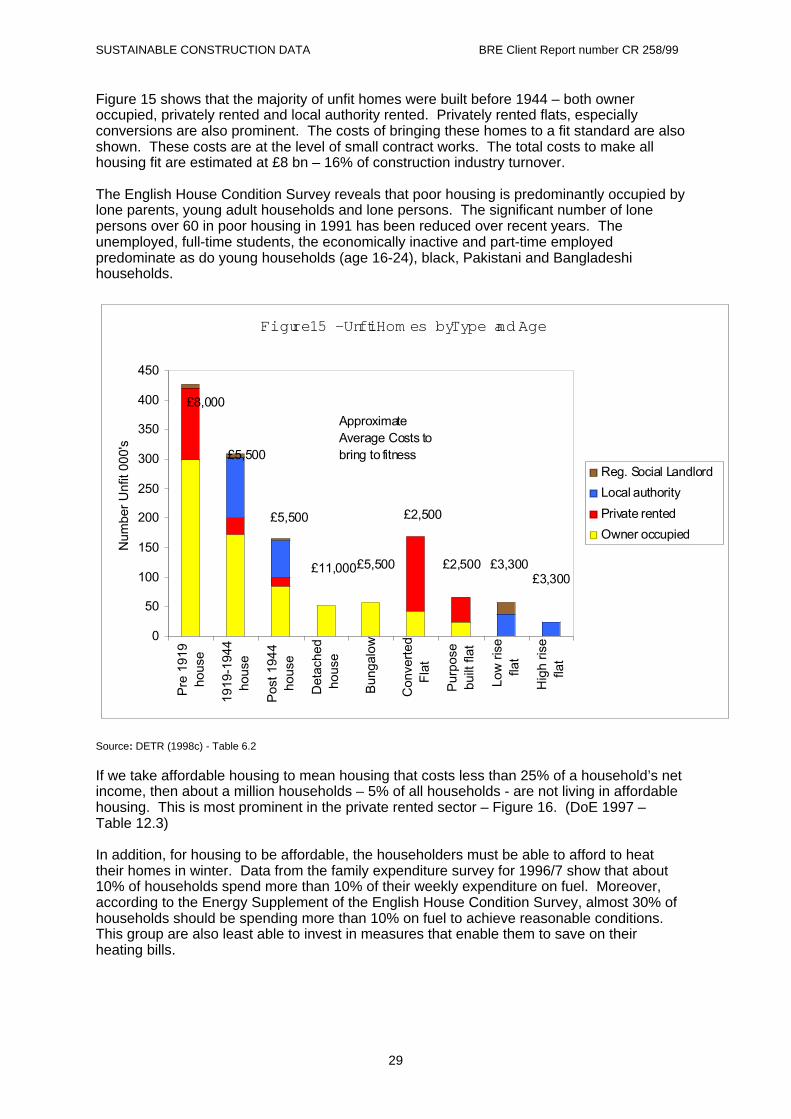
Figure 15 shows that the majority of unfit homes were built before 1944 – both owneroccupied, privately rented and local authority rented. Privately rented flats, especiallyconversions are also prominent. The costs of bringing these homes to a fit standard are alsoshown. These costs are at the level of small contract works. The total costs to make allhousing fit are estimated at £8 bn – 16% of construction industry turnover.
The English House Condition Survey reveals that poor housing is predominantly occupied bylone parents, young adult households and lone persons. The significant number of lonepersons over 60 in poor housing in 1991 has been reduced over recent years. Theunemployed, full-time students, the economically inactive and part-time employedpredominate as do young households (age 16-24), black, Pakistani and Bangladeshihouseholds.
Source: DETR (1998c) - Table 6.2
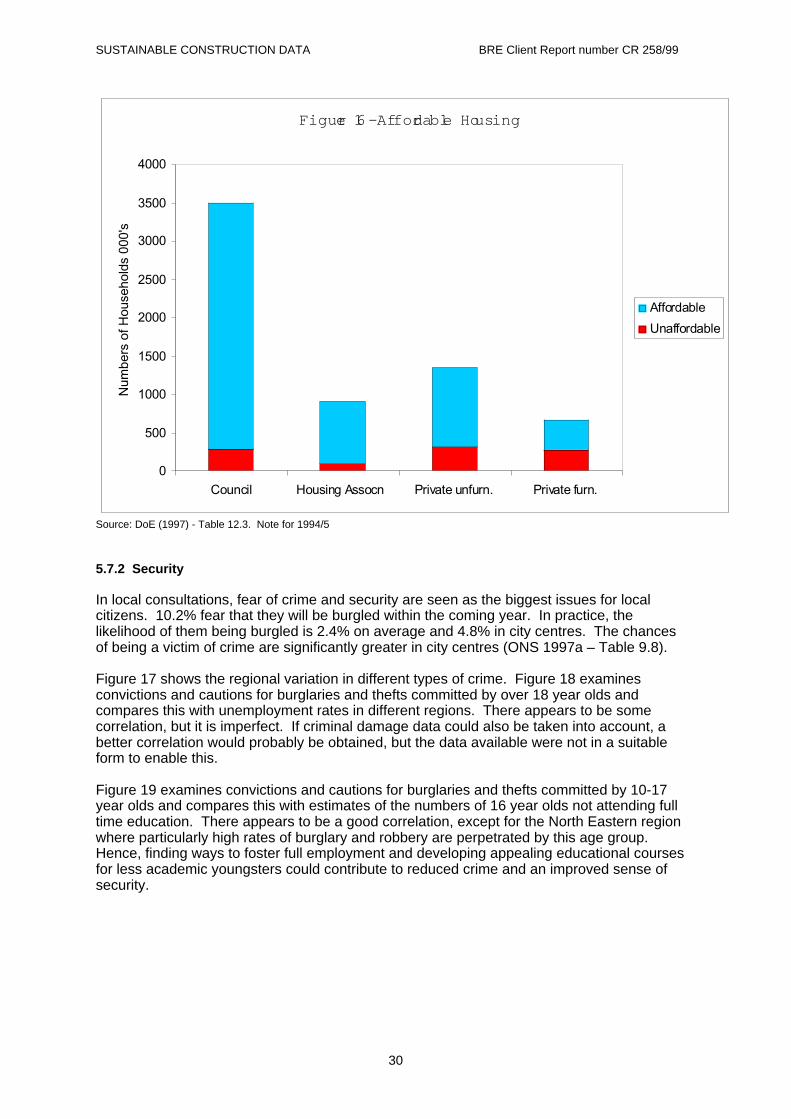
If we take affordable housing to mean housing that costs less than 25% of a household’s netincome, then about a million households – 5% of all households - are not living in affordablehousing. This is most prominent in the private rented sector – Figure 16. (DoE 1997 –Table 12.3)
In addition, for housing to be affordable, the householders must be able to afford to heattheir homes in winter. Data from the family expenditure survey for 1996/7 show that about10% of households spend more than 10% of their weekly expenditure on fuel. Moreover,according to the Energy Supplement of the English House Condition Survey, almost 30% ofhouseholds should be spending more than 10% on fuel to achieve reasonable conditions.This group are also least able to invest in measures that enable them to save on theirheating bills.
Figure 15 - Unfit Hom es by Type and Age
0
50
100
150
200
250
300
350
400
450
Pre
191
9ho
use
1919
-194
4ho
use
Pos
t 194
4ho
use
Det
ache
dho
use
Bun
galo
w
Con
vert
edF
lat
Pur
pose
built
flat
Low
ris
efla
t
Hig
h ris
efla
t
Num
ber
Unf
it 00
0's
Reg. Social Landlord
Local authority
Private rented
Owner occupied
£8,000
£5,500
£11,000£5,500
£2,500
£2,500 £3,300£3,300
£5,500
Approximate Average Costs to bring to fitness
SUSTAINABLE CONSTRUCTION DATA BRE Client Report number CR 258/99
30
Source: DoE (1997) - Table 12.3. Note for 1994/5
5.7.2 Security
In local consultations, fear of crime and security are seen as the biggest issues for localcitizens. 10.2% fear that they will be burgled within the coming year. In practice, thelikelihood of them being burgled is 2.4% on average and 4.8% in city centres. The chancesof being a victim of crime are significantly greater in city centres (ONS 1997a – Table 9.8).
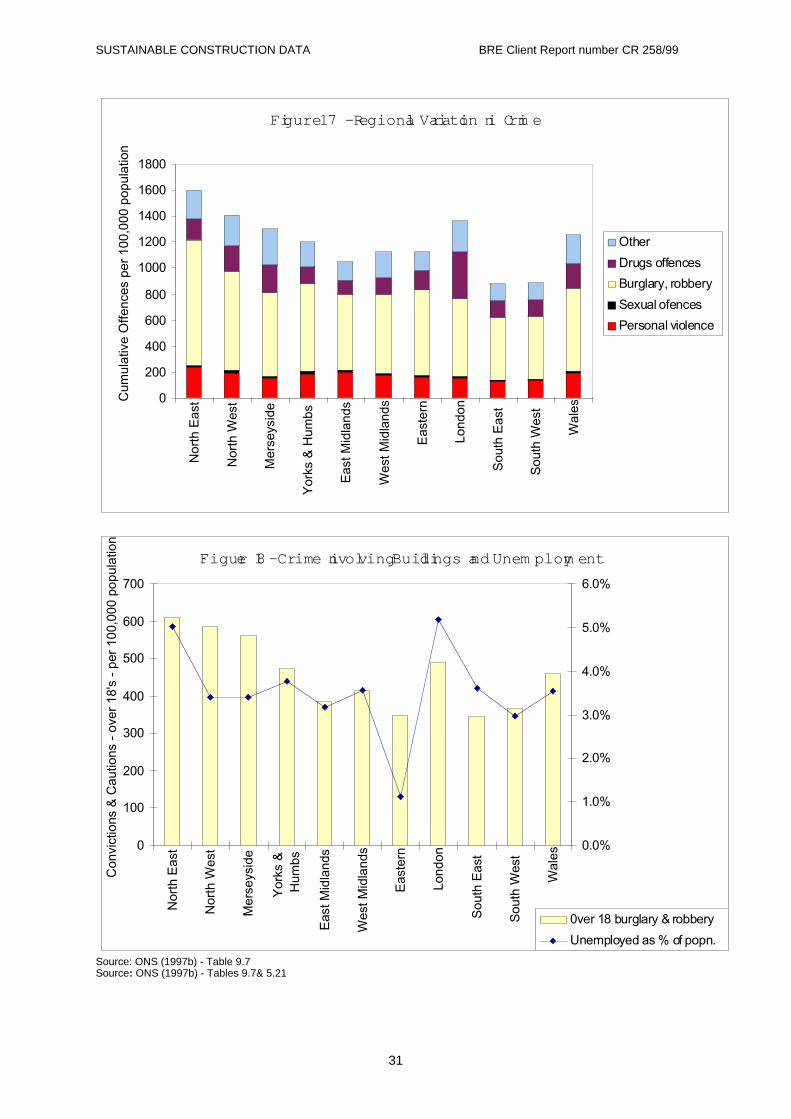
Figure 17 shows the regional variation in different types of crime. Figure 18 examinesconvictions and cautions for burglaries and thefts committed by over 18 year olds andcompares this with unemployment rates in different regions. There appears to be somecorrelation, but it is imperfect. If criminal damage data could also be taken into account, abetter correlation would probably be obtained, but the data available were not in a suitableform to enable this.
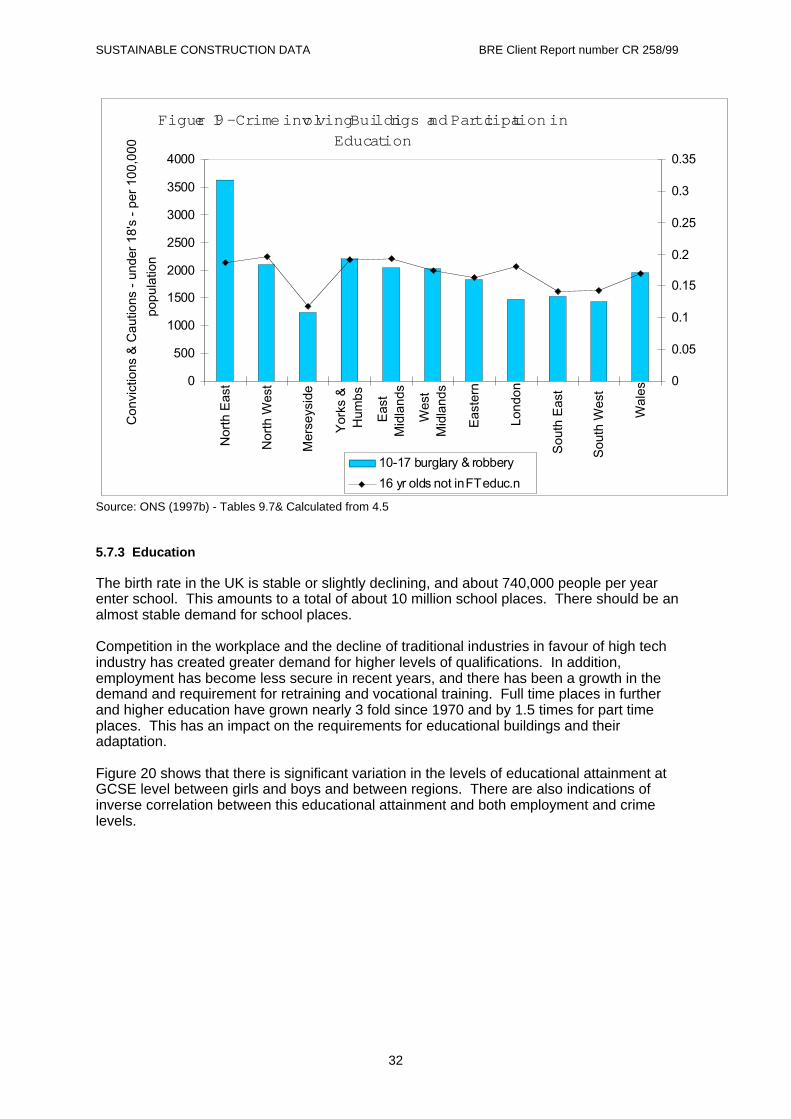
Figure 19 examines convictions and cautions for burglaries and thefts committed by 10-17year olds and compares this with estimates of the numbers of 16 year olds not attending fulltime education. There appears to be a good correlation, except for the North Eastern regionwhere particularly high rates of burglary and robbery are perpetrated by this age group.Hence, finding ways to foster full employment and developing appealing educational coursesfor less academic youngsters could contribute to reduced crime and an improved sense ofsecurity.
Figure 16 - Affor dable Housing
0
500
1000
1500
2000
2500
3000
3500
4000
Council Housing Assocn Private unfurn. Private furn.
Num
bers
of H
ouse
hold
s 00
0's
Affordable
Unaffordable
SUSTAINABLE CONSTRUCTION DATA BRE Client Report number CR 258/99
31
Source: ONS (1997b) - Table 9.7Source: ONS (1997b) - Tables 9.7& 5.21
Figure 17 - Regional Vari ation in Crim e
0
200
400
600
800
1000
1200
1400
1600
1800
Nor
th E
ast
Nor
th W
est
Mer
seys
ide
Yor
ks &
Hum
bs
Eas
t Mid
land
s
Wes
t Mid
land
s
Eas
tern
Lond
on
Sou
th E
ast
Sou
th W
est
Wal
es
Cum
ulat
ive
Offe
nces
per
100
,000
pop
ulat
ion
Other
Drugs offences
Burglary, robbery
Sexual ofences
Personal violence
Figure 18 - Crime i nvol ving Buildings and Unem ploym ent
0
100
200
300
400
500
600
700
Nor
th E
ast
Nor
th W
est
Mer
seys
ide
Yor
ks &
Hum
bs
Eas
t Mid
land
s
Wes
t Mid
land
s
Eas
tern
Lond
on
Sou
th E
ast
Sou
th W
est
Wal
es
Con
vict
ions
& C
autio
ns -
ove
r 18
's -
per
100
,000
pop
ulat
ion
0.0%
1.0%
2.0%
3.0%
4.0%
5.0%
6.0%
0ver 18 burglary & robbery
Unemployed as % of popn.
SUSTAINABLE CONSTRUCTION DATA BRE Client Report number CR 258/99
32
Source: ONS (1997b) - Tables 9.7& Calculated from 4.5
5.7.3 Education
The birth rate in the UK is stable or slightly declining, and about 740,000 people per yearenter school. This amounts to a total of about 10 million school places. There should be analmost stable demand for school places.
Competition in the workplace and the decline of traditional industries in favour of high techindustry has created greater demand for higher levels of qualifications. In addition,employment has become less secure in recent years, and there has been a growth in thedemand and requirement for retraining and vocational training. Full time places in furtherand higher education have grown nearly 3 fold since 1970 and by 1.5 times for part timeplaces. This has an impact on the requirements for educational buildings and theiradaptation.
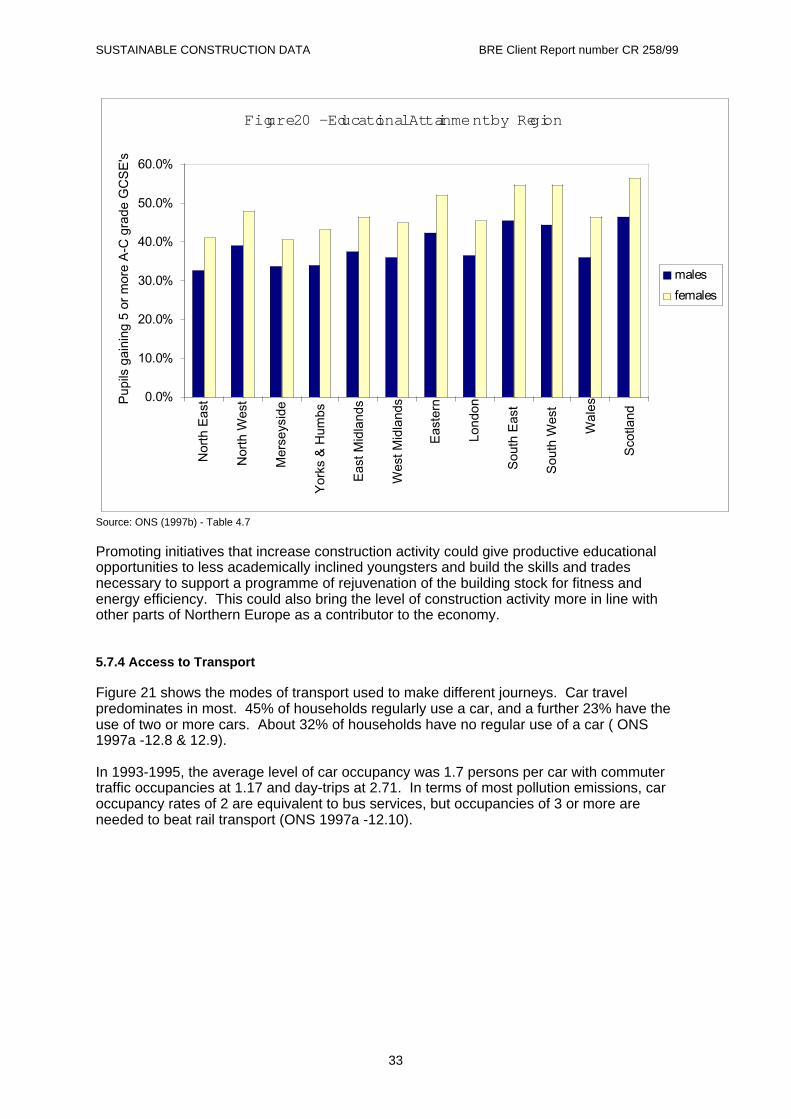
Figure 20 shows that there is significant variation in the levels of educational attainment atGCSE level between girls and boys and between regions. There are also indications ofinverse correlation between this educational attainment and both employment and crimelevels.
Figure 19 - Crime involving Buildings and Parti cipation in Educat ion
0
500
1000
1500
2000
2500
3000
3500
4000
Nor
th E
ast
Nor
th W
est
Mer
seys
ide
Yor
ks &
Hum
bs
Eas
tM
idla
nds
Wes
tM
idla
nds
Eas
tern
Lond
on
Sou
th E
ast
Sou
th W
est
Wal
es
Con
vict
ions
& C
autio
ns -
und
er 1
8's
- pe
r 10
0,00
0
popu
latio
n
0
0.05
0.1
0.15
0.2
0.25
0.3
0.35
10-17 burglary & robbery
16 yr olds not in FT educ.n
SUSTAINABLE CONSTRUCTION DATA BRE Client Report number CR 258/99
33
Source: ONS (1997b) - Table 4.7
Promoting initiatives that increase construction activity could give productive educationalopportunities to less academically inclined youngsters and build the skills and tradesnecessary to support a programme of rejuvenation of the building stock for fitness andenergy efficiency. This could also bring the level of construction activity more in line withother parts of Northern Europe as a contributor to the economy.
5.7.4 Access to Transport
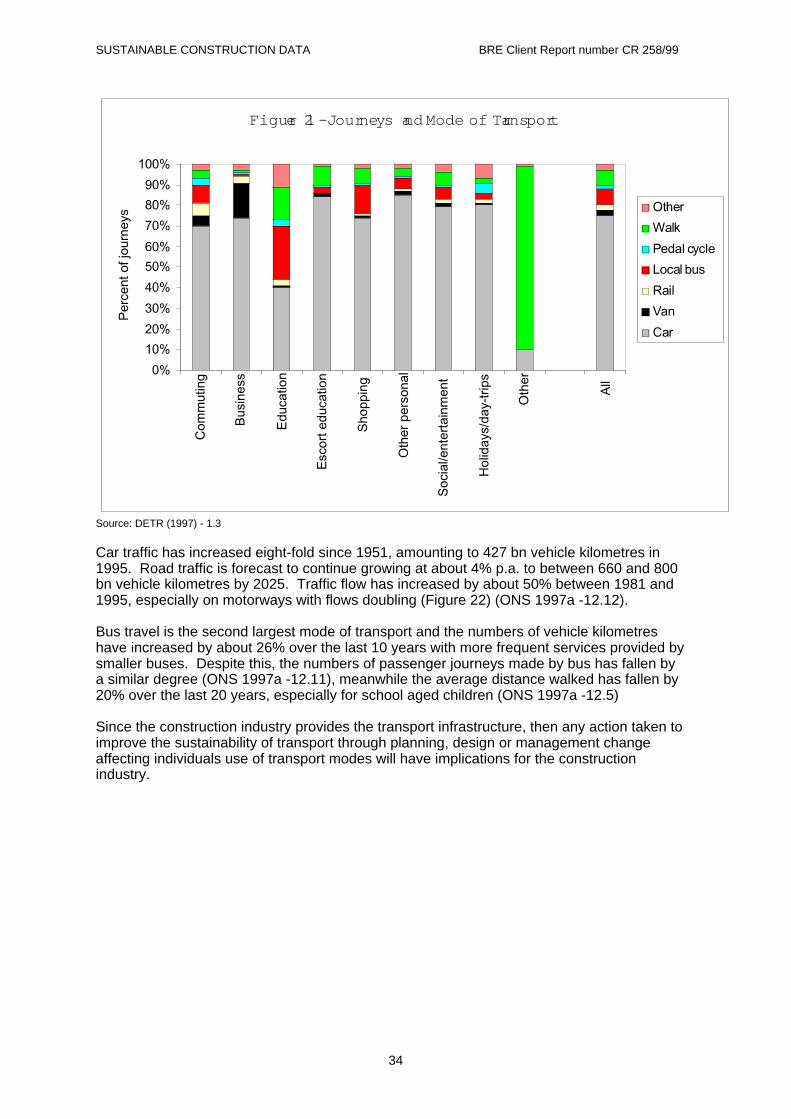
Figure 21 shows the modes of transport used to make different journeys. Car travelpredominates in most. 45% of households regularly use a car, and a further 23% have theuse of two or more cars. About 32% of households have no regular use of a car ( ONS1997a -12.8 & 12.9).
In 1993-1995, the average level of car occupancy was 1.7 persons per car with commutertraffic occupancies at 1.17 and day-trips at 2.71. In terms of most pollution emissions, caroccupancy rates of 2 are equivalent to bus services, but occupancies of 3 or more areneeded to beat rail transport (ONS 1997a -12.10).
Figure 20 - Educati onal Atta inment by Region
0.0%
10.0%
20.0%
30.0%
40.0%
50.0%
60.0%
Nor
th E
ast
Nor
th W
est
Mer
seys
ide
Yor
ks &
Hum
bs
Eas
t Mid
land
s
Wes
t Mid
land
s
Eas
tern
Lond
on
Sou
th E
ast
Sou
th W
est
Wal
es
Sco
tland
Pup
ils g
aini
ng 5
or
mor
e A
-C g
rade
GC
SE
's
males
females
SUSTAINABLE CONSTRUCTION DATA BRE Client Report number CR 258/99
34
Source: DETR (1997) - 1.3
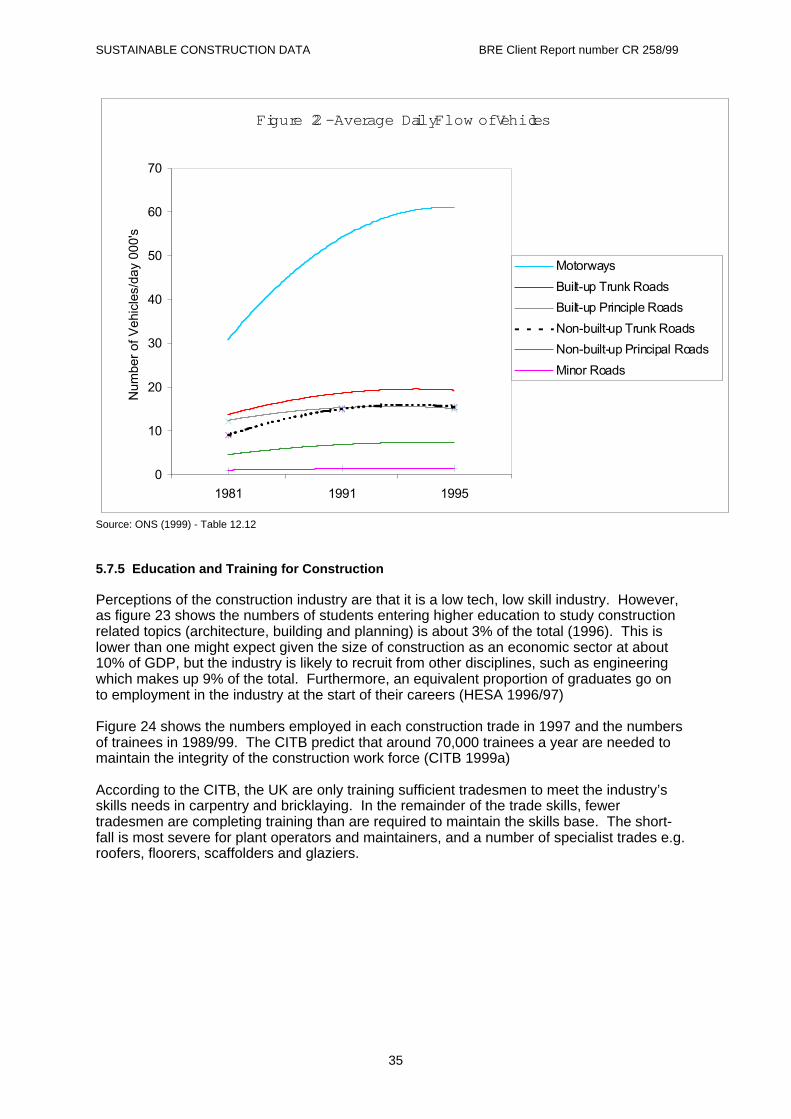
Car traffic has increased eight-fold since 1951, amounting to 427 bn vehicle kilometres in1995. Road traffic is forecast to continue growing at about 4% p.a. to between 660 and 800bn vehicle kilometres by 2025. Traffic flow has increased by about 50% between 1981 and1995, especially on motorways with flows doubling (Figure 22) (ONS 1997a -12.12).
Bus travel is the second largest mode of transport and the numbers of vehicle kilometreshave increased by about 26% over the last 10 years with more frequent services provided bysmaller buses. Despite this, the numbers of passenger journeys made by bus has fallen bya similar degree (ONS 1997a -12.11), meanwhile the average distance walked has fallen by20% over the last 20 years, especially for school aged children (ONS 1997a -12.5)
Since the construction industry provides the transport infrastructure, then any action taken toimprove the sustainability of transport through planning, design or management changeaffecting individuals use of transport modes will have implications for the constructionindustry.
Figure 21 - Jour neys a nd Mode of Transpor t
0%
10%
20%
30%
40%
50%
60%
70%
80%
90%
100%
Com
mut
ing
Bus
ines
s
Edu
catio
n
Esc
ort e
duca
tion
Sho
ppin
g
Oth
er p
erso
nal
Soc
ial/e
nter
tain
men
t
Hol
iday
s/da
y-tr
ips
Oth
er
All
Per
cent
of j
ourn
eys Other
Walk
Pedal cycle
Local bus
Rail
Van
Car
SUSTAINABLE CONSTRUCTION DATA BRE Client Report number CR 258/99
35
Source: ONS (1999) - Table 12.12
5.7.5 Education and Training for Construction
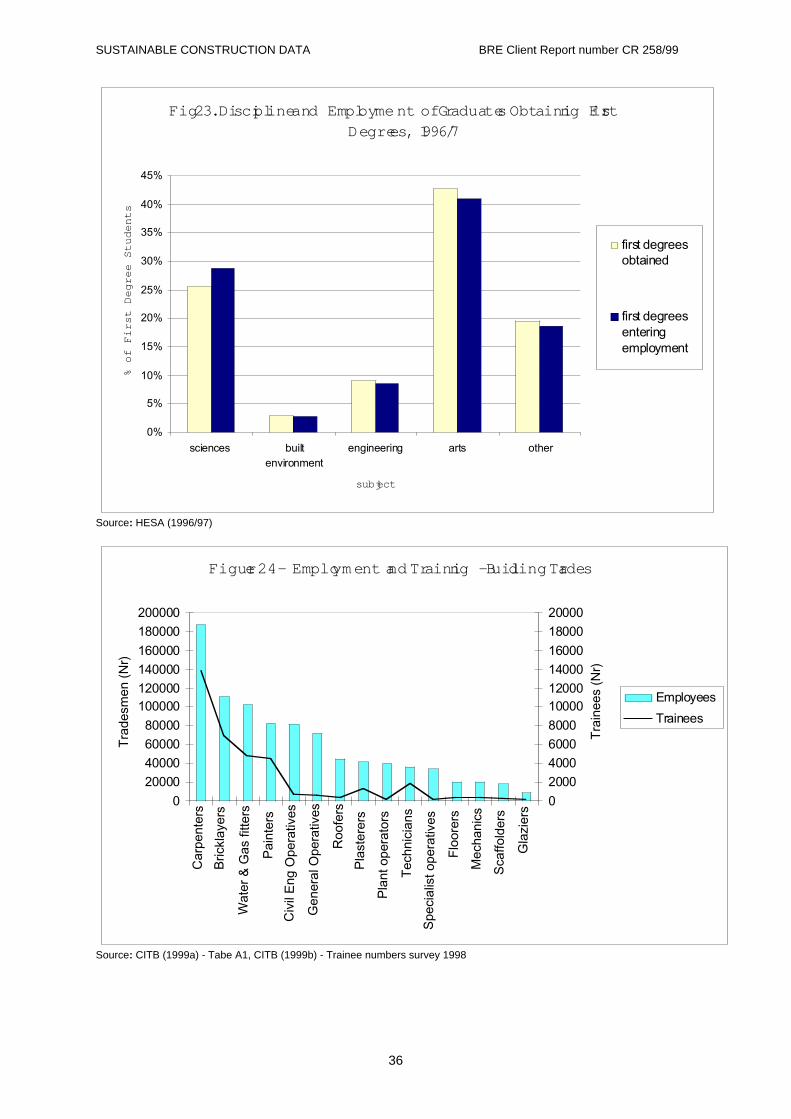
Perceptions of the construction industry are that it is a low tech, low skill industry. However,as figure 23 shows the numbers of students entering higher education to study constructionrelated topics (architecture, building and planning) is about 3% of the total (1996). This islower than one might expect given the size of construction as an economic sector at about10% of GDP, but the industry is likely to recruit from other disciplines, such as engineeringwhich makes up 9% of the total. Furthermore, an equivalent proportion of graduates go onto employment in the industry at the start of their careers (HESA 1996/97)
Figure 24 shows the numbers employed in each construction trade in 1997 and the numbersof trainees in 1989/99. The CITB predict that around 70,000 trainees a year are needed tomaintain the integrity of the construction work force (CITB 1999a)
According to the CITB, the UK are only training sufficient tradesmen to meet the industry’sskills needs in carpentry and bricklaying. In the remainder of the trade skills, fewertradesmen are completing training than are required to maintain the skills base. The short-fall is most severe for plant operators and maintainers, and a number of specialist trades e.g.roofers, floorers, scaffolders and glaziers.
Figure 22 - Average Da ily Flow of Vehicles
0
10
20
30
40
50
60
70
1981 1991 1995
Num
ber
of V
ehic
les/
day
000'
s
Motorways
Built-up Trunk Roads
Built-up Principle Roads
Non-built-up Trunk Roads
Non-built-up Principal Roads
Minor Roads
SUSTAINABLE CONSTRUCTION DATA BRE Client Report number CR 258/99
36
Source: HESA (1996/97)
Source: CITB (1999a) - Tabe A1, CITB (1999b) - Trainee numbers survey 1998
Figure 24 - Employm ent and Training - Building Trades
0
20000
40000
60000
80000
100000120000
140000
160000
180000
200000
Car
pent
ers
Bric
klay
ers
Wat
er &
Gas
fitte
rs
Pai
nter
s
Civ
il E
ng O
pera
tives
Gen
eral
Ope
rativ
es
Roo
fers
Pla
ster
ers
Pla
nt o
pera
tors
Tec
hnic
ians
Spe
cial
ist o
pera
tives
Flo
orer
s
Mec
hani
cs
Sca
ffold
ers
Gla
zier
s
Tra
desm
en (
Nr)
0
2000
4000
6000
8000
1000012000
14000
16000
18000
20000T
rain
ees
(Nr)
Employees
Trainees
Fig 23. Discipline and Empl oyme nt of Graduate s Obtaini ng First Degrees, 1996/7
0%
5%
10%
15%
20%
25%
30%
35%
40%
45%
sciences builtenvironment
engineering arts other
subj ect
% o
f F
irst
De
gre
e S
tud
en
ts first degreesobtained
first degreesenteringemployment
SUSTAINABLE CONSTRUCTION DATA BRE Client Report number CR 258/99
37
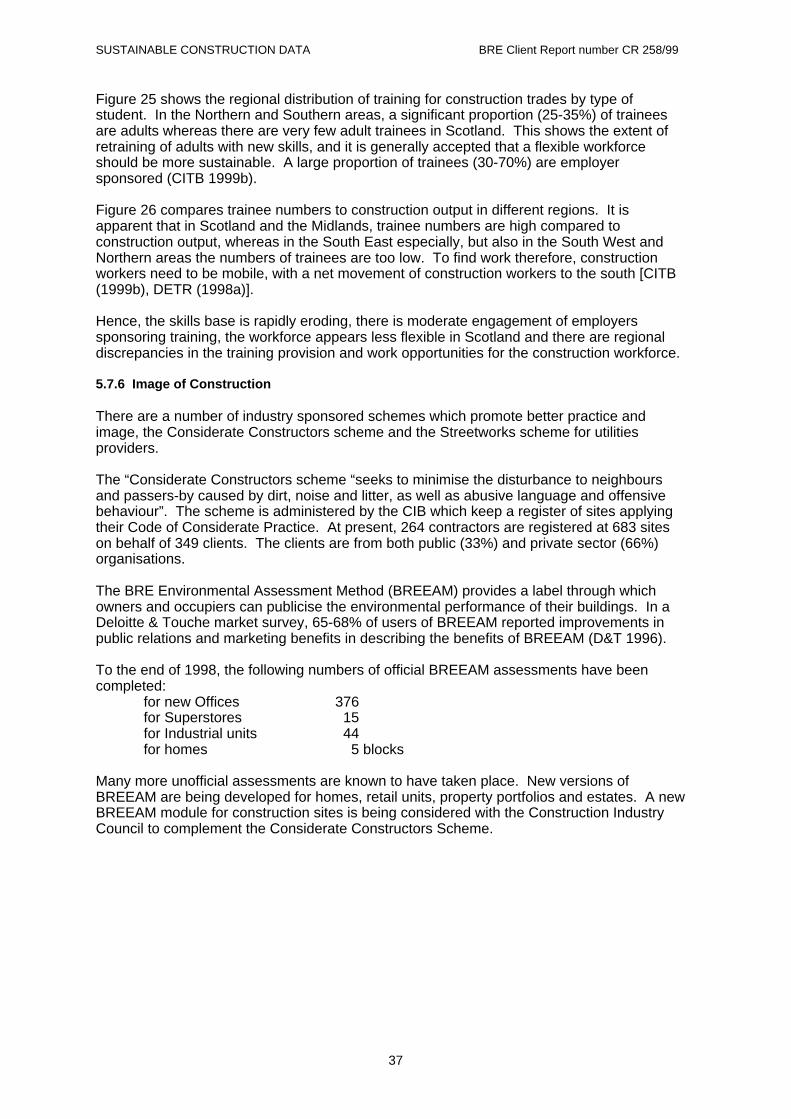
Figure 25 shows the regional distribution of training for construction trades by type ofstudent. In the Northern and Southern areas, a significant proportion (25-35%) of traineesare adults whereas there are very few adult trainees in Scotland. This shows the extent ofretraining of adults with new skills, and it is generally accepted that a flexible workforceshould be more sustainable. A large proportion of trainees (30-70%) are employersponsored (CITB 1999b).
Figure 26 compares trainee numbers to construction output in different regions. It isapparent that in Scotland and the Midlands, trainee numbers are high compared toconstruction output, whereas in the South East especially, but also in the South West andNorthern areas the numbers of trainees are too low. To find work therefore, constructionworkers need to be mobile, with a net movement of construction workers to the south [CITB(1999b), DETR (1998a)].
Hence, the skills base is rapidly eroding, there is moderate engagement of employerssponsoring training, the workforce appears less flexible in Scotland and there are regionaldiscrepancies in the training provision and work opportunities for the construction workforce.
5.7.6 Image of Construction
There are a number of industry sponsored schemes which promote better practice andimage, the Considerate Constructors scheme and the Streetworks scheme for utilitiesproviders.
The “Considerate Constructors scheme “seeks to minimise the disturbance to neighboursand passers-by caused by dirt, noise and litter, as well as abusive language and offensivebehaviour”. The scheme is administered by the CIB which keep a register of sites applyingtheir Code of Considerate Practice. At present, 264 contractors are registered at 683 siteson behalf of 349 clients. The clients are from both public (33%) and private sector (66%)organisations.
The BRE Environmental Assessment Method (BREEAM) provides a label through whichowners and occupiers can publicise the environmental performance of their buildings. In aDeloitte & Touche market survey, 65-68% of users of BREEAM reported improvements inpublic relations and marketing benefits in describing the benefits of BREEAM (D&T 1996).
To the end of 1998, the following numbers of official BREEAM assessments have beencompleted:
for new Offices 376for Superstores 15for Industrial units 44for homes 5 blocks
Many more unofficial assessments are known to have taken place. New versions ofBREEAM are being developed for homes, retail units, property portfolios and estates. A newBREEAM module for construction sites is being considered with the Construction IndustryCouncil to complement the Considerate Constructors Scheme.
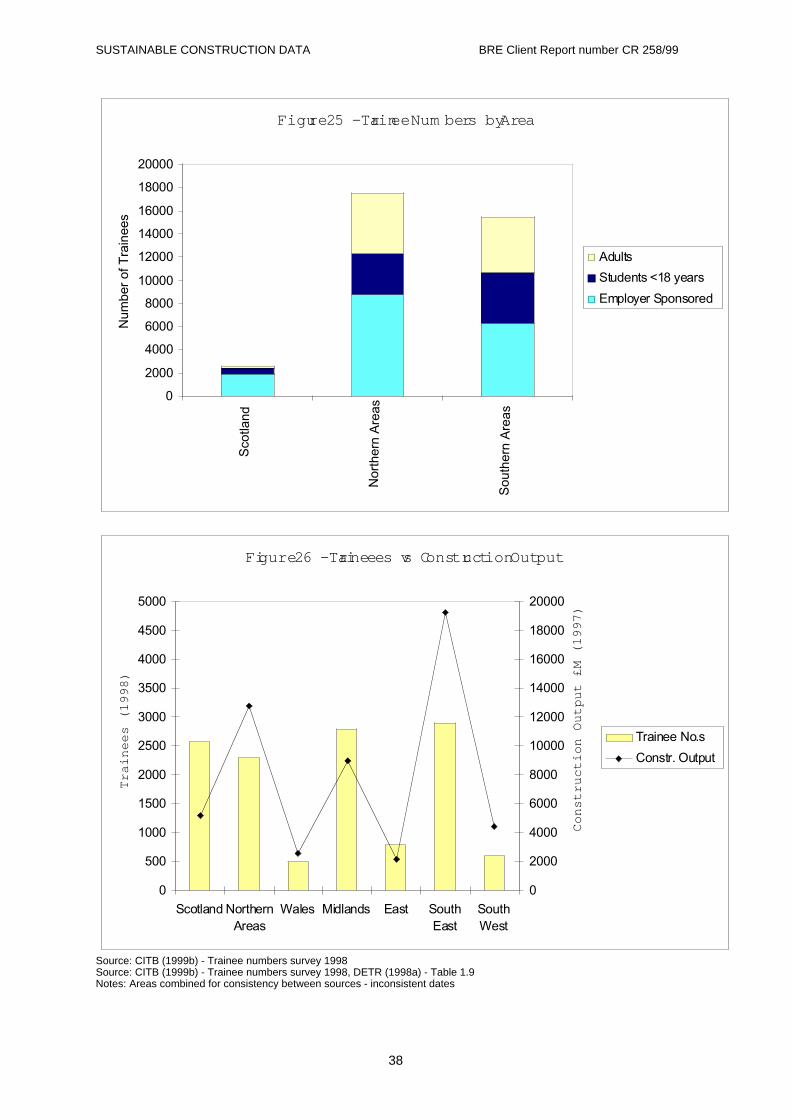
SUSTAINABLE CONSTRUCTION DATA BRE Client Report number CR 258/99
38
Source: CITB (1999b) - Trainee numbers survey 1998Source: CITB (1999b) - Trainee numbers survey 1998, DETR (1998a) - Table 1.9Notes: Areas combined for consistency between sources - inconsistent dates
Figure 25 - Trainee Num bers by Area
0
2000
4000
6000
8000
10000
12000
14000
16000
18000
20000
Sco
tland
Nor
ther
n A
reas
Sou
ther
n A
reas
Num
ber
of T
rain
ees
Adults
Students <18 years
Employer Sponsored
Figure 26 - Traineees v s Constr uct ion Output
0
500
1000
1500
2000
2500
3000
3500
4000
4500
5000
Scotland NorthernAreas
Wales Midlands East SouthEast
SouthWest
Tra
ine
es
(19
98
)
0
2000
4000
6000
8000
10000
12000
14000
16000
18000
20000
Co
nst
ruct
ion
Ou
tpu
t £
M (
19
97
)
Trainee No.s
Constr. Output
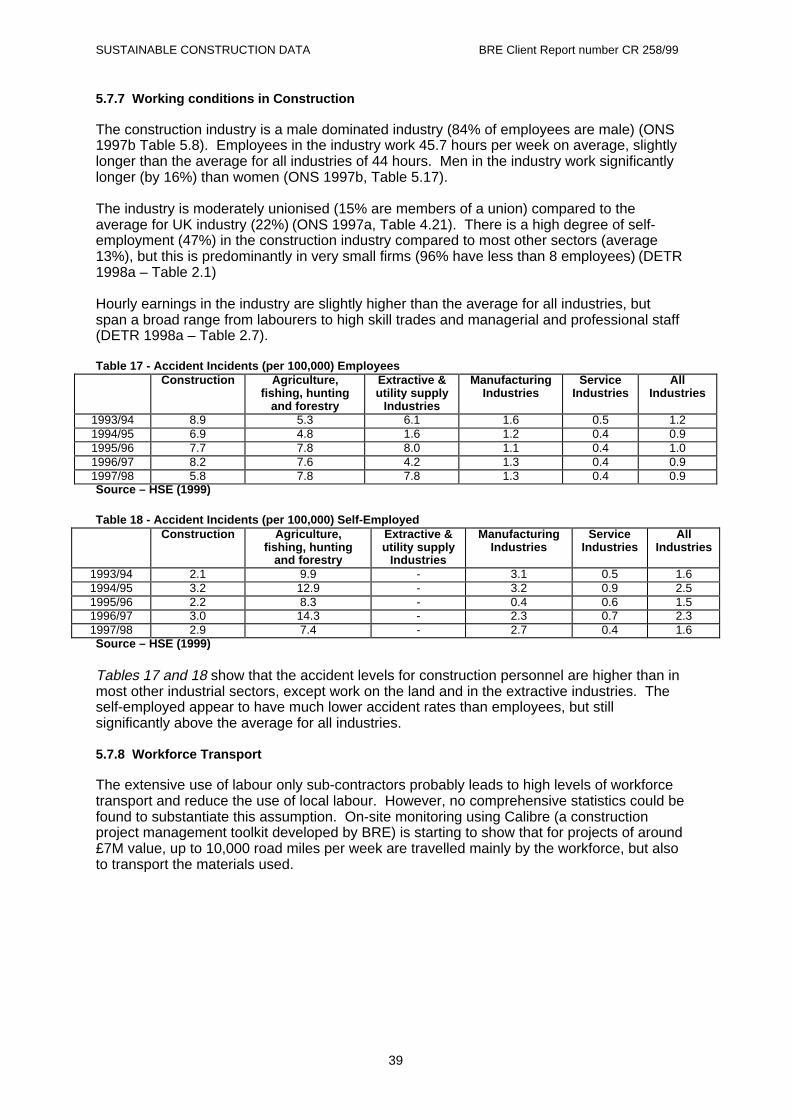
SUSTAINABLE CONSTRUCTION DATA BRE Client Report number CR 258/99
39
5.7.7 Working conditions in Construction
The construction industry is a male dominated industry (84% of employees are male) (ONS1997b Table 5.8). Employees in the industry work 45.7 hours per week on average, slightlylonger than the average for all industries of 44 hours. Men in the industry work significantlylonger (by 16%) than women (ONS 1997b, Table 5.17).
The industry is moderately unionised (15% are members of a union) compared to theaverage for UK industry (22%) (ONS 1997a, Table 4.21). There is a high degree of self-employment (47%) in the construction industry compared to most other sectors (average13%), but this is predominantly in very small firms (96% have less than 8 employees) (DETR1998a – Table 2.1)
Hourly earnings in the industry are slightly higher than the average for all industries, butspan a broad range from labourers to high skill trades and managerial and professional staff(DETR 1998a – Table 2.7).
Table 17 - Accident Incidents (per 100,000) EmployeesConstruction Agriculture,
fishing, huntingand forestry
Extractive &utility supply
Industries
ManufacturingIndustries
ServiceIndustries
AllIndustries
1993/94 8.9 5.3 6.1 1.6 0.5 1.21994/95 6.9 4.8 1.6 1.2 0.4 0.91995/96 7.7 7.8 8.0 1.1 0.4 1.01996/97 8.2 7.6 4.2 1.3 0.4 0.91997/98 5.8 7.8 7.8 1.3 0.4 0.9Source – HSE (1999)
Table 18 - Accident Incidents (per 100,000) Self-EmployedConstruction Agriculture,
fishing, huntingand forestry
Extractive &utility supply
Industries
ManufacturingIndustries
ServiceIndustries
AllIndustries
1993/94 2.1 9.9 - 3.1 0.5 1.61994/95 3.2 12.9 - 3.2 0.9 2.51995/96 2.2 8.3 - 0.4 0.6 1.51996/97 3.0 14.3 - 2.3 0.7 2.31997/98 2.9 7.4 - 2.7 0.4 1.6Source – HSE (1999)
Tables 17 and 18 show that the accident levels for construction personnel are higher than inmost other industrial sectors, except work on the land and in the extractive industries. Theself-employed appear to have much lower accident rates than employees, but stillsignificantly above the average for all industries.
5.7.8 Workforce Transport
The extensive use of labour only sub-contractors probably leads to high levels of workforcetransport and reduce the use of local labour. However, no comprehensive statistics could befound to substantiate this assumption. On-site monitoring using Calibre (a constructionproject management toolkit developed by BRE) is starting to show that for projects of around£7M value, up to 10,000 road miles per week are travelled mainly by the workforce, but alsoto transport the materials used.
SUSTAINABLE CONSTRUCTION DATA BRE Client Report number CR 258/99
40
6 Conclusions
This study has collated the key data on Sustainable Construction into a single publication.From this data the impacts from the construction industry on society can be viewedholistically and in comparison to one another.
It is clear that our understanding of Sustainable Construction is incomplete. However, betterinformation about sustainable construction is emerging all the time as sustainability is givenan increasingly high priority, both amongst society as a whole and within the constructionand materials industries.
In order to implement sustainability, the construction industry needs the best possible datawith which to guide and assess its actions. For this purpose it would be beneficial to theindustry for this study to be repeated on a regular basis (e.g. every 2 years).
The data in this report was the best available at the time the research was undertaken, but isobviously superseded by new information on a regular basis.
Further sources of information on Sustainable Construction can be gained from the Centrefor Sustainable Construction – email contact [email protected] , telephone 01923 664118, orvisit our web site at http://www.bre.co.uk/sustainable/index.html.
SUSTAINABLE CONSTRUCTION DATA BRE Client Report number CR 258/99
41
7 References
• BGS (1994) United Kingdom Minerals Yearbook 1994 . British Geological Survey• BGS (1996) United Kingdom Minerals Yearbook 1996 . British Geological Survey• BRE (1976) On Site Waste Audits of the Construction Industry BRE Report 1976• BRE (1996) An Initial Review of Land use in the UK . BRE Note N73/96• BRE (1998) BRE Database of Environmental Data for Construction Materials collection
of published data from a wide range of sources• BRE (1999a) Reclamation and Recycling of Building materials: Industry Position Report
BRE IP draft xx/99• BRE (1999b) Wastage on Pegasus Court Construction Site Interim report BRE 1999• BRECSU (1998) – Stock Floorspace Data collection from various sources - unpublished• BSRIA & DLC (1995) Construction in Japan: Opportunities for UK suppliers,
Contractors, Consultants BSRIA for DTI and DoE.• Building and Civil Engineering EDCs (1978) How flexible is construction? A study of
resources and participants in the construction process. London HMSO. • Business Strategies (1998) Impact of a VAT Reduction to 5% on the Alteration and
Renovation of Domestic Property: A Report for the Construction Federation.• Chandler (1976) The Climate of the British Isles Longman 1976• CIRIA (1996) Waste Minimisation and Recycling in Construction Project Report by
Scott Wilson CIRIA 1996• CITB (1999a) Construction Employment and Training Forecast 1999-2003 CITB Jan
1999• CITB (1999b) Trainee Numbers Survey 1998/99 CITB 1999• D&T (1996) Market Survey for Development of the BREEAM Scheme Deloitte and
Touche November 1996• Davis Langdon and Everest (ed) (1995) European Construction Task Handbook• DETR (1997). Transport Statistics Great Britain. 1997 ed . London: TSO• DETR (1995) Timber 2005 London TSO• DETR (1996) Transport Statistics report , Local road maintenance expenditure in England
and Wales 1995/96.• DETR (1998a) Housing and Construction Statistics 1987-1997 , London: TSO.• DETR (1998b) Digest of Environmental Statistics . No.20 1998. London: TSO.• DETR (1998c) English House Condition Survey 1996 . London: TSO.• DETR (1998d). National Road Maintenance Condition Survey Statistics Bulletin . TSO
Publications.• DETR (1998e) Non-Domestic Building Energy Fact File. Global Atmospheres Div BRE .• DoE (1991) Occurrence and Utilisation of Mineral and Construction Wastes. Geological
and Minerals Planning Research Programme London :HMSO• DoE (1995) Commercial and Industrial Floorspace Statistics 1995, England and Wales .
London: HMSO.• DoE (1996) Urbanisation in England – Projections 1991-2016 HMSO• DoE (1997) Housing and Construction Statistics 1985-1995 GREAT BRITAIN . TSO.• dti (1997) Digest of United Kingdom Energy Statistics 1997 . TSO.• EA series (1997) Water Pollution Incidents in Englans & Wales Environment Agency
series 1997• EC (1992) Demolition and Construction Debris – questionnaire EC Priority Wastestream
European Demolition Association 1992• EC (1993) Building and Demolition Waste Information ARCUS EC Report 1993• ENDS (1993) Contribution of Landfill gas to UK Production of Methane Ends Report
217,7 1993• Euroconstruct (1993) Conference Papers Munich December.• Euroconstruct (1994) Conference Papers Lillehammer June.• FoE (1995) Out of the Woods Friends of the Earth 1995• HESA (1996/97a) Ref.Vol. FIRST DESTINATIONS of Students Leaving Higher
Education Institutions.

SUSTAINABLE CONSTRUCTION DATA BRE Client Report number CR 258/99
42
• HESA (1996/97b) Ref.Vol. STUDENTS in Higher Education Institutions • Hillebrandt PM, Cannon J and Lansley P (1995) The Construction Company In and
Out of Recession , London: Macmillan.• HMSO (1993) Externalities from Landfill CSERGE, Warren Spring & EFTEL HMSO
1993• Howard, N (1998) Ecopoints – A Consensus for Building. BRE.• HSE (1996) Injuries in the Construction Industry HSE Labour Force Survey• Humphries (1991) Managing Construction and Demolition Wastes HMSO 1994• Inland Revenue (several issues) Inland Revenue Statistics London: TSO and HMSO.• JRF (1997) The Role of DIY in Maintaining Owner-Occupied Stock , Davidson M,
Redshaw J and Mooney A Joseph Rowntree Foundation.• JRF (1998). Housing Finance Review 1998/99 . Wilcox, S. Joseph Rowntree Foundation• Kukadia (1998) The Effects of Particles from Construction activity: Analysis of Data
from a Construction Site in Cardiff DETR client report BRE Nov 1998• MPG6 (1994) Guidelines for Aggregates Provision in England & Wales HMSO April
1994• NORD (1995) Nordic Guidelines on Life Cycle Assessment Nordic Council of Ministers
1995• Northern Ireland Annual Abstract of Statistics No.15• Northern Ireland Statistics and Research Agency (1987)• NS (1999) A Dirty Business New Scientist 23/1/99 p22• ONS (1997a) Social trends 27 • ONS (1997b) Regional Trends 32 • ONS (1998a) United Kingdom National Income Accounts: the Blue Book , London: TSO.• ONS (1998b) Annual Abstract of Statistics London: TSO.• QPA (1999) The Aggregates Industry and Recycling Quarry Products Association
1999• SPONS (1997) Architects and Builders Price Book 1997 E&FN Spon• Treadaway, J A (Sep.1996) Construction Cycles in the UK. BRE.• TTO (1998) Total Tropical Timber Imports 1998 Tropical Timber Organisation
unpublished dataWSA (1997) Waterfacts ’97 Water Services Assoc.

BRE is one of the world’s leading centres for research andadvice into:- construction quality and production- the environmental impact of construction- building performance – structures, materials and systems- the prevention and control of fire
BRE has some 350 professional research and consulting staffat three locations:
the main site at:BRE, Garston, Watford WD2 7JR[t] 01923 664309 [f] 01923 664010[e] [email protected]
the unique test facility at:BRE Cardington, No 2 Hangar, ShortstownBedford MK42 0TF[t] 01234 741271 [f] 01234 741213
and in Scotland:BRE East Kilbride, Kelvin Road, East KilbrideGlasgow G75 0RZ[t] 01355 576200 [f] 01355 576210
BRE is on the internet at www.bre.co.uk