Embed Size (px)
Citation preview

The dash for cash: Observations on the fixed income market ecosystem during COVID-19
Vanguard Research July 2021
Samantha Choa, CFA; Brad Collins, CFA; Jeffrey A. Johnson, CFA; Brian P. Murphy, Esq.; and Joshua Zalasky, Esq.
■ The COVID-19 pandemic and resulting global public health crisis was an exogenous shock to the real economy as government interventions to contain the spread of the virus halted economic activity. This precipitated a sharp sell-off across the capital markets, including the $114.2 trillion global fixed income market.1 Starting in February 2020, global market participants prepared for the looming public health crisis and corresponding economic uncertainty by rushing to bolster their liquidity positions in a “dash for cash.”
■ Broad divestment of debt securities into cash overwhelmed traditional channels, leading to price dislocations and a broad breakdown in dealer intermediation across fixed income sectors. U.S. Treasury security markets, long hailed as a traditional safe haven during times of market stress, experienced notable pressures.
■ Markets began to normalize after central banks and policymakers intervened to provide fiscal and monetary support. Enhancements to the market structure for U.S. Treasury securities may reduce the likelihood that future intervention will be required.
1 Source: Bank for International Settlements, Summary of Debt Securities Outstanding (June 2020), https://stats.bis.org/statx/srs/table/c1. Comparing the number of fixed income securities per issuer against the number of equity securities highlights the relative complexity of the former: the broad-based Bloomberg Barclays U.S. Corporate Bond Index holds over 6,700 unique fixed income securities across over 800 unique issuers with a median of approximately 5 securities per issuer. In contrast, the CRSP US Total Market Index has 3,617 equity securities and only 1 security per issuer (its common stock). Source: Vanguard analysis, using Bloomberg data (Feb. 22, 2021).

2
Executive summary
This paper highlights developments in the intricacies of fixed income markets, both before and during the liquidity event precipitated by the COVID-19 pandemic and accompanying economic shock to global financial markets. This liquidity event began with the broad divestment of debt securities into cash in volumes that overwhelmed traditional channels, much like how the evacuation of coastal residents ahead of an impending storm quickly bottlenecks existing infrastructure and causes gridlock. Price dislocations and a breakdown in dealer intermediation, which is responsible for facilitating trades between buyers and sellers of securities, were broadly felt across fixed income sectors. This was especially notable in the U.S. Treasury security markets, challenging the traditional role of such securities as a safe-haven asset during market stress events. This breakdown soon reverberated through other fixed income markets in the U.S. and Europe, including the commercial paper and corporate bond markets, as well as U.S. markets for variable-rate demand notes, mortgage-backed securities, and municipal bonds.
The breakdown of dealer intermediation was likely influenced by multiple factors, including the magnitude of selling pressure in certain asset classes, dealers’ willingness or ability to warehouse assets, the general growth in size and complexity of the global fixed income markets, and the evolution of fixed income market structure over time. This evolution may have resulted in part from changes in bank regulations, dealer business models, and electronic trading platforms. In addition, dealers were unwilling or unable to intermediate in certain markets because of several potential factors, including balance sheet constraints, changes in their risk appetites, and defensive posturing in light of the speed and unprecedented nature of the crisis.
Swift and comprehensive intervention by central banks and policymakers helped restore normal market functioning, with central banks acting as a key liquidity provider and market-maker of last resort. To reduce the likelihood of future intervention, policymakers should enhance the market structure for U.S. Treasury securities, which play a critical role in the global economy, global fixed income
2 The significance and scale of U.S. Treasury securities have grown over the past decade, increasing 137% in aggregate to $21.0 trillion. Source: SIFMA, U.S. Treasury Securities Outstanding (December 2020), https://www.sifma.org/wp-content/uploads/2017/06/ta-us-treasury-sifma.xls. Similarly, gross annual issuance of U.K. gilts has increased from £58.5 billion in 2007–2008 to £98.6 billion in 2018–2019, with an annual average of £142.7 billion during that time. Source: United Kingdom Debt Management Office, Annual Gross and Net Issuance Report, https://www.dmo.gov.uk/data/gilt-market/gross-and-net-issuance-data/. Euro area central bank government bonds outstanding have also increased by 46% over the past decade, to €8.7 trillion (year-end 2010 versus December 2020). Source: European Central Bank, Debt securities – Outstanding amounts (accessed February 2021), https://www.ecb.europa.eu/stats/financial_markets_and_interest_rates/securities_issues/debt_securities/html/index.en.html.
markets, and U.S. monetary policy. These enhancements should ensure that policymakers have the data necessary to properly surveil the U.S. Treasury market, facilitate market functioning under stress, and inform future regulatory actions. In addition, policymakers should consider reforms designed to foster continuous market-making and improved transparency across market participants, such as all-to-all trading. Finally, policymakers should look for opportunities to enhance countercyclicality in regulations and rulebooks for dealers and central counterparty clearinghouses and consider whether providing more clarity on potential monetary or regulatory actions during market stress events would reduce uncertainty and improve market functioning.
The liquidity event
The dash for cash began when global market participants began seeking the safety of government securities as early as February 2020, causing 10-year government bond yields to fall in tandem with equity markets (Figure 1). This trend accelerated in early March 2020, as broader government lockdown measures precipitated sudden spikes in volatility and a sharp escalation of selling pressure as investors began liquidating assets to raise cash. The initial liquidation of risk assets, such as corporate bonds and commercial paper, quickly expanded to include safe-haven assets such as U.S. Treasury securities, resulting in the breakdown of the historical relationship between risk assets and risk-free assets: Long-term U.S. and European government bond yields began to rise rapidly, while equities continued to tumble. Most notably, this pressure produced cracks in the U.S. Treasury security market, one of the world’s deepest and most liquid asset classes, and one that is foundational to the efficient operation of capital markets.2
The speed and magnitude of this dislocation, as illustrated by Figures 2a and 2b, was reflected by the absolute increase in bid-ask spreads for U.S. Treasuries, the divergence in the spread relationship between on-the-run and off-the-run U.S. Treasuries, and an increase in the basis between prices of U.S. Treasury bonds and U.S. Treasury futures. These signals pointed to an increasingly distressed U.S. Treasury market.

3
Figure 1. Government bond yields fell along with equity markets as global capital sought safe haven assets
Yie
ld (
no
rmal
ized
)
1.2%
Jan. 1,2020
1.0
0.8
0.6
0.4
0.2
0
–0.2
10-year U.K. gilt10-year U.S. Treasury note10-year German bund
Jan. 21,2020
Feb. 10,2020
Mar. 1,2020
Mar. 21,2020
Apr. 10,2020
Apr. 30,2020
Source: Bloomberg.
Bid
-ask
(b
asis
po
ints
)
5
Feb. 3,2020
4
3
2
1
0Mar. 16,
2020Apr. 27,2020
0
50
100
150
200%
Imp
lied
vo
lati
lity
On-the-run Treasuries (LHS)Off-the-run Treasuries (LHS)MOVE Index (RHS)
Bas
is
$0.5
Feb. 3,2020
0.3
0.1
–0.1
–0.3Mar. 16,
2020Apr. 27,2020
0
Figure 2. Bid-ask spreads for 10-year Treasury note and MOVE Index
Source: Bloomberg.
a. The rise in the Merrill Lynch Option Volatility Estimate (MOVE) Index persisted alongside the widening bid-ask spreads of off-the-run Treasuries as market participants sought the safety of U.S. Treasury securities.
b. The spread between U.S. Treasury securities and respective futures contracts, known as the cash-futures basis, widened, signaling market dislocation.

4
The stress was not limited to U.S. Treasuries, as market conditions created anomalies and dislocations between market prices and fundamentals across fixed income sectors. The market for U.S. repurchase agreements (repos), which are primarily collateralized by U.S. Treasuries and agency bonds and facilitate short-term financing for several types of market participants through bank intermediation, also experienced stress as investors sought to increase their cash positions. On March 17, 2020, the spread between the Secured Overnight Financing Rate (SOFR), a broad measure that captures repo transaction rates, and the federal funds rate sharply diverged, to 29 basis points from an average spread of less than 1 basis point. This divergence occurred as daily repo transaction volume continued to increase, reaching a peak of $1.36 trillion on March 18, and functioned as a warning signal for the looming fixed income market turbulence in the U.S. and Europe.3 Evidence of broad market stress included challenges in the short-term funding markets, corporate credit curve inversion, widening of credit spreads, and divergence in the relationship between cash bonds and derivatives.
3 The two-month average spread differential between the SOFR and the federal funds rate leading up to March 2020 was 0.1 basis point. During March, the average spread differential increased to 1.6 basis points (15 times the average spread over two months prior), peaking to 29 basis points on March 17. Source: Vanguard analysis, using Bloomberg and Federal Reserve Bank of New York (FRBNY) data.
4 Annette Vissing-Jorgensen, The Treasury Market in Spring 2020 and the Response of the Federal Reserve (July 28, 2021), p. 3, http://faculty.haas.berkeley.edu/vissing/vissing_jorgensen_bonds2020.pdf.
5 Exchanges began raising margin requirements in early March 2020, with maintenance margin at some exchanges more than tripling to levels not seen since 2010. This had the dual effect of incentivizing leveraged entities to close long U.S. Treasury positions, which placed downward pressure on U.S. Treasury prices, while simultaneously forcing others to raise cash to meet margin calls, potentially by liquidating U.S. Treasuries. Source: Investment Company Institute, The Impact of COVID-19 on Economies and Financial Markets (October 2020), p. 26, pp. 28–29, https://www.ici.org/pdf/20_rpt_covid1.pdf (hereinafter, the ICI Report). However, this conclusion is caveated by other research that noted a lack of comprehensive data on hedge funds’ U.S. Treasury cash and derivatives positions. Source: Board of Governors of the Federal Reserve System, Financial Stability Report (November 2020), pp. 34–35, https://www.federalreserve.gov/publications/files/financial-stability-report-20201109.pdf (hereinafter, the Financial Stability Report).
6 Source: ICI Report (see footnote 5), p. 26.
The liquidity event was exacerbated by simultaneous selling by a broad range of market participants across asset classes in both the U.S. and European capital markets. The convergence of these sellers exposed the fixed income ecosystem’s reliance on dealers to provide a key source of liquidity. The surge in transaction volume for government securities caused dealer balance sheets to swell (Figure 3) causing many dealers to retreat from their market-making activities in other fixed income market segments. This eventually led to a broad breakdown of dealer intermediation.
Non-U.S. market participants represented the largest category of sellers, divesting approximately $287 billion in U.S. Treasury securities during the first quarter of 2020.4 Soaring margin requirements on U.S. Treasury futures and the forced unwinding of leveraged positions by hedge funds, estimated in excess of $100 billion, also contributed to the selling pressure in the U.S. Treasury market.5 Similarly, the forced unwinding of leveraged positions by mortgage real estate investment trusts may have contributed to selling pressure in U.S. agency mortgage-backed securities (MBS), another highly liquid asset class.6
Figure 3. Dealer balance sheets became bloated with U.S. Treasury and mortgage-backed securities as global market participants sought cash and leveraged non-bank financial institutions unwound leveraged positions
Sources: Federal Reserve Bank of New York and Bloomberg.
Net
po
siti
on
(b
illio
ns)
$400
Feb. 5,2020
300
200
100
0
Treasury notes
Treasury bonds
Mortgage-backed securities
Feb. 19,2020
Mar. 4,2020
Mar. 18,2020
Apr. 1,2020
Apr. 15,2020
Apr. 29,2020
Treasury bills

5
Liquidity breakdowns in the commercial paper market
The lack of a robust secondary market for commercial paper (CP) significantly impacted liquidity for this sector. The liquidity breakdown for CP is best illustrated by comparison to the relatively stable experience of variable-rate demand note (VRDN) markets in the U.S. Both instruments provide an important source of high-quality, short-term liquidity, but each operates within markedly different secondary markets: banks are required to buy back VRDNs through the exercise of a contractual put option, whereas no such obligation exists for CP. As described further below, this key difference may explain why banks reserved balance sheet capacity for VRDNs and other revolving credit lines but not for CP.
Commercial paper is an important source of short-term (less than 270 days) cash-equivalent funding for businesses and is used to finance payrolls, inventories, and other daily operational needs. Banks facilitate CP market trading by acting as an issuer, underwriter, and distributor of CP. They also act as the provider of secondary market liquidity by voluntarily purchasing CP back from investors upon request (provided the dealer was involved in the original issuance). However, the overwhelming demand for liquidity exposed a key weakness in the CP market structure: its reliance on specific banks to voluntarily provide secondary market liquidity. Evidence of spillover pressure from the government security market became apparent when the U.S. CP 90-day yield sharply increased to 1.92% on March 25 from an average of 1.68% in January and February, while the U.S. CP overnight yield decreased to 0.10% from an average of 1.56% (Figure 4), indicating that market participants were differentiating liquidity premium levels across the CP market. In European markets, the 3-month LIBOR yield, considered a proxy indicator for CP markets, showed stress as well (Figure 5). In mid-March, the U.S. and European CP markets froze as banks were unable or unwilling to bid on the CP they issued and/or distributed to investors.
This presented a problem for investors that relied on CP to provide short-term liquidity, such as certain money market funds (MMFs). U.S. institutional prime money market funds were forced to liquidate CP to meet redemption pressures after investors broadly abandoned prime funds
7 Despite representing only 28% of all institutional prime money market fund assets, bank-affiliated MMFs accounted for 56% of outflows during March. Source: Baklanova, Kuznits & Tatum, Prime MMFs at the Onset of the Pandemic: Asset Flows Liquidity Buffers, and NAVs (April 15, 2021), p. 2; https://www.sec.gov/files/prime-mmfs-at-onset-of-pandemic.pdf.
8 Source: Investment Company Institute, Experiences of US Money Market Funds During the COVID-19 Crisis (November 2020), p. 21, https://www.ici.org/pdf/20_rpt_covid3.pdf (finding that dealer CP inventories increased from $6.9B on March 18, 2020, when the MMLF was established, to $21.9B on March 25, 2020).
9 Source: European Central Bank, Financial Stability Review (May 2020), at 87, https://www.ecb.europa.eu/pub/pdf/fsr/ecb.fsr202005~1b75555f66.en.pdf (finding that some banks responded with “aggressive pricing” in an attempt to discourage requests for CP buybacks, and some denied the requests altogether absent a contractual obligation).
in favor of safer government money market funds.7 U.S. dealer purchases of CP remained depressed until the U.S. Federal Reserve provided relief to dealer balance sheets through the Money Market Mutual Fund Liquidity Facility (MMLF).8 Similar challenges were observed in Europe as nongovernment MMFs, which also invest in CP, similarly experienced meaningful outflows.9
Figure 4. Broad divestment of CP by market participants led to a spike in both dealer inventory and yields
Sources: Federal Reserve Bank of New York and Bloomberg.
Net
po
siti
on
(b
illio
ns)
$30
Feb. 5,2020
25
20
15
10
0Mar. 18,
2020Apr. 29,
2020
0
1
2%
Yie
ld
5Net position (LHS)
90-day commercial paper yield (RHS)
Overnight rate (RHS)
Figure 5. The 3-month LIBOR yield, considered a proxy indicator for European CP markets, showed stress
Source: Bloomberg.
Yie
ld
1.0%
Feb. 3,2020
0.8
0.6
0.4
–1.0
3-month LIBOR yield (GBP)
Mar. 2,2020
Mar. 30,2020
Apr. 27,2020
0.2
0
–0.2
–0.4
–0.6
–0.8
3-month LIBOR yield (EUR)

6
VRDNs had a markedly different experience. Banks act as liquidity providers for VRDNs pursuant to contractual obligations that effectively reserve bank balance sheet capacity for the provision of secondary market liquidity for the VRDN at the holder’s request upon one to seven days’ notice and support stable market pricing for these instruments. Many institutional investors sold their VRDNs back to banks during the liquidity event, causing U.S. primary dealer VDRN inventory to increase over 500% from earlier in the year.10 This caused 7-day SIFMA yields, which represent the cost of short-term debt for municipalities, to sharply increase (Figure 6). However, rates quickly normalized following policymaker support, unlike in the CP market, where rates remained elevated.
Pullback from risk assets
Pressure from the high volume of selling, coupled with growing bank balance sheets, may have caused U.S. dealers to pull back from other fixed income market sectors—especially risk assets such as corporates and municipals—to reserve capacity required by regulatory leverage and risk-based capital buffers. The breakdown in secondary market liquidity was felt most acutely at the front end of the yield curve, reflecting both the near-term uncertainty of the economic implications of the pandemic and increased borrowing costs for corporations.
10 Sources: ICI Report (see footnote 5), p. 40, and Vanguard analysis, using FRBNY data, https://www.newyorkfed.org/markets/counterparties/primary-dealers-statistics. Calculations are based on comparisons with average net dealer positions during January and February 2020.
11 Sources: Vanguard analysis, using Bloomberg data. The yield spread between euro long and short corporate bonds decreased to 27 basis points on March 13, 2020, from an average of 48 basis points in February, remaining below that level through Q3 2020. Similarly, the yield spread between sterling long and short corporate bonds began to decrease in mid-March, reaching a low point of 6 basis points on April 8 from an average of 61 basis points in February and remained below the February average until the end of Q3 2020.
On March 20, 2020, the yield curve measuring the spread between 3-year and 10-year A-rated and BBB-rated U.S. corporate bonds sharply inverted from normal levels of 50–60 basis points to negative 37 basis points, reflecting the stress on short-term financing rather than greater near-term risk for securities with similar credit characteristics (Figure 7). Although European corporate bond market curves did not invert to negative levels, stress was observable in the euro and sterling corporate bond markets, and recovery to normal levels was more protracted than the swift recovery in the U.S. (Figure 8).11
Figure 6. Dealer inventory of municipal securities spiked along with yields of tax-exempt VRDNs, as measured by the SIFMA Index
Notes: The Securities Industry and Financial Markets Association Municipal Swap Index is a 7-day high-grade market index composed of tax-exempt Variable Rate Demand Obligations (VRDOs) with certain characteristics. The index is calculated and published by Bloomberg. Sources: Federal Reserve Bank of New York and Bloomberg.
Net
po
siti
on
(b
illio
ns)
$20
Feb. 5,2020
15
10
0Mar. 18,
2020Apr. 29,
2020
0
1
6%
Yie
ld
5
Net position (LHS)
SIFMA Index (RHS)
5
4
3
2
Figure 7. Option-adjusted spread curves measuring the credit term premium between longer-dated and shorter-dated investment-grade U.S. corporate bonds sharply inverted from normal levels
Source: Bloomberg.
OA
S (
bas
is p
oin
ts)
80
Feb. 3,2020
60
40
0
Mar. 14,2020
Apr. 23,2020
20
–20
–60
–40
OAS between 3-year and 5-year
OAS between 5-year and 10-year
OAS between 3-year and 10-year
U.S. investment-grade corporate bonds
Figure 8. Option-adjusted spread curves measuring the credit term premium between longer-dated and shorter-dated euro and sterling investment-grade corporate bonds sharply compressed from normal levels
OA
S (
bas
is p
oin
ts)
Feb. 3,2020
80
60
40
0
OAS between 3-year and 10-year sterling investment-grade corporate bonds
Mar. 2,2020
Mar. 30,2020
Apr. 27,2020
20
OAS between 3-year and 10-year euro investment-grade corporate bonds
Source: Bloomberg.
7
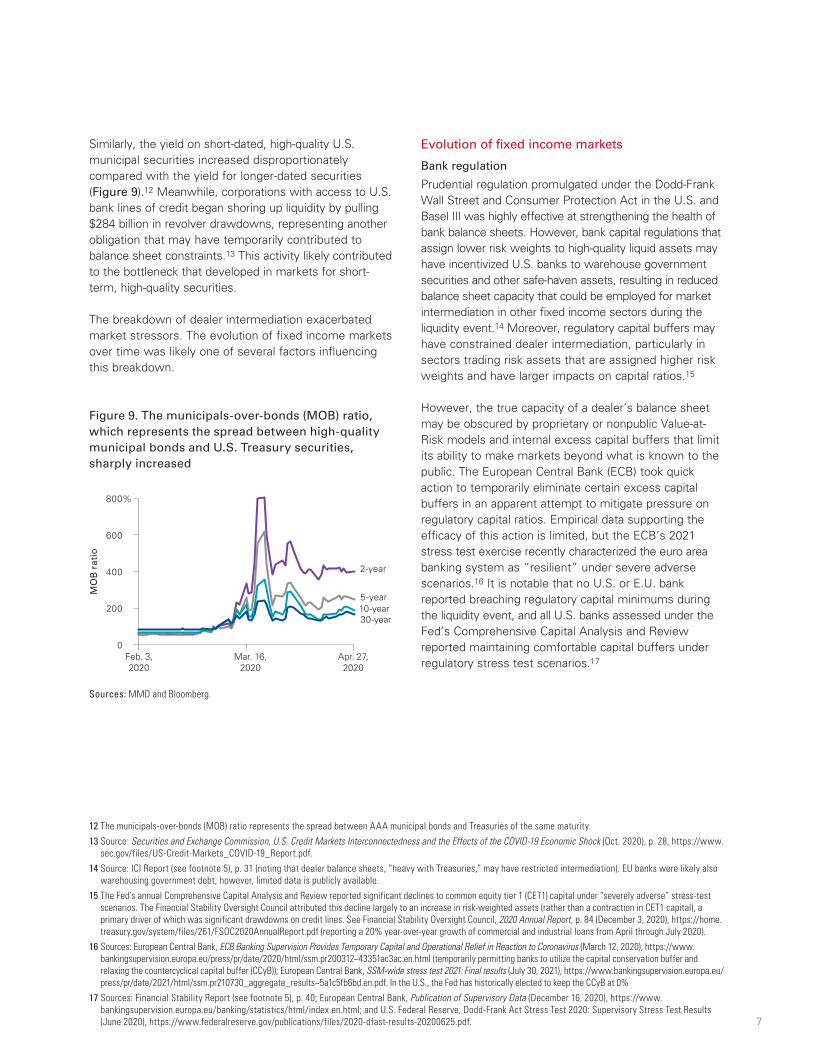
Similarly, the yield on short-dated, high-quality U.S. municipal securities increased disproportionately compared with the yield for longer-dated securities (Figure 9).12 Meanwhile, corporations with access to U.S. bank lines of credit began shoring up liquidity by pulling $284 billion in revolver drawdowns, representing another obligation that may have temporarily contributed to balance sheet constraints.13 This activity likely contributed to the bottleneck that developed in markets for short-term, high-quality securities.
The breakdown of dealer intermediation exacerbated market stressors. The evolution of fixed income markets over time was likely one of several factors influencing this breakdown.
12 The municipals-over-bonds (MOB) ratio represents the spread between AAA municipal bonds and Treasuries of the same maturity.
13 Source: Securities and Exchange Commission, U.S. Credit Markets Interconnectedness and the Effects of the COVID-19 Economic Shock (Oct. 2020), p. 28, https://www.sec.gov/files/US-Credit-Markets_COVID-19_Report.pdf.
14 Source: ICI Report (see footnote 5), p. 31 (noting that dealer balance sheets, “heavy with Treasuries,” may have restricted intermediation). EU banks were likely also warehousing government debt; however, limited data is publicly available.
15 The Fed’s annual Comprehensive Capital Analysis and Review reported significant declines to common equity tier 1 (CET1) capital under “severely adverse” stress-test scenarios. The Financial Stability Oversight Council attributed this decline largely to an increase in risk-weighted assets (rather than a contraction in CET1 capital), a primary driver of which was significant drawdowns on credit lines. See Financial Stability Oversight Council, 2020 Annual Report, p. 84 (December 3, 2020), https://home.treasury.gov/system/files/261/FSOC2020AnnualReport.pdf (reporting a 20% year-over-year growth of commercial and industrial loans from April through July 2020).
16 Sources: European Central Bank, ECB Banking Supervision Provides Temporary Capital and Operational Relief in Reaction to Coronavirus (March 12, 2020), https://www.bankingsupervision.europa.eu/press/pr/date/2020/html/ssm.pr200312~43351ac3ac.en.html (temporarily permitting banks to utilize the capital conservation buffer and relaxing the countercyclical capital buffer (CCyB)); European Central Bank, SSM-wide stress test 2021: Final results (July 30, 2021), https://www.bankingsupervision.europa.eu/press/pr/date/2021/html/ssm.pr210730_aggregate_results~5a1c5fb6bd.en.pdf. In the U.S., the Fed has historically elected to keep the CCyB at 0%
17 Sources: Financial Stability Report (see footnote 5), p. 40; European Central Bank, Publication of Supervisory Data (December 16, 2020), https://www.bankingsupervision.europa.eu/banking/statistics/html/index.en.html; and U.S. Federal Reserve, Dodd-Frank Act Stress Test 2020: Supervisory Stress Test Results (June 2020), https://www.federalreserve.gov/publications/files/2020-dfast-results-20200625.pdf.
Evolution of fixed income markets
Bank regulation
Prudential regulation promulgated under the Dodd-Frank Wall Street and Consumer Protection Act in the U.S. and Basel III was highly effective at strengthening the health of bank balance sheets. However, bank capital regulations that assign lower risk weights to high-quality liquid assets may have incentivized U.S. banks to warehouse government securities and other safe-haven assets, resulting in reduced balance sheet capacity that could be employed for market intermediation in other fixed income sectors during the liquidity event.14 Moreover, regulatory capital buffers may have constrained dealer intermediation, particularly in sectors trading risk assets that are assigned higher risk weights and have larger impacts on capital ratios.15
However, the true capacity of a dealer’s balance sheet may be obscured by proprietary or nonpublic Value-at-Risk models and internal excess capital buffers that limit its ability to make markets beyond what is known to the public. The European Central Bank (ECB) took quick action to temporarily eliminate certain excess capital buffers in an apparent attempt to mitigate pressure on regulatory capital ratios. Empirical data supporting the efficacy of this action is limited, but the ECB’s 2021 stress test exercise recently characterized the euro area banking system as “resilient” under severe adverse scenarios.16 It is notable that no U.S. or E.U. bank reported breaching regulatory capital minimums during the liquidity event, and all U.S. banks assessed under the Fed’s Comprehensive Capital Analysis and Review reported maintaining comfortable capital buffers under regulatory stress test scenarios.17
Figure 9. The municipals-over-bonds (MOB) ratio, which represents the spread between high-quality municipal bonds and U.S. Treasury securities, sharply increased
Sources: MMD and Bloomberg.
MO
B r
atio
800%
Feb. 3,2020
600
400
200
0Mar. 16,
2020Apr. 27,2020
2-year
5-year10-year30-year

8
The clearest link to limited balance sheet capacity, based on available public data, are leverage ratios, which are risk-insensitive and designed to protect against excessive leverage.18 The Fed’s open-market operations rely heavily on primary dealers to act as trading counterparties and make markets. This may have contributed to U.S. banks’ devoting outsized balance sheet capacity to U.S. Treasuries, further diminishing the capacity of U.S. dealers to intermediate during the liquidity event.
To address the limitations placed on bank balance sheets, the Fed issued interim relief to reduce pressure on leverage ratios and support U.S. Treasury intermediation by excluding deposits with foreign central banks and Treasury securities and reserves at the Fed from the leverage ratio denominator.19 Together, these reforms were projected to
18 In addition to a 4% tier 1 leverage ratio, U.S. bank holding companies are subject to a 3% supplementary leverage ratio (SLR), which measures tier 1 capital against total leverage exposure (which includes both on-balance-sheet and certain off-balance-sheet assets, such as unfunded lending commitments and standby letters of credit). Certain U.S. banks are further subject to an “enhanced” SLR buffer of 2%.
19 Sources: Regulatory Capital Rule: Revisions to the Supplementary Leverage Ratio, 85 Fed. Reg. 4569 (January 27, 2020) (revising 12 C.F.R. parts 3, 217, 324), https://www.govinfo.gov/content/pkg/FR-2020-01-27/pdf/2019-28293.pdf; and Temporary Exclusion of U.S. Treasury Securities and Deposits at Federal Reserve Banks from the Supplementary Leverage Ratio, 85 Fed. Reg. 20578–20579 (Apr. 14, 2020) (revising 12 C.F.R. part 217), https://www.govinfo.gov/content/pkg/FR-2020-04-14/pdf/2020-07345.pdf. The latter relief expired on March 31, 2021.
20 Source: Financial Stability Oversight Council (see footnote 15), p. 80.
21 European supervised institutions are subject to a voluntary 3% minimum tier 1 leverage ratio but are not subject to the enhanced SLR applicable to U.S. banks. Final Basel III requirements are expected to be implemented by January 1, 2022, and fully phased in by January 1, 2027. Source: Bank for International Settlements, Basel III Monitoring Results Published by the Basel Committee (Oct. 4, 2018), https://www.bis.org/press/p181004.htm.
provide an additional $1.6 trillion in U.S. dealer balance sheet capacity, and the modified rules appear to have relieved pressure on leverage ratios for certain U.S. banks (Figure 10).20 However, parsing out the marginal impact of each amendment will be challenging: The Fed’s first and second rounds of temporary supplemental leverage ratio relief became effective on April 1 and April 14, 2020, respectively—several weeks after the Fed enacted its liquidity support programs and markets had begun to stabilize. The ECB, in contrast, did not modify leverage regulations applicable to European-supervised institutions, but this may not have been necessary: Regulatory leverage ratios applicable to ECB-supervised institutions are less stringent than those in the U.S. and, moreover, are not technically binding, unlike in the U.S.21
Figure 10. SLR ratios at U.S. globally systemically important banks improved after interim relief excluded certain deposits and reserves
Notes: JPM: JPMorgan Chase & Co.; BAC: Bank of America Corp.; STT: State Street Corp.; WFC: Wells Fargo & Co.; C: Citigroup, Inc.; MS: Morgan Stanley; GS: Goldman Sachs Group, Inc.; BK: Bank of New York Mellon Corp.Source: Federal Financial Institutions Examination Council—FFIEC 101 report.
JPM
10%
8
6
0BAC STT WFC C MS GS
4
2
BK
Q4 2019 Q2 2020 Q2 2020 (modified) Minimum
SLR
rat
io

9
Dealer business models
Dealers play a critical role as market makers and liquidity providers in the U.S. and European capital markets. However, over the past decade, U.S. and European dealers’ role as liquidity providers within the fixed income markets has been hurt by multiple factors, such as the reduction of total dealer participation, relative profitability associated with liquidity services, and changes to bank regulations (including prohibitions on proprietary trading in the U.S.). As a result, the dealer business model in the U.S. and Europe has generally evolved from one where dealers purchased securities from, and sold securities to, investors and held them on their balance sheets, to agency trades where they merely match buyers and sellers.22 The former business model is more capital-intensive for securities with credit risk (such as corporate bonds) and less profitable for short-duration securities (such as CP), including those of the highest quality. This causes dealers to allocate capital to those opportunities that generate the largest profit, including offering diverse liquidity services for key client relationships.23
22 Source: Division of Economic and Risk Analysis, Securities and Exchange Commission, Access to Capital and Market Liquidity (August 2017), p. 20, https://www.sec.gov/files/access-to-capital-and-market-liquidity-study-dera-2017.pdf (noting that dealers have been less likely to engage in risky principal transactions and will decrease liquidity provisions in times of severe market stress, although acknowledging a lack of consensus for the cause).
23 Dealers are generally prohibited from netting multilateral uncleared transactions for bank regulatory capital and leverage purposes. Some industry commentators have proposed the creation of a central counterparty clearinghouse that would permit netting of multilateral trades. This could reduce the balance-sheet footprint of balance-sheet-intensive businesses, potentially expanding dealers’ intermediation capacity. See Liang & Parkinson, The Hutchins Center on Fiscal and Monetary Policy, Enhancing Liquidity of the U.S. Treasury Market Under Stress (December 16, 2020), https://www.brookings.edu/research/enhancing-liquidity-of-the-u-s-treasury-market-under-stress/.
24 Calculations based on year-end 2008 and Q3 2020 net dealer positions. Asset-backed securities and municipal data available starting in 2013; Q3 2020 net dealer positions as a percentage of asset class are 0.39% for asset-based securities and 0.28% for municipal securities. Source: Vanguard analysis, using FRBNY and SIFMA data, https://www.newyorkfed.org/markets/counterparties/primary-dealers-statistics and https://www.sifma.org/resources/research/fixed-income-chart/.
25 See footnote 24.
Additionally, the impact of regulatory requirements on trading profits is carefully weighed, because warehousing inventory over longer periods results in increased capital charges.
Vanguard analysis of Fed and SIFMA data indicates that U.S. dealer balance sheet composition has changed meaningfully over the past decade, with increased holdings in Treasuries and decreased holdings of corporate and agency bonds. Since 2008, U.S. dealers’ overall net dealer positions as a percentage of total U.S. government bonds outstanding have increased from 0.13% to 1.14% (Figure 11). This contrasts with net dealer positions as a percentage of U.S. corporate bonds, which decreased from 2.03% to 0.18%, and U.S. agency securities, which decreased from 2.38% to 0.67%. MBS have stayed relatively constant, increasing from 0.70% to 0.79%.24 The allocation of net dealer positions to risk assets compared with risk-free assets reflects this change, as 66.1% of total net dealer positions is allocated to U.S. government securities, while a mere 4.90% is allocated to corporate bonds, down from 42.56% in 2008.25
Figure 11. Since 2008, U.S. dealers have dramatically expanded their inventory of U.S. government securities while reducing exposure to corporate debt and U.S. agency securities
Source: Federal Financial Institutions Examination Council—FFIEC 101 report.
Net
po
siti
on
(b
illio
ns)
Dec. 31,2008
$600
500
400
0Aug. 11,
2010Mar. 21,
2012Oct. 30,
2013Jun. 10,
2015Jan. 18,
2017Apr. 8,2020
300
200
100
Aug. 29,2018
U.S. government bondsU.S. agency securitiesMunicipal bondsMortgage-backed securitiesCorporate bondsCommercial mortgage-backed securitiesAsset-backed securities

10
During the liquidity event, U.S. and European dealer behavior remained closely aligned with this new paradigm, as market participants pulled multiple liquidity levers that impacted dealer balance sheets. In the U.S., large-scale U.S. Treasury and MBS purchases, VRDN purchases, and funding credit revolver drawdowns rapidly expanded dealer balance sheets. Dealers responded to these increased market pressures by fortifying their balance sheets, exhibiting an even greater preference for agency trades, dynamically adjusting their pricing models, and significantly reducing their participation in certain markets (such as CP and corporate bonds). The retreat by dealers in less profitable short-term bond market segments resulted in a sharp increase in the liquidity premium, heightened transaction costs, and broader distress in market prices. Several of the largest U.S. banks reported above-trend trading profits in Q1 2020, and once markets stabilized, corporations that drew down their bank credit lines in Q1 2020 flooded the fixed income markets with new high-quality issuance at significant premiums through the end of Q2 2020, resulting in record bank trading profits.26
Electronic fixed income markets
U.S. Treasuries and European government bonds began trading electronically in the late 1990s; these electronic markets have evolved considerably. Changes in dealer business models have accelerated electronification through the development of interdealer and dealer-customer platforms, which include central limit order books, electronic communication networks, and request-for-quote trading protocols, as well as the emergence of new nonbank financial intermediaries in core market segments. This paradigm is especially pronounced in fixed income futures, which trade electronically for about 90% of overall trading volume, and U.S. Treasury markets, which trade electronically for about 70% of overall volume. Electronic trading for European government security bonds has grown to approximately 60% of trading volume.
26 Sources: Greenwich Associates, U.S. Capital Markets Performance During COVID: Fixed Income (2020), p. 14, https://www.greenwich.com/fixed-income/us-capital-markets-performance-during-covid-fixed-income; and Vanguard analysis, using Bloomberg data. Sample included Goldman Sachs & Co., J.P. Morgan Chase, Bank of America Corp, Citibank and Morgan Stanley.
27 Data as of 2014. Markets Committee, Bank for International Settlements, Electronic Trading in Fixed Income Markets (January 2016), p. 9, https://www.bis.org/publ/mktc07.pdf.
28 Regulation ATS for ATSs that Trade U.S. Government Securities, 85 Fed. Reg. 87,106, 87,109 (proposed December 31, 2020) (to be codified at 17 C.F.R. Parts 240, 242, 249).
29 Greenwich Associates (see footnote 26), p. 3, p. 10.
30 Yadav & Yadav, Why is the U.S. Treasury Market So Fragile? University of Oklahoma Price College of Business and Vanderbilt University Law School, Vanderbilt Law Research Paper No. 20-46 (September 9, 2020), https://papers.ssrn.com/sol3/papers.cfm?abstract_id=3685404.
U.S. and European corporate bonds have been slower to adopt electronification (largely due to greater heterogeneity), with significantly fewer trades occurring electronically.27 New entrants focused on automated trading, such as principal trading firms (PTFs), have also quickly gained U.S. Treasury market share. In the second half of 2019, PTFs traded on 13 government securities alternative trading systems (ATS) and accounted for approximately 55% of total government securities ATS trading volume and 31% of all trading volume for on-the-run Treasury securities.28
Innovations enabling greater use of automated, computer-driven trading based on algorithms has resulted in greater market efficiencies in the form of cost savings from narrower bid-ask spreads and speed of execution. In March 2020, however, algorithms that generated bid/offers on the electronic trading platforms became unreliable as market conditions moved far outside pre-set model parameters including volatility, which reflected normal market environments. As a result, intermediation temporarily migrated away from electronic trading to voice trading during March in the U.S. and Europe as trade volume spiked and market efficiency broke down. Average daily trading volume for U.S. Treasuries increased to more than $1 trillion from normal levels of approximately $500 billion; voice trading as a percentage of total market increased from 26% in January to 38% in March and 48% in April.29
Additionally, as one-sided selling pressure increased, electronic trading platforms were unable to quickly match buyers and sellers. Neither dealers nor PTFs are obligated to continuously make markets and have full autonomy to step away because of diminished margins, heightened risk, or a variety of other reasons.30 As market uncertainty increased, dealers responded by first turning off algorithmic electronic trading, then widening spreads on electronic platforms, and finally halting electronic market-making activities.

11
A path forward
The fixed income market ecosystem has evolved considerably because of many factors, including notable changes related to total bonds outstanding in the U.S. and Europe, investor bases and market participants, and monetary or regulatory policy. These factors have affected fixed income asset classes and market participants in unique ways. This evolution, combined with the multidimensional nature of liquidity and the inherently complex and interconnected nature of numerous fixed income markets, necessitates careful consideration by a broad group of fixed income market participants and policymakers to provide recommendations to improve fixed income market resiliency in the future.
As part of this process, policymakers should enhance the market structure for U.S. Treasury securities, which play a critical role in the global economy, global fixed
31 Vanguard has also called on policymakers to enhance U.S. MMF regulation by recommending the elimination of fees and gates and requiring all prime money market funds to float their net asset values. The Vanguard Group, Inc., Comment Letter on the SEC Request for Comment on Potential Money Market Fund Reform Measures in President’s Working Group Report (April 12, 2021), https://www.sec.gov/comments/s7-01-21/s70121-8662453-235301.pdf.
income markets, and U.S. monetary policy. These enhancements should ensure that policymakers have the data necessary to properly surveil the U.S. Treasury market, facilitate market functioning under stress, and inform future regulatory actions. In addition, policymakers should consider reforms designed to foster continuous market-making and improved transparency across market participants, such as all-to-all trading. Finally, policymakers should look for opportunities to enhance countercyclicality in regulations and rulebooks for dealers and central counterparty clearinghouses and consider whether providing more clarity on potential monetary or regulatory actions during market stress events would reduce uncertainty and improve market functioning.31 The U.S. Treasury market is a vital part of our global fixed income markets and must be resilient during times of market stress.

Connect with Vanguard® vanguard.com
All investing is subject to risk, including the possible loss of the money you invest. Past performance is no guarantee of future results.
Diversification does not ensure a profit or protect against a loss.
CFA® is a registered trademark owned by CFA Institute.
© 2021 The Vanguard Group, Inc. All rights reserved. Vanguard Marketing Corporation, Distributor.
ISGBML 072021