Embed Size (px)
Citation preview
The Dark Side of Monitoring MQSMF 115 and 116 Record
Reading and Interpretation
Neil Johnston ([email protected])IBM
7th February, 2013Session Number 12610
2
Session Agenda
• Introduction to SMF 115 records
• SMF 115 records in detail
• A look at SMF 116 accounting records
3
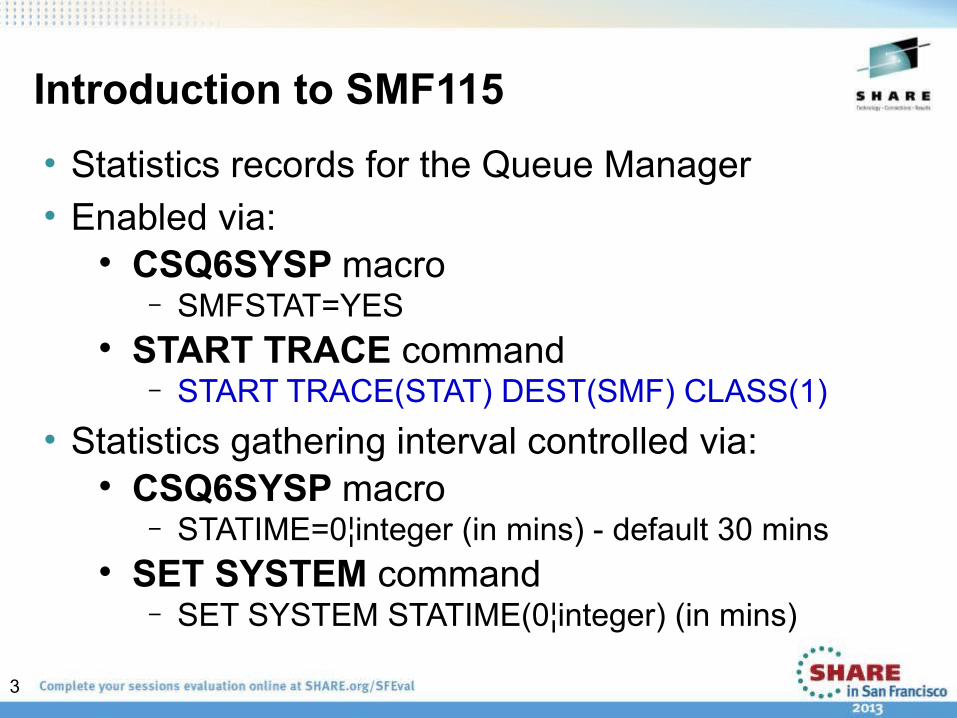
Introduction to SMF115• Statistics records for the Queue Manager• Enabled via:
CSQ6SYSP macro− SMFSTAT=YES
START TRACE command− START TRACE(STAT) DEST(SMF) CLASS(1)
• Statistics gathering interval controlled via: CSQ6SYSP macro
− STATIME=0¦integer (in mins) - default 30 mins SET SYSTEM command
− SET SYSTEM STATIME(0¦integer) (in mins)
4
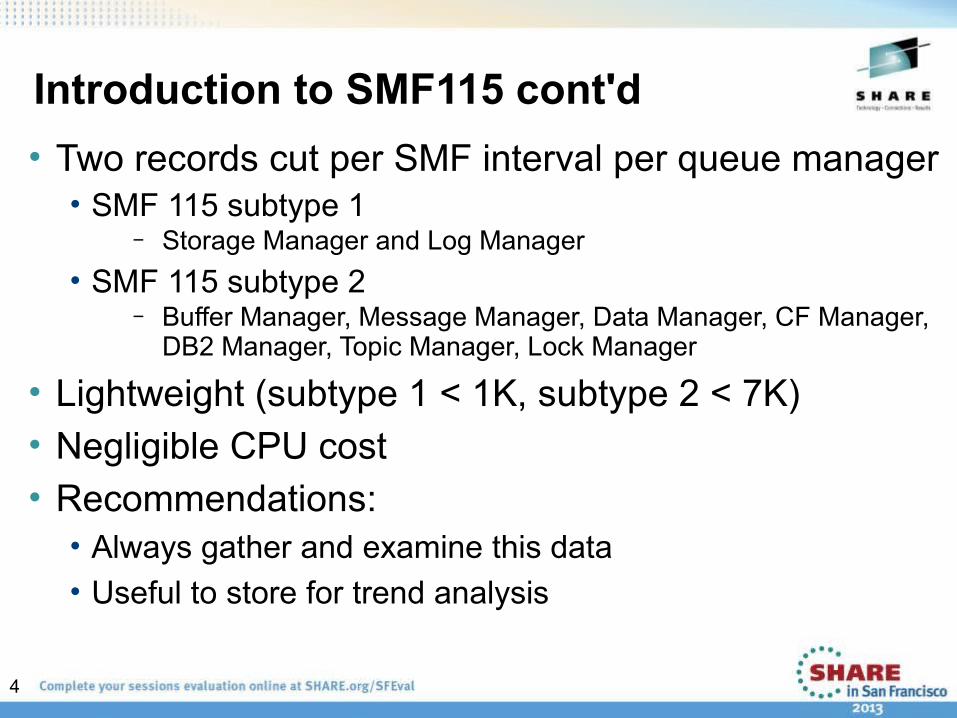
Introduction to SMF115 cont'd• Two records cut per SMF interval per queue manager• SMF 115 subtype 1
− Storage Manager and Log Manager• SMF 115 subtype 2
− Buffer Manager, Message Manager, Data Manager, CF Manager, DB2 Manager, Topic Manager, Lock Manager
• Lightweight (subtype 1 < 1K, subtype 2 < 7K)• Negligible CPU cost• Recommendations:• Always gather and examine this data• Useful to store for trend analysis
5
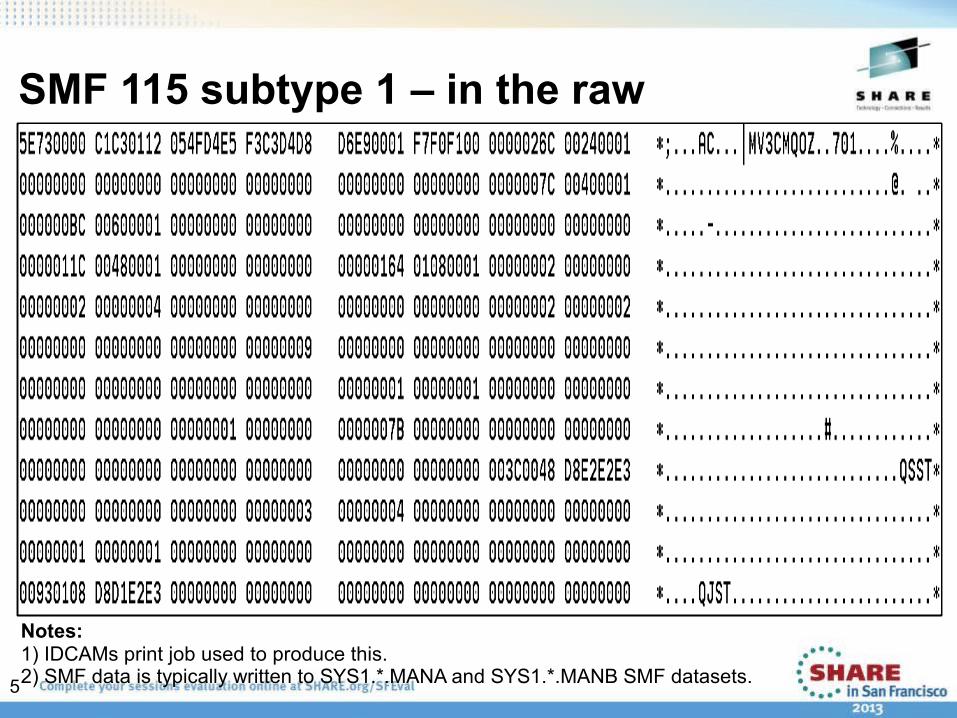
SMF 115 subtype 1 – in the raw
Notes:1) IDCAMs print job used to produce this. 2) SMF data is typically written to SYS1.*.MANA and SYS1.*.MANB SMF datasets.
6
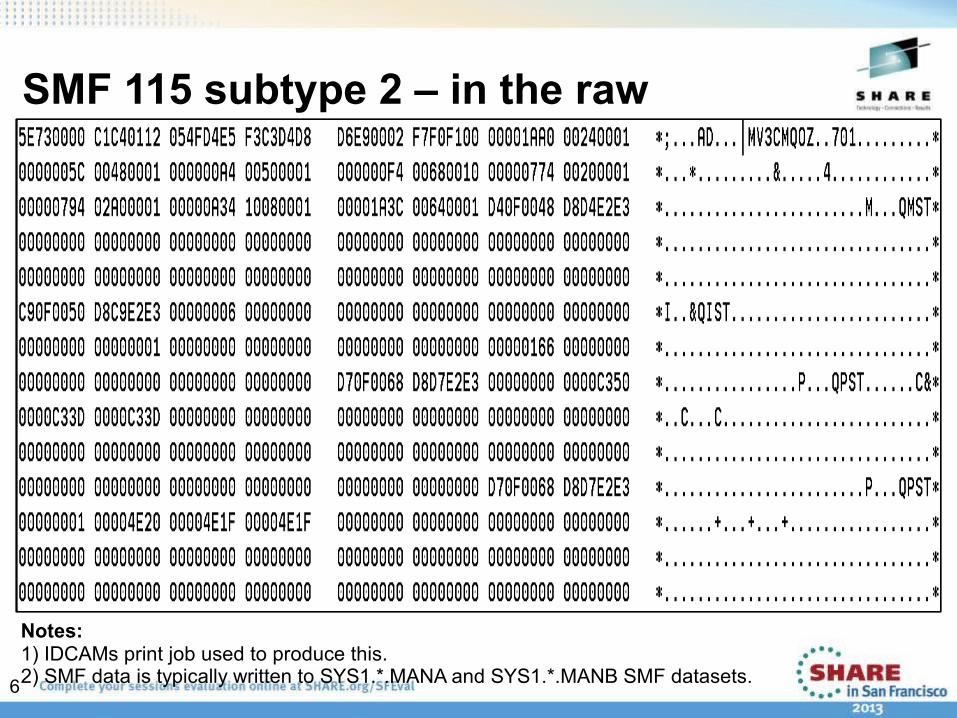
SMF 115 subtype 2 – in the raw
Notes:1) IDCAMs print job used to produce this. 2) SMF data is typically written to SYS1.*.MANA and SYS1.*.MANB SMF datasets.
7
Formatting and Understanding SMF 115 records
• Format of SMF 115 blocks Assembler macros SCSQMACS
− CSQDQSST – Storage Manager Statistics − CSQDQMST – Message Manager Statistics, etc.
C header file SCSQC370(CSQDSMFC)− Contains declarations for most statistics blocks
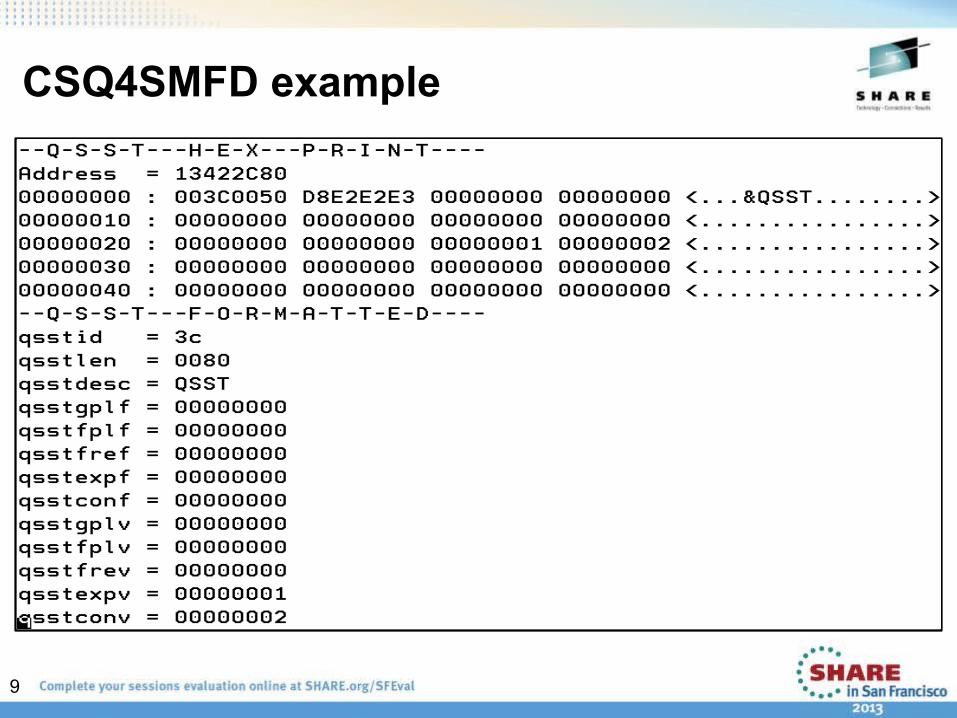
• CSQ4SMFD Sample C program shipped with base product to print SMF
115 and 116 records 'dump style' and extract major fields

8
Macros for Statistics Record FormatsResource Manager/Function Resource
Manager IDMacro Eyecarcher
DB2 5 CSQDQ5ST Q5STCoupling Facility E CSQDQEST QESTCoupling Facility (SMDS) E CSQDQESD QESDData Manager I CSQDQIST QISTLog Manager J CSQDQJST QJSTLock Manager L CSQDQLST QLSTMessage Manager M CSQDQMST QMSTBuffer Manager P CSQDQPST QPSTStorage Manager (getmain) S CSQDQSGM QSGMStorage Manager (pool header) S CSQDQSPH QSPHStorage Manager (region summary) S CSQDQSRS QSRSStorage Manager S CSQDQSST QSSTTopic Manager T CSQDQTST QTST
9
CSQ4SMFD example
10
Formatting and Understanding SMF 115 records cont'd• SupportPac MP1B – WebSphere MQ for z/OS Interpreting
Accounting and Statistics Data• Sample C programs to print SMF 115 and 116 records in a more
easily understandable manner • Documentation on how to use and interpret the information
• SupportPac MP16 – WebSphere MQ for z/OS Capacity Planning & Tuning• “The WMQ for z/OS handbook”
11
SMF 115 details
• The examples that follow show the output from program MQ1150, supplied with SupportPac MP1B
12
Storage Manager – QSST
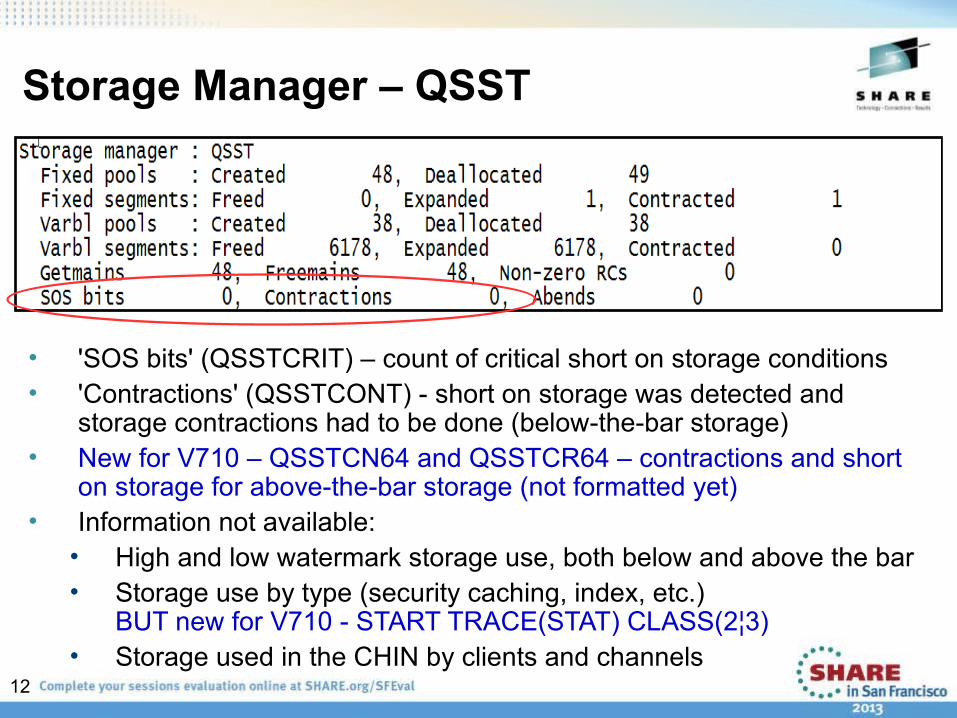
• 'SOS bits' (QSSTCRIT) – count of critical short on storage conditions• 'Contractions' (QSSTCONT) - short on storage was detected and
storage contractions had to be done (below-the-bar storage)• New for V710 – QSSTCN64 and QSSTCR64 – contractions and short
on storage for above-the-bar storage (not formatted yet)• Information not available:• High and low watermark storage use, both below and above the bar• Storage use by type (security caching, index, etc.)
BUT new for V710 - START TRACE(STAT) CLASS(2¦3) • Storage used in the CHIN by clients and channels
13
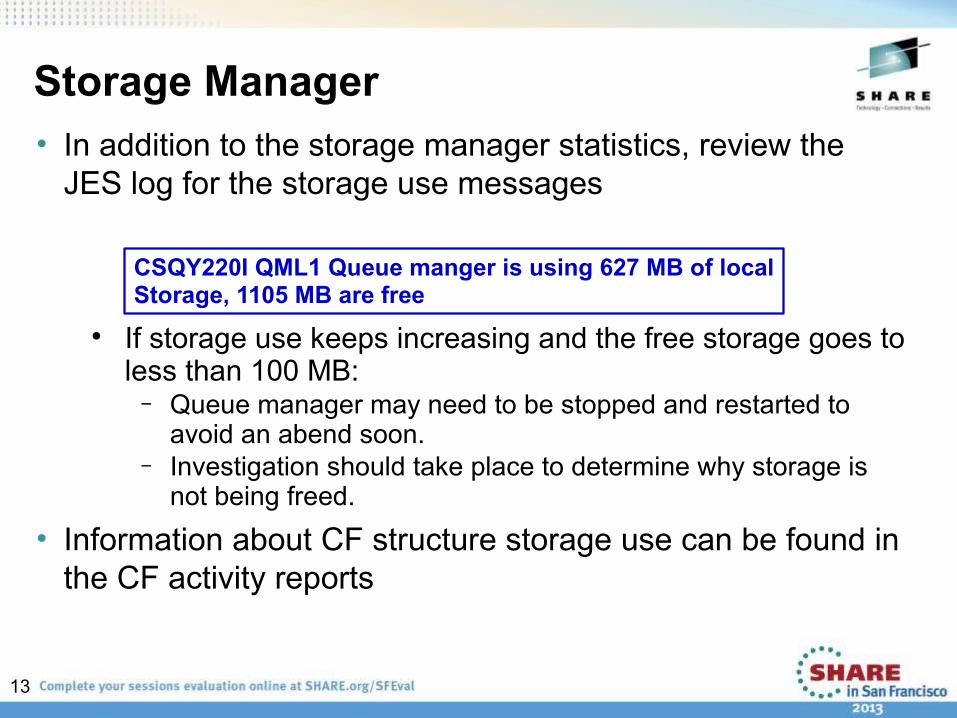
Storage Manager • In addition to the storage manager statistics, review the
JES log for the storage use messages
If storage use keeps increasing and the free storage goes to less than 100 MB:
− Queue manager may need to be stopped and restarted to avoid an abend soon.
− Investigation should take place to determine why storage is not being freed.
• Information about CF structure storage use can be found in the CF activity reports
CSQY220I QML1 Queue manger is using 627 MB of localStorage, 1105 MB are free
14
Log Manager – QJST
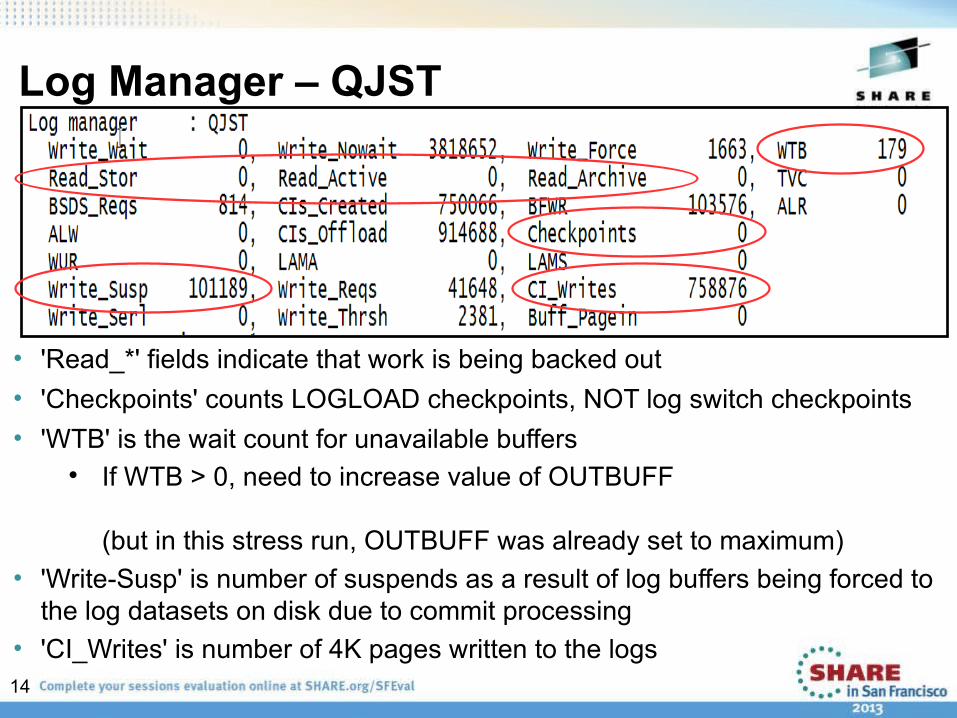
• 'Read_*' fields indicate that work is being backed out • 'Checkpoints' counts LOGLOAD checkpoints, NOT log switch checkpoints • 'WTB' is the wait count for unavailable buffers
If WTB > 0, need to increase value of OUTBUFF
(but in this stress run, OUTBUFF was already set to maximum)• 'Write-Susp' is number of suspends as a result of log buffers being forced to
the log datasets on disk due to commit processing• 'CI_Writes' is number of 4K pages written to the logs
15
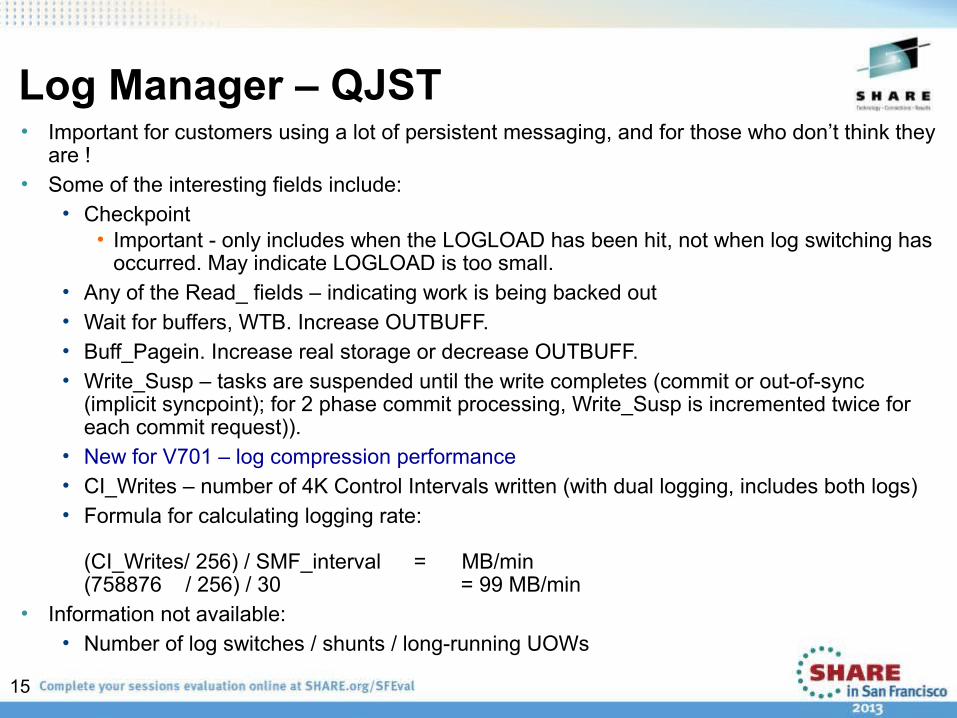
Log Manager – QJST• Important for customers using a lot of persistent messaging, and for those who don’t think they
are !• Some of the interesting fields include:
• Checkpoint• Important - only includes when the LOGLOAD has been hit, not when log switching has
occurred. May indicate LOGLOAD is too small.• Any of the Read_ fields – indicating work is being backed out• Wait for buffers, WTB. Increase OUTBUFF. • Buff_Pagein. Increase real storage or decrease OUTBUFF.• Write_Susp – tasks are suspended until the write completes (commit or out-of-sync
(implicit syncpoint); for 2 phase commit processing, Write_Susp is incremented twice for each commit request)).
• New for V701 – log compression performance• CI_Writes – number of 4K Control Intervals written (with dual logging, includes both logs)• Formula for calculating logging rate:
(CI_Writes/ 256) / SMF_interval = MB/min(758876 / 256) / 30 = 99 MB/min
• Information not available:• Number of log switches / shunts / long-running UOWs
16
Log Manager – QJST cont'd
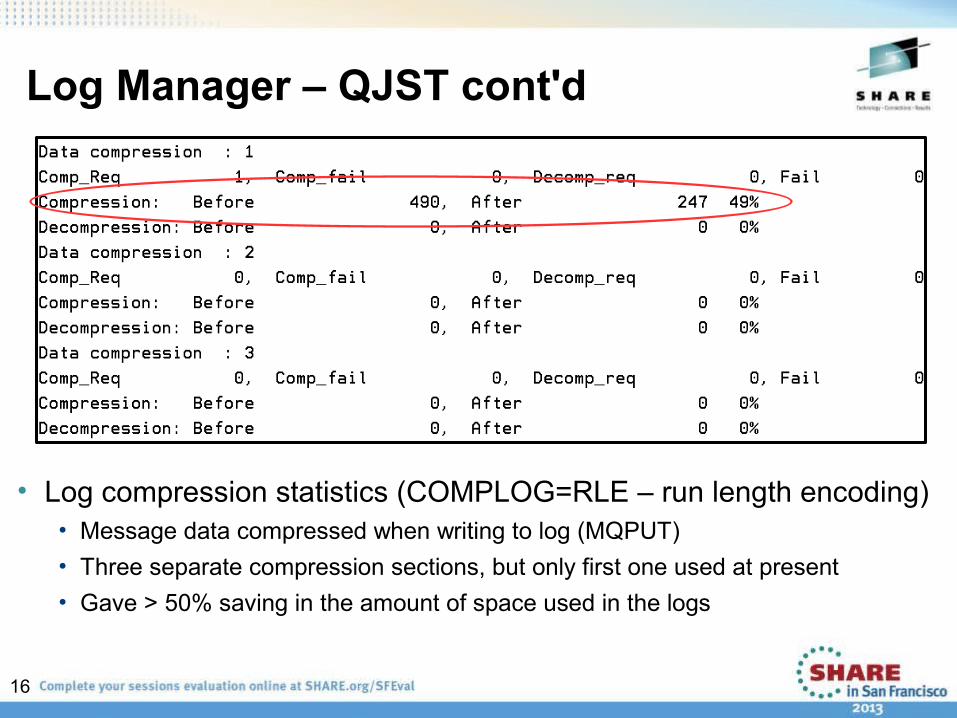
• Log compression statistics (COMPLOG=RLE – run length encoding)• Message data compressed when writing to log (MQPUT)• Three separate compression sections, but only first one used at present• Gave > 50% saving in the amount of space used in the logs
17
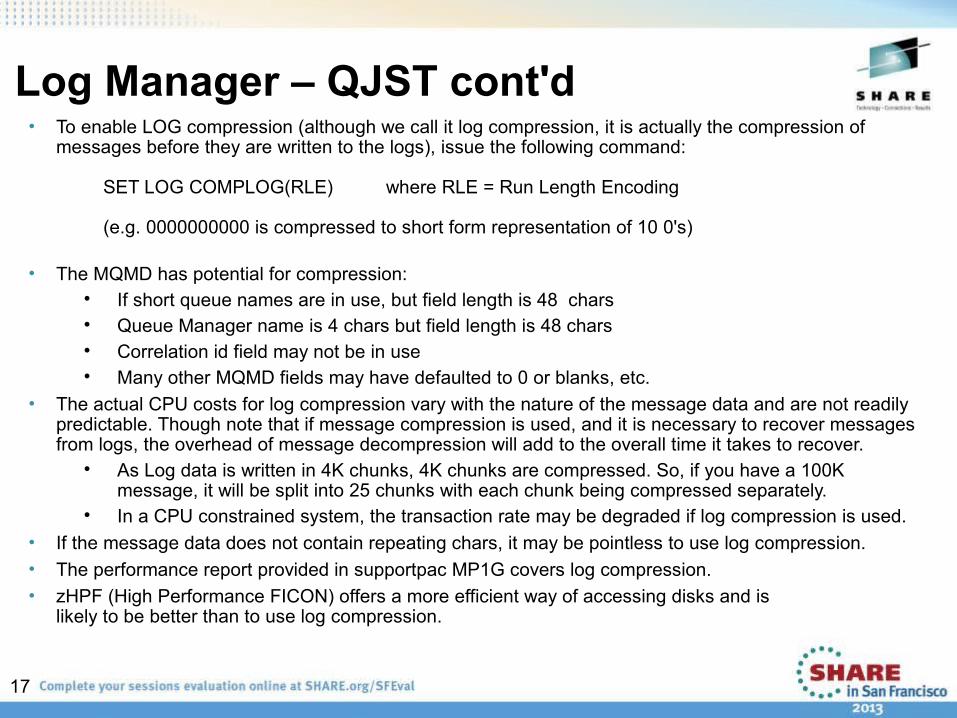
Log Manager – QJST cont'd• To enable LOG compression (although we call it log compression, it is actually the compression of
messages before they are written to the logs), issue the following command:
SET LOG COMPLOG(RLE) where RLE = Run Length Encoding
(e.g. 0000000000 is compressed to short form representation of 10 0's)
• The MQMD has potential for compression: If short queue names are in use, but field length is 48 chars Queue Manager name is 4 chars but field length is 48 chars Correlation id field may not be in use Many other MQMD fields may have defaulted to 0 or blanks, etc.
• The actual CPU costs for log compression vary with the nature of the message data and are not readily predictable. Though note that if message compression is used, and it is necessary to recover messages from logs, the overhead of message decompression will add to the overall time it takes to recover.
As Log data is written in 4K chunks, 4K chunks are compressed. So, if you have a 100K message, it will be split into 25 chunks with each chunk being compressed separately.
In a CPU constrained system, the transaction rate may be degraded if log compression is used. • If the message data does not contain repeating chars, it may be pointless to use log compression. • The performance report provided in supportpac MP1G covers log compression. • zHPF (High Performance FICON) offers a more efficient way of accessing disks and is
likely to be better than to use log compression.
18
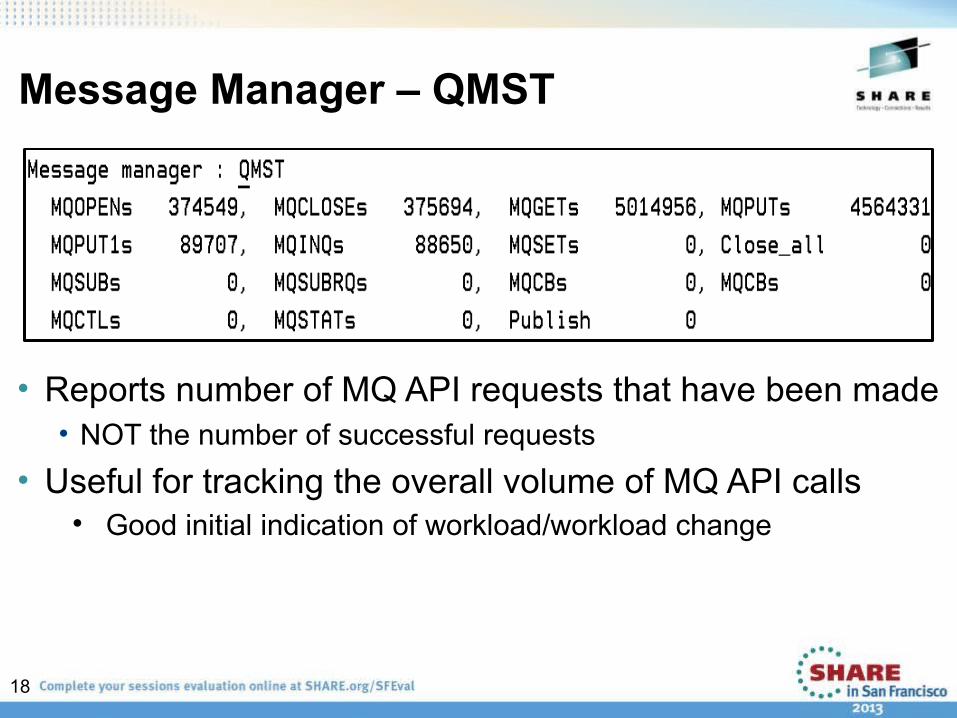
Message Manager – QMST
• Reports number of MQ API requests that have been made• NOT the number of successful requests
• Useful for tracking the overall volume of MQ API calls Good initial indication of workload/workload change
19
Buffer Manager – QPST• Often biggest bang for the buck on performance tuning• For each bufferpool it reports:• The number of pages allocated• The ‘low’ point (number of pages available to steal in the buffer pool)• How the pool is used• Short on Storage
• What it doesn’t tell you:• How many pagesets use a certain buffer pool• Number of pages written to/read from each pageset• Number of pageset expansions
• There is no value in increasing the size of bufferpools for shared queues (SMDS uses a different buffer pool)

20
Buffer Manager – QPST cont'd
Bufferpool usage during a stress test:• ‘low’ value of 0 (means, there were NO pages available to steal in the
buffer pool during this interval)• Asynchronous write processor started (since no. of 'dirty' pages >= 85%
total pages) 137 times• Bufferpool went short on storage (SOS) 413 times in a 5 minute interval• 81,686 synchronous writes (since no. of 'dirty' pages >= 95% total pages
)• 102,140 reads and 129,209 writes from/to the pagesets• JES log also had repetitions of the following messages
CSQP020E QML1 CSQP1RSW Buffer pool 1 is too small CSQP020E QML1 CSQP3GET Buffer pool 1 is too small
21
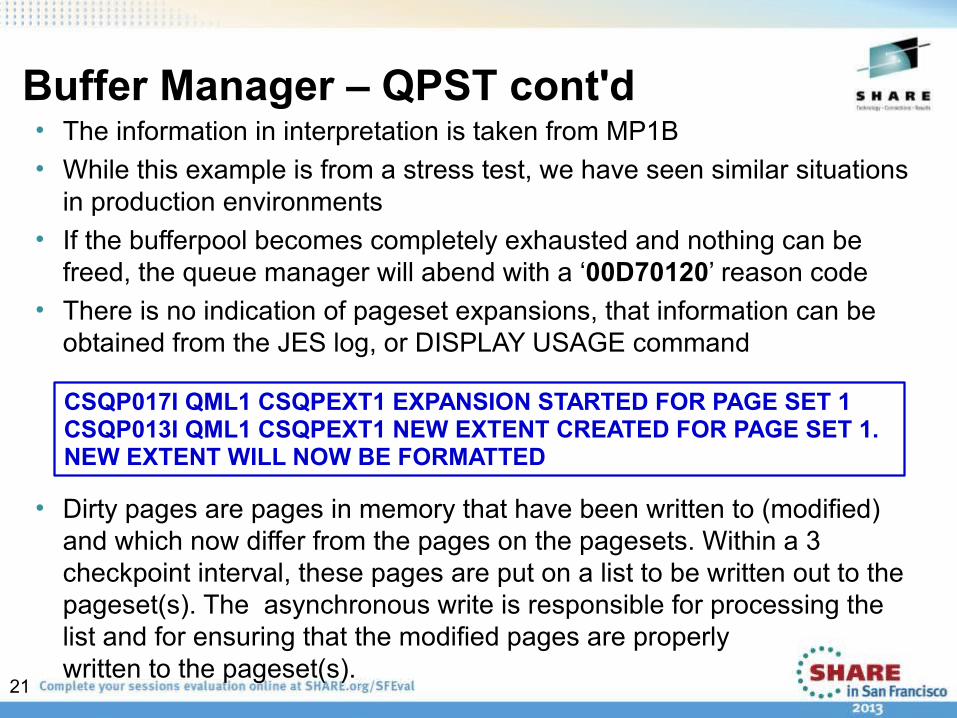
Buffer Manager – QPST cont'd • The information in interpretation is taken from MP1B• While this example is from a stress test, we have seen similar situations
in production environments• If the bufferpool becomes completely exhausted and nothing can be
freed, the queue manager will abend with a ‘00D70120’ reason code• There is no indication of pageset expansions, that information can be
obtained from the JES log, or DISPLAY USAGE command
• Dirty pages are pages in memory that have been written to (modified) and which now differ from the pages on the pagesets. Within a 3 checkpoint interval, these pages are put on a list to be written out to the pageset(s). The asynchronous write is responsible for processing the list and for ensuring that the modified pages are properly written to the pageset(s).
CSQP017I QML1 CSQPEXT1 EXPANSION STARTED FOR PAGE SET 1CSQP013I QML1 CSQPEXT1 NEW EXTENT CREATED FOR PAGE SET 1.NEW EXTENT WILL NOW BE FORMATTED
22
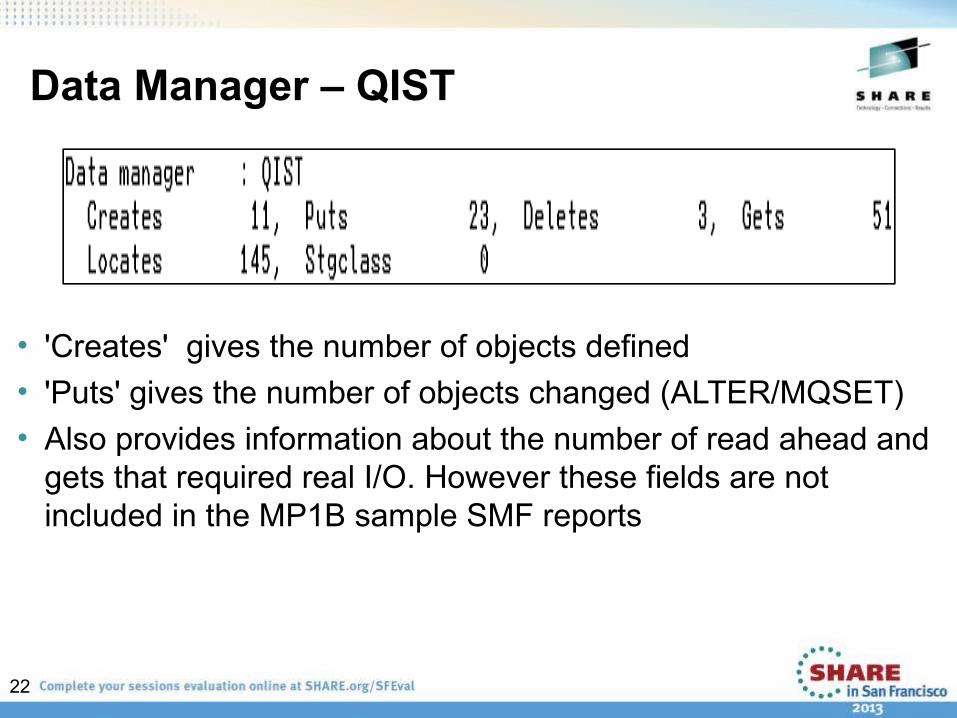
Data Manager – QIST
• 'Creates' gives the number of objects defined• 'Puts' gives the number of objects changed (ALTER/MQSET) • Also provides information about the number of read ahead and
gets that required real I/O. However these fields are not included in the MP1B sample SMF reports
23
Lock manager – QLST• Gives counts of lock gets/releases• The lock manager statistics are only of interest to IBM
24
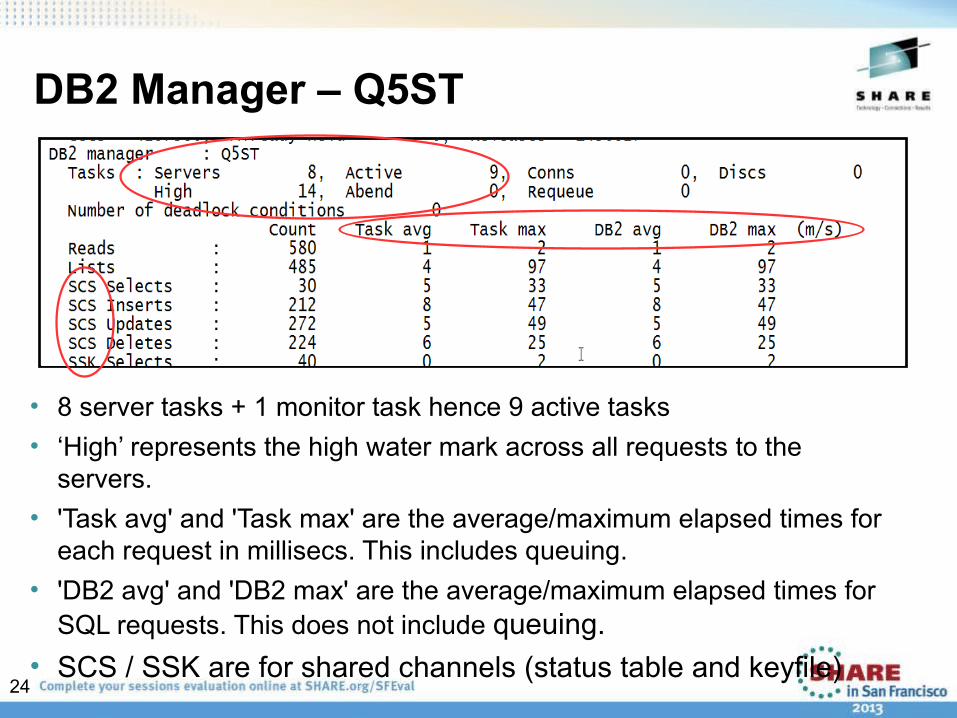
DB2 Manager – Q5ST
• 8 server tasks + 1 monitor task hence 9 active tasks• ‘High’ represents the high water mark across all requests to the
servers.• 'Task avg' and 'Task max' are the average/maximum elapsed times for
each request in millisecs. This includes queuing.• 'DB2 avg' and 'DB2 max' are the average/maximum elapsed times for
SQL requests. This does not include queuing.• SCS / SSK are for shared channels (status table and keyfile)

25
DB2 Manager – Q5ST cont'd
• The above example shows large messages are being put to shared queues and off-loaded to DB2
DB2 MSG Write is for MQPUTs DB2 MSG Read/Delete are for MQGETs

26
DB2 Manager – Q5ST • Only used when in a queue-sharing group• Is used to report on the queue manager interaction with DB2• DB2 response time can impact the WMQ response times
(MQOPEN/MQPUT/MQGET) and should be monitored• Use in conjunction with DB2 performance reports • High number of Lists – could be due to DISPLAY QLOCAL
commands (from monitoring tool perhaps)
27
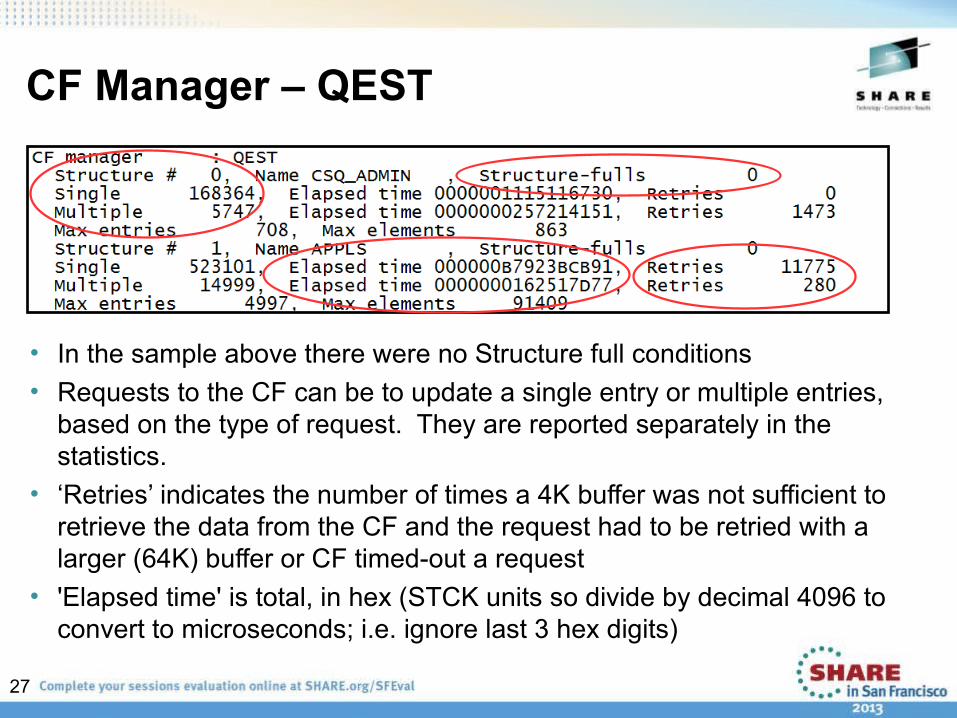
CF Manager – QEST
• In the sample above there were no Structure full conditions • Requests to the CF can be to update a single entry or multiple entries,
based on the type of request. They are reported separately in the statistics.
• ‘Retries’ indicates the number of times a 4K buffer was not sufficient to retrieve the data from the CF and the request had to be retried with a larger (64K) buffer or CF timed-out a request
• 'Elapsed time' is total, in hex (STCK units so divide by decimal 4096 to convert to microseconds; i.e. ignore last 3 hex digits)
28
CF Manager – QEST
• The CF Manager data• Only used when in a queue-sharing group• Is used to report on the interaction with the CF structures• Should be used in conjunction with the CF Activity Report
29
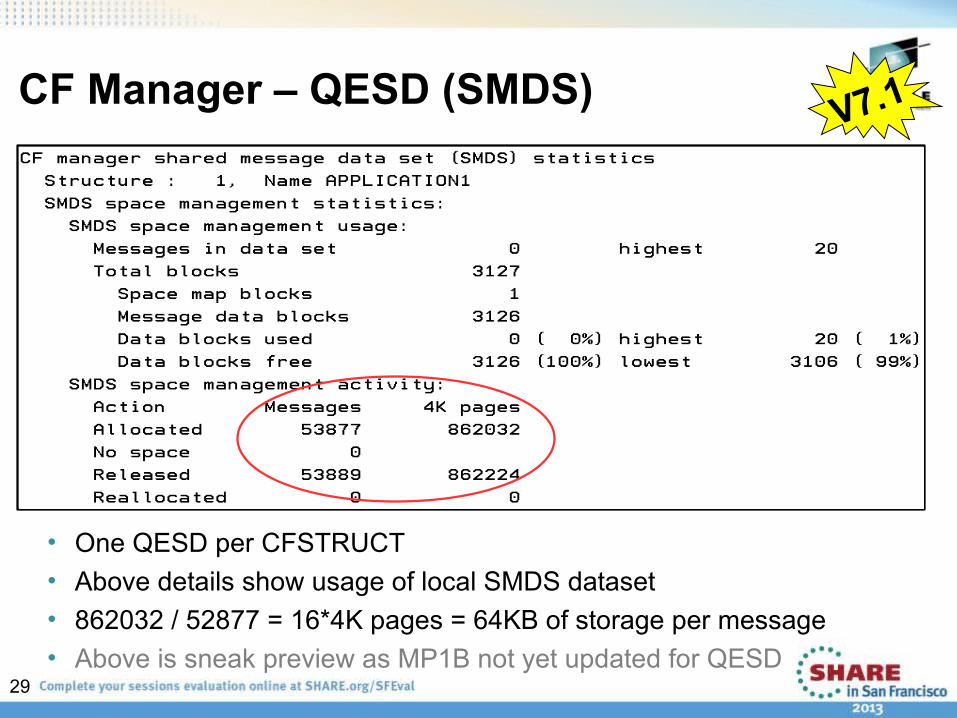
CF Manager – QESD (SMDS)
• One QESD per CFSTRUCT• Above details show usage of local SMDS dataset• 862032 / 52877 = 16*4K pages = 64KB of storage per message• Above is sneak preview as MP1B not yet updated for QESD
V7.1
30
● When off-loading to SMDS, the data written to the CF structure includes: – The number of the queue manager in the QSG (1-32)– A list of blocks of where the message is in the SMDS– MQMD
● The actual message payload is written to SMDS of course.● The number of messages released is 12 more than the
number allocated because the 12 messages are from the previous statistics interval. That is they were put and accounted for during the previous statistics interval but they were got during this statistics interval.
CF Manager – QESD (SMDS) V7.1

31
CF Manager – QESD (SMDS) cont'd
• SMDS buffer pool is in 64-bit storage• There were times when there were no free buffers
Need to increase DSBUFS• Above is sneak preview as MP1B not yet updated for QESD
V7.1
32
CF Manager – QESD (SMDS) cont'd
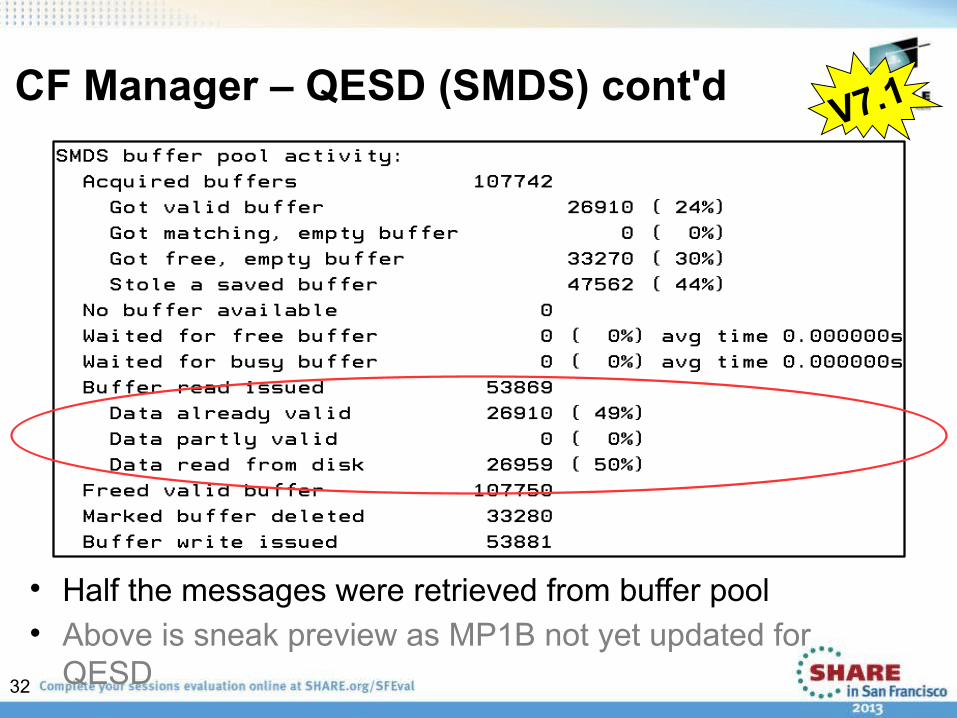
Half the messages were retrieved from buffer pool Above is sneak preview as MP1B not yet updated for
QESD
V7.1
33
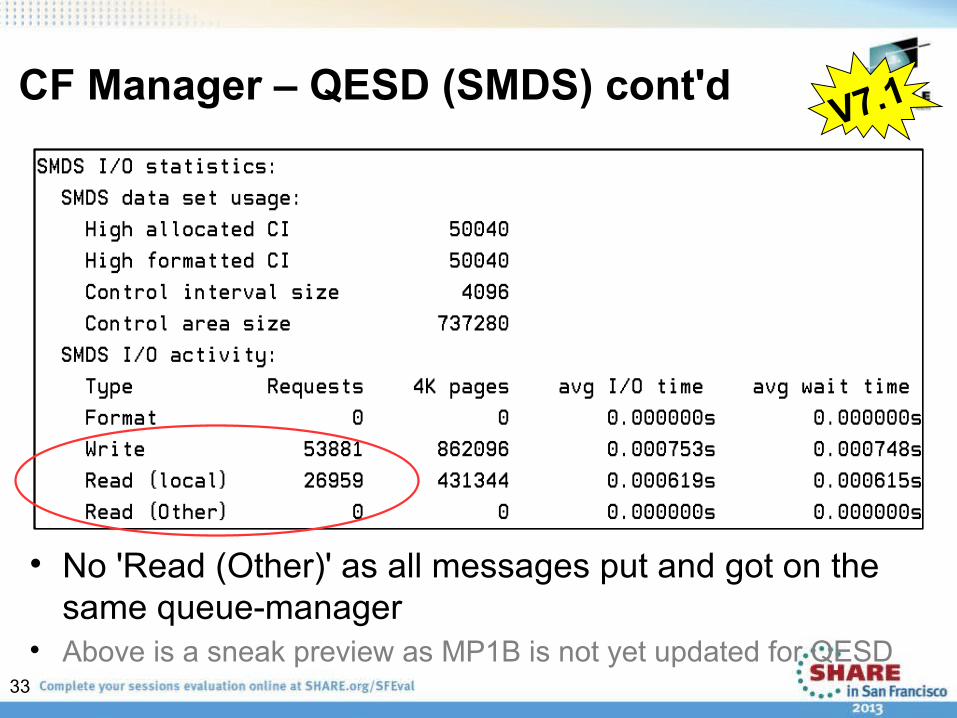
CF Manager – QESD (SMDS) cont'd
No 'Read (Other)' as all messages put and got on the same queue-manager
Above is a sneak preview as MP1B is not yet updated for QESD
V7.1
34
Topic Manager – QTST
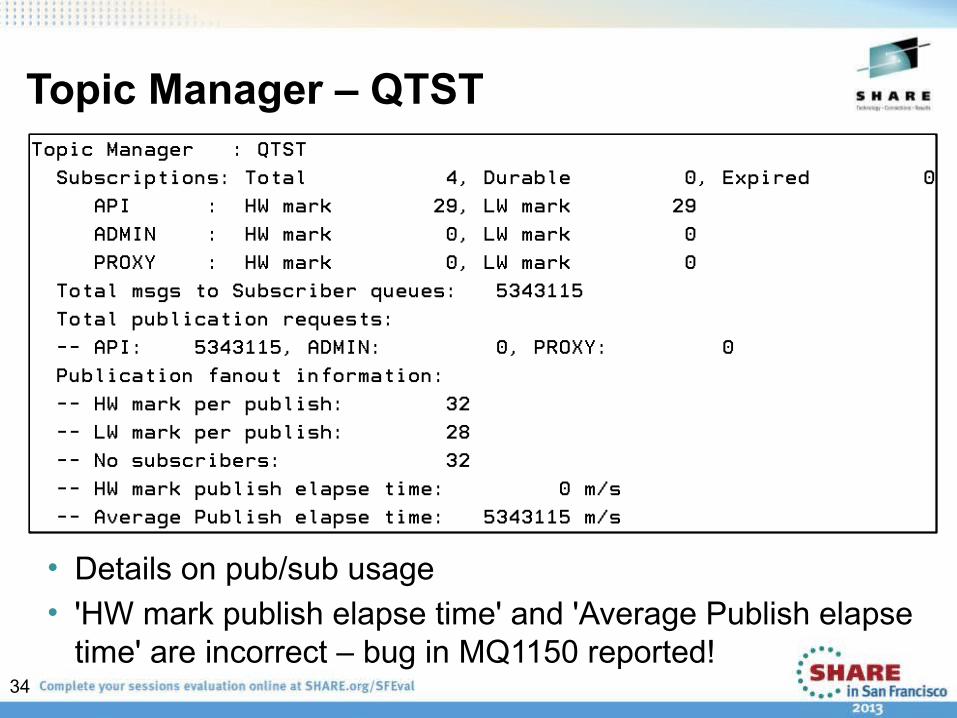
• Details on pub/sub usage• 'HW mark publish elapse time' and 'Average Publish elapse
time' are incorrect – bug in MQ1150 reported!
35
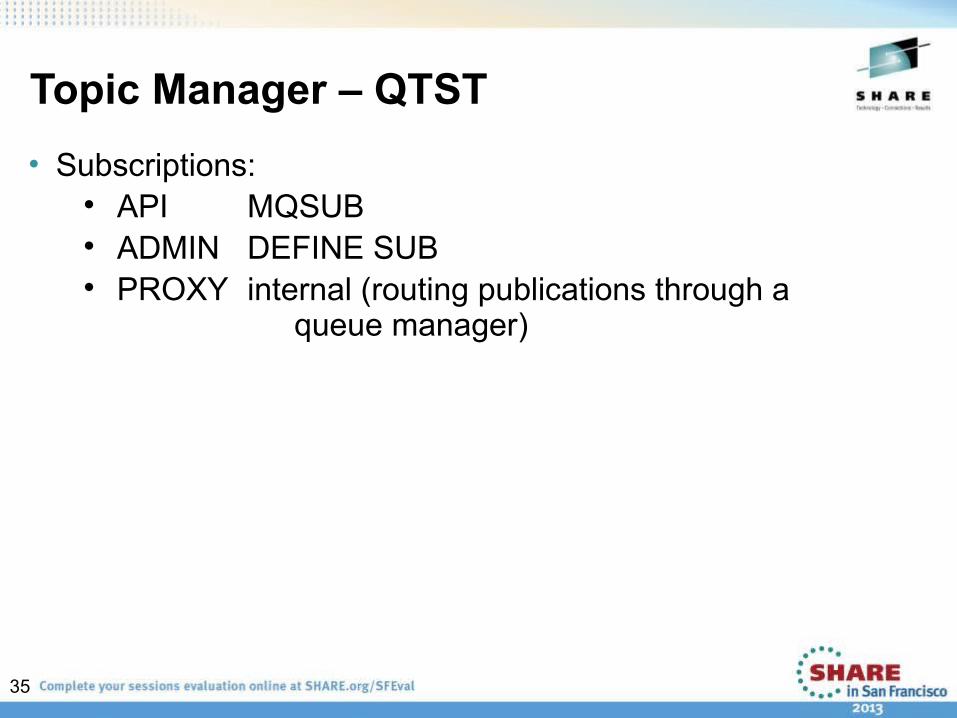
Topic Manager – QTST• Subscriptions:
API MQSUB ADMIN DEFINE SUB PROXY internal (routing publications through a
queue manager)
36
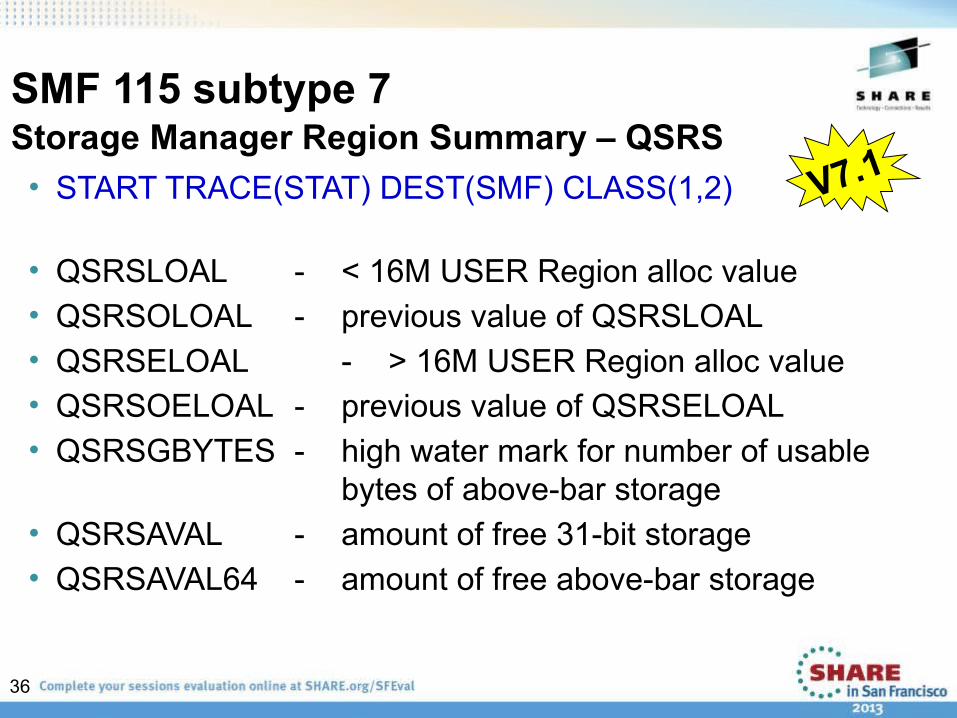
SMF 115 subtype 7 Storage Manager Region Summary – QSRS • START TRACE(STAT) DEST(SMF) CLASS(1,2)
• QSRSLOAL - < 16M USER Region alloc value• QSRSOLOAL - previous value of QSRSLOAL• QSRSELOAL - > 16M USER Region alloc value• QSRSOELOAL - previous value of QSRSELOAL• QSRSGBYTES - high water mark for number of usable
bytes of above-bar storage• QSRSAVAL - amount of free 31-bit storage• QSRSAVAL64 - amount of free above-bar storage
V7.1
37
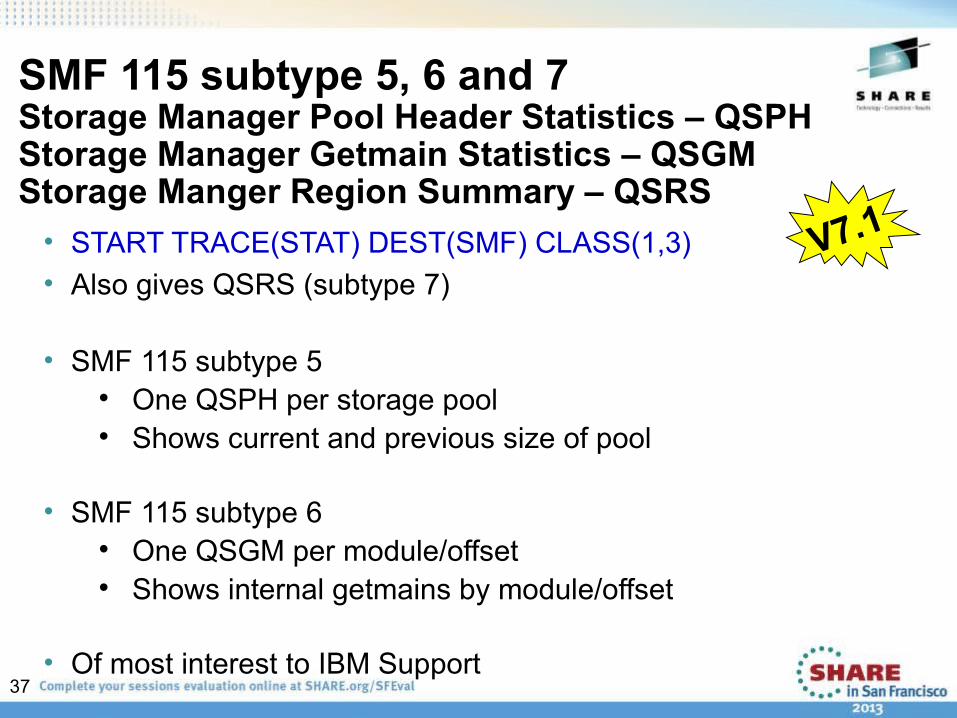
SMF 115 subtype 5, 6 and 7Storage Manager Pool Header Statistics – QSPHStorage Manager Getmain Statistics – QSGM Storage Manger Region Summary – QSRS• START TRACE(STAT) DEST(SMF) CLASS(1,3)• Also gives QSRS (subtype 7)
• SMF 115 subtype 5 One QSPH per storage pool Shows current and previous size of pool
• SMF 115 subtype 6 One QSGM per module/offset Shows internal getmains by module/offset
• Of most interest to IBM Support
V7.1
38
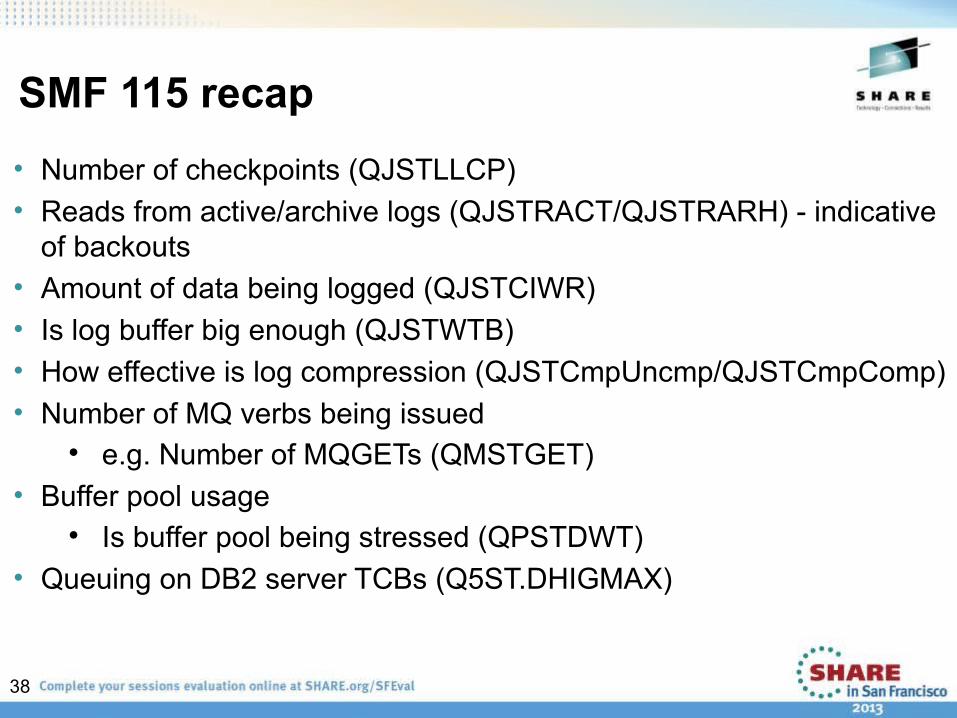
SMF 115 recap• Number of checkpoints (QJSTLLCP)• Reads from active/archive logs (QJSTRACT/QJSTRARH) - indicative
of backouts• Amount of data being logged (QJSTCIWR)• Is log buffer big enough (QJSTWTB)• How effective is log compression (QJSTCmpUncmp/QJSTCmpComp)• Number of MQ verbs being issued
e.g. Number of MQGETs (QMSTGET)• Buffer pool usage
Is buffer pool being stressed (QPSTDWT)• Queuing on DB2 server TCBs (Q5ST.DHIGMAX)
39
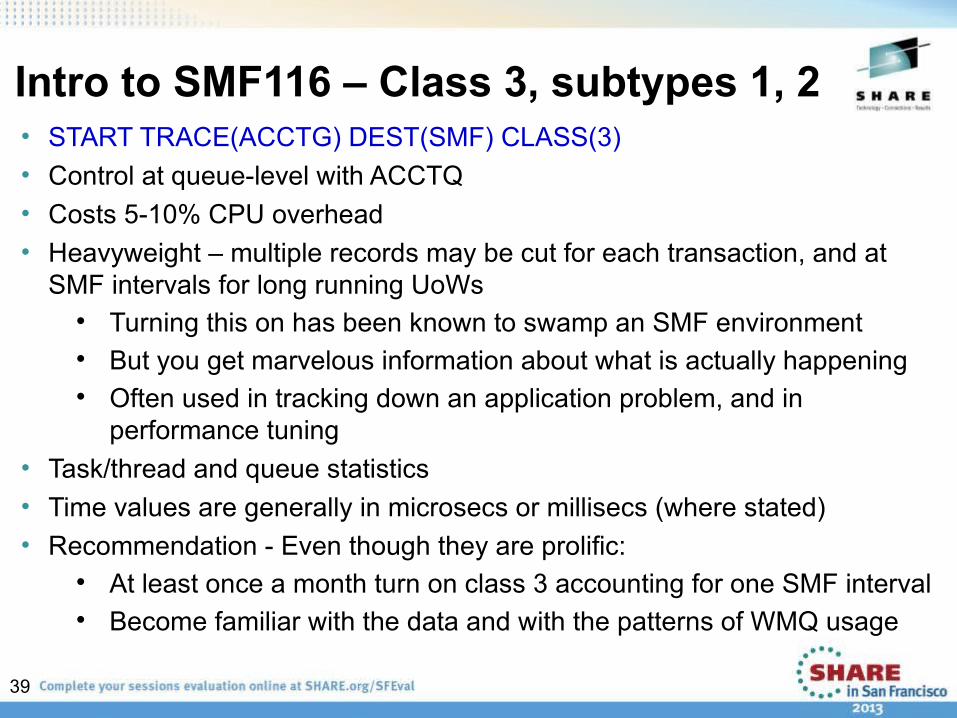
Intro to SMF116 – Class 3, subtypes 1, 2• START TRACE(ACCTG) DEST(SMF) CLASS(3)• Control at queue-level with ACCTQ• Costs 5-10% CPU overhead• Heavyweight – multiple records may be cut for each transaction, and at
SMF intervals for long running UoWs Turning this on has been known to swamp an SMF environment But you get marvelous information about what is actually happening Often used in tracking down an application problem, and in
performance tuning• Task/thread and queue statistics• Time values are generally in microsecs or millisecs (where stated)• Recommendation - Even though they are prolific:
At least once a month turn on class 3 accounting for one SMF interval Become familiar with the data and with the patterns of WMQ usage
40
SMF116 – Task/Thread Identification – WTID
41
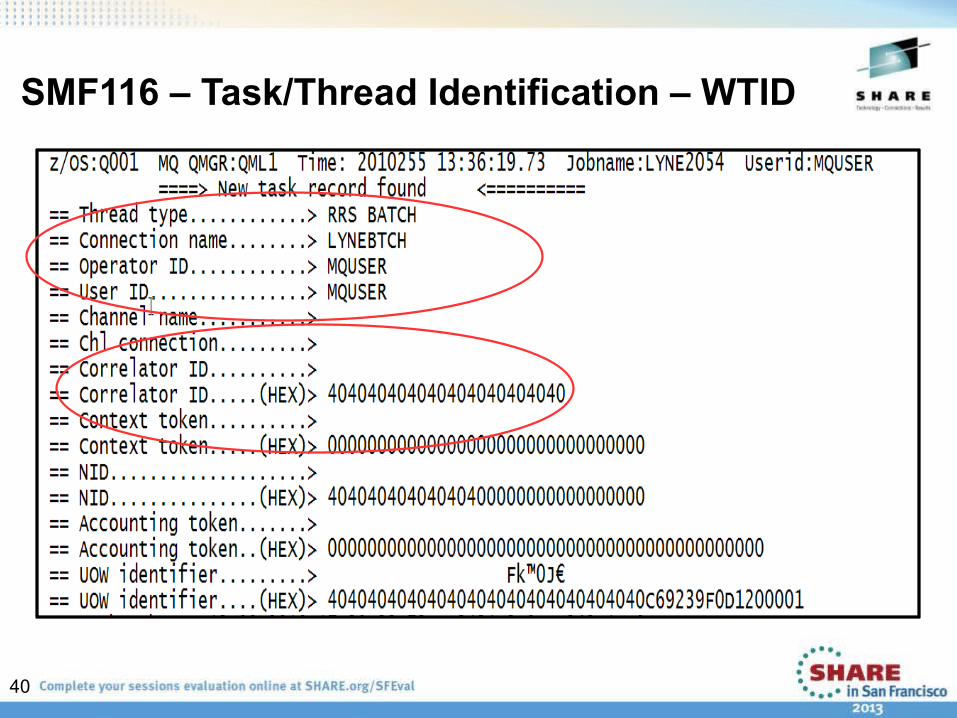
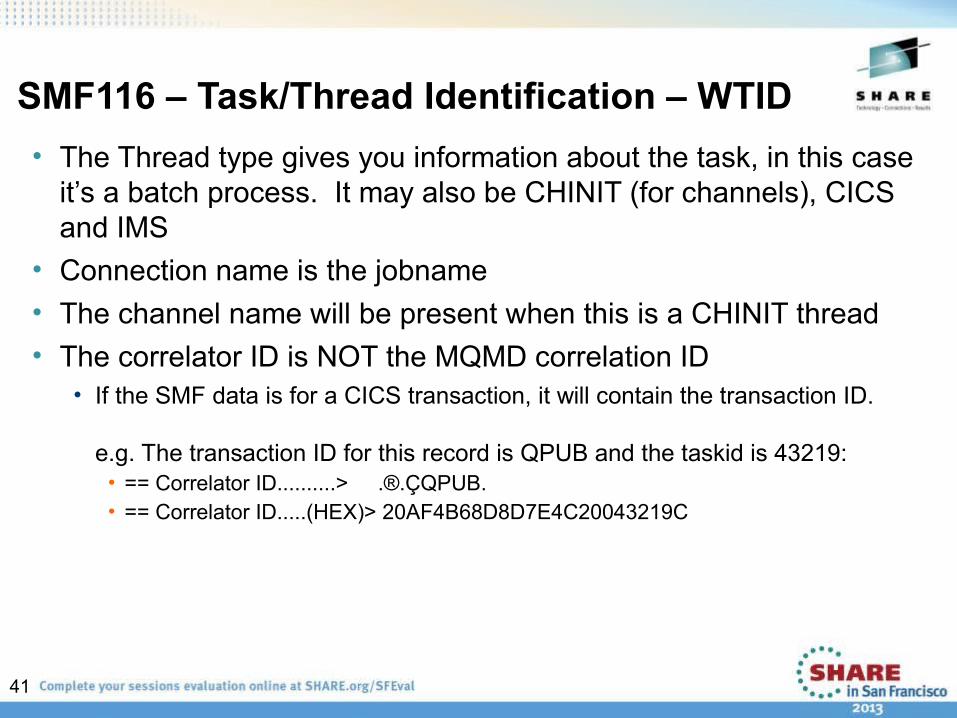
SMF116 – Task/Thread Identification – WTID• The Thread type gives you information about the task, in this case
it’s a batch process. It may also be CHINIT (for channels), CICS and IMS
• Connection name is the jobname• The channel name will be present when this is a CHINIT thread• The correlator ID is NOT the MQMD correlation ID
• If the SMF data is for a CICS transaction, it will contain the transaction ID.
e.g. The transaction ID for this record is QPUB and the taskid is 43219:• == Correlator ID..........> .®.ÇQPUB. • == Correlator ID.....(HEX)> 20AF4B68D8D7E4C20043219C
42
SMF116 – Task related statistics - WTAS
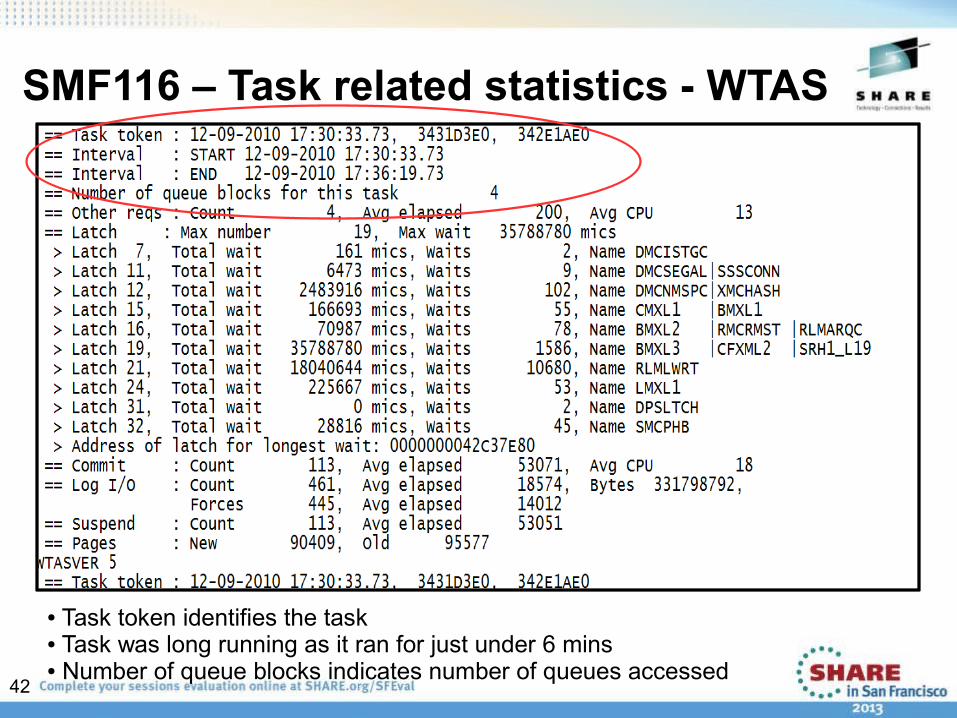
● Task token identifies the task● Task was long running as it ran for just under 6 mins● Number of queue blocks indicates number of queues accessed
43
SMF116 – Task related statistics - WTAS• Task token is the task identifying information• Since this is a long running task, the interval start and end
information may be of interest• The queue blocks gives you the number of queues that
have been accessed • The Commit Count indicates the number of Commit
requests• Then there’s the latches………
44
SMF116 – Task related statistics – Latching – WTAS
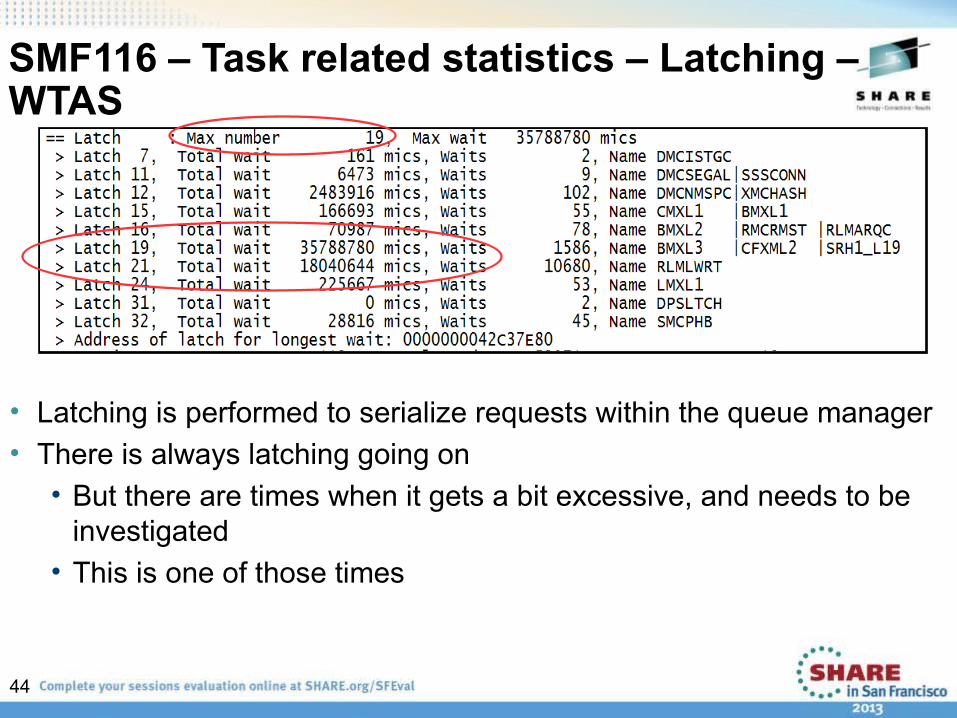
• Latching is performed to serialize requests within the queue manager• There is always latching going on• But there are times when it gets a bit excessive, and needs to be
investigated• This is one of those times
45
SMF116 – Task related statistics – Latching – WTAS• The ‘Max number’ is really the latch type that showed the longest wait, in this
case latch type 19• Latch types may be used for multiple purposes• MP1B has a list of some of the more typical entries, latch 19 is used for
serialization to bufferpools• Latch 21, the second largest wait count, is used when updating log buffers. • Using these numbers, and looking at the JES message log for the queue manager
indicates that during this interval there were numerous log switches and one of the bufferpools expanded
• Further investigation uncovered I/O subsystem issues – the logs and the pagesets were on the same devices for this environment, leading to significant contention
46
SMF116 – Task related statistics cont'd - WTAS
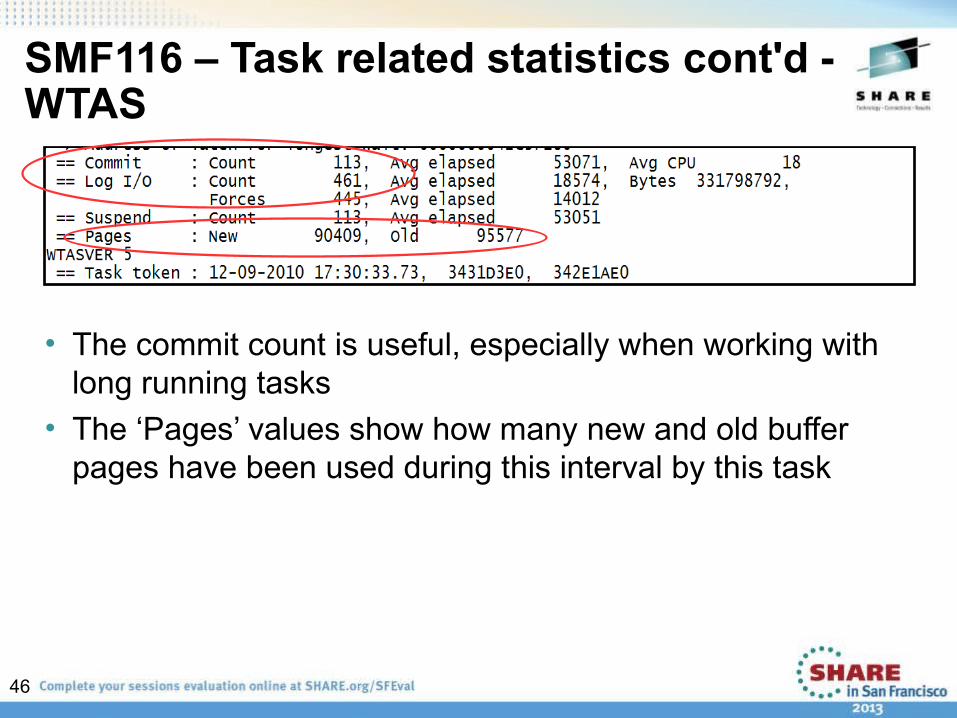
• The commit count is useful, especially when working with long running tasks
• The ‘Pages’ values show how many new and old buffer pages have been used during this interval by this task
47
SMF116 – Queue Accounting statistics – WQST
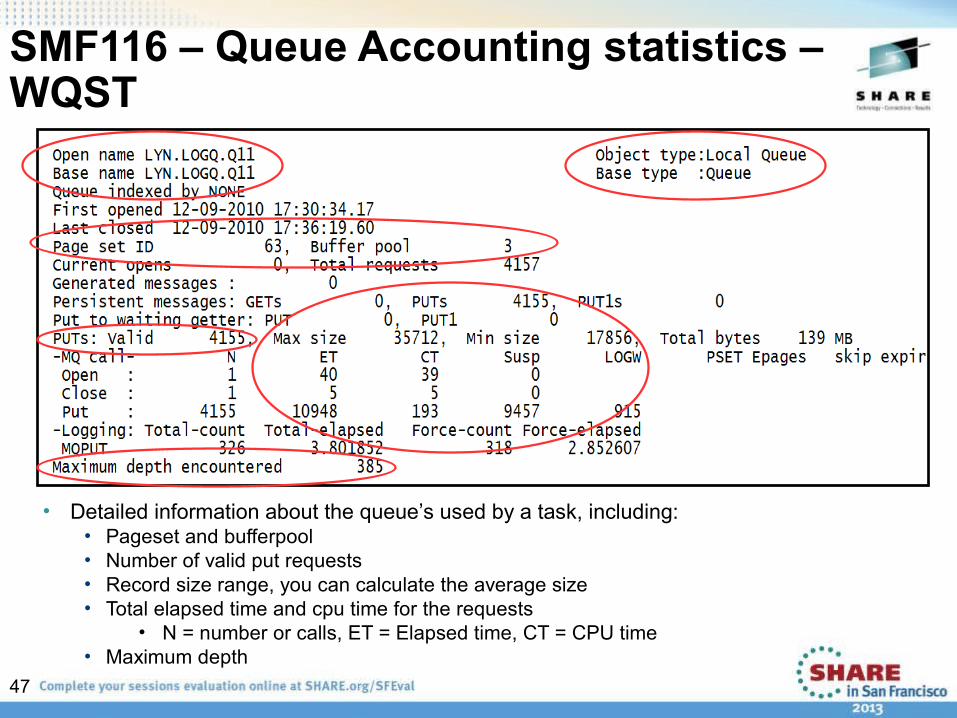
• Detailed information about the queue’s used by a task, including:• Pageset and bufferpool• Number of valid put requests• Record size range, you can calculate the average size• Total elapsed time and cpu time for the requests
• N = number or calls, ET = Elapsed time, CT = CPU time • Maximum depth

48
SMF116 – Queue Accounting statistics – WQST
• Detailed information about the queue’s used by a task, including:• Number of valid get requests V's total number of get requests issued
(valid get requests = number of get requests that returned data and completed with a reason code of none or truncated message accepted)
• The amount of time (max, min, average) messages have been on the queue
49
• In addition to the information common to all queues, the following should be noted on the GET queues• Number of valid gets as compared to the total gets issued• The difference means that a number of gets returned no message, often due
to a get wait expiring• Time on queue – average sometimes overflows• PSET is the average I/O time for a read from a pageset• Epages is the number of empty pages there were skipped during a get• Skip is the number of pages with messages that were skipped • Expire is the number of expired messages that were skipped
SMF116 – Queue Accounting statistics – WQST
50
SMF116 Uses • Channel usage• Bufferpool/pageset balancing• In a high volume request reply scenario if the two queues are
on the same pageset, separating them may improve performance• When queues have become concentrated in one resource
pool• Preparation for migration to shared queues• Min/Max/Average message size and duration on queue
• Application Performance tuning• Proper Indexing• Elimination of ‘hot spots’ – reducing contention
• Problem determination
51
SMF116 – What it does not tell you• Often a consolidated view is needed• How many tasks are concurrently using this set of queues?• What tasks are related?• Can be determined via the queues accessed, but not easily
• Were security calls made during this task?
• No accounting for the IMS Bridge
• Consolidation of z/OS and distributed information to provide a complete view
52
SMF116 – A few gotcha's● Size of WQST (WQSTAT) records increased by around 2K
between V6 and V7.0.1 – so a lot more SMF 116 data written● Starting SMF 116 Queue Level accounting via START TRACE,
used to only start accounting for subsequent MQOPENs (so, accounting data was not collected for long running tasks that had already issued MQOPEN calls)– APAR PM58798, PTFs UK80090 (V7.0.1) and UK80091 (V7.1) fixes
this● Long-running tasks have SMF 116 records at STATIME.
However, STAT tracing must be started. If not, records only written when task ends. APAR PM46937, PTF UK72801(V7.0.1) fixes this Fix was in the base for V7.1
53
SMF 116 accounting recap• Queues used by applications
MQAPI calls issued Sizes of messages
• CPU cost per MQAPI call per queue• Is “Put to a waiting getter” being used• Number of messages read from disk• Persistent V's Non Persistent message counts • Number of MQGETs by msgid/correlid • Number of messages skipped to find the right message• Expired messages
54
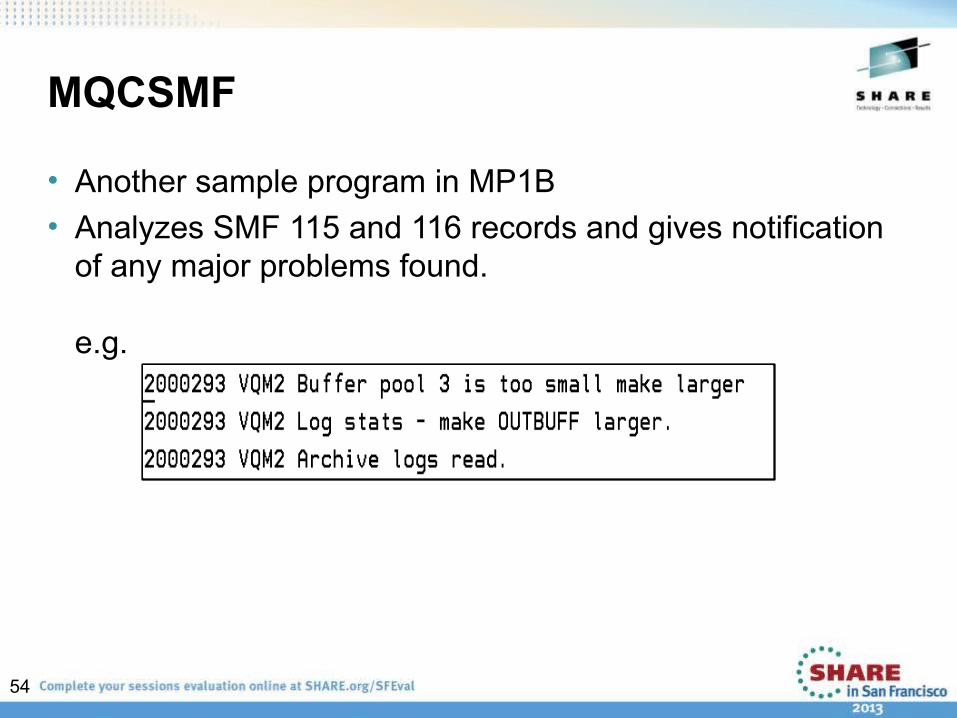
MQCSMF
• Another sample program in MP1B• Analyzes SMF 115 and 116 records and gives notification
of any major problems found.
e.g.
55
Summary
•We looked at:
SMF 115 records in some details SMF 116 Accounting records
56
Thank-you
Any questions?
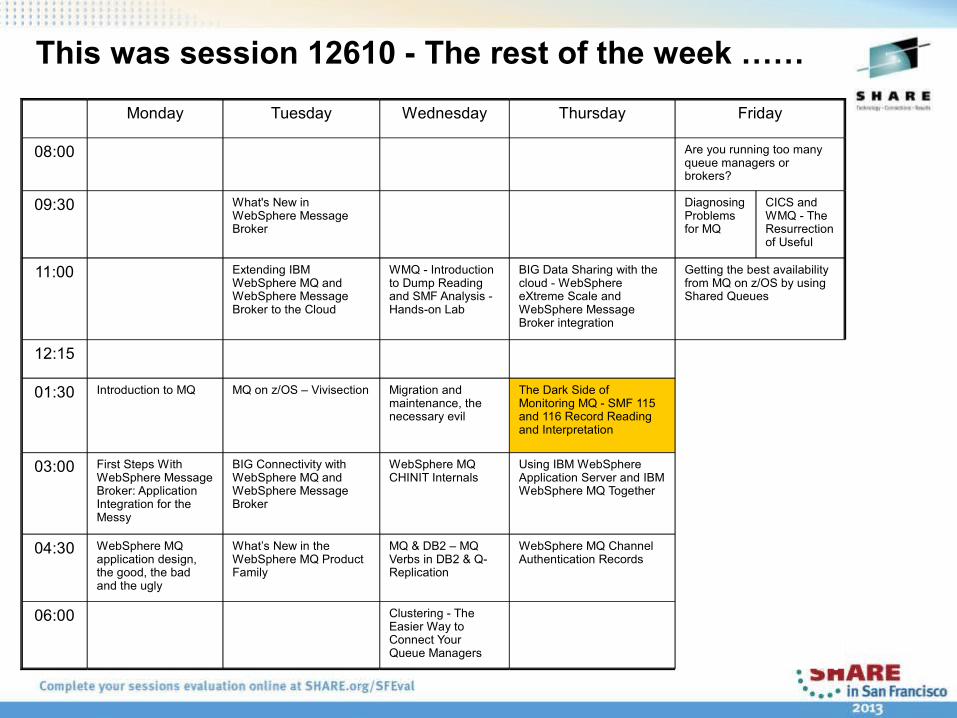
Monday Tuesday Wednesday Thursday Friday
08:00 Are you running too many queue managers or brokers?
09:30 What's New in WebSphere Message Broker
Diagnosing Problems for MQ
CICS and WMQ - The Resurrection of Useful
11:00 Extending IBM WebSphere MQ and WebSphere Message Broker to the Cloud
WMQ - Introduction to Dump Reading and SMF Analysis - Hands-on Lab
BIG Data Sharing with the cloud - WebSphere eXtreme Scale and WebSphere Message Broker integration
Getting the best availability from MQ on z/OS by using Shared Queues
12:15
01:30 Introduction to MQ MQ on z/OS – Vivisection Migration and maintenance, the necessary evil
The Dark Side of Monitoring MQ - SMF 115 and 116 Record Reading and Interpretation
03:00 First Steps With WebSphere Message Broker: Application Integration for the Messy
BIG Connectivity with WebSphere MQ and WebSphere Message Broker
WebSphere MQ CHINIT Internals
Using IBM WebSphere Application Server and IBM WebSphere MQ Together
04:30 WebSphere MQ application design, the good, the bad and the ugly
What’s New in the WebSphere MQ Product Family
MQ & DB2 – MQ Verbs in DB2 & Q-Replication
WebSphere MQ Channel Authentication Records
06:00 Clustering - The Easier Way to Connect Your Queue Managers
This was session 12610 - The rest of the week ……
58