Embed Size (px)
Citation preview
The Dark Side of Mobile Phones
August 3, 2010
Naomi S. Baron
Department of Language and Foreign Studies American University
Washington, DC 20016-8045 USA
Abstract Mobilephonesenablepeopletocommunicatewhen,where,andwithwhomtheywish.
However,usersareoftentroubledtofindthemselvesatthebeckandcallofothers.Togauge
attitudestowardsmobiles,studentsfromuniversitiesinfivecountrieswereaskedwhatthey
likedmostandlikedleastabouthavingamobilephone.Responsesacrossallcountries
indicatedthatcommunicationwasbothwhatsubjectslikedmostandleast–enjoyingthe
abilitytocontactothersbutfeelingtrappedbyinterlocutors’abilitytoalwayscontactthem.
Concernsaboutdependencyonthedeviceparalleledintensityofusage.Amongthedistinctions
foundbetweencountries,somewereattributabletovariationinavailabletechnology,while
othersappeartoreflectculturalfactors.
Acknowledgments Support for this research was provided by a fellowship from the Swedish Fulbright Commission and a
Presidential Research Fellowship from American University. I am grateful to the following people for
invaluable assistance in designing and administering the survey, doing translations, and analyzing
results: Kumino Akikawa, Sachiko Aoshima, Assen Assenov, Ann-Sofie Axelsson, Marina Bondi,
Maria Bortoluzzi, Miriam Callahan, Elise Campbell, Ranieri Cavaceppi, colleagues at Ritsumeikan
University, Jonathan Donner, Nicole Ellison, Leopoldina Fortunati, Solveig Granath, Ylva Hård af
Segerstad, Kumi Iwasaki, Dong-Hoo Lee, Eunjeong Lee, Rich Ling, Misa Matsuda, Marieta
Pehlivanova, students in my Autumn 2007 class “Language in an Online and Mobile World” at the
University of Gothenburg, and Oscar Westlund.
2
The Dark Side of Mobile Phones
“In the periods without a mobile phone (because it was broken or I had lost it) I remember being much more tranquil” (Italian university student)
History is replete with examples of new products – or technologies – that may initially meet with
enthusiasm, but later reveal unanticipated negative consequences (Tenner, 1996). Modern drugs save
lives, but benefits must be weighed against side effects. Fast food is convenient, but often makes for
a poor nutritional choice. Deep-water rigs increase the world’s access to oil but risk polluting our
waters.
Mobile telephony is another Janus-faced technology. Mobile phones offer users enormous
freedom to communicate on their own terms (regarding place and time). Yet the reverse side of the
Faustian bargain is that people find themselves at the beck and call of others, struggling with the
perceived social necessity of being always on (Baron, 2008).
As usage of information and communication technologies (ICTs) has soared over the past
decade, social critics have worried about our seeming inability to disconnect. However, beyond
anecdotal commentary (e.g., Herbert, 2010; Powers, 2010), there has been little systematic study of
the concerns that users themselves have about the devices, including negative effects of mobile
phones on social interaction and personal wellbeing. The present analysis addresses this lacuna, using
cross-cultural data. To situate the study within the larger field of mobile phone research, we begin
with a brief overview of mobile telephony in historical and social context.
Mobile Phones in Historical and Social Context
While the origins of mobile phones date back to the 1950s, the technology came of age in the1990s
with development of the GSM network in Europe, the appearance of several transmission systems in
3
the US, launching of NTT DoCoMo in Japan, and concurrent growth in the Middle East, the rest of
Asia, and Africa (Agar, 2003; Ling & Donner, 2009). As of 2009, there were almost 4.7 billion
mobile phone subscriptions (ITU, 2009), out of a world population of about 6.8 billion.
Today’s mobile phones range widely in price and functionality. Besides texting and voice
capabilities, most phones offer tools such as an address book, a variety of ring tones, a camera, an
alarm clock, a calendar, and perhaps an MP3 player or radio. Smart (3G) phones have internet access
and video capabilities. Mobile telephony has permeated across cultural groups, economic strata, and
age cohorts (Katz, 2008; Ling & Donner, 2009). However, since their inception, mobiles have
enjoyed an especially high uptake among teenagers and young adults.
Young People and Mobile Phones
In Fall 2009, Lenhart et al. (2010) surveyed 800 American young people between ages 12 and 17
regarding their use of mobile phones. The researchers report that half of the teens were sending 50 or
more messages a day, with older teenage girls sending an average of 100 messages daily. A year
earlier, Nielsonwire (2008) reported that on average, US wireless subscribers were placing (or
receiving) 204 voice calls a month and sending (or receiving) 357 text messages. The corresponding
monthly statistics for 18-24 year-olds were 265 voice calls and 790 texts. For 13-17 year-olds, the
numbers were 231 voice calls and 1,742 texts (or about 58 texts sent or received per day).
Young people have been instrumental in developing the potential of the mobile phone. For
example, they have been at the forefront of initiating or popularizing lexical shortcuts in text
messaging such as the abbreviation “u” for “you” or the acronym “LOL” for “laughing out loud”.
They are adept at screening calls (e.g., using caller ID to ignore calls from Mom; downloading
applications that automatically tell certain people “This number is no longer in service” – when, in
fact, it is). And they are often masters at economizing on phone bills by beeping a friend – that is,
4
calling but hanging up after a prearranged number of rings – to save the price of a completed call
(Donner, 2007).
Mobiles have also helped facilitate the social emancipation of young people from parental
authority (Ling, 2004). If teenagers have mobile phones, their parents often feel more security when
their progeny travel independently outside the home. Teenagers are also freed from having to talk
from a family landline, which is often in quasi-public space (Ling & Baron, In Press). For young
adults living away from home, these freedoms are magnified.
In looking at young people’s use of mobile phones, it is important to consider the social
development that teenagers and young adults are experiencing. Friendships are being initiated,
developed, and broken; membership in a social clique may become significant; romantic affiliations
may emerge; and relationships with family members may shift. These social connections, which used
to be negotiated in person (and later on landline phones as well), are now commonly played out via
mobile phones. Thus, for young people, the mobile phone is not simply an instrument for conveying
information but a lifeline for managing social interaction.
Growing Concerns about Mobile Phones
As mobile phone use has expanded, so have concerns about overuse of the technology. A major issue
has been multitasking: texting while attending a class lecture or business meeting; talking on the
phone while sitting at a restaurant with a friend; texting while crossing the street; talking or texting
while driving. Some situations violate traditional norms of social behavior; others become safety
issues.
In an ingenious experiment, Hyman et al. (2009) had a clown ride a unicycle across the main
square of a university campus. Student passersby who were on their mobile phones were less than
half as likely to notice the clown as those not using personal electronics such as a mobile phone or
5
iPod. Moreover, those on mobile phones took nearly 83 seconds to cross the square, compared with
75 seconds for those without electronic devices.
Use of mobile phones can also become physically dangerous. The American College of
Emergency Physicians Foundation (n.d.) has voiced concern over rising numbers of emergency room
cases involving mobile phone users who walked into lampposts, tripped on sidewalks, or entered the
street into oncoming traffic. In November 2009, the Pew Internet & American Life Project reported
that one-quarter of American teenagers of driving age admitted to having texted while driving
(Madden & Lenhart, 2009). In a study six months later, adults acknowledged the same rate of texting
(Madden & Rainie, 2010).
Despite the risks of both social infelicities and physical safety, mobile phone use continues to
increase. One possible rationale is that standards of social acceptability have changed: While ten
years ago it may have been deemed rude to text Person X while conversing face-to-face with Person
Y, perhaps we are no longer bothered (Hubbard et al., 2007). Notions of appropriateness have shifted
with other communication technologies (Baron, 2002), and this may be another such evolution
(Humphreys, 2005). A justification often given for talking (or even texting) while driving is that “I
can do it safely”, although evidence consistently suggests that even talking with a hands-free device
is more distracting than conversing with a person sitting next to you (Chabris & Simons, 2010).
Researching the Dark Side of Mobile Phones
There are many things to like about mobile phones: the convenience, the functionality, even the
fashion component. But there are also aspects that users dislike. Beyond obvious issues such as dead
batteries, dropped calls, costs, and possible effects from radiation, there are considerations involving
social interaction and personal wellbeing. All of these concerns constitute what we might call the
“dark side” of mobile phones.
6
Some researchers have begun to probe how use of mobiles affects people emotionally or
socially. Beranuy et al. (2001) report a correlation between mobile phone use and mental distress, as
manifested, for example, in deterioration of family and social relationships. Hubbard et al. (2007),
who observed dating partners whose face-to-face conversations were interrupted by a phone call,
found that partners receiving the calls felt negatively about imposing on their waiting partner, while
those kept waiting believed their partners had tarnished their self-image by accepting the call.
Humphreys (2005) describes the awkwardness for the second member of a face-to-face dyad when
the first member is using a mobile phone.
Research Questions
This study looked quantitatively and qualitatively at the usage patterns and attitudes of a cross-
cultural sample of university students (from Sweden, the US, Italy, Japan, and Korea) regarding
mobile phones. The goal was to understand users’ concerns about mobile telephony. Our
investigation centered around three questions: usage levels, individual attitudes, and cultural issues.1
RQ1: Usage Levels
One factor that may help shape attitudes towards mobile phones is the amount that people use them.
For example, heavy users might be more likely than light users to complain about feeling dependent
upon the device. Therefore, our first research question was
RQ1 How much do university students report using their mobile phones for talking
or texing?
1Gender issues are discussed elsewhere (Baron & Campbell, Under Review).
7
We need to be cautious when interpreting data from such a question. Usage statistics reported by
individuals do not necessarily correspond to traffic records kept by telecommunications carriers
(Boase & Ling, In Progress ). Additionally, cost may influence usage patterns. If, for instance,
texting is relatively expensive (as was the case in the US until the mid 2000s), texting volume may be
depressed (compared with Europe, where it has been inexpensive). Moreover, new technologies may
spur usage spikes, which happened in the US with adoption of the iPhone. Because of changes in cost
and technology, it is also critical to be clear when data have been collected.
RQ2: Individual Attitudes
To gauge users’ negative attitudes towards mobile phones, our second research question was
RQ2 What kinds of concerns do university students express about mobile phones –
and with what frequency?
There are multiple ways this question might be addressed. One is through interviews or focus groups.
Another is posing targeted questions (e.g., asking subjects to rate their level of agreement with a
statement such as “It is rude to talk on your mobile phone while sitting with a friend at a restaurant”).
A third option (the one adopted for the present investigation) is asking open-ended questions,
affording subjects the opportunity to express whatever is on their minds. Through open-ended
questions, we gain a broad perspective on subjects’ attitudes, rather than prejudging what parameters
they might find important.2
RQ3: Cultural Issues
2An additional methodological option is a word association task. In the larger study described here, subjects were asked for the first three words they thought of when they thought of mobile phones. These results are reported in Baron (In Press).
8
Given the global reach of mobile telephony, it is instructive to consider negative attitudes towards
mobile phones in more than one cultural context. Speaking on a mobile when riding a bus might be
considered acceptable in one culture, but inappropriate in another (Baron & Hard af Segerstad,
2010). Hence, our third research question was
RQ3 Are there cultural differences in the concerns that university students express
about mobile phones?
Cross-cultural studies are, of course, fraught with challenges (Baron, 2010; Haddon, 2005;
Livingstone, 2003; Thomas et al., 2005). It is therefore important to be aware that factors other than
culture (e.g., cost, how long a technology has been available, complexity of the local written script)
may account for differences observed between nation-states. We also need to be mindful that
multiple cultures may exist within a single country (e.g., northern versus southern Italy).
Methodology
Research Design
Data were collected using a convenience sample of 18-24 year-old university students in Sweden,
the US, Italy, Japan, and Korea between October 2007 and December 2008. Selection of research
sites reflected a confluence of variables: an attempt to look at countries having diverse experience
with ICTs, an interest in countries known for being on the leading edge of mobile phone technology,
and availability of research sites.
Subjects were recruited through advertisements in student newspapers, campus posters, email
distribution lists, class visits, and invitations on course websites. Participants were directed to an
online survey mounted on the professional version of SurveyMonkey, an internet-based survey tool.
A total of 2001 subjects completed the survey. In each country, data were collected at universities in
two cities. The English questionnaire was translated into Swedish, Italian, Japanese, and Korean by
9
fluent bilinguals. The survey took about 10 minutes to complete. The full survey (excluding
demographic information) included 54 quantitative or scalar questions, six open-ended questions,
and a word association question. Verbal responses were translated into English by fluent bilinguals.
Focus groups were also conducted in all countries except Korea. While focus group results are not
reported here, we draw upon those conversations at several points in our discussion.
Subjects
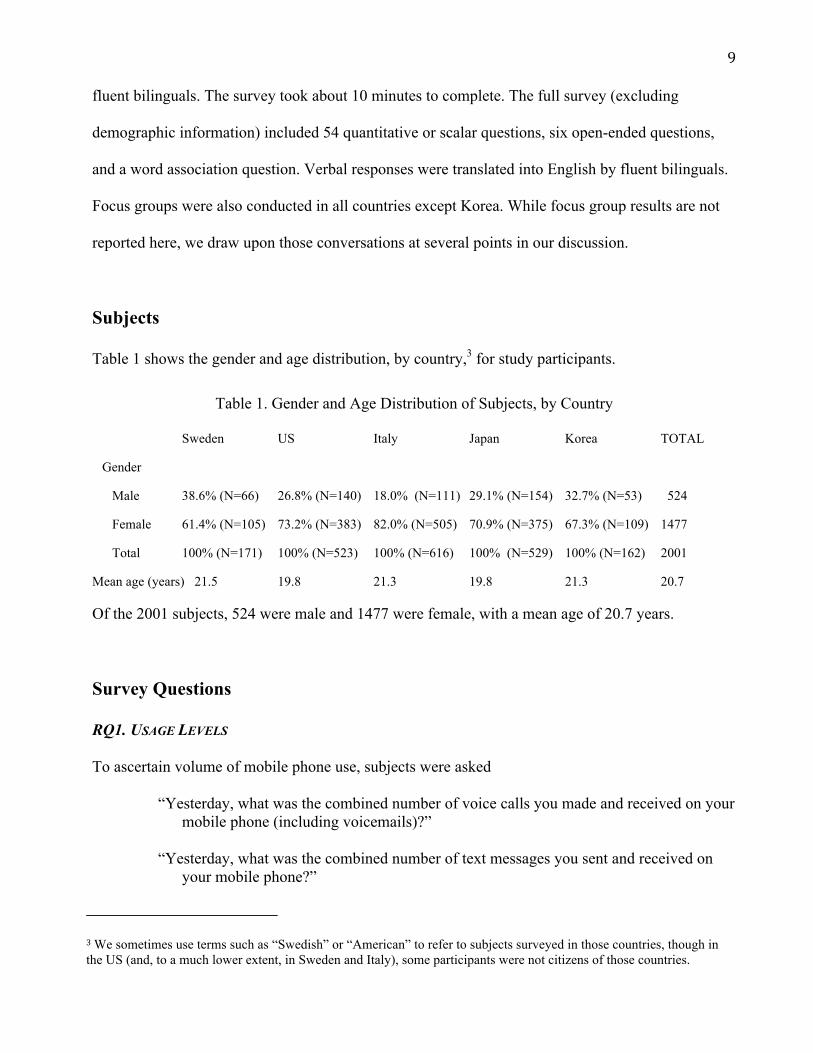
Table 1 shows the gender and age distribution, by country,3 for study participants.
Table 1. Gender and Age Distribution of Subjects, by Country
Sweden US Italy Japan Korea TOTAL
Gender
Male 38.6% (N=66) 26.8% (N=140) 18.0% (N=111) 29.1% (N=154) 32.7% (N=53) 524
Female 61.4% (N=105) 73.2% (N=383) 82.0% (N=505) 70.9% (N=375) 67.3% (N=109) 1477
Total 100% (N=171) 100% (N=523) 100% (N=616) 100% (N=529) 100% (N=162) 2001
Mean age (years) 21.5 19.8 21.3 19.8 21.3 20.7 Of the 2001 subjects, 524 were male and 1477 were female, with a mean age of 20.7 years.
Survey Questions
RQ1. USAGE LEVELS
To ascertain volume of mobile phone use, subjects were asked
“Yesterday, what was the combined number of voice calls you made and received on your mobile phone (including voicemails)?”
“Yesterday, what was the combined number of text messages you sent and received on
your mobile phone?”
3We sometimes use terms such as “Swedish” or “American” to refer to subjects surveyed in those countries, though in the US (and, to a much lower extent, in Sweden and Italy), some participants were not citizens of those countries.
10
Respondents were asked to select from a range of intervals (e.g., 1-2, 11-15, 21-30).
RQ2. INDIVIDUAL ATTITUDES
Two questions were used to gauge individual attitudes towards mobile phones:
“What is the one thing you like most about having a mobile phone?”
“What is the one thing you like least about having a mobile phone?”
While our interest was primarily in what subjects most disliked about having a mobile, these
responses were often best understood in contrast with what subjects liked most.
RQ3. CULTURAL ISSUES
Data for examining cultural issues were drawn from the usage level questions and the individual
attitudes questions noted above.
Results
Usage Levels
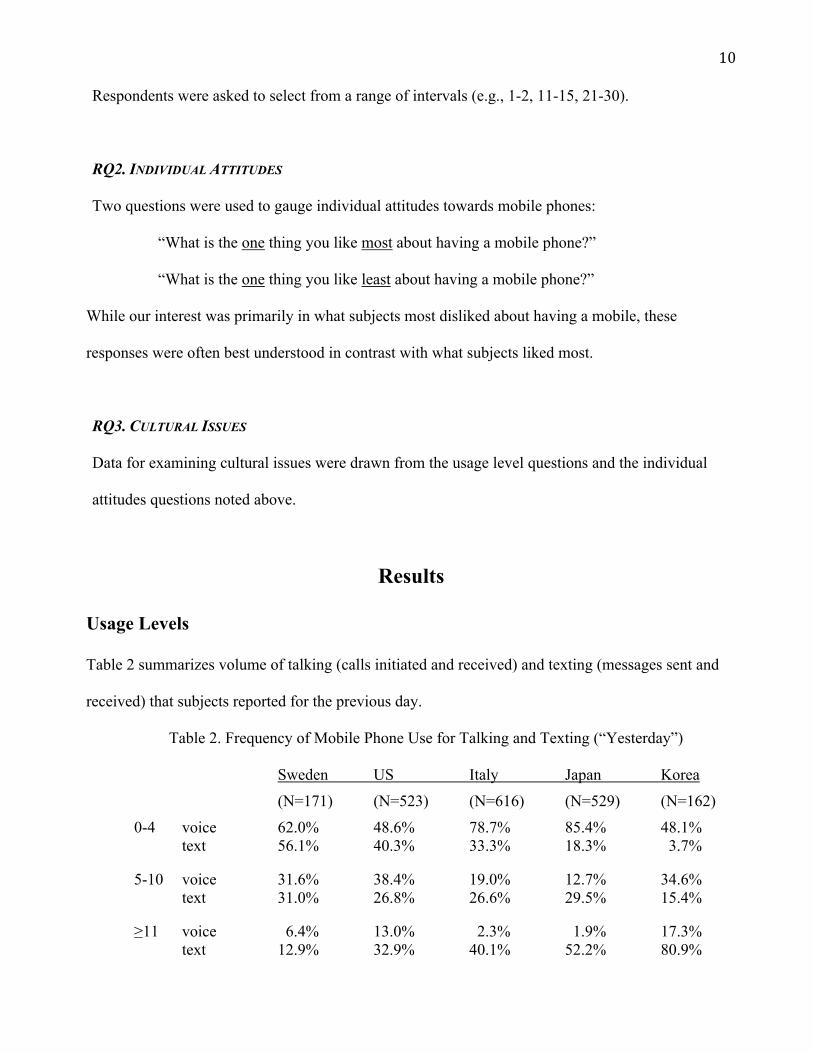
Table 2 summarizes volume of talking (calls initiated and received) and texting (messages sent and
received) that subjects reported for the previous day.
Table 2. Frequency of Mobile Phone Use for Talking and Texting (“Yesterday”)
Sweden US Italy Japan Korea
(N=171) (N=523) (N=616) (N=529) (N=162)
0-4 voice 62.0% 48.6% 78.7% 85.4% 48.1% text 56.1% 40.3% 33.3% 18.3% 3.7% 5-10 voice 31.6% 38.4% 19.0% 12.7% 34.6% text 31.0% 26.8% 26.6% 29.5% 15.4%
≥11 voice 6.4% 13.0% 2.3% 1.9% 17.3% text 12.9% 32.9% 40.1% 52.2% 80.9%
11
(>30)* voice (0.0%) (1.2%) (0.2%) (0.6%) (1.9%) text (1.2%) (11.3%) (16.9%) (16.1%) (43.8%)
*Data from the last column (>30) are included in the tally for ≥11.
Mobile phones were used more heavily for texting than for talking. Americans (13.0%) and Koreans
(17.3%) were more likely than subjects from other countries to report making and/or receiving ≥11
voice calls a day (“yesterday”). However, very few subjects from any country reported making or
receiving >30 calls.
High-volume texting was more common in all countries except Sweden. While 12.9% of
Swedes said they sent or received ≥11 text messages, 80.9% of Koreans gave this response. The most
prolific texters (>30 texts per day) were Koreans (43.8%), followed by Italians (16.9%) and Japanese
(16.1%).
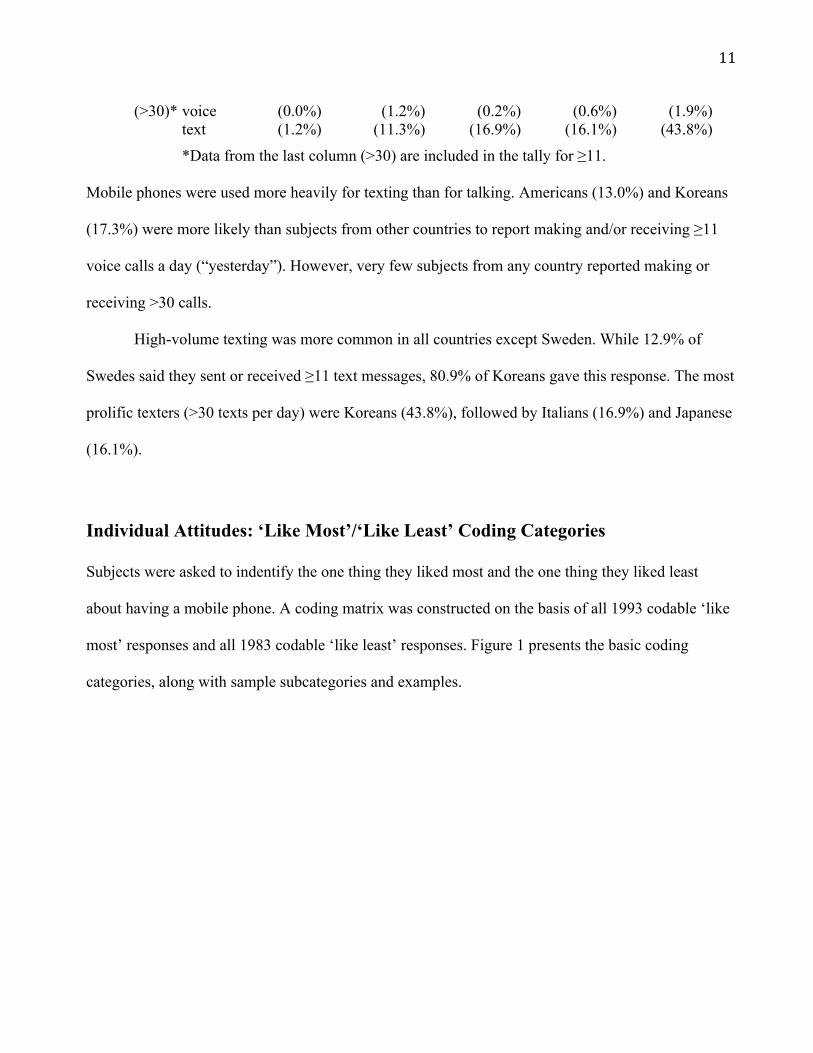
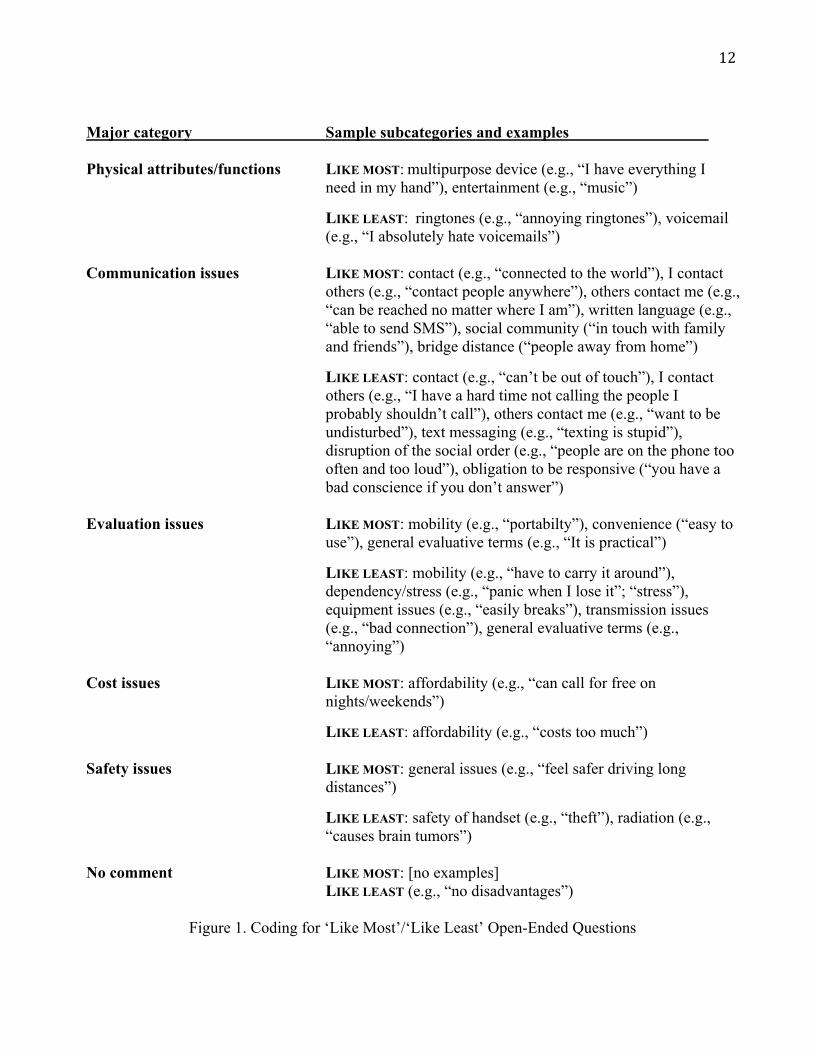
Individual Attitudes: ‘Like Most’/‘Like Least’ Coding Categories
Subjects were asked to indentify the one thing they liked most and the one thing they liked least
about having a mobile phone. A coding matrix was constructed on the basis of all 1993 codable ‘like
most’ responses and all 1983 codable ‘like least’ responses. Figure 1 presents the basic coding
categories, along with sample subcategories and examples.
12
Major category Sample subcategories and examples Physical attributes/functions LIKE MOST: multipurpose device (e.g., “I have everything I
need in my hand”), entertainment (e.g., “music”)
LIKE LEAST: ringtones (e.g., “annoying ringtones”), voicemail (e.g., “I absolutely hate voicemails”)
Communication issues LIKE MOST: contact (e.g., “connected to the world”), I contact
others (e.g., “contact people anywhere”), others contact me (e.g., “can be reached no matter where I am”), written language (e.g., “able to send SMS”), social community (“in touch with family and friends”), bridge distance (“people away from home”)
LIKE LEAST: contact (e.g., “can’t be out of touch”), I contact others (e.g., “I have a hard time not calling the people I probably shouldn’t call”), others contact me (e.g., “want to be undisturbed”), text messaging (e.g., “texting is stupid”), disruption of the social order (e.g., “people are on the phone too often and too loud”), obligation to be responsive (“you have a bad conscience if you don’t answer”)
Evaluation issues LIKE MOST: mobility (e.g., “portabilty”), convenience (“easy to
use”), general evaluative terms (e.g., “It is practical”)
LIKE LEAST: mobility (e.g., “have to carry it around”), dependency/stress (e.g., “panic when I lose it”; “stress”), equipment issues (e.g., “easily breaks”), transmission issues (e.g., “bad connection”), general evaluative terms (e.g., “annoying”)
Cost issues LIKE MOST: affordability (e.g., “can call for free on
nights/weekends”)
LIKE LEAST: affordability (e.g., “costs too much”) Safety issues LIKE MOST: general issues (e.g., “feel safer driving long
distances”)
LIKE LEAST: safety of handset (e.g., “theft”), radiation (e.g., “causes brain tumors”)
No comment LIKE MOST: [no examples] LIKE LEAST (e.g., “no disadvantages”)
Figure 1. Coding for ‘Like Most’/‘Like Least’ Open-Ended Questions
13
Coding was done independently by two researchers, with differences resolved through
consultation. In cases involving potential translation issues, fluent bilinguals were consulted.
Because subjects were free to write whatever they wished, some responses were found to
address more than one issue, and therefore might be appropriate for multiple coding categories. For
cases in which two categories were conjoined (e.g., “convenience and security”), the first category
mentioned was chosen. In other instances, two concepts were intertwined. Consider one Swedish
subject’s response to the ‘like least’ question:
“I get a little stressed when it calls all the time. I feel forced to answer because the number gets shown as a missed call.”
This reply might be coded either as Dependency/Stress (a subcategory of Evaluation) or as
Obligation to be Responsive (a subcategory under Communication). Coding decisions were made on
the basis of what appeared to be the principal idea (here, the obligation to respond), even if the
secondary idea (stress – part of the Dependency/Stress subcategory) appeared first in the sentence.
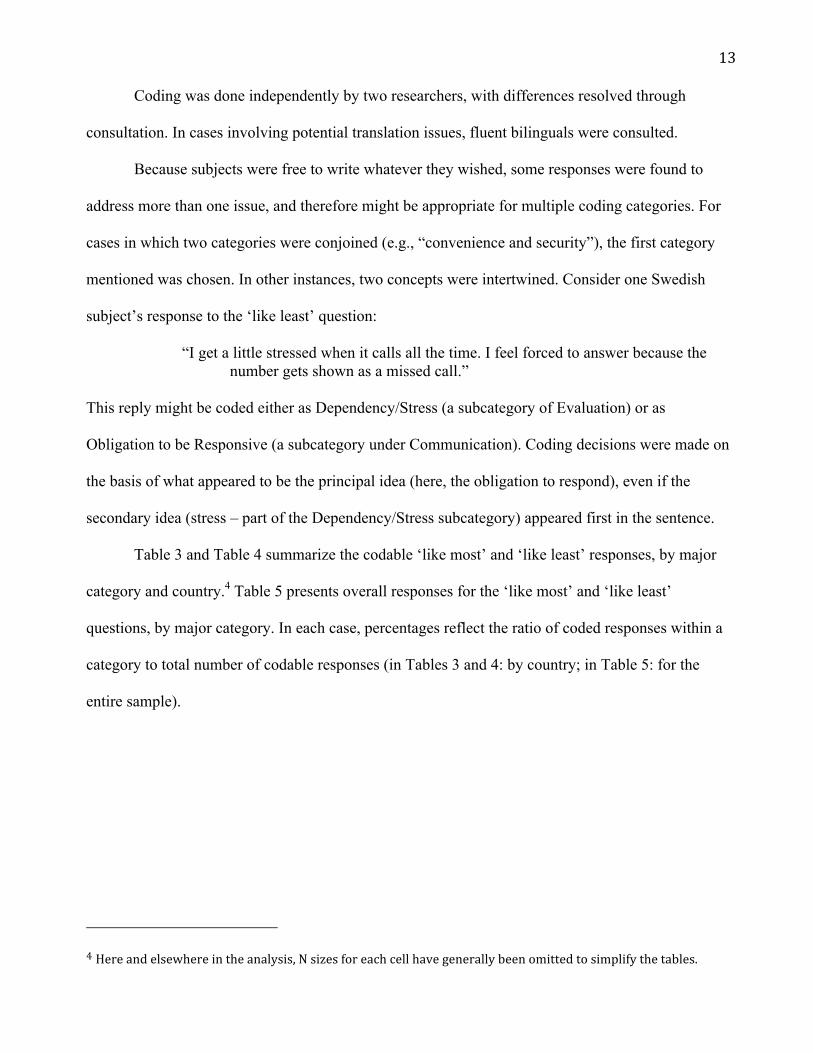
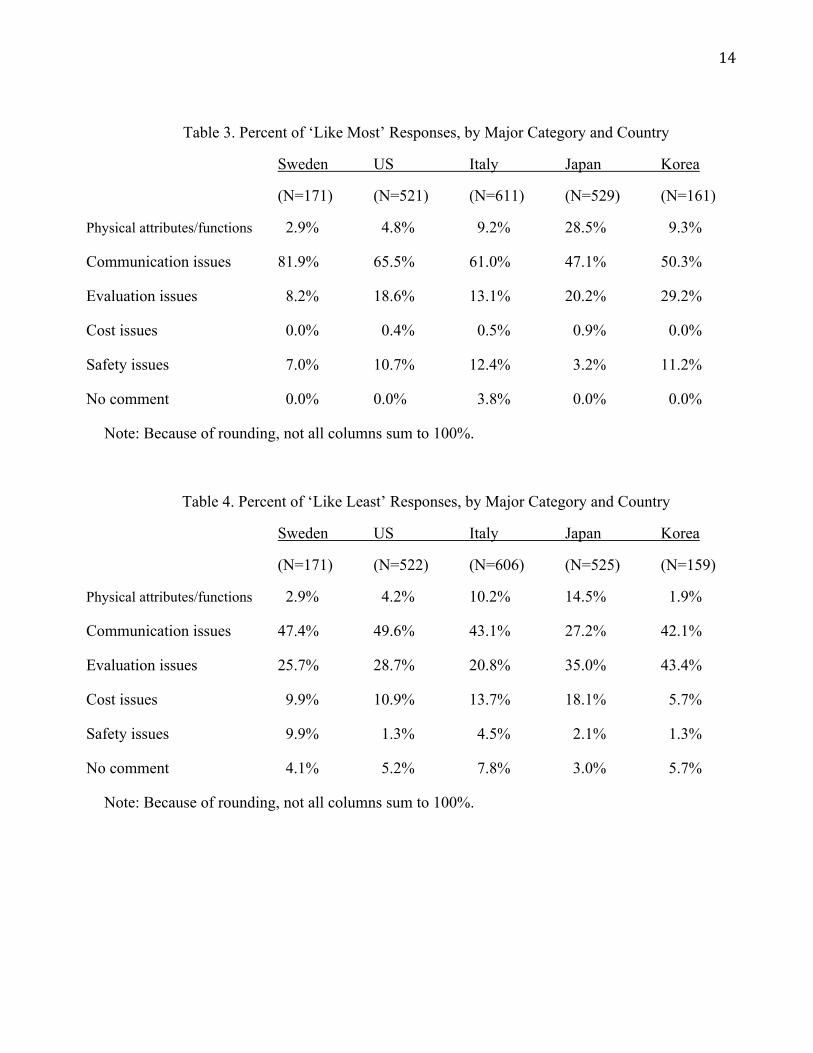
Table 3 and Table 4 summarize the codable ‘like most’ and ‘like least’ responses, by major
category and country.4 Table 5 presents overall responses for the ‘like most’ and ‘like least’
questions, by major category. In each case, percentages reflect the ratio of coded responses within a
category to total number of codable responses (in Tables 3 and 4: by country; in Table 5: for the
entire sample).
4Hereandelsewhereintheanalysis,Nsizesforeachcellhavegenerallybeenomittedtosimplifythetables.
14
Table 3. Percent of ‘Like Most’ Responses, by Major Category and Country
Sweden US Italy Japan Korea
(N=171) (N=521) (N=611) (N=529) (N=161)
Physical attributes/functions 2.9% 4.8% 9.2% 28.5% 9.3%
Communication issues 81.9% 65.5% 61.0% 47.1% 50.3%
Evaluation issues 8.2% 18.6% 13.1% 20.2% 29.2%
Cost issues 0.0% 0.4% 0.5% 0.9% 0.0%
Safety issues 7.0% 10.7% 12.4% 3.2% 11.2%
No comment 0.0% 0.0% 3.8% 0.0% 0.0%
Note: Because of rounding, not all columns sum to 100%.
Table 4. Percent of ‘Like Least’ Responses, by Major Category and Country
Sweden US Italy Japan Korea
(N=171) (N=522) (N=606) (N=525) (N=159)
Physical attributes/functions 2.9% 4.2% 10.2% 14.5% 1.9%
Communication issues 47.4% 49.6% 43.1% 27.2% 42.1%
Evaluation issues 25.7% 28.7% 20.8% 35.0% 43.4%
Cost issues 9.9% 10.9% 13.7% 18.1% 5.7%
Safety issues 9.9% 1.3% 4.5% 2.1% 1.3%
No comment 4.1% 5.2% 7.8% 3.0% 5.7%
Note: Because of rounding, not all columns sum to 100%.
15
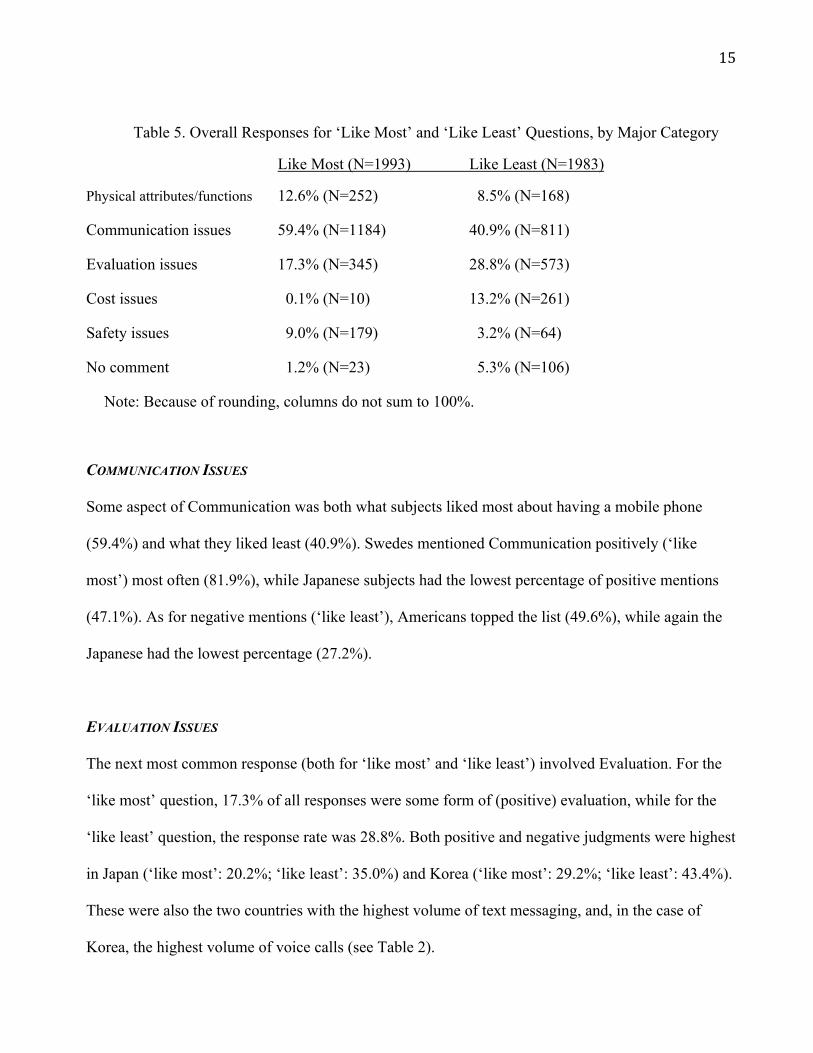
Table 5. Overall Responses for ‘Like Most’ and ‘Like Least’ Questions, by Major Category
Like Most (N=1993) Like Least (N=1983)
Physical attributes/functions 12.6% (N=252) 8.5% (N=168)
Communication issues 59.4% (N=1184) 40.9% (N=811)
Evaluation issues 17.3% (N=345) 28.8% (N=573)
Cost issues 0.1% (N=10) 13.2% (N=261)
Safety issues 9.0% (N=179) 3.2% (N=64)
No comment 1.2% (N=23) 5.3% (N=106)
Note: Because of rounding, columns do not sum to 100%.
COMMUNICATION ISSUES
Some aspect of Communication was both what subjects liked most about having a mobile phone
(59.4%) and what they liked least (40.9%). Swedes mentioned Communication positively (‘like
most’) most often (81.9%), while Japanese subjects had the lowest percentage of positive mentions
(47.1%). As for negative mentions (‘like least’), Americans topped the list (49.6%), while again the
Japanese had the lowest percentage (27.2%).
EVALUATION ISSUES
The next most common response (both for ‘like most’ and ‘like least’) involved Evaluation. For the
‘like most’ question, 17.3% of all responses were some form of (positive) evaluation, while for the
‘like least’ question, the response rate was 28.8%. Both positive and negative judgments were highest
in Japan (‘like most’: 20.2%; ‘like least’: 35.0%) and Korea (‘like most’: 29.2%; ‘like least’: 43.4%).
These were also the two countries with the highest volume of text messaging, and, in the case of
Korea, the highest volume of voice calls (see Table 2).
16
PHYSICAL ATTRIBUTES AND FUNCTIONS
A smaller overall number of comments (positive and negative) were made about Physical Attributes
and Functions (‘like most’: 12.6%; ‘like least’: 8.5%). The Japanese were at least three times as
likely (28.5%) as subjects from the other four countries to mention a physical attribute or function as
what they liked most about having a mobile phone. At the same time, more Japanese identified a
physical attribute or function as what they liked least (14.5%) than subjects in other countries.
Korean responses regarding Physical Attributes and Functions (‘like most’: 9.3%; ‘like least:
1.9%) seem anomalous, since at the time the data were collected, Koreans tended to have
sophisticated mobiles. Possibly the low Korean Attributes/Functions scores for both ‘like most’ and
‘like least’ but high Evaluation scores for both questions reflect issues with literal translation and, as
a result, with coding.
COST ISSUES
Almost no one found Cost to be the factor they liked most about having a phone. For the ‘like least’
question, 13.2% of all responses were complaints about Cost. The Japanese were the most
disgruntled (18.1%), followed by the Italians (13.7%).
To help determine if differential costs between countries might explain ‘like least’ responses,
attempts were made during the focus groups to ascertain the monthly cost of maintaining a mobile
phone. However, almost no one could estimate his or her expenditure. Sometimes subjects didn’t see
their bills. (Their parents were paying.) Other times, the bill contained different types of charges in
different countries. For example, rather than purchasing phones outright (as in the US), Swedes
commonly pay on an installment plan, with the monthly installment folded in with usage fees.
17
Some students (especially in Sweden and Italy) had paid employment, while others
(particularly in Japan) did not. In the larger survey, subjects were asked who paid the phone bill (e.g.,
themselves, their parents). Almost 90% of Swedish subjects reported paying their entire mobile
phone costs (compared with about 15% of Americans, Japanese, and Koreans). However, Swedish
students also receive government stipends, out of which they pay living expenses.
In Japan, complaints might reflect not simply the outlay of money (generally done by parents)
but complexity of the billing process. Most Japanese students had phone subscriptions that included
monthly allocations of texts, minutes for voice calls, and kilobytes for internet use. Overages were
expensive. Students therefore put substantial effort into remaining within their budgeted categories.
The case of Italy is interesting for a different reason. Almost 50% of Italian subjects reported
paying their own phone bill. (The remaining 50% either split costs with parents or had parents
directly paying the bill.) However, informal discussion with Italian academics who were themselves
parents revealed that many Italian parents fund nearly all of their progeny’s expenses in college –
except their phone bills (though they might provide a monthly allowance through which their
children pay the mobile bill). The goal is to teach young people fiscal responsibility. One result,
apparently, is that Italian university students complain about phone costs.
Given such variance in financial circumstances, along with lack of information on actual
costs, comparison of Cost issues across countries proved challenging.
SAFETY ISSUES
Aggregate responses involving Safety Issues are somewhat misleading. While overall, 9.0%
identified safety as what they liked most and only 3.2% as what they liked least, there was
considerable variation across countries. In Japan, 3.2% of responses to the ‘like most’ question
involved safety, perhaps reflecting Japan’s traditionally low crime rate. By contrast, for the ‘like
18
least’ question, 9.9% of Swedes expressed concern over safety issues. However, all Swedish
responses (N=17) involved radiation. Informal observation by the author suggested that far more
Swedes used headsets (enabling them to keep the phone away from their ear) than people in the other
countries. Such behavior might be in response to Swedish research correlating brain damage in rats
with exposure to mobile phone electromagnetic fields (e.g., Salford et al., 2003).
Individual Attitudes: More Points of Conflict
We have seen that Communication was both what people liked most and liked least about mobile
phones. The same conundrum (though with smaller numbers) applied to Japanese attitudes regarding
Physical Attributes and Functions. In this section, we continue examining the issue of conflicting
attitudes by focusing on three areas: Texting, Reachability, and Freedom versus Entrapment.
TEXTING
One subcategory under Communication was Texting. Typical ‘like most’ answers were
“To be able to send SMS” “Saved SMS” “Exchange pleasant text messages”
while ‘like least’ responses included
“Miscommunication while texting” “Typing is too much of a bother” “Texting is stupid”
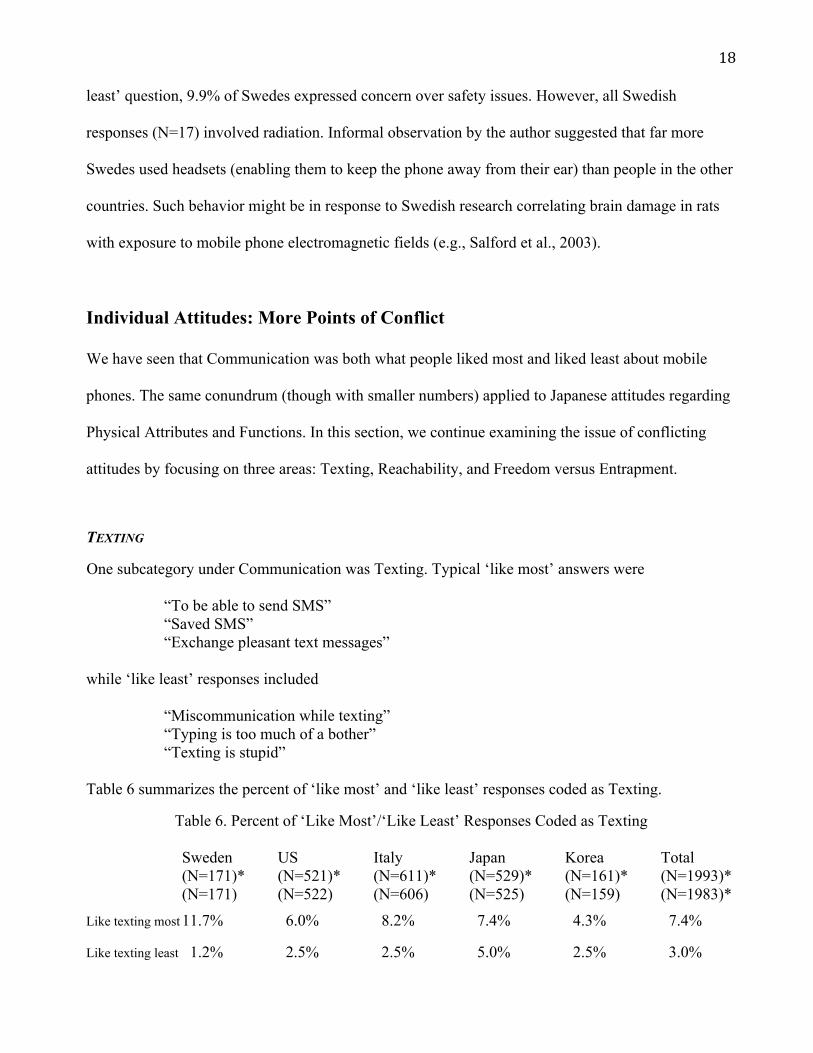
Table 6 summarizes the percent of ‘like most’ and ‘like least’ responses coded as Texting.
Table 6. Percent of ‘Like Most’/‘Like Least’ Responses Coded as Texting
Sweden US Italy Japan Korea Total (N=171)* (N=521)* (N=611)* (N=529)* (N=161)* (N=1993)* (N=171) (N=522) (N=606) (N=525) (N=159) (N=1983)*
Like texting most 11.7% 6.0% 8.2% 7.4% 4.3% 7.4%
Like texting least 1.2% 2.5% 2.5% 5.0% 2.5% 3.0%
19
* NOTE: The first number refers to total ‘like most’ responses; the second number refers to total ‘like least’ responses.
Between 4.3% (Korea) and 11.7% (Sweden) of subjects indicated texting as what they liked most
about having a mobile phone. Although the number of subjects complaining about texting (‘like
least’) was small (between 1.2% in Sweden and 5.0% in Japan), the fact they complained at all bore
further investigation.
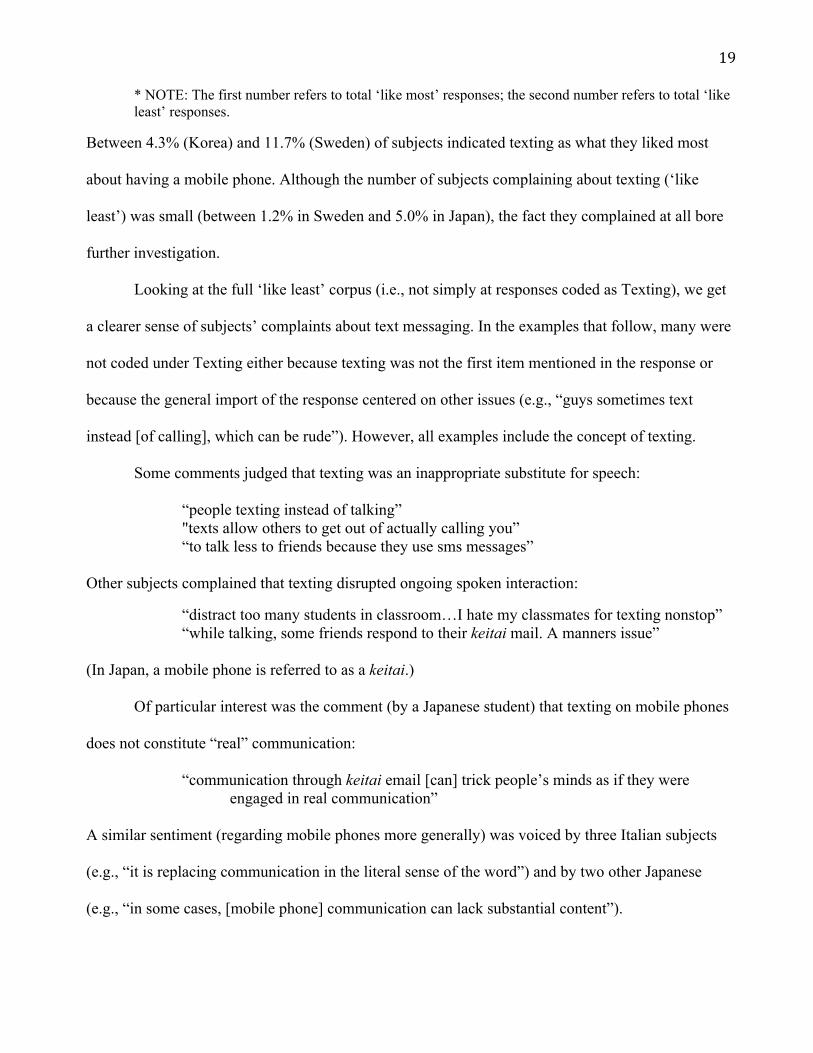
Looking at the full ‘like least’ corpus (i.e., not simply at responses coded as Texting), we get
a clearer sense of subjects’ complaints about text messaging. In the examples that follow, many were
not coded under Texting either because texting was not the first item mentioned in the response or
because the general import of the response centered on other issues (e.g., “guys sometimes text
instead [of calling], which can be rude”). However, all examples include the concept of texting.
Some comments judged that texting was an inappropriate substitute for speech:
“people texting instead of talking” "texts allow others to get out of actually calling you” “to talk less to friends because they use sms messages” Other subjects complained that texting disrupted ongoing spoken interaction:
“distract too many students in classroom…I hate my classmates for texting nonstop” “while talking, some friends respond to their keitai mail. A manners issue” (In Japan, a mobile phone is referred to as a keitai.) Of particular interest was the comment (by a Japanese student) that texting on mobile phones
does not constitute “real” communication:
“communication through keitai email [can] trick people’s minds as if they were engaged in real communication”
A similar sentiment (regarding mobile phones more generally) was voiced by three Italian subjects
(e.g., “it is replacing communication in the literal sense of the word”) and by two other Japanese
(e.g., “in some cases, [mobile phone] communication can lack substantial content”).
20
For both the ‘like most’ and ‘like least’ questions, a number of responses addressed the
written aspects of texting. On the positive side, subjects commented on such issues as speed (e.g., “to
be able to send messages in a quick manner”), concision (e.g., “to be able to communicate with
friends via sms messages, few words and concise concepts”), and the advantage of having a written
record (e.g.,“can save past keitai email”). But there were also complaints. An Italian noted that
“writing sms messages makes me forget how to spell”, and nine Japanese students referred to
difficulty inputting messages, e.g.,
“too much of a pain in responding to keitai email” “compared with a computer, it’s hard to type on keitai” “I cannot use certain kanji [Chinese characters]”
Finally, subjects commented on effects they felt texting was having on personal interactions
with friends and/or family. On the positive side, people mentioned increased communication with
friends and family (e.g., “contact with friends more often thanks to text messages”) as well as the
notion of ‘gifting’ (Taylor & Harper, 2003) (e.g., “like the surprise of getting text messages”).
However, there were also concerns that failure to reply promptly to a text would be perceived as rude
or detrimental to friendships, e.g.,
“people expect you to respond immediately to the messages, and if you don’t, [then] you are rude”
“it’s troublesome to send keitai email but I have to (otherwise people think I’m rude or won’t like me)”
REACHABILITY
Reflecting upon the ‘like most’ and ‘like least’ data, we discerned a general theme of what we called
Reachability, that is, the ability to connect with others or be available for them to connect with you.
Among the ‘like most’ responses we found answers such as
“Can be contacted anywhere” “Connected to the world” “To have an open channel for relations”
21
Among the ‘like least’ answers, we saw responses such as
“Can’t be out of touch” “Just don’t want to be contacted” “Feel stressed and pressured that you must be available” “The possibility of being controlled”
Reviewing data from the major category Communication and from several subcategories under
Evaluation (Mobility, Convenience, Dependency/Stress, Privacy Concerns, Control Issues), we
identified all responses involving Reachability. Table 7 summarizes total Reachability responses.
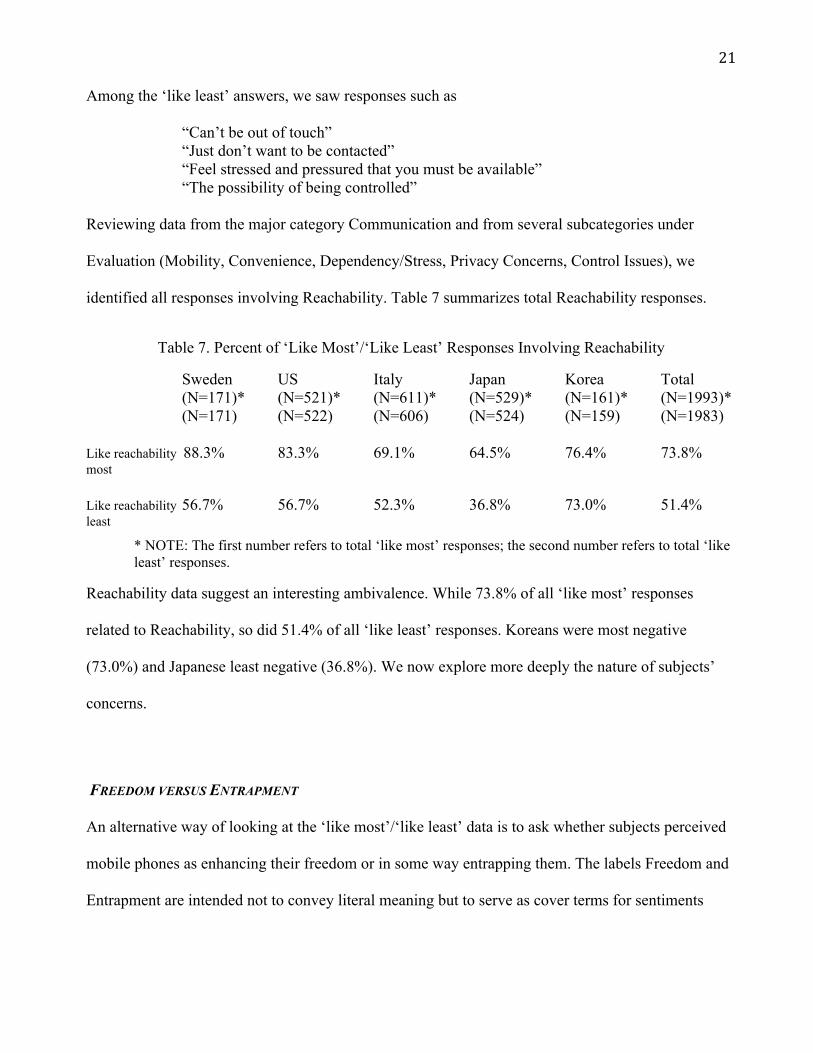
Table 7. Percent of ‘Like Most’/‘Like Least’ Responses Involving Reachability
Sweden US Italy Japan Korea Total (N=171)* (N=521)* (N=611)* (N=529)* (N=161)* (N=1993)* (N=171) (N=522) (N=606) (N=524) (N=159) (N=1983) Like reachability 88.3% 83.3% 69.1% 64.5% 76.4% 73.8% most Like reachability 56.7% 56.7% 52.3% 36.8% 73.0% 51.4% least
* NOTE: The first number refers to total ‘like most’ responses; the second number refers to total ‘like least’ responses.
Reachability data suggest an interesting ambivalence. While 73.8% of all ‘like most’ responses
related to Reachability, so did 51.4% of all ‘like least’ responses. Koreans were most negative
(73.0%) and Japanese least negative (36.8%). We now explore more deeply the nature of subjects’
concerns.
FREEDOM VERSUS ENTRAPMENT
An alternative way of looking at the ‘like most’/‘like least’ data is to ask whether subjects perceived
mobile phones as enhancing their freedom or in some way entrapping them. The labels Freedom and
Entrapment are intended not to convey literal meaning but to serve as cover terms for sentiments
22
involving Contact, Mobility, Convenience, Dependency/Stress, Obligation to be Responsive, and
Disruption of the Social Order (meaning violation of social decorum).
Drawing upon data coded as Communication, we extracted responses explicitly involving
Contact: I Contact Others, Others Contact Me, or Directionality of Contact Not Specified. For
example,
Like most (Freedom) I Contact Others “Talk to whomever I want” Others Contact Me “Can be reached no matter where I am” Directionality Not Specified “Always in contact with people”
Like least (Entrapment)
I Contact Others “I have a hard time not calling the people I probably shouldn’t call” Others Contact Me “Don’t want to be reachable” Directionality Not Specified “Can’t be out of touch”
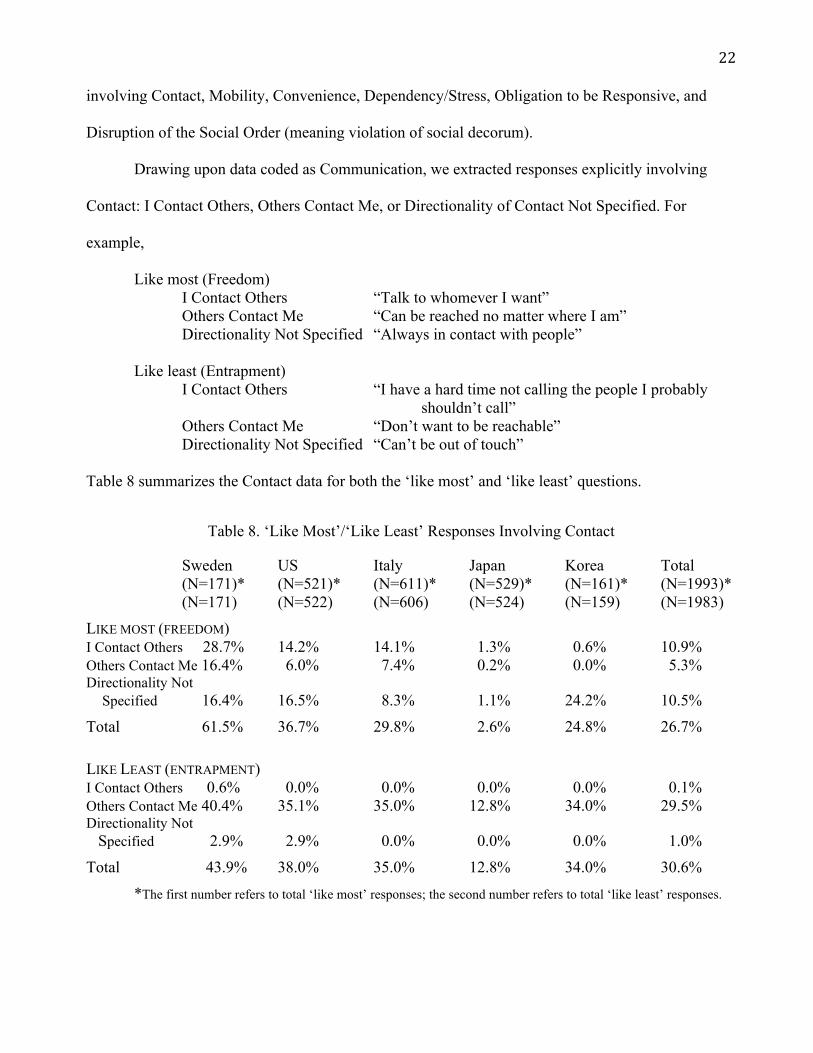
Table 8 summarizes the Contact data for both the ‘like most’ and ‘like least’ questions.
Table 8. ‘Like Most’/‘Like Least’ Responses Involving Contact
Sweden US Italy Japan Korea Total (N=171)* (N=521)* (N=611)* (N=529)* (N=161)* (N=1993)* (N=171) (N=522) (N=606) (N=524) (N=159) (N=1983)
LIKE MOST (FREEDOM) I Contact Others 28.7% 14.2% 14.1% 1.3% 0.6% 10.9% Others Contact Me 16.4% 6.0% 7.4% 0.2% 0.0% 5.3% Directionality Not Specified 16.4% 16.5% 8.3% 1.1% 24.2% 10.5%
Total 61.5% 36.7% 29.8% 2.6% 24.8% 26.7%
LIKE LEAST (ENTRAPMENT) I Contact Others 0.6% 0.0% 0.0% 0.0% 0.0% 0.1% Others Contact Me 40.4% 35.1% 35.0% 12.8% 34.0% 29.5% Directionality Not Specified 2.9% 2.9% 0.0% 0.0% 0.0% 1.0%
Total 43.9% 38.0% 35.0% 12.8% 34.0% 30.6%
*The first number refers to total ‘like most’ responses; the second number refers to total ‘like least’ responses.
23
Considering overall responses involving Contact, the percentages of ‘like most’ (Freedom) and ‘like
least’ (Entrapment) answers were closely matched: 26.7% (‘like most’) versus 30.6% (‘like least’).
For ‘like most”, about the same percent of people gave answers involving their contacting other
people (10.9%) and not specifying the directionality of contact (10.5%). For ‘like least’, the
overwhelming proportion of answers (29.5% out of 30.6%) indicated that what subjects liked least
about mobile phones was other people contacting them.
There was substantial variation across countries. In Sweden, total ‘like most’ responses
involving Contact (61.5%) were almost 30 times as high as in Japan (2.6%). There was also variance
across countries for ‘like least’ responses, but not as great. Complaints about Contact ranged from
43.9% in Sweden to 12.8% in Japan. Note that Contact data are generally similar to the ‘like
most’/‘like least’ findings reported in Tables 3, 4, and 5 regarding Communication, since data coded
under Contact were a subset of Communication.
Beyond the issue of Contact, there are other ways of thinking about Freedom and Entrapment.
For Freedom, we looked at two concepts: Mobility and Convenience, e.g.,
Mobility “Always on me” “I don’t have to find a landline”
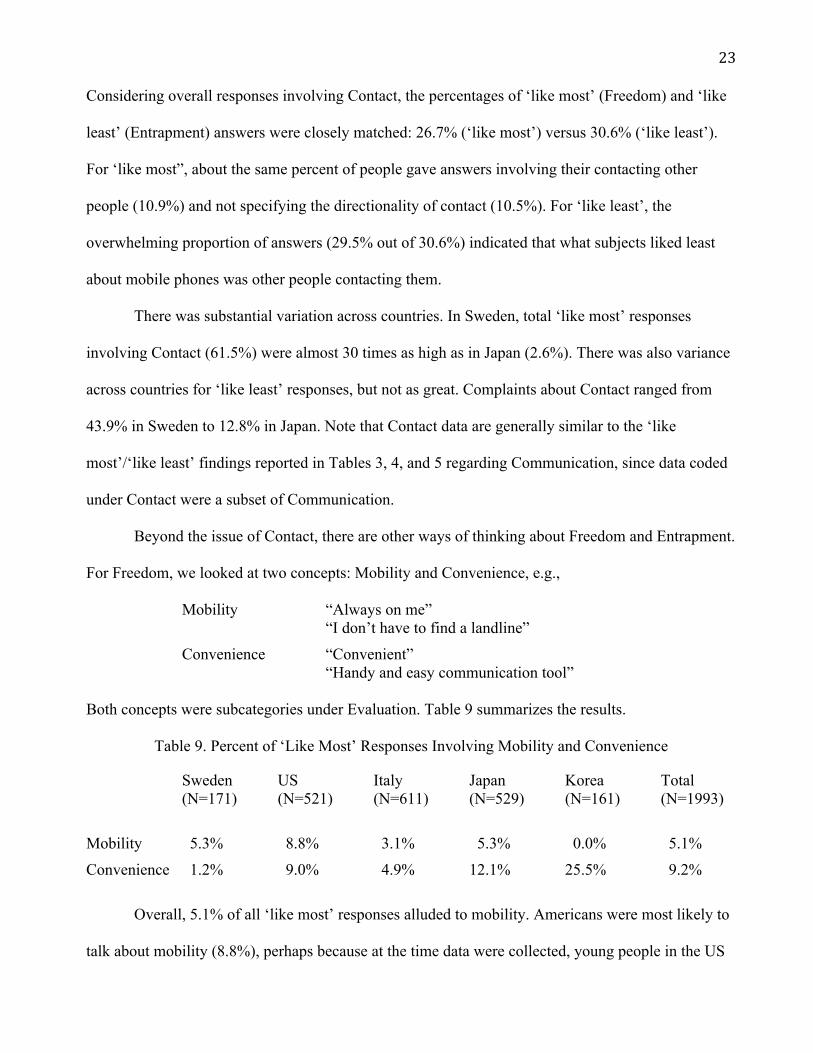
Convenience “Convenient” “Handy and easy communication tool” Both concepts were subcategories under Evaluation. Table 9 summarizes the results.
Table 9. Percent of ‘Like Most’ Responses Involving Mobility and Convenience
Sweden US Italy Japan Korea Total (N=171) (N=521) (N=611) (N=529) (N=161) (N=1993)
Mobility 5.3% 8.8% 3.1% 5.3% 0.0% 5.1%
Convenience 1.2% 9.0% 4.9% 12.1% 25.5% 9.2%
Overall, 5.1% of all ‘like most’ responses alluded to mobility. Americans were most likely to
talk about mobility (8.8%), perhaps because at the time data were collected, young people in the US
24
were transitioning from largely communicating via computer (e.g., using instant messaging) to
growing use of texting on mobile phones, and may have been particularly conscious of phones
affording mobility. Responses for Convenience showed considerable variation, ranging from 1.2% in
Sweden to 25.5% in Korea. Such variation (at least in Korea) might reflect translation issues.
However, it is also important to bear in mind that in both Japan (12.1%) and Korea, phones at the
time were far more likely to have internet connection (and therefore be convenient for many
functions) than in the three western countries.
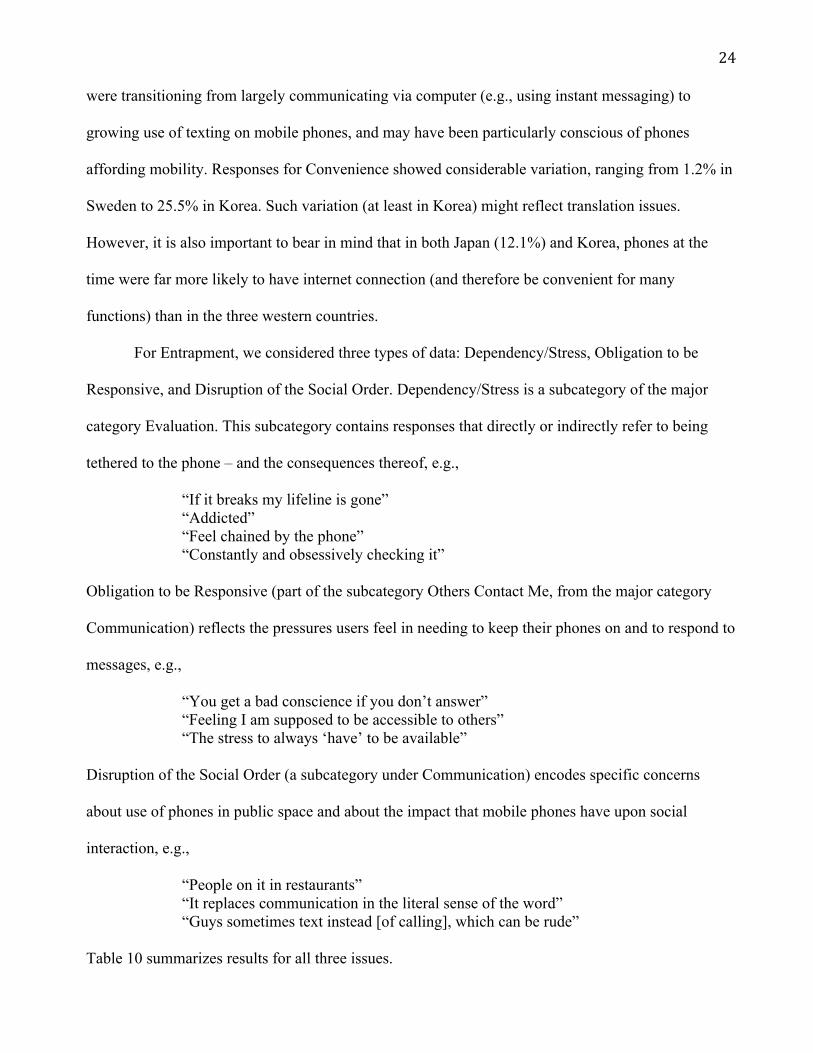
For Entrapment, we considered three types of data: Dependency/Stress, Obligation to be
Responsive, and Disruption of the Social Order. Dependency/Stress is a subcategory of the major
category Evaluation. This subcategory contains responses that directly or indirectly refer to being
tethered to the phone – and the consequences thereof, e.g.,
“If it breaks my lifeline is gone” “Addicted” “Feel chained by the phone” “Constantly and obsessively checking it” Obligation to be Responsive (part of the subcategory Others Contact Me, from the major category
Communication) reflects the pressures users feel in needing to keep their phones on and to respond to
messages, e.g.,
“You get a bad conscience if you don’t answer” “Feeling I am supposed to be accessible to others” “The stress to always ‘have’ to be available” Disruption of the Social Order (a subcategory under Communication) encodes specific concerns
about use of phones in public space and about the impact that mobile phones have upon social
interaction, e.g.,
“People on it in restaurants” “It replaces communication in the literal sense of the word” “Guys sometimes text instead [of calling], which can be rude” Table 10 summarizes results for all three issues.
25
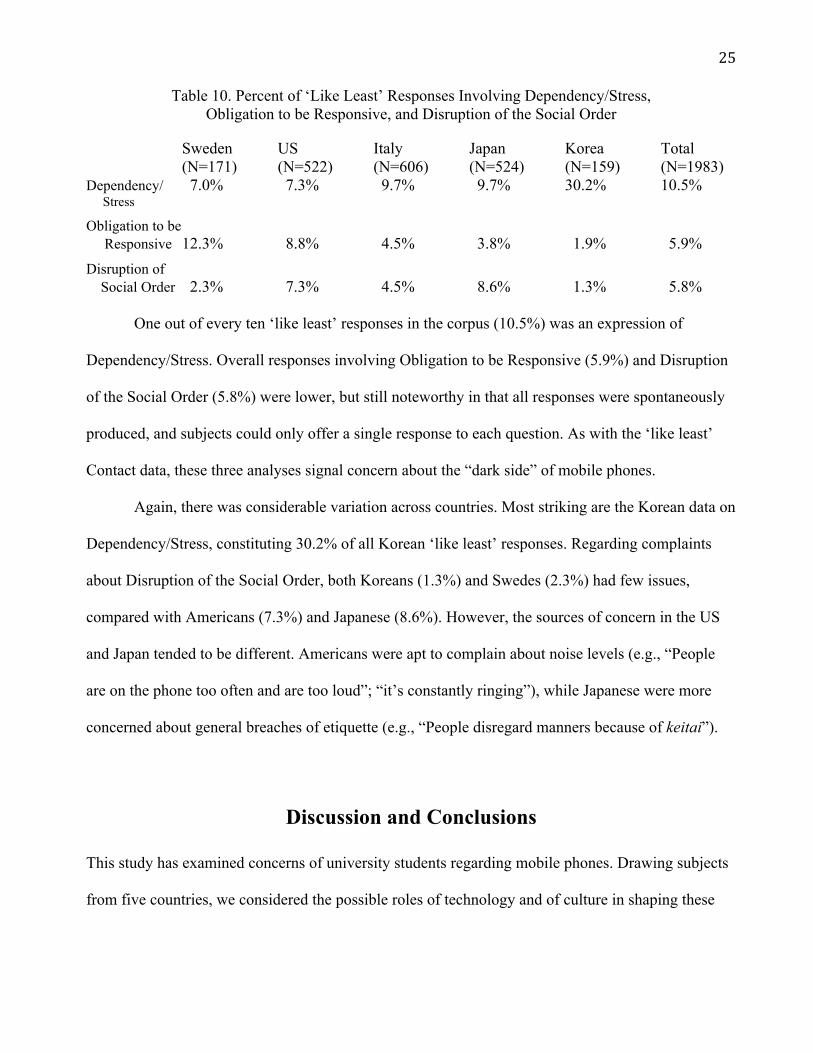
Table 10. Percent of ‘Like Least’ Responses Involving Dependency/Stress, Obligation to be Responsive, and Disruption of the Social Order
Sweden US Italy Japan Korea Total (N=171) (N=522) (N=606) (N=524) (N=159) (N=1983) Dependency/ 7.0% 7.3% 9.7% 9.7% 30.2% 10.5% Stress
Obligation to be Responsive 12.3% 8.8% 4.5% 3.8% 1.9% 5.9% Disruption of Social Order 2.3% 7.3% 4.5% 8.6% 1.3% 5.8%
One out of every ten ‘like least’ responses in the corpus (10.5%) was an expression of
Dependency/Stress. Overall responses involving Obligation to be Responsive (5.9%) and Disruption
of the Social Order (5.8%) were lower, but still noteworthy in that all responses were spontaneously
produced, and subjects could only offer a single response to each question. As with the ‘like least’
Contact data, these three analyses signal concern about the “dark side” of mobile phones.
Again, there was considerable variation across countries. Most striking are the Korean data on
Dependency/Stress, constituting 30.2% of all Korean ‘like least’ responses. Regarding complaints
about Disruption of the Social Order, both Koreans (1.3%) and Swedes (2.3%) had few issues,
compared with Americans (7.3%) and Japanese (8.6%). However, the sources of concern in the US
and Japan tended to be different. Americans were apt to complain about noise levels (e.g., “People
are on the phone too often and are too loud”; “it’s constantly ringing”), while Japanese were more
concerned about general breaches of etiquette (e.g., “People disregard manners because of keitai”).
Discussion and Conclusions
This study has examined concerns of university students regarding mobile phones. Drawing subjects
from five countries, we considered the possible roles of technology and of culture in shaping these
26
attitudes. Student estimates of their volume of talking and text messaging provided points of
comparison between attitudes and amount of telephonic activity.
We now look, in turn, at concerns shared across countries, situations in which technological
issues may explain national differences, and then at cases in which culture may be the relevant
variable. Our discussion draws upon both the data presented here as well as data from other questions
in the larger survey. We conclude with suggestions for future research, along with reflections on the
significance of studying the “dark side” of mobile telephony.
Shared Attitudes: Perpetual Contact
Katz & Aakhus (2002) have argued that the logic informing personal communication technologies
(including mobile phones) is that of perpetual contact. And indeed, nearly 60% of our subjects
indicated that Communication what they liked most about mobile phones. Considering the broader
category Reachability, the total ‘like most’ score was even higher (73.8%). Moreover,
Communication was the most common ‘like most’ response in each country.
However, perpetual contact proved a double-edged sword. Overall, 42.1% of subjects saw
Communication as what they liked least about mobile phones, with the ‘like least’ Reachability score
rising to 51.4%. The conundrum regarding mobiles is consonant with attitudes concerning use of
computers for interactive purposes. On the one hand, registration on Facebook (a platform generally
accessed on computers) has soared to 500 million people (Zuckerberg, 2010); on the other, some
young people are abandoning social networking sites in favor of more face-to-face interaction
(Hafner, 2009). Similarly, while mobile phone subscriptions number in the billions, some users are
intentionally not replacing mobiles when they are stolen (Friedman, 2006) or refusing to buy one in
the first place.
27
Yet these cases are generally the exceptions. In the words of James Katz, "You're a problem
for other people if you don't have a mobile phone" (Weiner, 2007). Among young adults, being “a
problem for other people” may have less to do with inconveniencing others than with jeopardizing
personal social standing.
The Role of Technology
Technological considerations, rather than culture, may explain some of the cross-national differences
we observed. We look here at issues involving Texting and those relating to Physical Functions and
Attributes.
TEXTING
Responses coded as Texting (a subcategory of Communication) constituted 7.4% of all ‘like most’
answers. Some of the variation across countries may reflect differences in available technology.
Sweden, for example, had the highest percent of ‘like most’ responses involving texting (11.7%),
although Swedes reported the lowest use of text messaging. (Sweden also had the highest ‘like most’
scores on Communication, Reachability, and Contact.) At the time data were collected, outside of
using the address book, camera, radio, or MP3 player, there was relatively little else Swedish
students did with their phones besides talking and texting. (Very few had internet access.) This
reality is reflected in the low percentage of Swedes’ ‘like most’ responses entailing Physical
Attributes and Functions (2.9%).
‘Like most’ texting data from Korea further caution us that open-ended questions may prove
challenging to interpret. Koreans reported the heaviest use of text messaging. However, in their ‘like
most’ responses, only 4.3% (lowest of all countries) mentioned texting. At the same time, however,
25.5% of Korean ‘like most’ responses referred to Convenience – more than twice as high as Japan
28
(12.1%) and more than 20 times higher than Sweden (1.2%). Arguably, given the intensity with
which Koreans texted, the medium was now taken for granted (therefore not requiring naming),
while a functional correlate of texting (here, Convenience) was seen as noteworthy.
More easily interpretable are cross-country differences in ‘like least’ responses involving
texting. While the numbers were small, Japanese were twice as likely to complain about Texting
(N=26) as students in any other country. Some of this disquietude may stem from the complexity of
keitai input. To type a message, users must move between screens for kanji (Chinese characters),
hiragana (one syllabary), katakana (a second syllabary), and romaji (the Roman alphabet).
This interpretation is supported by data from another question in the survey that asked how
important it was to call a friend rather than send a text message because texting takes too much
effort. For Japanese subjects, 52.6% reported this was a “very important” reason – despite the fact the
Japanese made relatively few calls. The next two highest cohorts were Korea (24.1%) and the US
(23.7%). With these two countries, there may (again) be a technological explanation. While not as
complex as Japanese phones, Korean phones require users to shift between hangul (the Korean
syllabary) and the Roman alphabet. In the US, though there is a single keyboard, Americans had only
recently become heavy users of text messaging, and they may have still found the system
cumbersome.
PHYSICAL FUNCTIONS AND ATTRIBUTES
The Japanese were most likely to mention Physical Functions and Attributes as what they liked most
about mobile phones (28.5%). This finding is consistent with the fact that Japanese keitai appeared to
have the largest range of features and functions. Interest in such features may be spurred by the fact
that in Japan, mobile phone models (like many Japanese products) change frequently.
29
One-third (9.5%) of these ‘like most’ responses referred to the fashionable nature of phones
(e.g., “stylish”, “color”, “design”) – the highest percentage of the five countries.5 Japanese
participants were also the most vocal about functions involving internet connectivity. Of the 18 total
‘like most’ responses referring to internet connectivity, 17 were from Japanese. All Japanese subjects
had internet access – unlike their western counterparts. Some Japanese ‘like most’ responses referred
to the internet in general, but others specifically mentioned accessing bus schedules, mapping
connections on the complex Tokyo subway system, visiting dating sites, or watching TV.
At the same time, the Japanese were most negative about Physical Attributes and Functions
(14.5% of all ‘like least’ responses, compared with the cross-country total of 8.5%). Some complaints
were about phones having too many functions or about the functions being too complicated to
understand, e.g.,
“multiple functions but most of which I don’t use” “The more functions we have, the more confusing it becomes” “too complicated and hard to master how to use it”
Complaining about “feature overload” is hardly unique to Japanese university students. Addressing
this issue, American handset distributors now offer very basic models, generally intended for older
users. However, what Japanese 18-24 year-olds are telling us is that some members of their
generation also don’t wish to be burdened by a profusion of options.
The Role of Culture
To consider the role culture may play in shaping concerns about mobile phones, we cast the
discussion in social/psychological terms: the impact of mobiles on interpersonal behavior and the
impact on individuals.
5The next highest group mentioning fashion was Italians – with only 3.3% of their ‘like most’ responses.
30
On three measures – Communication, Reachability, and Contact – Japan stands out from
other countries in its low level of complaint (‘like least’) regarding the way phones lead to perpetual
contact:
Communication: 27.2% of Japanese ‘like least’ responses (total for all countries: 40.9%)
Reachability: 36.8% of Japanese ‘like least’ responses (total for all countries: 51.4%)
Contact: 12.8% of Japanese ‘like least’ responses (total for all countries: 30.6%)
Sociocultural research will need to confirm whether there is a dimension to Japanese culture that
inhibits people from complaining about being available to potential interlocutors.
It will also be instructive to explore whether such a cultural pattern applies to a larger region
(here, encompassing Japan and Korea). At first blush, the ‘like least’ picture for Korea closely
resembles that of the three western countries, i.e., Communication: 42.1%; Reachability: 73.0%;
Contact: 34.0%. In fact, the Korean Reachability score is the highest of all five countries – though
largely because Reachability includes the subcategory Dependency/Stress, for which Korean
responses were a notable 30.2% of all their ‘like least’ replies. (We return to Dependency/Stress in
the next section.)
However, when we look at data from additional questions, we find relevant similarities
between Japan and Korea. Complaints (‘like least’) about an Obligation to be Responsive were lower
in Japan (3.8%) and Korea (1.9%) than in Sweden (12.3%), the US (8.8%), and Italy (4.5%).6
Additional evidence for an east/west distinction comes from another question on the survey: In
deciding to text rather than call, how important is the rationale “I want to make my message short,
and talking takes too long”? In Sweden, the US, and Italy, between 33.9% and 37.9% of subjects
found this a “very important” reason, compared with only 11.1% of Koreans and 12.7% of Japanese.
6 To understand why Italian complaints about an obligation to respond were much lower than those of Swedes and Americans, we would need to compare social norms for conversation in the three countries.
31
(Pilot testing of the survey, along with focus group discussions, confirmed that university students
interpret this question to mean that by texting, they can control the interaction, not having to listen –
perhaps at length – to what might be on the other person’s mind.) Again, future research will be
needed to establish whether a sense of obligation to give interlocutors a hearing is more a feature of
contemporary eastern (rather than western) cultural norms.
Obligations to listen – and respond – have an interpersonal aspect, but also reflect individual
perception of appropriate personal behavior. Another category with both interpersonal and individual
dimensions is Disruption of the Social Order.
Both Americans (7.3%) and Japanese (8.6%) were more likely than students in other
countries to indicate that what they ‘liked least’ involved Disruption of the Social Order (again,
meaning violation of social decorum). However, we saw that while Americans tended to comment on
noise, Japanese talked about more general breaches of etiquette. The difference between American
and Japanese concerns also surfaced in the word association task (part of the larger study, in which
participants were asked for the first three words that came to mind when thinking about mobile
phones). In those data, 1.7% of all US responses (N=26) were coded Loud/Noisy, compared with
only 0.1% in Japan (N=1). As for etiquette issues, the only subjects to talk about Bad Manners in the
word association task were Japanese (0.8% of all their word association responses, N=13).
A number of Japanese ‘like least’ responses explicitly mentioned “rude” or “nuisance”
behavior. The word in Japanese is meiwaku. The notion of meiwaku behavior is an important part of
Japanese culture. Children are taught from an early age not to engage in meiwaku behavior. It is
therefore not surprising to find university-aged subjects invoking a concept inculcated since
childhood.
An unambiguously personal issue is feeling trapped by the mobile phone. We labeled this
phenomenon Dependency/Stress. In Sweden, the US, Italy, and Japan, ‘like least’ responses ranged
32
between 7.0% and 9.7%. These numbers (independent from ‘like least’ responses involving
Communication and Contact, though included in Reachability) indicate that unprompted, students
report feeling stressed by their phones, finding themselves both dependent upon mobiles for
communication (and social community) and trapped by them.
The situation seems worst in Korea, where 30.2% of all ‘like least’ responses involved
Dependency/Stress. We have already observed that Koreans reported the highest rates of both talking
and texting. Logically, intense usage might lead to perceived entrapment. Future research will be
needed to investigate if there is a cultural explanation for the high usage level in Korea.
Alternatively, as usage rates (particularly for texting) increase in countries such as the US, we might
anticipate levels of Dependency/Stress will rise as well.
Suggestions for Future Research
The larger study of which the ‘like most’/‘like least’ questions were part included a combination of
targeted questions (e.g., “Who pays your mobile phone costs?”), a word association task, and open-
ended questions (e.g., the ‘like most’/‘like least’ questions). While open-ended questions are a
challenge to code – and to interpret – they free us from pre-judging what subjects might want to say
about mobile telephony. With the present data now in hand, future studies might construct specific
attitudinal questions, which could be measured quantitatively (e.g., “Does your mobile phone cause
you stress?”; “When you receive a text message, do you feel obligated to respond immediately?”)
It will also be important to expand the nature and range of subjects studied. Research
limitations restricted the present study to a convenience sample rather than a random sample, which
would have been methodologically preferable, particularly regarding gender balance. Such
constraints also limited the study to university students, though a broader variety of subjects (with
33
respect to age, education, and economic status) would be desirable. Moreover, it would be useful to
include subjects from other parts of the world, including the Middle East and Africa.
Finally, future research is needed to keep pace with the evolution of phone technology (and
uptake) that has occurred since these data were collected. In the US, for example, the current
profusion of 3G phones has made internet access extremely common among university students.
Moreover, the popularity of full QUERTY keypads (real or virtual) has simplified textual input for
Americans, probably contributing to the skyrocketing use of texting. More generally, as technology
evolves, we can anticipate that what users see as the primary functions of their phones, and what they
like and dislike about the devices, may shift as well.
Significance of Studying the “Dark Side” of Mobile Phones
A number of mobile phone users are clearly troubled by the psychological burden of always needing
to be available to their social network. Equally important is the less frequent (though worrisome)
observation several participants made that mobile phones don’t afford “real” communication.
Some ‘like least’ comments were of a general nature (e.g., “it is replacing communication in
the literal sense of the term”), while others singled out text messaging as not constituting “real”
communication (“communication through keitai mail [can] trick people’s minds as if they were
engaged in real communication”). These remarks parallel observations made by people who have
abandoned online social networking sites such as Facebook or MySpace, e.g.,
[In quitting MySpace and Facebook] I’m not sacrificing friends, because if a picture,
some basic information about their life and a web page is all my friendship has become,
then there was nothing to sacrifice to begin with (Some tech-gen youth go offline, 2006).
34
At the same time, at least in the west, social networking is still largely a computer-based
activity. As a technology, mobile phones differ from computers in several significant ways that help
explain some of the particular concerns our subjects voiced about mobiles.
First, when working on computers, we generally back up files or entrust network providers
with the task. With mobile phones, your data (e.g., address book, saved text messages) are literally in
your hand: If the phone is broken, lost, or stolen, you may lose your “files”, which can generate
stress. While data backup on modern phones is possible, very few people do it.
Second, we don’t use computers while walking down the street and generally, not while
sitting with a friend at a restaurant. As a result, our risk of walking into a lamppost or alienating the
friend dining with us is relatively small. By contrast, we potentially carry mobile phones everywhere,
increasing the chances of our experiencing bodily harm or compromising a relationship.
Third, and most importantly, we carry mobile phones on our person – and, in most cases, they
are turned on. Consequently, mobiles increase the social pressure (compared with computers) to
respond immediately, thus generating the kind of ‘like least’ responses we observed: feelings of
stress and complaints about needing to always be reachable.
Why study the “dark side” of mobile phones? If we worry about possible effects of phone
transmission signals on our brains or about the dangers of texting while driving, then we need data
before trying to convince people to change their usage practices. Just so, if we are concerned about
potential negative effects of mobile phones on our social and psychological wellbeing, we need to
document user attitudes before attempting to alter behavior patterns.
Mobile technology will continue to evolve, in ways we can hardly imagine. But whatever else
happens, usage is unlikely to decrease. This study has demonstrated that despite enthusiasm for
connectivity, users are troubled by the consequences of reachability, including a feeling of
entrapment and a sense that mobile phones may actually be reducing substantive communication. It
35
remains to be seen how users will cope with this conundrum. Presently, the answer for some appears
to be feelings of stress or anxiety. Another alternative is learning when to turn the phone off. As
mobile devices become increasingly ubiquitous, our greatest challenge may be figuring out how to
achieve personal and social balance with our availability to others.
References
Agar, J. (2003). Constant touch: A global history of the mobile phone. Duxford, Cambridge: Icon
Books, Ltd.
American College of Emergency Physicians Foundation (n.d.). Text messaging: Emergency
physicians express safety concerns as kids go back to school. Available at
http://www.emergencycareforyou.org/YourHealth/InjuryPrevention/Default.aspx?id=1240
Baron, N.S. (2002). Who sets email style: Prescriptivism, coping strategies, and democratizing
communication access. The Information Society 18, 403-413.
Baron, N.S. (2008). Always on: Language in an online and mobile world. New York: Oxford.
Baron, N.S. (2010). Mobile phones in cross-cultural context: Sweden, Estonia, the USA, and Japan.
Introduction to themed section of New Media & Society 12(1), 3-11.
Baron, N.S. (In Press). Attitudes towards mobile phones: A cross-cultural comparison. To appear in
H. Greif, L. Hjorth, A. Lasen, & C. Lobet (Eds.), Cultures of Participation. Berlin: Peter Lang.
Baron, N.S., & Campbell, E. (Under Review). Talking takes too long: Gender and cultural patterns in
mobile telephony.
Baron, N.S., & Hård af Segerstad, Y. (2010). Cross-cultural patterns in mobile phone use: Public
space and reachability in Sweden, the US, and Japan. New Media & Society 12(1), 13-34.
36
Beranuy, M., Oberst, U., Carbonell, X., & Chamarro, A. (2009). Problematic Internet and mobile
phone use and clinical symptoms in college students: The role of emotional intelligence.
Computers in Human Behavior 25, 1182-1187.
Boase, J., & Ling, R. (In Progress). Self-report vs. log data in measuring mobile phone usage.
Chabris, C., & Simons, D. (2010). The invisible gorilla. New York: Crown.
Donner, J. (2007). The rules of beeping: Exchanging messages via intentional "missed calls" on
mobile phones. Journal of Computer-Mediated Communication 13(1). Available at
http://jcmc.indiana.edu/vol13/issue1/donner.html
Friedman, T. (2006). The taxi driver. New York Times Op-Ed, November 1.
Haddon, L. (Ed.) (2005). International collaborative research: Cross-cultural differences and
cultures of research. COST Action 269.
Hafner, K. (2009). To deal with obsession, some defriend Facebook. New York Times, December 21,
p. A14.
Herbert, Bob (2010). Tweet less, kiss more. New York Times Op-Ed, July 16, p. A19.
Hubbard, A., Han, H.L., Kim, W., & Nakamura, L. (2007). Analysis of mobile phone interruptions in
dating relationships: A face threatening act. Paper presented at the Annual Conference of the
International Communication Association, San Francisco, CA, May 24-28.
Humphreys, L. (2005). Cellphones in public: Social interaction in a wireless era. New Media &
Society 7(6), 810-833.
Hyman, I.E., Boss, S.M., Wise, B.M., McKenzie, K.E., & Caggiano, J.M. (2009). Did you see the
unicycling clown? Inattentional blindness while walking and talking on a cell phone. Applied
Cognitive Psychology 24(5), 597-607.
ITU (2009). Market information and statistics. January. Available at
http://www.itu.int/ITUD/ict/statistics/
37
Katz, J. (Ed.) (2008). Handbook of mobile communication. Cambridge (MA): MIT Press.
Katz J., & Aakhus, M. (2002). Conclusion: Making meaning of mobiles – a theory of apparatgeist. In
J. Katz & M. Aakhus (Eds.), Perpetual contact: Mobile communication, private talk, public
performance, pp. 301-318. Cambridge: Cambridge University Press.
Lenhart, A., Ling, R., Campbell, S., & Purcell, K. (2010). Teens and mobile phones. Pew Internet &
American Life Project, April 20. Available at
http://www.pewinternet.org/~/media//Files/Reports/2010/PIP-Teens-and-Mobile-2010.pdf
Ling, R. (2004). The mobile connection: The cell phone’s impact on society. San Francisco: Morgan
Kaufmann.
Ling, R., & Baron, N. (In Press). Mobile phones: Communication options and pragmatic choices. To
appear in S. Herring, D. Stein, & T. Virtanen (Eds.), Handbook of the pragmatics of CMC.
Berlin: Mouton de Gruyter.
Ling, R., & Donner, J. (2009). Mobile communication. London: Polity Press.
Livingstone, S. (2003). On the challenges of cross-national comparative media research. European
Journal of Communication 18(4), 477-500.
Madden, M., & Lenhart, A. (2009). Teens and distracted driving. Pew Internet & American Life
Project, November 16. Available at http://www.pewinternet.org/Reports/2009/Teens-and-
Distracted-Driving.aspx
Madden, M., & Rainie, L. (2010). Adults and cell phone distractions. Pew Internet & American Life
Project, June 18. Available at http://www.pewinternet.org/Reports/2010/Cell-Phone-
Distractions.aspx
Nielsenwire (2008). In US, SMS text messaging tops mobile phone calling, September 22. Available
at http://blog.nielsen.com/nielsenwire/online_mobile/in-us-text-messaging-tops-mobile-phone-
calling/
38
Powers, W. (2010). Hamlet’s BlackBerry. New York: HarperCollins.
Salford, L., Brun, A., Eberhardt, J., Malmgren, L., & Persson, B. (2003). Nerve damage in
mammalian brain after exposure to microwaves from GSM mobile phone. Environmental Health
Perspectives 111(7), 881-883.
Some tech-gen youth go offline (2006). Associated Press, October 6. Available at
http://www.wired.com/techbiz/media/news/2006/10/71918
Taylor, A., & Harper, R. (2003). The gift of the gab? A design oriented sociology of young people's
use of mobiles. Journal of Computer Supported Cooperative Work 12(3), 267-296.
Tenner, E. (1996). Why things bite back: Technology and the revenge of unintended consequences.
New York: Vintage Books.
Thomas, F., Haddon, L., Gilligan, R., Heinzman, P., & de Gournay, C. (2005). Cultural factors
shaping the experience of ICTs: An exploratory review. In L. Haddon (Ed.), International
collaborative research: Cross-cultural differences and cultures of research, pp. 13-49. COST
Action 269. Brussels: EU Publications Office.
Weiner, E. (2007). Our cell phones, ourselves. National Public Radio, December 24. Available at:
http://www.npr.org/templates/story/story.php?storyId=17486953
Zuckerberg, M. (2010). 500 million stories. The Facebook Blog, July 21. Available at
(http://blog.facebook.com/blog.php?post=409753352130