Embed Size (px)
Citation preview

The dark side of microrheology: non-optical techniques
Giovanni Vleminckx Christian Clasen∗
November 3, 2014
Abstract
Microrheology probes the mesoscale between bulk rheology, which provides an integral sampleresponse, and nanorheology, which refers to a local response at a molecular confinement level. Theterm ‘microrheology’ is often used to refer to optical particle tracking methods that measure a localresponse of a sample. In contrast to this, non-optical microrheology techniques generally allowtwo different effects to be studied: actual confinement effects on the rheology and boundary effectssuch as slip. Investigating the mesoscale range has additional advantages such as the possibility toperform measurements with small sample volumes and at high shear rates. This review bundles thewide array of non-optical techniques into five categories: adaptations to a conventional rotationalrheometer, sliding plate rheometry on a micrometer scale, microfluidics, piezo vibrators and radialchannel flows. The concept of each set of techniques is described, together with their operationalwindow and examples of recent studies.
1 Introduction
Rheology as the science of flow correlates the deformation and deformation rate history of a material toits state of stress, which is related to the underlying internal microstructure of the fluid or soft solid.Bulk rheological measurements probe an overall mechanical response of a sample on a macroscopic leveland allow an interpretation of the results with respect to a known or assumed microstructure and itsevolution. However, the integral response of a bulk measurement cannot offer any direct information onthe microstructure, which can vary locally [17, 64]. Moreover, bulk measurements fail to characterizethe behavior of fluids under many processing conditions and usage applications that operate under astrong confinement of the fluid and its microstructure. Examples include extrusion, bearing lubrication,inkjet printing, blood flow through capillary veins, or oral processing of food [24]. Consequently, thereis a need to rheologically probe shorter length scales. Molecular thin films of a material can be studiedvia techniques that have been referred to as ‘nanorheology’ [34, 66, 72]: atomic force microscopy (AFM)[77, 81], nanoindentation [96] or with the surface force apparatus (SFA) [54]. Although these approachesexamine a local rheological response, they are aimed at probing an abnormal response of simple fluidson a molecular confinement level, often focussing on the physicochemical interactions with the confiningsubstrate. In contrast to this, flows in a mesoscale range (roughly spanning dimensions of 100 nm-100 µm)are of rheological interest if the bulk flow itself is affected by a confinement. This is not the case forsimple fluids but for complex fluids or soft matter with microstructural length scales comparable to theconfinement (and thus for many industrial processing operations as well as in the field of microfluidics).This range cannot be explored using conventional bulk rheometry nor with nanorheology.
Microrheology aims at closing this gap with experimental research in the mesoscale region. Thereare in principle three classes of effects that are probed with microrheology: actual confinement effectsthat lead to a different rheological response of the whole sample, itself depending on the degree ofconfinement. An example of this would be a confinement induced jamming of particle suspensions,which has been reported to occur for separations between the shearing surfaces smaller than 5 timesthe particle diameter [5]. Secondly, microrheology can probe the local response of a heterogeneoussample. Such a local response (e.g. the medium viscosity in the mesh of a cross-linked hydrogel) canbe different from the response of the bulk sample (the gel itself) but is not necessarily arising from a
∗Department of Chemical Engineering, KU Leuven, Willem de Croylaan 46, 3001 Heverlee, Belgium,e-mail: [email protected], phone: +32 (0) 16 322 354
1
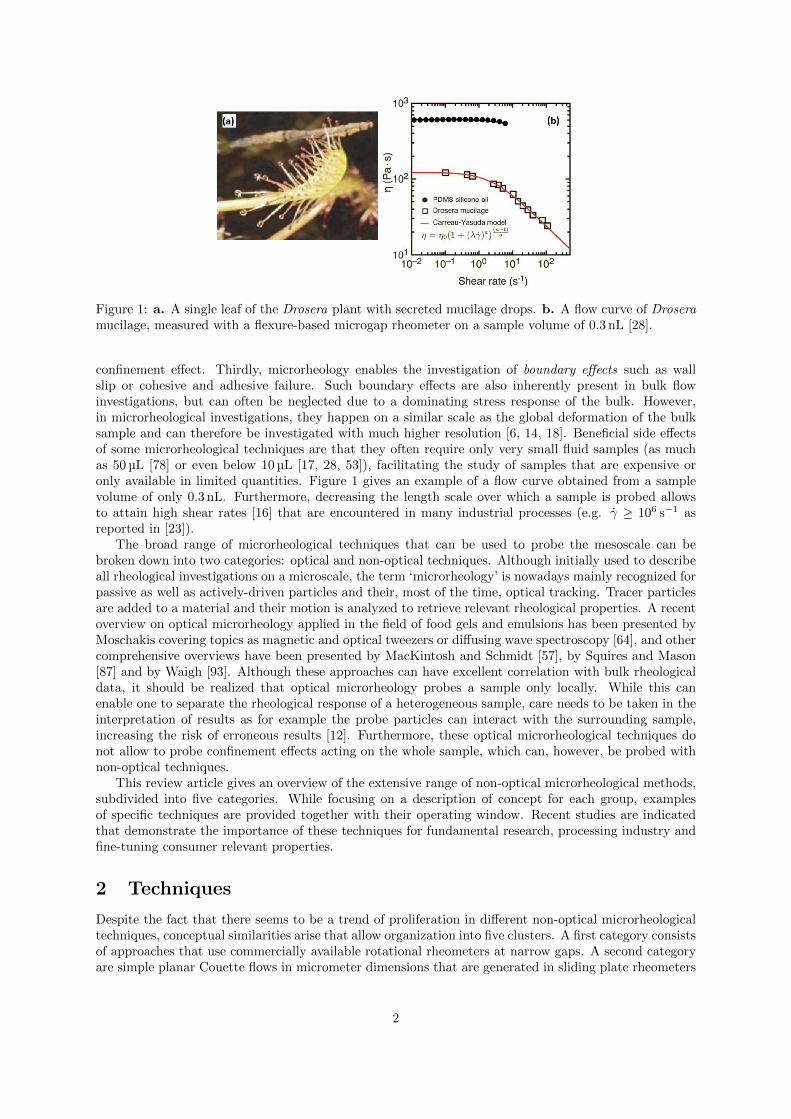
Figure 1: a. A single leaf of the Drosera plant with secreted mucilage drops. b. A flow curve of Droseramucilage, measured with a flexure-based microgap rheometer on a sample volume of 0.3 nL [28].
confinement effect. Thirdly, microrheology enables the investigation of boundary effects such as wallslip or cohesive and adhesive failure. Such boundary effects are also inherently present in bulk flowinvestigations, but can often be neglected due to a dominating stress response of the bulk. However,in microrheological investigations, they happen on a similar scale as the global deformation of the bulksample and can therefore be investigated with much higher resolution [6, 14, 18]. Beneficial side effectsof some microrheological techniques are that they often require only very small fluid samples (as muchas 50 µL [78] or even below 10 µL [17, 28, 53]), facilitating the study of samples that are expensive oronly available in limited quantities. Figure 1 gives an example of a flow curve obtained from a samplevolume of only 0.3 nL. Furthermore, decreasing the length scale over which a sample is probed allowsto attain high shear rates [16] that are encountered in many industrial processes (e.g. γ ≥ 106 s−1 asreported in [23]).
The broad range of microrheological techniques that can be used to probe the mesoscale can bebroken down into two categories: optical and non-optical techniques. Although initially used to describeall rheological investigations on a microscale, the term ‘microrheology’ is nowadays mainly recognized forpassive as well as actively-driven particles and their, most of the time, optical tracking. Tracer particlesare added to a material and their motion is analyzed to retrieve relevant rheological properties. A recentoverview on optical microrheology applied in the field of food gels and emulsions has been presented byMoschakis covering topics as magnetic and optical tweezers or diffusing wave spectroscopy [64], and othercomprehensive overviews have been presented by MacKintosh and Schmidt [57], by Squires and Mason[87] and by Waigh [93]. Although these approaches can have excellent correlation with bulk rheologicaldata, it should be realized that optical microrheology probes a sample only locally. While this canenable one to separate the rheological response of a heterogeneous sample, care needs to be taken in theinterpretation of results as for example the probe particles can interact with the surrounding sample,increasing the risk of erroneous results [12]. Furthermore, these optical microrheological techniques donot allow to probe confinement effects acting on the whole sample, which can, however, be probed withnon-optical techniques.
This review article gives an overview of the extensive range of non-optical microrheological methods,subdivided into five categories. While focusing on a description of concept for each group, examplesof specific techniques are provided together with their operating window. Recent studies are indicatedthat demonstrate the importance of these techniques for fundamental research, processing industry andfine-tuning consumer relevant properties.
2 Techniques
Despite the fact that there seems to be a trend of proliferation in different non-optical microrheologicaltechniques, conceptual similarities arise that allow organization into five clusters. A first category consistsof approaches that use commercially available rotational rheometers at narrow gaps. A second categoryare simple planar Couette flows in micrometer dimensions that are generated in sliding plate rheometers
2

Figure 2: Illustration of a parallel plate geometry in a conventional rotational rheometer with R theradius of the plates, H the gap height, Ω the angular velocity, δφ the misalignment angle and ε the gaperror. a. shows the ideal situation without gap error while b. and c. show issue due to a gap errorduring zero gap determination and measurement respectively [75].
and their derivatives. A broad range of microfluidic devices make up a third group. The final two clusterscontain more exotic devices that are distinct each in their own nature. Although each set of techniqueshas its own limitations or problems, one of the common measurement issues is the decreased applicabilityof the no slip boundary condition. A brief description of wall slip is therefore discussed together withother issues in the first cluster.
2.1 Adaptations to a conventional rotational rheometer
While different techniques have been developed to study the rheology of fluids under high shear or inmicroscale confinement, probably the most accessible route is the adaptation of commercially availablerheometers. Reports on utilizing rotary parallel-plate rheometers operating at micrometer gaps go backto the early 80’s [21, 47, 48] and the idea has been revisited frequently due to the simplicity of thisapproach and the ongoing technical improvements of commercially available rotational rheometers [24,26, 37, 65, 75]. The different approaches can be categorized in two groups: identifying the possible errorsthat will arise when operating parallel-plates at micrometer gap separations (and correcting data forthese errors and/or identifying the experimental limits), and secondly, improving the shear geometriesin order to minimize the errors. The main errors that arise when setting small apparent gaps are bothsystematic errors in the commanded gap of the rheometer, as well as misalignment of the shearing surfacestowards each other (parallelism), the surface alignment towards the rotational axis of the rheometer(perpendicularity) and a possible bending or torsion of the surface itself (flatness) (it should be notedthat the use of the terms parallelism and flatness in rheological literature is ambiguous and also used withregard to the alignment of the rotational axes). Regularly these errors are combined into a total gap errorwith which the apparent gap is corrected in order to determine the actual effective shear rate applied toa sample. Two recent publications by McKinley and co-workers [75] and Stokes and co-workers [24] dealin detail with the errors that arise when using a conventional rheometer in narrow gaps. Non-parallelism,as visible in figure 2, is considered the major contribution to the total gap error ε and is typically foundto be of the order of 5 −50 µm [24].
Improvements of the shear geometries to reduce the effect of non-flatness have been introduced byMackay and co-workers. They showed that it is possible (with a very well-aligned rotational rheometerand specially-machined parallel plates) to perform steady shear experiments down to gaps of 10 µm[37]. They also adjusted the flatness of the shearing surfaces by in situ surface lapping of the rotatingparallel-plates e.g. with diamond paste, and simultaneously reducing the roughness below micron size.[56]. Stokes and co-workers recently presented a study [24] in which they evaluated the capability ofcommercially available rotary rheometers for accessing shearing gaps below 100 µm with parallel platesthat were, however, selected from a number of similar fixtures with regard to their perpendicularityerror. With this they were able to achieve total gap errors as low as ε = 25 µm. Figure 3 shows theirgap-dependent measurement results on a polymer solution and the corresponding gap error correction.
Stokes and co-workers also pointed out that an additional substantial gap error can be induced duringthe procedure applied to determine the zero gap setting of the plates [25]. The squeeze flow of air betweenwell aligned plates can influence the normal force arising during the gap closing which is regularly used
3

Figure 3: a. Flow curves of a 0.625 % aqueous polyacrylamide solution measured in a conventionalrotational rheometer with apparent gap separations from 5 −100 µm by Davies and Stokes [24]. Fromthis they determined a total gap error of ε = 25 µm. b. Correction of the measured viscosity and ratesbased on this total gap error.
4

to determine the touching point of the shearing surfaces.A number of recent studies have used the above mentioned adaptations and gap error corrections
of parallel-plate setups with micrometer gap separations with a focus on studying fluids a high shearrates [23, 24, 46, 60, 75], and on confinement effects [23, 24, 46, 89, 95]. In addition, these setups havebeen used to study small sample volumes [60], and to mimic usage or processing environment conditions[23, 46, 89].
Several researchers have recently investigated the effects of non-parallelism, -flatness and -perpen-dicularity of the parallel plates on the normal stresses determined with rotational plates parallel-platesat small gap separations. The misalignment can cause a lubrication flow that results in an additionalpressure in the small gap that scales (following the Reynolds equation) with the inverse gap to the thirdpower. Both numerical and analytical solutions of the Reynolds equation have been utilized to correctfor the lubrication stresses at small gaps and to still extract the rheological response of the fluid [2–4, 16].A recent parallel plate design utilizes the lubrication pressure to align the rotating parallel plates (ofwhich one can continuously adjust its position) and minimize the parallelism error [15]. Although onlyoperating at high rotation rates, this design was capable to measure at gap separations down to 10 µm,limited only by the non-flatness of the surfaces. Xie et al. [97] used a similar idea of self-aligning oftilting parallel disks via hydrodynamic lubrication, however, not in a rotating mode. They aim wasto measure the pressure drop observed for the radial flow between the two disks in order to determinethe high shear viscosity (the gap separations were limited to > 50 µm). A similarly exotic setup tominimize parallelism and flatness errors has been suggest by Gong and co-workers who introduced theidea to operate the parallel plate geometry of a rotational rheometer with the addition of elastic hydrogelsurfaces. Lubrication flows and the arising normal forces deform the elastic surfaces and level out theirmisalignment [35, 40, 41]. They also suggested the use of osmotic pressure to actively control the gapseparation between the deformable shearing surfaces.
A straightforward way to determine and correct for the gap errors is to assume all gap errors to becombined in an effective extra gap ε that adds to the commanded gap H so that the apparent shear rateγa = ΩR/H (with Ω as the angular velocity) can be corrected to give the true shear rate γtrue = ΩR/(H + ε)
[47]. Measuring the same fluid (for simplicity best a Newtonian one) at the same stress level but withdifferent nominal gaps H enables one to determine the total gap error ε from
1
ηa=
1
ηtrue
[1 +
ε
H
](1)
A linear regression of 1/ηa versus 1/H yields the reciprocal of the true viscosity 1/ηtrue as the interceptand ε/ηtrue from the slope. The quantified total gap error ε (which is normally a systematic error of theused geometry and/or instrument) can then be used in further measurements to correct the data. Anexample of such a correction to study the true flow curve of a polyacrylamide solution at apparent gapsof 5 −100 µm is shown in a study by Davies et al. [24] (see figure 3).
It should be noted that the gap error is generally not induced by operating a device at micrometer gapseparations, but in principle always present and only starts to dominate the apparent shear rate whenthe error reaches a similar dimension as the commanded gap H. A similar ‘ever present’ effect that gainsmore importance when operating at smaller gap settings is slip. Whereas for bulk measurements, no slipis a widely-accepted (and in many cases valid) boundary condition, decreasing the gap separation willeventually lead to a dominating effect of slip on the rheological response [85]. Similar to the gap error,slip is not caused by the small gaps, but rather occurs when a rheological experiment reaches sufficientlyhigh stresses [99]. For a detailed discussion and review on wall slip we refer here to the work of Barnes[7], Buscall [9], Sochi [85] and Prud’homme [99]. Slip phenomena can be subdivided in two categories,i.e. true slip and apparent slip. True slip is considered to be present when there is a discontinuity of thevelocity profile at the wall [10, 82]. On the other hand, a localized region of a higher velocity gradientclose to the wall is called apparent slip, e.g. observed for suspensions and emulsions. [62] Apparentslip can be caused by a variety of mechanisms [85]: depletion of the boundary layer at the wall [86],formation of a lubrication layer [62], or adsorption of a particle layer on the surfaces [83], adhesive failureat the interface [1], cohesive failure near the wall [94] or polymer chain disentanglement [55]. The no slipboundary condition is violated in case of true wall slip but not for apparent slip [7, 85]. Slip is commonlycharacterized by a slip velocity and a slip layer thickness. The slip velocity Vs is the difference betweenthe velocity of the wall and that of the last fluid layer near the wall that behaves as part of the bulk. Atsteady state, this velocity is a function of the stress only [99]. The thickness of the slip layer δ (so the
5

Figure 4: a. Mooney analysis of flow curve data of a 5 wt% aqueous xanthan gum solution obtainedwith shearing gap separations of 5 - 150 µm. Linear regression of data of the apparent shear rate as afunction of the inverse gap (at a constant stress level) using equation 3 yields the bulk shear rate andslip velocity from the y-axis intercept and slope respectively. b. The slip velocity as a function of themeasured stress as determined from the Mooney analysis. The inset shows the bulk shear rate [14].
distance between the wall and the last bulk fluid layer) depends on the slip mechanism and has moleculardimensions for true slip, but can be on the order of 0.1 −10 µm for apparent slip mechanisms [7].
Wall slip can cause significant errors in rheological measurements (e.g. false thixotropy, erroneousyield stress detection) but the effects are often underestimated [9, 85]. As pointed out by Buscall [9], thefractional error e on the viscosity caused by apparent slip, ηa/η−1, can be described in terms of the ratioof the slip layer thickness to the characteristic scale of the measurement geometry and on the relativeviscosity of the system and is given by
e = 1 − ηaη
=ηδ
ηδH + ηδ(2)
where ηδ is the viscosity of the slip layer liquid. Similarly, for true slip this error percentage can beformulated as e = Vs/(γH + Vs). It is obvious that in both case the error induced by slip increases withdecreasing gap. In rheological measurements on a microscale, wall slip is therefore generally not neg-ligible. There are different techniques to eliminate wall slip as much as possible. In some methods,researchers have changed the physical nature of the solid boundaries by changing their surface roughnessor physicochemical properties [76]. Furthermore, choosing a different kind of geometry is also possible,e.g. a vane geometry [7, 9, 85] (although this is then not related to microrheology anymore). In recentmicrorheological studies, rather than attempting to reduce wall slip, researchers have utilized this in-creasing effect of slip with decreasing gap in order to study the slip mechanism in detail. This has beendone for example to investigate the relation between the slip velocity and the shear stress for a yieldstress fluid [14], or to relate slip in polymer melts to a microstructural source [36].
Such a characterization of the wall slip is traditionally done through rheological measurements atdifferent sizes of the characteristic measurement scale for the construction of a Mooney plot [63, 99]. Forthis the apparent shear rate γa is plotted versus the reciprocal of different measurement scales H, butfor a given constant shear stress σ. From
γa = γ +VsH
= γ +σδ
ηδH(3)
one can extract the true shear rate γ from the y-axis intersect and the slope gives the slip velocity Vs (fortrue slip) or the slip layer thickness δ (for apparent slip). The characteristic measurement scale dependson the measurement system, so for microrheology with parallel plates this is the varying gap setting,but it could also be for example the capillary diameter for a (micro-)capillary rheometer [7, 9, 85, 99].A recent example of such a slip analysis, obtained from measurements with absolute micrometer gapsettings from 4.5 to 100 µm is given in figure 4.
It should be noted that it is principally not possible to differentiate between the effects of wall slipand gap error on parallel plate (micro-)rheometry. Equations 1 and 3 use the same fitting procedureof plotting apparent rheological parameters as a function of the inverse gap. While (luckily) both give
6

the sought true rheological parameters from extrapolation, it also means that one cannot distinguishthe cause of the gradient in equations 1 and 3. Unfortunately most of the literature on parallel platemicrorheology is discussed only in terms of either one of the two possible error sources.
In addition to the aforementioned errors, additional effects can arise when measuring with parallelplates at micrometer gap separations. An overview on general errors that are difficult to correct forcan be found in [24]. For these errors, where no corrections are possible, the window of operation inwhich rheological measurements can be trusted needs to be known in order to judge the quality of ameasurement.
One of these error sources is viscous heating. The temperature of the sample can increase whenbeing sheared through the dissipation of energy as heat. At high shear rates and for highly viscousfluids this can lead to a decrease in viscosity with time. Although viscous heating is not necessarilylimited to microgap rheometry, the high deformation rates that can be achieved when approaching smallgap separations increase the chance of viscous heating. On the other hand the small sample volumeencountered in narrow gap rheometry enables a fast heat dissipation to the confining surfaces. Thecompetition of these effects can be captured by the Nahme number that describes the ratio of the timescales for thermal diffusion to viscous heating:
Na =ηβH2γ2
true
kT(4)
where k is the thermal conductivity, T is the temperature and β = dη/dTT/η is the thermal sensitivityof the sample [75]. At low values of Na, viscous heating is negligible. The Nahme number increasesquadratically with both shear rate and gap height. For parallel plate experiments with γ ∼ 1/H theNahme number is therefore independent of the gap setting for a given angular velocity.
Edge effects are of general concern for parallel plate rheometry. The sample shape in between theparallel plates that is ideally cylindrical can differ at higher shear rates. However, edge effects on themeasured viscosity are of the order O (H/R)
4[69] and become therefore negligibly small in narrow gaps.
[75]Similarly, radial migration (and sample loss), due to centrifugal stresses that occur above a critical
shear rate, becomes of less importance when approaching small gaps. The critical rate increases withdecreasing gap (γc ∼ H−
3/2), the effect of centrifugal stresses reduces thus with decreasing gaps. [24, 75]Finally, an apparent increase in viscosity can be observed as a result of secondary flows. Significant
increases in viscosity of Newtonian fluids have been measured when the Reynolds number is getting large:
Re =ργH2
η(5)
where ρ is the density [24]. A critical value of Re = 100 has been reported by Turian for this [90]. Again,for decreasing gaps the value of angular velocity at which this critical value of Re is reached increases sothat secondary flow becomes less important when approaching micrometer gap separations.
The awareness of the above mentioned limitations and possible errors has led to a number of recentstudies that have shown the feasibility of using parallel plates at gap spacings ranging from 1000 µm downto 5 µm. Crawford et al. [23] studied the agglomeration of particles in chemical mechanical polishingslurries, which are used in the semiconductor manufacturing industry to polish electronic materials.Furthermore, in the growing research field of food design, rheology of thin films is becoming increasinglyimportant to correlate food microstructure and composition on one hand and sensory perception on theother hand [46, 89]. The shear rates that are achieved with parallel plate microrheometry can be as highas 105 s−1 and a number of publications focussed on this ‘side effect’ of microrheometry studying thehigh shear behavior of fluids [23, 24, 46, 56, 60, 75, 89].
2.2 Sliding plate rheometry on the micrometer scale
Similar to rotating parallel plates a sliding plate rheometer can in principle be operated as a microrheome-ter by decreasing the gap separating the shearing surfaces. Typically a sliding plate rheometer consistsof two parallel surfaces that move with a translational velocity relative to each other to create a planarCouette flow (as illustrated in figure 5), although the mechanics to move the surfaces and retrieve aresponse differ between techniques [33]. Sliding plate rheometers have recently been used to study the
7

Figure 5: Planar Couette flow between two parallel surfaces moving with a velocity relative to each other[74].
Figure 6: CAD rendering of the flow cell of the FMR micro gap rheometer. Two optical flat glass surfacesconfine the sample. The micrometer gap between the shearing surfaces is aligned using nanopositioningtilt stages and controlled by non-contact distance sensors [74].
gap-dependent behavior in microstructured multiphase fluids [17, 52, 74] or for indirect measurementsof the slip velocity of fluids [14, 36].
In contrast to the simple adaptations to rotational rheometers, distinctively different types of slidingplate rheometers are used. A first type, based on the rheometer designed by Dealy and co-workers[33], is the flexure-based microgap rheometer (FMR) constructed by the groups of Clasen and McKinley[6, 14, 17, 18]. The FMR develops a planar Couette shearing flow (Figure 5) between two optical flats(Figure 6 shows a schematic of the flow cell), which are each attached to a set of independent compoundleaf springs. The gap between the shearing surfaces can be controlled with nano-actuators over a rangeof 1 −150 µm. Non-contact inductive proximity sensors are used to monitor the gap, the parallelism ofthe surfaces and the shear rate and stress via the displacement of the two springs. Additionally, thesecond generation of the FMR, allows simultaneous measurement of the first normal stress difference N1
up to 25 kPa [6].Similar to the FMR, a biaxial shearing cell with a gap separation of 9 µm has recently been developed
by Cohen and co-workers in combination with a confocal microscopy setup [52]. A multi-axis piezo allowsmovement of one shearing surface along all directions while the fluid response is measured by a biaxialforce measurement device (FMD) attached to the second surface. The FMD can reliably measure shearstresses over the range of 0.05 −2000 Pa.
A third type of sliding plate rheometer was recently designed to extract the storage and loss moduliof complex fluids confined between two sliding plates. Based on earlier developments as the oscillatorysliding plate rheometer by Granick and coworkers [72] and Braithwaite and McKinley [8] the currentversion developed by Christopher et al. is described as a micro-electromechanical system oscillatoryshear microrheometer (MEMS-µR) [12]. The device uses a one-dimensional nanopositioner stage, which
8

Figure 7: Example of viscosity curves for skin cream confined in gaps ranging from 13 to 91 µm, measuredin the FMR. Bulk measurements using a cone and plate geometry are added as a solid line. For ease ofvisualization the results are split in two groups with the upper and lower abscissa [19].
applies a linear strain to the sample. The gap height of 1 −10 µm between the shearing surfaces isadjusted by using different polymer spacers. Oscillatory shearing deformation are induced by Jouleheating that drives the holding beams to expand and buckle. By recording the motion with a reflectedlight microscope, both amplitude and phase difference can be used to determine dynamic moduli at anapplied frequency.
Analogous to the errors in conventional rheometers that are used at narrow gap spacings, misalign-ment is the principal source of inaccuracy in sliding plate microrheometry. A tilt angle accuracy hasbeen reported of 0.003° for the FMR [6, 17, 18] and 0.0075° for the biaxial shearing cell [52]. For theMEMS-µR, a compliance in the actuated stage allows for an upward displacement caused by surfacetension [12]. Further gap errors can be caused by dust particles (∼ 5 µm) that are trapped in the narrowgap [17] or the non-flatness of the surfaces [12, 17]. Secondary flows is on the order of the gap heightand can be neglected if the contact area is sufficiently large [17].
Sliding plate rheometers have been deployed successfully in several recent studies. Confinement effectsand yielding phenomena in microstructured emulsions [17] and suspensions [52] have been investigated,as well as steady shear rheology on thin films to detect the onset of non-Newtonian behavior at highshear rates [18]. An example of confinement dependent microrheology of a complex fluid determinedwith a sliding plate rheometer, is given in figure 7. Because of the simple planar Couette flow, also slipphenomena and slip velocities (e.g. for yield stress fluids [14] or polymer melts [36]) have been probed.
2.3 Microfluidics
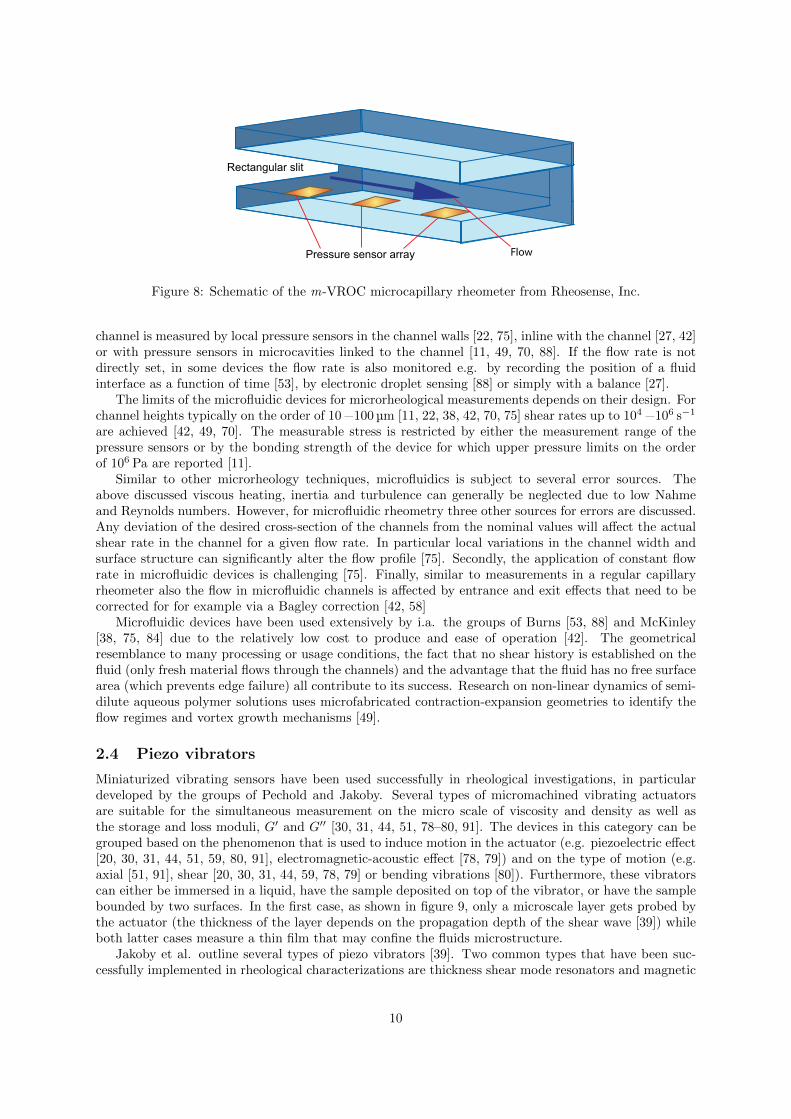
In general, microfluidics is considered to be the handling of small fluid volumes in geometries that have acharacteristic size on the order of 0.1 −100 µm. For microrheometry in the most simple form a microfluidicchannel resembles a miniaturized version of a capillary rheometer in which the pressure drop over achannel section is related to the stress in the fluid, and the volumetric flow rate to the shear rate in thechannel. For the general measuring principles of a capillary rheometer we refer at this point to standardtextbooks [58]. In comparison to bulk capillary rheometers microfluidic rheometers as the commercial onedepicted in figure 8 have several valuable features: low Reynolds number flows, high shear rates and smallsample volumes [11, 42]. In addition to this also the relative easy and cheap production of microfluidicchips has spawned a number of different designs of microfluidic (micro-)rheometers. Although there isa significant number of design parameters that vary between different devices, the general concept isthe same. The channel geometry can be slit shaped [11, 27, 38, 49, 53, 75, 84, 88], square [42, 70] or acombination of a rectangular and a cylindrical shape [22]. The flow in the channels is either generatedunder a constant flow rate [22, 42, 75, 84] or a constant pressure [27, 53]. The pressure drop over the
9
m-VROC measures viscosity from the pressuredrop of a test liquid as it flows through a rectangular slit—a well known scientific application (K. Walters, Rheometry, Chapman and Hall, London, 1975).
As the test liquid is pumped to flow through the flow channel (slit) of the chip, pressure is measured at increasing distances from the inlet.
The slope of the straight line in the plot of pressure vs. sensor position (as shown below) is proportional to the viscosity.
The m-VROC technology offers capabilities that are well beyond the limits of conventional viscometers. The minute sample size (50 µL) needed for measurement is unmatched by any product on the market!
250000
200000
150000
100000
50000
2 4 6 8 10 12
Pres
sure
, Pa
Sensor position, mm
0
0.0
2.0
4.0
6.0
8.0
10.0
10.0 100.0 1000.0 10000.0
10.2 mg/mL
20.3 mg/mL
50.8 mg/mL
102 mg/mL
153 mg/mL
203 mg/mL
Vis
cosi
ty, c
P
Shear rate, 1/s
Pressure sensor array
Rectangular slit
Flow
Pressure vs. Position data for Glycerol
Principle How it works
Load the syringe with sample.
Screw the syringe into the chip enclosure, and place inside the thermal jacket.
Bring down the top of the thermal jacket enclosure, and lock it by turning the black thumb screw clockwise. You are ready to measure your sample!
Step 1
Step 2
Step 3
Figure 8: Schematic of the m-VROC microcapillary rheometer from Rheosense, Inc.
channel is measured by local pressure sensors in the channel walls [22, 75], inline with the channel [27, 42]or with pressure sensors in microcavities linked to the channel [11, 49, 70, 88]. If the flow rate is notdirectly set, in some devices the flow rate is also monitored e.g. by recording the position of a fluidinterface as a function of time [53], by electronic droplet sensing [88] or simply with a balance [27].
The limits of the microfluidic devices for microrheological measurements depends on their design. Forchannel heights typically on the order of 10 −100 µm [11, 22, 38, 42, 70, 75] shear rates up to 104 −106 s−1
are achieved [42, 49, 70]. The measurable stress is restricted by either the measurement range of thepressure sensors or by the bonding strength of the device for which upper pressure limits on the orderof 106 Pa are reported [11].
Similar to other microrheology techniques, microfluidics is subject to several error sources. Theabove discussed viscous heating, inertia and turbulence can generally be neglected due to low Nahmeand Reynolds numbers. However, for microfluidic rheometry three other sources for errors are discussed.Any deviation of the desired cross-section of the channels from the nominal values will affect the actualshear rate in the channel for a given flow rate. In particular local variations in the channel width andsurface structure can significantly alter the flow profile [75]. Secondly, the application of constant flowrate in microfluidic devices is challenging [75]. Finally, similar to measurements in a regular capillaryrheometer also the flow in microfluidic channels is affected by entrance and exit effects that need to becorrected for for example via a Bagley correction [42, 58]
Microfluidic devices have been used extensively by i.a. the groups of Burns [53, 88] and McKinley[38, 75, 84] due to the relatively low cost to produce and ease of operation [42]. The geometricalresemblance to many processing or usage conditions, the fact that no shear history is established on thefluid (only fresh material flows through the channels) and the advantage that the fluid has no free surfacearea (which prevents edge failure) all contribute to its success. Research on non-linear dynamics of semi-dilute aqueous polymer solutions uses microfabricated contraction-expansion geometries to identify theflow regimes and vortex growth mechanisms [49].
2.4 Piezo vibrators
Miniaturized vibrating sensors have been used successfully in rheological investigations, in particulardeveloped by the groups of Pechold and Jakoby. Several types of micromachined vibrating actuatorsare suitable for the simultaneous measurement on the micro scale of viscosity and density as well asthe storage and loss moduli, G′ and G′′ [30, 31, 44, 51, 78–80, 91]. The devices in this category can begrouped based on the phenomenon that is used to induce motion in the actuator (e.g. piezoelectric effect[20, 30, 31, 44, 51, 59, 80, 91], electromagnetic-acoustic effect [78, 79]) and on the type of motion (e.g.axial [51, 91], shear [20, 30, 31, 44, 59, 78, 79] or bending vibrations [80]). Furthermore, these vibratorscan either be immersed in a liquid, have the sample deposited on top of the vibrator, or have the samplebounded by two surfaces. In the first case, as shown in figure 9, only a microscale layer gets probed bythe actuator (the thickness of the layer depends on the propagation depth of the shear wave [39]) whileboth latter cases measure a thin film that may confine the fluids microstructure.
Jakoby et al. outline several types of piezo vibrators [39]. Two common types that have been suc-cessfully implemented in rheological characterizations are thickness shear mode resonators and magnetic
10

Figure 9: Illustration of the shear wave propagation (represented by the decay length of the shear waveδ) through a fluid in contact with a TSM resonator [39]. The high frequencies employed in these devices,lead to only a small (micrometer) penetration depth of the shear wave. For macroemulsions with acharacteristic size of the droplets larger than δ, the sensor will not be affected by the presence of thedroplets and only probe the viscosity of the continuous phase.
Figure 10: Illustration of a plate resonator immersed in the fluid [79]. The metallic resonator is centeredbetween the bottom housing and the top magnet. Vibrations are excited by Lorentz-forces in combinationwith the perpendicularly oriented magnetic field. As a result an electric field is generated in the movingplate and detected in a second loop.
acoustic resonators. Thickness shear mode resonators (TSM) use a quartz disk with electrodes on bothsides. By imposing an AC voltage over these electrodes, vibrations are generated in the disk due to thepiezoelectric effect. When the disk is immersed in a liquid, the viscosity and density can be determinedsince the liquid adds an additional mass and enhances viscous damping of the device. TSM resonatorscan be manufactured to excite axial, shear or bending vibrations. Like vibration due to the piezoelectriceffect, acoustic waves can be generated with magnetic acoustic resonator sensors (MARS), as shown infigure 10. When a static magnetic field is placed next to electrically conducting disks, Lorentz forcesgenerate various mechanical vibration modes. The interaction of the vibrating structure with the fluidis similar to the response in a TSM resonator [39].
The operational window depends on the specific device and cannot be generalized as such. Never-theless, several common ranges can be provided. Due to the integrated nature of these systems, extremeoperating conditions are possible: e.g. high temperatures, broad range of pH-values and high pressures.Compared to conventional rheometers that operate in a frequency range of 10−5 −102 Hz, the microma-chined devices excite vibrations between 10−1 and 105 Hz and can thus also be utilized as high-frequencyrheometers (in addition to their capability to probe small length scales. For systems that investigateconfined samples, gaps in the range of 5 −200 µm have been reported [91]. Applying this technique to dorheological measurements involves correlating the interaction of the sensor and the sample to rheologicalcharacteristics. However, this relation is not trivial [80] and requires most of the time the calibrationwith fluids of known properties [79, 80] to characterize the damped vibration of the surfaces.
Piezo vibrators (PVs) have provided microrheological insight in a number of recent studies. Theycan monitor crystallization through the viscosity of the reaction mixture during zeolite crystal formationin thin layers and fluid volumes [30]. In this application it is key that the device presents an in situ,real-time and non-destructive measurement. In other investigations, PVs have been used to complementmeasurements in a conventional rheometer to expand the frequency range in the determination of dynamic
11

Figure 11: Cross sectional illustration of the PDRFM by Xie et al. [97]
moduli [43, 51, 67, 68, 71, 92] and to access the linear viscoelastic properties of fluids that exhibit shortrelaxation times. Relaxation times as low as 10 µs can be studied, which are comparable to jettingprocesses (30 µs) [91]. Furthermore, piezo axial and rotary vibrators have been used to study in situthe rheology of drying, microscopically thin films [73]. Collin and Martinoty have used a rheometricdevice that relies on the piezoelectric effect to study the effect of confinement on the complex moduli ofliquid-crystal polymers and on polymer melts. They reported a controversial observation for a micro-meter confinement dependent transition from a liquid to a gel-like response for thin samples (< 20 µm)[20, 59]. The discussion of this result sparked a discussion on the possible error sources for non-opticalmicrorheology as for example pointed out by McKenna [61].
2.5 Radial channel flows
The microrheological investigation techniques with rotational or sliding plate rheometers described abovehave with their misalignment error a distinct disadvantage during a shearing deformation. In order toaccommodate this issue, radial flow rheometers have been designed. The constant velocity squeeze flowrheometer (CVSFR) of Yan et al. [98] uses well aligned, roughened parallel plates that squeeze outthe fluid in between with velocities in the range of 50 −600 µm s−1 while monitoring the normal stresswith a piezoelectric force transducer. The device can operate down to confinement levels of 6 −30 µm.Rheological parameters are calculated from the normal stress and the velocity (e.g. via the Stefanequation for Newtonian fluids) [98].
In the self-aligned pressure-driven radial flow microrheometer (PDRFM) of Xie et al. [97] as shownin figure 11, a pair of flat concentric disks is used where the upper surface can bob freely on the fluidfilm. The latter is established by pressurizing the fluid into the gap between the disks through an inletchannel at the center of the bottom surface. The upper disk is pushed down with a constant load andlubrication flows cause a constant gap that can be adjusted via the applied load. The fluid film thicknessis measured and gaps are reported over a range of 55 −152 µm. A maximum steady state tilt angle wasmeasured to be 1.2 × 10⁻⁵ rad [97].
Willenbacher and co-workers have similarly used a ring-slit die in a capillary viscometer to studythe flow-induced aggregation [29, 32, 50]. The piston of the viscometer moves at a constant velocity inthe range of 1 −990 mm min−1 and forces the sample to flow at a constant flow rate through a slit withan adjustable height between 10 and 30 µm. In this setup, the pressure is measured with a transducer,located above the die (as shown in figure 12).
3 Conclusions
The versatility of microrheological techniques has instigated a change in the characterization of complexfluids. Whereas measurements of the bulk rheology have played a dominant role in the past, it has becomeapparent that, depending on the usage or processing conditions, this is insufficient to unravel all thephenomena encountered in real-life applications as well as in fundamental investigations. Microrheology
12

Figure 12: Illustration of the ring-slit device [32].
is one additional tool for more specific investigations. Whereas optical microrheology focuses on localdynamics and properties of a sample, the non-optical techniques discussed here allow to probe bulksamples while taking one or more relevant dimensions to the microscale. This can be a confinement of thesample: in a comparison between two different types of mayonnaise, Clasen et al. found no difference inthe bulk rheology of natural and fat free types using a conventional cone and plate rheometer, concludingthat both were designed to have the same macroscopic shear flow behavior. However, utilizing a slidingplate rheometer on a microscopic scale, the measurements revealed a difference in the interaction ofthe microstructure with the confining geometry, possibly accounting for the difference in texture andmouthfeel [13]. Similarly the use of microrheology has been advocated by Stokes and coworkers, whostate that confined Carbopol suspensions reveal a solid-like behavior of the gel with decreasing gap [24].Other applications of non-optical microrheology include the improved investigation of boundary layereffects of bulk samples as slip [14], stick, [17] or yield layers [19]. In addition to rheological effects thatare directly probed by microrheological measurements, other perks have equally been illustrated. Forinstance, the rheology of minute amounts of spider silk or drosera plant mucus has been investigatedat large deformation rates, comparable to the strains encountered in vivo [28]. As a matter of fact,the low availability of fluid extracted from the spider’s silk gland would render characterization using aconventional bulk rheometer impossible [45].
There is no straightforward choice from the broad range of non-optical microrheological techniques.The type of sample (e.g. availability, interfacial properties) and the desired information (e.g. propertiesakin to a certain process, fundamental properties for modeling) play a crucial role in this decision. Formost investigations however, microrheology will complement measurements of bulk properties.
Acknowledgement
The authors would like to acknowledge the research foundation Flanders (FWO, Project No. G.0543.10N)for financial support.
References
[1] Anastasiadis, S. H., and Hatzikiriakos, S. G. The work of adhesion of polymer/wall interfacesand its association with the onset of wall slip. Journal of Rheology 42, 4 (July 1998), 795–812.
[2] Andablo-Reyes, E., de Vicente, J., and Hidalgo-Alvarez, R. On the nonparallelism effectin thin film plateplate rheometry. Journal of Rheology 55, 5 (July 2011), 981–986.
[3] Andablo-Reyes, E., Hidalgo-Alvarez, R., and de Vicente, J. A method for the estimationof the film thickness and plate tilt angle in thin film misaligned plateplate rheometry. Journal ofNon-Newtonian Fluid Mechanics 165, 19-20 (Oct. 2010), 1419–1421.
13

[4] Andablo-Reyes, E., Hidalgo-Alvarez, R., and de Vicente, J. Controlling friction usingmagnetic nanofluids. Soft Matter 7, 3 (2011), 880–883.
[5] Baik, S. J. Microrheological Investigation of Sheared Thin Films with Complex Structure. PhDthesis, KU Leuven, 2011.
[6] Baik, S. J., Moldenaers, P., and Clasen, C. A sliding plate microgap rheometer for thesimultaneous measurement of shear stress and first normal stress difference. The Review of scientificinstruments 82, 3 (Mar. 2011), 035121.
[7] Barnes, H. a. A review of the slip (wall depletion) of polymer solutions, emulsions and parti-cle suspensions in viscometers: its cause, character, and cure. Journal of Non-Newtonian FluidMechanics 56, 3 (Mar. 1995), 221–251.
[8] Braithwaite, G., and McKinley, G. Microrheometry for studying the rheology and dynamicsof polymers near interfaces. Appl. Rheol, February (1999), 27–33.
[9] Buscall, R. Letter to the Editor: Wall slip in dispersion rheometry. Journal of Rheology 54, 6(Oct. 2010), 1177–1183.
[10] Cheikh, C., and Koper, G. Stick-Slip Transition at the Nanometer Scale. Physical Review Letters91, 15 (Oct. 2003), 156102.
[11] Chevalier, J., and Ayela, F. Microfluidic on chip viscometers. The Review of scientific instru-ments 79, 7 (July 2008), 076102.
[12] Christopher, G. F., Yoo, J. M., Dagalakis, N., Hudson, S. D., and Migler, K. B.Development of a MEMS based dynamic rheometer. Lab on a chip 10, 20 (Oct. 2010), 2749–57.
[13] Clasen, C. A new Flexure-based Microgap Rheometer (FMR) Case Study : Microrheology ofMayonnaise. Rheo-Future Young Scientist Award 2002 (2002).
[14] Clasen, C. Determining the true slip of a yield stress material with a sliding plate rheometer.Rheologica Acta 51, 10 (Aug. 2012), 883–890.
[15] Clasen, C. A self-aligning parallel plate (SAPP) fixture for tribology and high shear rheometry.Rheologica Acta 52, 3 (Feb. 2013), 191–200.
[16] Clasen, C. High shear rheometry using hydrodynamic lubrication flows. Journal of Rheology 57,1 (Nov. 2013), 197–221.
[17] Clasen, C., Gearing, B. P., and McKinley, G. H. The flexure-based microgap rheometer(FMR). Journal of Rheology 50, 6 (2006), 883–905.
[18] Clasen, C., Kavehpour, H. P., and Mckinley, G. H. Bridging Tribology and Microrheologyof Thin Films. Rheologica Acta 20, 4 (2010), 1–13.
[19] Clasen, C., and McKinley, G. H. Gap-dependent microrheometry of complex liquids. Journalof Non-Newtonian Fluid Mechanics 124, 1-3 (Dec. 2004), 1–10.
[20] Collin, D., and Martinoty, P. Dynamic macroscopic heterogeneities in a flexible linear polymermelt. Physica A: Statistical Mechanics and its Applications 320 (Mar. 2003), 235–248.
[21] Connelly, R. W., and Greener, J. High-Shear Viscometry with a Rotational Parallel-DiskDevice. Journal of Rheology 29, 2 (Apr. 1985), 209–226.
[22] Craven, T. J., Rees, J. M., and Zimmerman, W. B. Pressure sensor positioning in an elec-trokinetic microrheometer device: simulations of shear-thinning liquid flows. Microfluidics andNanofluidics 9, 2-3 (Feb. 2010), 559–571.
[23] Crawford, N. C., Williams, S. K. R., Boldridge, D., and Liberatore, M. W. Shearthickening of chemical mechanical polishing slurries under high shear. Rheologica Acta 51, 7 (May2012), 637–647.
14

[24] Davies, G., and Stokes, J. Thin film and high shear rheology of multiphase complex fluids.Journal of Non-Newtonian Fluid Mechanics 148, 1-3 (Jan. 2008), 73–87.
[25] Davies, G. A., and Stokes, J. R. On the gap error in parallel plate rheometry that arises fromthe presence of air when zeroing the gap. Journal of Rheology 49, 4 (July 2005), 919–922.
[26] Dontula, P., Macosko, C. W., and Scriven, L. E. Does the Viscosity of Glycerin Fall atHigh Shear Rates? Industrial & Engineering Chemistry Research 38, 4 (Apr. 1999), 1729–1735.
[27] Erickson, D., Lu, F., Li, D., White, T., and Gao, J. An experimental investigation into thedimension-sensitive viscosity of polymer containing lubricant oils in microchannels. ExperimentalThermal and Fluid Science 25, 8 (Feb. 2002), 623–630.
[28] Erni, P., Varagnat, M., Clasen, C., Crest, J., and McKinley, G. H. Microrheometry ofsub-nanolitre biopolymer samples: non-Newtonian flow phenomena of carnivorous plant mucilage.Soft Matter 7, 22 (2011), 10889–10898.
[29] Ettl, R., Schadler, V., and Willenbacher, N. Runnability and flow-induced aggregation ofpaper coating suspensions. Nordic Pulp and Paper Research Journal 15, 5 (2000), 509–514.
[30] Follens, L. R. A., Reichel, E. K., Riesch, C., Vermant, J., Martens, J. A., Kirschhock,C. E. A., and Jakoby, B. Viscosity sensing in heated alkaline zeolite synthesis media. Physicalchemistry chemical physics 11, 16 (Apr. 2009), 2854–2857.
[31] Fritz, G., Pechhold, W., Willenbacher, N., and Wagner, N. J. Characterizing complexfluids with high frequency rheology using torsional resonators at multiple frequencies. Journal ofRheology 47, 2 (Feb. 2003), 303–319.
[32] Georgieva, K., Dijkstra, D. J., Fricke, H., and Willenbacher, N. Clogging of microchan-nels by nano-particles due to hetero-coagulation in elongational flow. Journal of colloid and interfacescience 352, 2 (Dec. 2010), 265–277.
[33] Giacomin, A. J., Samurkas, T., and Dealy, J. M. A novel sliding plate rheometer for moltenplastics. Polymer Engineering and Science 29, 8 (Apr. 1989), 499–504.
[34] Gillies, G., Prestidge, C. A., and Attard, P. An AFM Study of the Deformation andNanorheology of Cross-Linked PDMS Droplets. Langmuir 18, 5 (Mar. 2002), 1674–1679.
[35] Gong, J. P., Kagata, G., and Osada, Y. Friction of Gels. 4. Friction on Charged Gels. Journalof Physical Chemistry B 103, 29 (July 1999), 6007–6014.
[36] Hatzikiriakos, S. G. Wall slip of molten polymers. Progress in Polymer Science 37, 4 (Apr.2012), 624–643.
[37] Henson, D. J. Effect of gap on the viscosity of monodisperse polystyrene melts: Slip effects.Journal of Rheology 39, 2 (Mar. 1995), 359–373.
[38] Jaishankar, A., Sharma, V., and McKinley, G. H. Interfacial viscoelasticity, yielding andcreep ringing of globular proteinsurfactant mixtures. Soft Matter 7, 17 (Aug. 2011), 7623–7634.
[39] Jakoby, B., Beigelbeck, R., Keplinger, F., Lucklum, F., Niedermayer, A., Reichel,E. K., Riesch, C., Voglhuber-Brunnmaier, T., and Weiss, B. Miniaturized sensors forthe viscosity and density of liquids–performance and issues. IEEE transactions on ultrasonics,ferroelectrics, and frequency control 57, 1 (Jan. 2010), 111–120.
[40] Kagata, G., Gong, J. P., and Osada, Y. Friction of Gels. 6. Effects of Sliding Velocity andViscoelastic Responses of the Network. Journal of Physical Chemistry B 106, 18 (May 2002), 4596–4601.
[41] Kagata, G., Gong, J. P., and Osada, Y. Friction of Gels. 7. Observation of Static Frictionbetween Like-Charged Gels. Journal of Physical Chemistry B 107, 37 (Sept. 2003), 10221–10225.
15

[42] Kang, K., Lee, L. J., and Koelling, K. W. High shear microfluidics and its application inrheological measurement. Experiments in Fluids 38, 2 (Jan. 2005), 222–232.
[43] Kheirandish, S., Gubaydullin, I., and Willenbacher, N. Shear and elongational flow be-havior of acrylic thickener solutions. Part II: effect of gel content. Rheologica Acta 48, 4 (Nov. 2008),397–407.
[44] Kirschenmann, L., and Pechhold, W. Piezoelectric Rotary Vibrator (PRV) a new oscillatingrheometer for linear viscoelasticity. Rheologica Acta 41, 4 (Apr. 2002), 362–368.
[45] Kojic, N., Bico, J., Clasen, C., and McKinley, G. H. Ex vivo rheology of spider silk. Journalof experimental biology 209, 21 (Nov. 2006), 4355–4362.
[46] Koliandris, A.-L., Morris, C., Hewson, L., Hort, J., Taylor, A. J., and Wolf, B. Corre-lation between saltiness perception and shear flow behaviour for viscous solutions. Food Hydrocolloids24, 8 (Nov. 2010), 792–799.
[47] Kramer, J., Uhl, J. T., and Prud’Homme, R. K. Measurement of the viscosity of guar gumsolutions to 50,000 s−1 using a parallel plate rheometer. Polymer Engineering and Science 27, 8(Apr. 1987), 598–602.
[48] Kulicke, W. M., and Porter, R. S. Relation between steady shear flow and dynamic rheology.Rheologica Acta 19, 5 (Sept. 1980), 601–605.
[49] Lanzaro, A., and Yuan, X.-F. Effects of contraction ratio on non-linear dynamics of semi-dilute,highly polydisperse PAAm solutions in microfluidics. Journal of Non-Newtonian Fluid Mechanics166, 17-18 (Sept. 2011), 1064–1075.
[50] Lee, A., Sudau, K., Ahn, K. H., Lee, S. J., and Willenbacher, N. Optimization of Ex-perimental Parameters to Suppress Nozzle Clogging in Inkjet Printing. Industrial & EngineeringChemistry Research 51, 40 (Oct. 2012), 13195–13204.
[51] Li, Z., Yuan, X.-F., Haward, S. J., Odell, J. a., and Yeates, S. Non-linear dynamics ofsemi-dilute polydisperse polymer solutions in microfluidics: A study of a benchmark flow problem.Journal of Non-Newtonian Fluid Mechanics 166, 16 (Sept. 2011), 951–963.
[52] Lin, N. Y. C., Cheng, X., and Cohen, I. Biaxial shear of confined colloidal hard spheres:the structure and rheology of the vorticity-aligned string phase. Soft Matter 10, 12 (Feb. 2014),1969–1976.
[53] Livak-Dahl, E., Lee, J., and Burns, M. A. Nanoliter droplet viscometer with additive-freeoperation. Lab on a chip 13, 2 (Jan. 2013), 297–301.
[54] Luengo, G., Schmitt, F.-J., Hill, R., and Israelachvili, J. Thin Film Rheology and Tribol-ogy of Confined Polymer Melts: Contrasts with Bulk Properties. Macromolecules 30, 8 (Apr. 1997),2482–2494.
[55] Maciel, A., Salas, V., Soltero, J. F. a., Guzman, J., and Manero, O. On the wall slip ofpolymer blends. Journal of Polymer Science Part B: Polymer Physics 40, 4 (Feb. 2002), 303–316.
[56] Mackay, M. E., and Henson, D. J. The effect of molecular mass and temperature on the slipof polystyrene melts at low stress levels. Journal of Rheology 42, 6 (Nov. 1998), 1505.
[57] MacKintosh, F., and Schmidt, C. Microrheology. Current Opinion in Colloid & InterfaceScience 4, 4 (Aug. 1999), 300–307.
[58] Macosko, C. W. Rheology: Principles , Measurements and Applications. Wiley-VCH, Inc., 1994.
[59] Martinoty, P., Hilliou, L., Mauzac, M., Benguigui, L., and Collin, D. Side-Chain Liquid-Crystal Polymers: Gel-like Behavior below Their Gelation Points. Macromolecules 32, 6 (Mar. 1999),1746–1752.
16

[60] Mateyawa, S., Xie, D. F., Truss, R. W., Halley, P. J., Nicholson, T. M., Shamshina,J. L., Rogers, R. D., Boehm, M. W., and McNally, T. Effect of the ionic liquid 1-ethyl-3-methylimidazolium acetate on the phase transition of starch: dissolution or gelatinization? Carbo-hydrate polymers 94, 1 (Apr. 2013), 520–530.
[61] McKenna, G. B. Commentary on rheology of polymers in narrow gaps. The European physicaljournal E 19, 1 (Jan. 2006), 101–108.
[62] Meeker, S. P., Bonnecaze, R. T., and Cloitre, M. Slip and flow in pastes of soft particles:Direct observation and rheology. Journal of Rheology 48, 6 (Nov. 2004), 1295.
[63] Mooney, M. Explicit Formulas for Slip and Fluidity. Journal of Rheology 2, 2 (Oct. 1931), 210–222.
[64] Moschakis, T. Microrheology and particle tracking in food gels and emulsions. Current Opinionin Colloid & Interface Science 18, 4 (Aug. 2013), 311–323.
[65] Mriziq, K. S., Dai, H. J., Dadmun, M. D., Jellison, G. E., and Cochran, H. D. High-shear-rate optical rheometer. Review of Scientific Instruments 75, 6 (May 2004), 2171–2176.
[66] Mukhopadhyay, A., and Granick, S. Micro- and nanorheology. Current Opinion in Colloid &Interface Science 6, 5-6 (Nov. 2001), 423–429.
[67] Oelschlaeger, C., Cota Pinto Coelho, M., and Willenbacher, N. Chain flexibility anddynamics of polysaccharide hyaluronan in entangled solutions: a high frequency rheology and dif-fusing wave spectroscopy study. Biomacromolecules 14, 10 (Oct. 2013), 3689–3696.
[68] Oelschlaeger, C., Schopferer, M., Scheffold, F., and Willenbacher, N. Linear-to-branched micelles transition: a rheometry and diffusing wave spectroscopy (DWS) study. Langmuir: the ACS journal of surfaces and colloids 25, 2 (Jan. 2009), 716–723.
[69] Olagunju, D. O. Effect of free surface and inertia on viscoelastic parallel plate flow. Journal ofRheology 38, 1 (Jan. 1994), 151–168.
[70] Pan, L., and Arratia, P. E. A high-shear, low Reynolds number microfluidic rheometer. Mi-crofluidics and Nanofluidics 14, 5 (Dec. 2012), 885–894.
[71] Pawelzyk, P., Mucke, N., Herrmann, H., and Willenbacher, N. Correction: AttractiveInteractions among Intermediate Filaments Determine Network Mechanics In Vitro. PloS one 9, 4(Jan. 2014), e93194.
[72] Peachey, J., Van Alsten, J., and Granick, S. Design of an apparatus to measure the shearresponse of ultrathin liquid films. Review of Scientific Instruments 62, 2 (Feb. 1991), 463–473.
[73] Pechhold, W., Mayer, U., Raju, G. B., and Guillon, O. Piezo rotary and axial vibrator(PRAV) characterization of a fresh coating during its drying. Rheologica Acta 50, 3 (Jan. 2011),221–229.
[74] Pfleiderer, P., Baik, S. J., Zhang, Z., Vleminckx, G., Lettinga, M. P., Grelet, E.,Vermant, J., and Clasen, C. X-ray scattering in the vorticity direction and rheometry fromconfined fluids. The Review of scientific instruments 85, 6 (June 2014), 065108.
[75] Pipe, C. J., Majmudar, T. S., and McKinley, G. H. High shear rate viscometry. RheologicaActa 47, 5-6 (Apr. 2008), 621–642.
[76] Pit, R., Hervet, H., and Leger, L. Direct Experimental Evidence of Slip in Hexadecane: SolidInterfaces. Physical Review Letters 85, 5 (July 2000), 980–983.
[77] Pullarkat, P. A., Fernandez, P. A., and Ott, A. Rheological properties of the Eukaryoticcell cytoskeleton. Physics Reports 449, 1-3 (Sept. 2007), 29–53.
[78] Reichel, E. K., Heinisch, M., Jakoby, B., Vermant, J., and Kirschhock, C. E. Viscoelas-ticity Sensor with Resonance Tuning and Low-Cost Interface. Procedia Engineering 25 (Jan. 2011),623–626.
17

[79] Reichel, E. K., Vermant, J., Jakoby, B., and Kirschhock, C. E. Shear wave sensors forviscoelastic properties. Procedia Engineering 5 (Jan. 2010), 1316–1319.
[80] Riesch, C., Reichel, E. K., Keplinger, F., and Jakoby, B. Characterizing Vibrating Can-tilevers for Liquid Viscosity and Density Sensing. Journal of Sensors 2008 (2008), 1–9.
[81] Rother, J., Noding, H., Mey, I., and Janshoff, A. Atomic force microscopy-based microrhe-ology reveals significant differences in the viscoelastic response between malign and benign cell lines.Open biology 4, 5 (May 2014), 140046.
[82] Schmatko, T., Hervet, H., and Leger, L. Friction and Slip at Simple Fluid-Solid Interfaces:The Roles of the Molecular Shape and the Solid-Liquid Interaction. Physical Review Letters 94, 24(June 2005), 244501.
[83] Seth, J. R., Cloitre, M., and Bonnecaze, R. T. Influence of short-range forces on wall-slipin microgel pastes. Journal of Rheology 52, 5 (Sept. 2008), 1241–1268.
[84] Sharma, V., Jaishankar, A., Wang, Y.-C., and McKinley, G. H. Rheology of globularproteins: apparent yield stress, high shear rate viscosity and interfacial viscoelasticity of bovineserum albumin solutions. Soft Matter 7, 11 (May 2011), 5150–5160.
[85] Sochi, T. Slip at Fluid-Solid Interface. Polymer Reviews 51, 4 (Oct. 2011), 309–340.
[86] Sorbie, K. Depleted layer effects in polymer flow through porous media. Journal of Colloid andInterface Science 139, 2 (Oct. 1990), 299–314.
[87] Squires, T. M., and Mason, T. G. Fluid Mechanics of Microrheology. Annual Review of FluidMechanics 42, 1 (Dec. 2010), 413–438.
[88] Srivastava, N., and Burns, M. A. Electronic drop sensing in microfluidic devices: automatedoperation of a nanoliter viscometer. Lab on a chip 6, 6 (June 2006), 744–751.
[89] Stokes, J. R., Boehm, M. W., and Baier, S. K. Oral processing, texture and mouthfeel: Fromrheology to tribology and beyond. Current Opinion in Colloid & Interface Science 18, 4 (Aug.2013), 349–359.
[90] Turian, R. M. Perturbation Solution of the Steady Newtonian Flow in the Cone and Plate andParallel Plate Systems. Industrial & Engineering Chemistry Fundamentals 11, 3 (Aug. 1972), 361–368.
[91] Vadillo, D. C., Mathues, W., and Clasen, C. Microsecond relaxation processes in shear andextensional flows of weakly elastic polymer solutions. Rheologica Acta 51, 8 (July 2012), 755–769.
[92] Vesaratchanon, J. S., Takamura, K., and Willenbacher, N. Surface characterizationof functionalized latexes with different surface functionalities using rheometry and dynamic lightscattering. Journal of colloid and interface science 345, 2 (May 2010), 214–221.
[93] Waigh, T. A. Microrheology of complex fluids. Reports on Progress in Physics 68, 3 (Mar. 2005),685–742.
[94] Wang, S.-Q. Exploring molecular origins of sharkskin, partial slip, and slope change in flow curvesof linear low density polyethylene. Journal of Rheology 40, 5 (Sept. 1996), 875–898.
[95] Weis, C., Natalia, I., and Willenbacher, N. Effect of weak attractive interactions on flowbehavior of highly concentrated crystalline suspensions. Journal of Rheology 58, 5 (Sept. 2014),1583–1597.
[96] White, C. C., VanLandingham, M. R., Drzal, P. L., Chang, N.-K., and Chang, S.-H. Viscoelastic characterization of polymers using instrumented indentation. II. Dynamic testing.Journal of Polymer Science Part B: Polymer Physics 43, 14 (July 2005), 1812–1824.
[97] Xie, Z., Zou, Q., and Yao, D. Design and Verification of the Pressure-Driven Radial FlowMicrorheometer. Tribology Transactions 51, 4 (July 2008), 396–402.
18

[98] Yan, Y., Zhang, Z., Cheneler, D., Stokes, J. R., and Adams, M. J. The influence of flowconfinement on the rheological properties of complex fluids. Rheologica Acta 49, 3 (Dec. 2009),255–266.
[99] Yoshimura, A., and Prud’Homme, R. K. Wall Slip Corrections for Couette and Parallel DiskViscometers. Journal of Rheology 32, 1 (Jan. 1988), 53–67.
19