Embed Size (px)
Citation preview
uarterly Update THE DAR ES SALAAM STOCK EXCHANGE PLC
THE DAR ES SALAAM STOCK EXCHANGE PLC - QUARTERLY UPDATE
ISSN No. 0856 8448 ISSUE No. 66 SEPTEMBER, 2015
Q
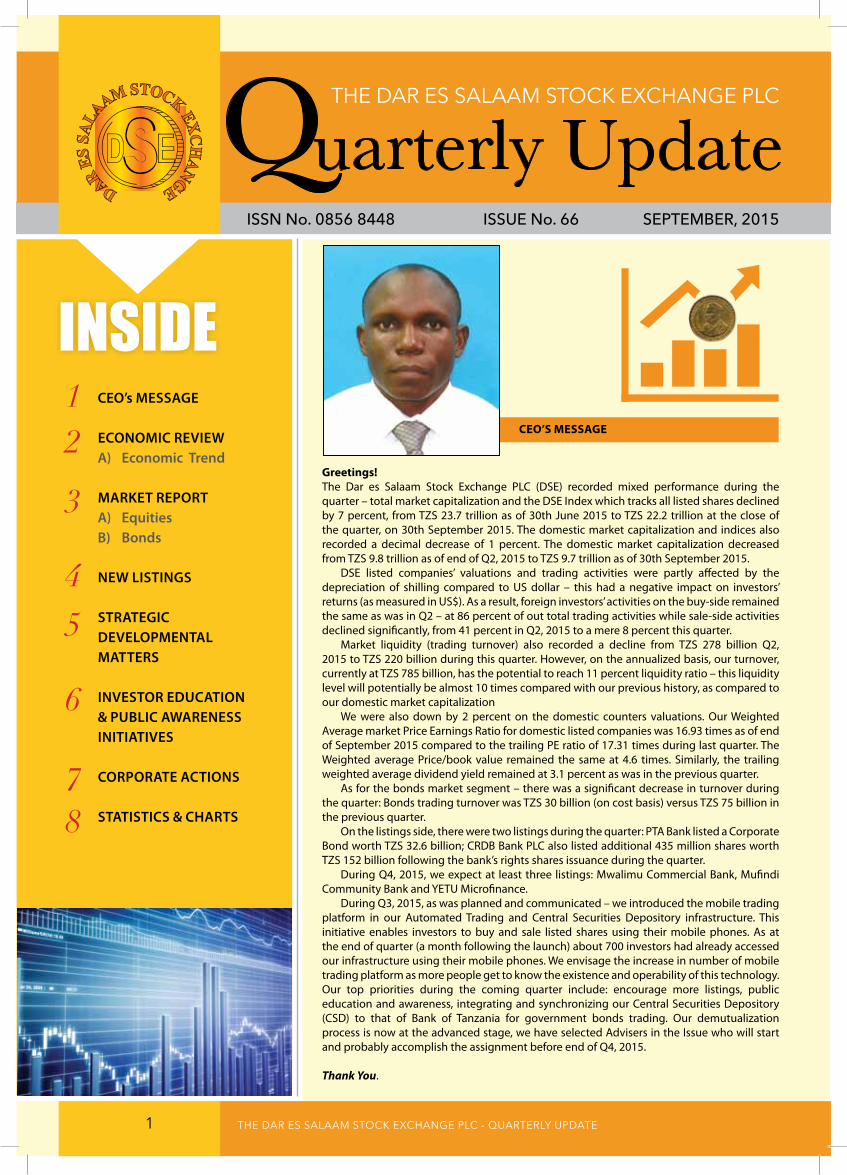
CEO’s MEssagE
greetings!The Dar es Salaam Stock Exchange PLC (DSE) recorded mixed performance during the quarter – total market capitalization and the DSE Index which tracks all listed shares declined by 7 percent, from TZS 23.7 trillion as of 30th June 2015 to TZS 22.2 trillion at the close of the quarter, on 30th September 2015. The domestic market capitalization and indices also recorded a decimal decrease of 1 percent. The domestic market capitalization decreased from TZS 9.8 trillion as of end of Q2, 2015 to TZS 9.7 trillion as of 30th September 2015. DSE listed companies’ valuations and trading activities were partly affected by the depreciation of shilling compared to US dollar – this had a negative impact on investors’ returns (as measured in US$). As a result, foreign investors’ activities on the buy-side remained the same as was in Q2 – at 86 percent of out total trading activities while sale-side activities declined significantly, from 41 percent in Q2, 2015 to a mere 8 percent this quarter. Market liquidity (trading turnover) also recorded a decline from TZS 278 billion Q2, 2015 to TZS 220 billion during this quarter. However, on the annualized basis, our turnover, currently at TZS 785 billion, has the potential to reach 11 percent liquidity ratio – this liquidity level will potentially be almost 10 times compared with our previous history, as compared to our domestic market capitalization We were also down by 2 percent on the domestic counters valuations. Our Weighted Average market Price Earnings Ratio for domestic listed companies was 16.93 times as of end of September 2015 compared to the trailing PE ratio of 17.31 times during last quarter. The Weighted average Price/book value remained the same at 4.6 times. Similarly, the trailing weighted average dividend yield remained at 3.1 percent as was in the previous quarter. As for the bonds market segment – there was a significant decrease in turnover during the quarter: Bonds trading turnover was TZS 30 billion (on cost basis) versus TZS 75 billion in the previous quarter. On the listings side, there were two listings during the quarter: PTA Bank listed a Corporate Bond worth TZS 32.6 billion; CRDB Bank PLC also listed additional 435 million shares worth TZS 152 billion following the bank’s rights shares issuance during the quarter. During Q4, 2015, we expect at least three listings: Mwalimu Commercial Bank, Mufindi Community Bank and YETU Microfinance. During Q3, 2015, as was planned and communicated – we introduced the mobile trading platform in our Automated Trading and Central Securities Depository infrastructure. This initiative enables investors to buy and sale listed shares using their mobile phones. As at the end of quarter (a month following the launch) about 700 investors had already accessed our infrastructure using their mobile phones. We envisage the increase in number of mobile trading platform as more people get to know the existence and operability of this technology. Our top priorities during the coming quarter include: encourage more listings, public education and awareness, integrating and synchronizing our Central Securities Depository (CSD) to that of Bank of Tanzania for government bonds trading. Our demutualization process is now at the advanced stage, we have selected Advisers in the Issue who will start and probably accomplish the assignment before end of Q4, 2015.
Thank You.
INSIDECEO’s MEssagE
ECOnOMiC rEviEwa) Economic Trend
MarkET rEpOrTa) EquitiesB) Bonds
nEw LisTings
sTraTEgiC DEvELOpMEnTaLMaTTErs
invEsTOr EDuCaTiOn & puBLiC awarEnEss iniTiaTivEs
COrpOraTE aCTiOns
sTaTisTiCs & CharTs
12
3
45
6
78
1
THE DAR ES SALAAM STOCK EXCHANGE PLC - QUARTERLY UPDATE THE DAR ES SALAAM STOCK EXCHANGE PLC - QUARTERLY UPDATE2
2) ECOnOMiC rEviEw
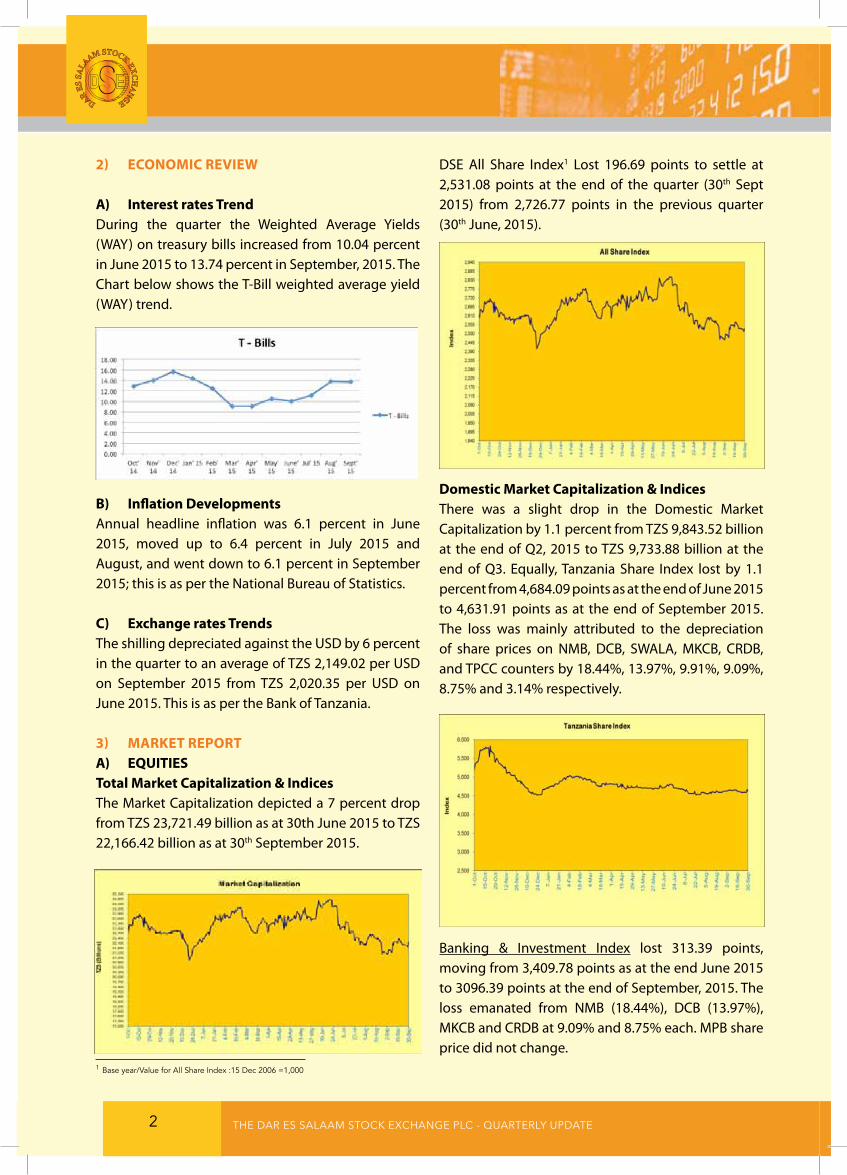
a) interest rates Trend During the quarter the Weighted Average Yields (WAY) on treasury bills increased from 10.04 percent in June 2015 to 13.74 percent in September, 2015. The Chart below shows the T-Bill weighted average yield (WAY) trend.
B) inflation DevelopmentsAnnual headline inflation was 6.1 percent in June 2015, moved up to 6.4 percent in July 2015 and August, and went down to 6.1 percent in September 2015; this is as per the National Bureau of Statistics.
C) Exchange rates TrendsThe shilling depreciated against the USD by 6 percent in the quarter to an average of TZS 2,149.02 per USD on September 2015 from TZS 2,020.35 per USD on June 2015. This is as per the Bank of Tanzania.
3) MarKET rEPOrTa) EQUiTiEsTotal Market Capitalization & indicesThe Market Capitalization depicted a 7 percent drop from TZS 23,721.49 billion as at 30th June 2015 to TZS 22,166.42 billion as at 30th September 2015.
DSE All Share Index1 Lost 196.69 points to settle at 2,531.08 points at the end of the quarter (30th Sept 2015) from 2,726.77 points in the previous quarter (30th June, 2015).
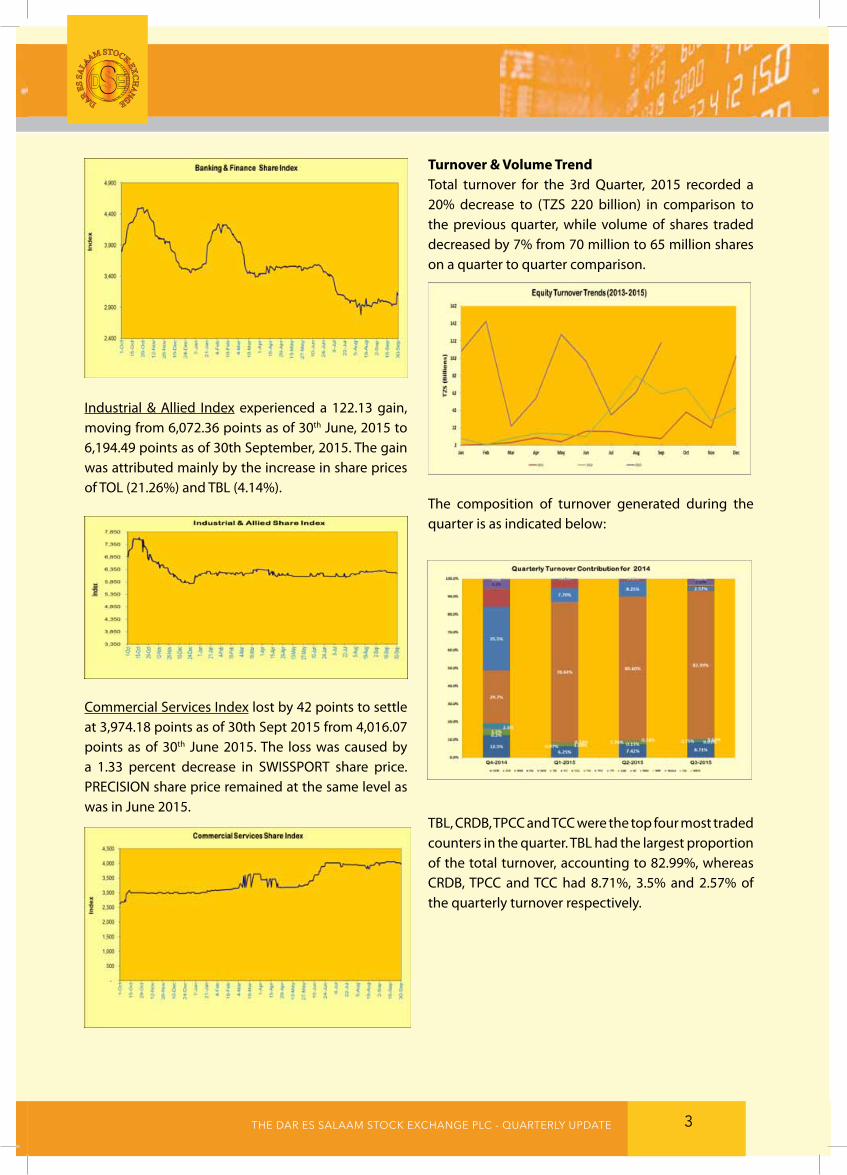
Domestic Market Capitalization & indicesThere was a slight drop in the Domestic Market Capitalization by 1.1 percent from TZS 9,843.52 billion at the end of Q2, 2015 to TZS 9,733.88 billion at the end of Q3. Equally, Tanzania Share Index lost by 1.1 percent from 4,684.09 points as at the end of June 2015 to 4,631.91 points as at the end of September 2015. The loss was mainly attributed to the depreciation of share prices on NMB, DCB, SWALA, MKCB, CRDB, and TPCC counters by 18.44%, 13.97%, 9.91%, 9.09%, 8.75% and 3.14% respectively.
Banking & Investment Index lost 313.39 points, moving from 3,409.78 points as at the end June 2015 to 3096.39 points at the end of September, 2015. The loss emanated from NMB (18.44%), DCB (13.97%), MKCB and CRDB at 9.09% and 8.75% each. MPB share price did not change.
1 Base year/Value for All Share Index :15 Dec 2006 =1,000
THE DAR ES SALAAM STOCK EXCHANGE PLC - QUARTERLY UPDATE THE DAR ES SALAAM STOCK EXCHANGE PLC - QUARTERLY UPDATE 3
Industrial & Allied Index experienced a 122.13 gain, moving from 6,072.36 points as of 30th June, 2015 to 6,194.49 points as of 30th September, 2015. The gain was attributed mainly by the increase in share prices of TOL (21.26%) and TBL (4.14%).
Commercial Services Index lost by 42 points to settle at 3,974.18 points as of 30th Sept 2015 from 4,016.07 points as of 30th June 2015. The loss was caused by a 1.33 percent decrease in SWISSPORT share price. PRECISION share price remained at the same level as was in June 2015.
Turnover & volume TrendTotal turnover for the 3rd Quarter, 2015 recorded a 20% decrease to (TZS 220 billion) in comparison to the previous quarter, while volume of shares traded decreased by 7% from 70 million to 65 million shares on a quarter to quarter comparison.
The composition of turnover generated during the quarter is as indicated below:
TBL, CRDB, TPCC and TCC were the top four most traded counters in the quarter. TBL had the largest proportion of the total turnover, accounting to 82.99%, whereas CRDB, TPCC and TCC had 8.71%, 3.5% and 2.57% of the quarterly turnover respectively.
THE DAR ES SALAAM STOCK EXCHANGE PLC - QUARTERLY UPDATE THE DAR ES SALAAM STOCK EXCHANGE PLC - QUARTERLY UPDATE4
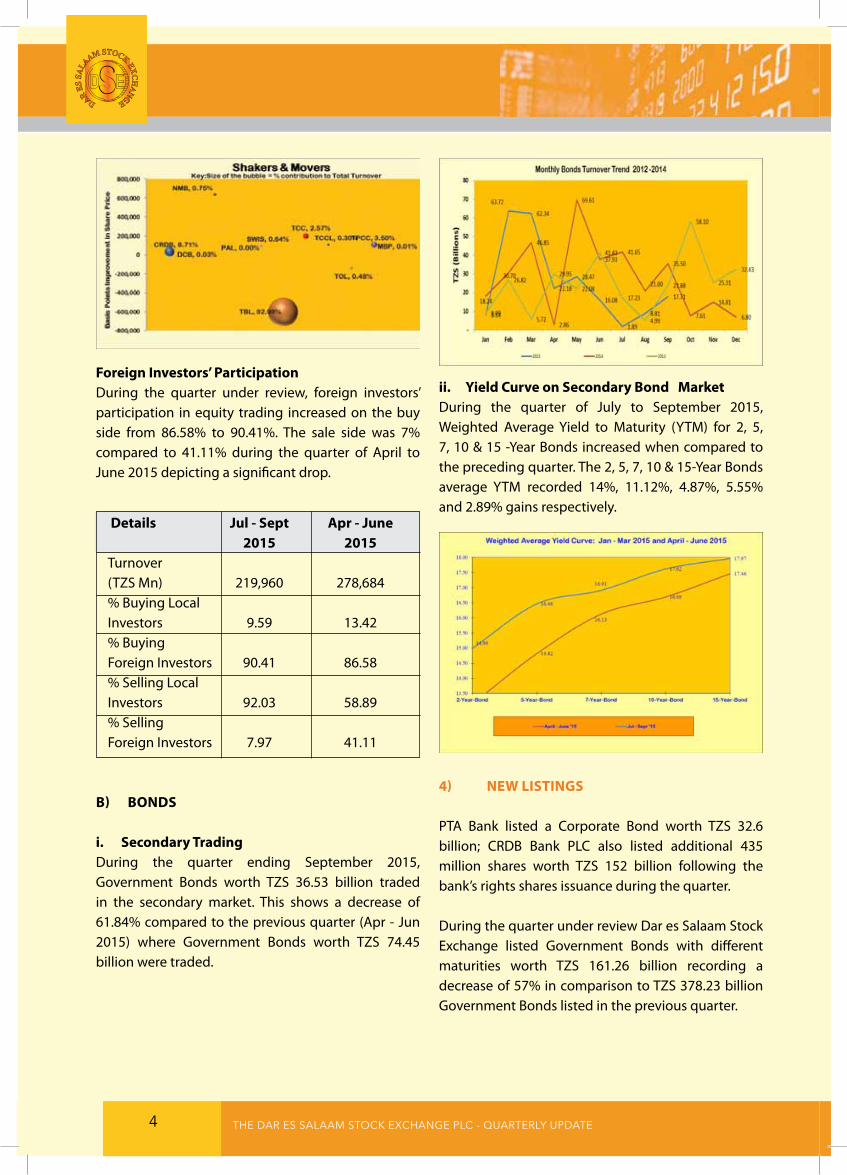
Foreign investors’ ParticipationDuring the quarter under review, foreign investors’ participation in equity trading increased on the buy side from 86.58% to 90.41%. The sale side was 7% compared to 41.11% during the quarter of April to June 2015 depicting a significant drop.
Details Jul - sept apr - June 2015 2015Turnover (TZS Mn) 219,960 278,684% Buying Local Investors 9.59 13.42% Buying Foreign Investors 90.41 86.58% Selling Local Investors 92.03 58.89% Selling Foreign Investors 7.97 41.11
B) BOnDs
i. secondary TradingDuring the quarter ending September 2015, Government Bonds worth TZS 36.53 billion traded in the secondary market. This shows a decrease of 61.84% compared to the previous quarter (Apr - Jun 2015) where Government Bonds worth TZS 74.45 billion were traded.
ii. Yield Curve on secondary Bond MarketDuring the quarter of July to September 2015, Weighted Average Yield to Maturity (YTM) for 2, 5, 7, 10 & 15 -Year Bonds increased when compared to the preceding quarter. The 2, 5, 7, 10 & 15-Year Bonds average YTM recorded 14%, 11.12%, 4.87%, 5.55% and 2.89% gains respectively.
4) nEw LisTings
PTA Bank listed a Corporate Bond worth TZS 32.6 billion; CRDB Bank PLC also listed additional 435 million shares worth TZS 152 billion following the bank’s rights shares issuance during the quarter.
During the quarter under review Dar es Salaam Stock Exchange listed Government Bonds with different maturities worth TZS 161.26 billion recording a decrease of 57% in comparison to TZS 378.23 billion Government Bonds listed in the previous quarter.
THE DAR ES SALAAM STOCK EXCHANGE PLC - QUARTERLY UPDATE THE DAR ES SALAAM STOCK EXCHANGE PLC - QUARTERLY UPDATE 5
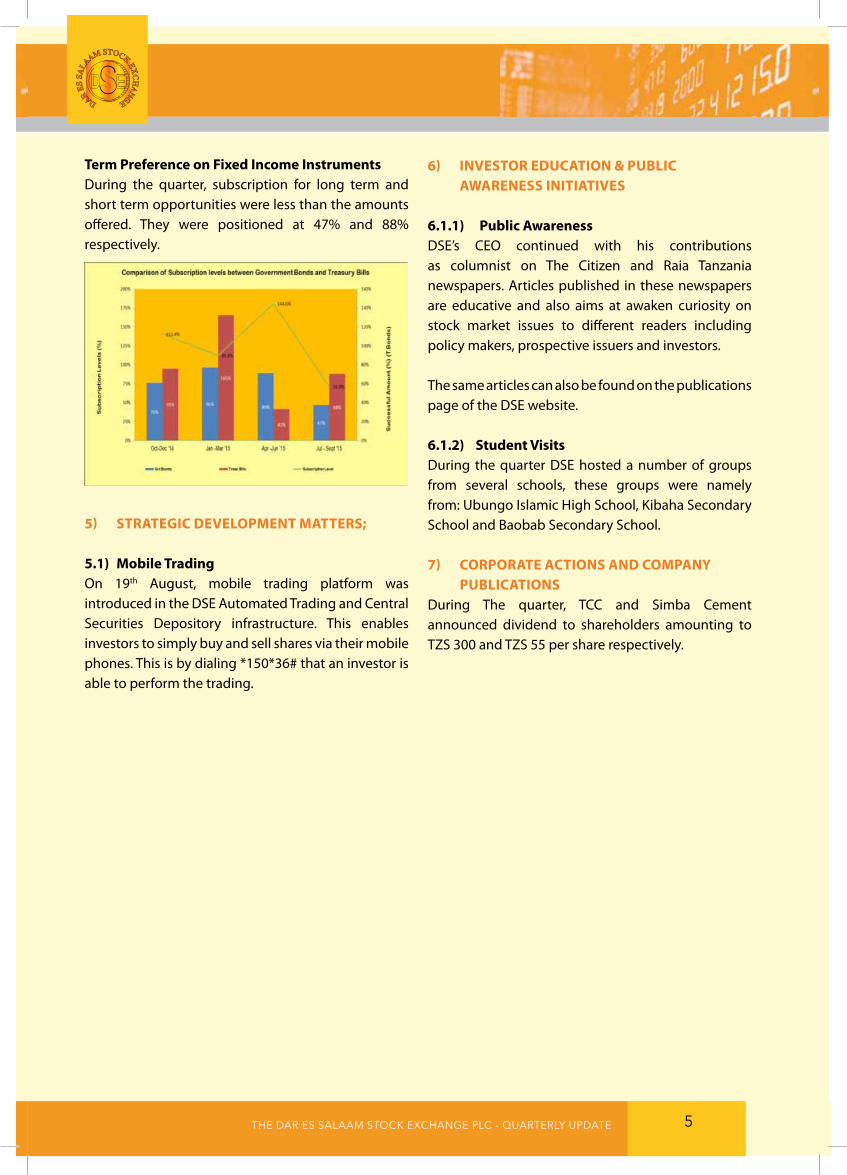
Term Preference on Fixed income instrumentsDuring the quarter, subscription for long term and short term opportunities were less than the amounts offered. They were positioned at 47% and 88% respectively.
5) sTraTEgiC DEvELOPMEnT MaTTErs;
5.1) Mobile TradingOn 19th August, mobile trading platform was introduced in the DSE Automated Trading and Central Securities Depository infrastructure. This enables investors to simply buy and sell shares via their mobile phones. This is by dialing *150*36# that an investor is able to perform the trading.
6) invEsTOr EDUCaTiOn & PUBLiC awarEnEss iniTiaTivEs
6.1.1) Public awarenessDSE’s CEO continued with his contributions as columnist on The Citizen and Raia Tanzania newspapers. Articles published in these newspapers are educative and also aims at awaken curiosity on stock market issues to different readers including policy makers, prospective issuers and investors.
The same articles can also be found on the publications page of the DSE website.
6.1.2) student visitsDuring the quarter DSE hosted a number of groups from several schools, these groups were namely from: Ubungo Islamic High School, Kibaha Secondary School and Baobab Secondary School.
7) COrPOraTE aCTiOns anD COMPanY PUBLiCaTiOns
During The quarter, TCC and Simba Cement announced dividend to shareholders amounting to TZS 300 and TZS 55 per share respectively.
THE DAR ES SALAAM STOCK EXCHANGE PLC - QUARTERLY UPDATE THE DAR ES SALAAM STOCK EXCHANGE PLC - QUARTERLY UPDATE6
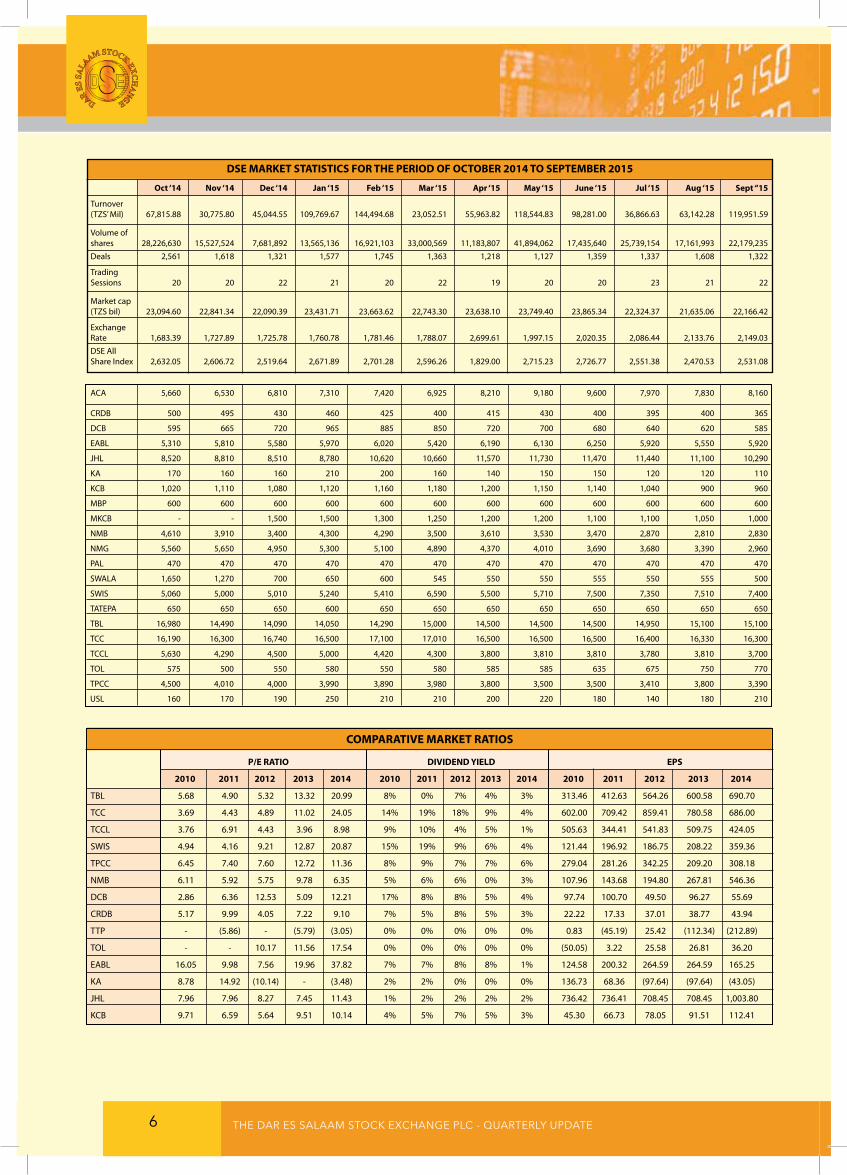
COMParaTivE MarKET raTiOs
P/E raTiO DiviDEnD YiELD EPs
2010 2011 2012 2013 2014 2010 2011 2012 2013 2014 2010 2011 2012 2013 2014
TBL 5.68 4.90 5.32 13.32 20.99 8% 0% 7% 4% 3% 313.46 412.63 564.26 600.58 690.70
TCC 3.69 4.43 4.89 11.02 24.05 14% 19% 18% 9% 4% 602.00 709.42 859.41 780.58 686.00
TCCL 3.76 6.91 4.43 3.96 8.98 9% 10% 4% 5% 1% 505.63 344.41 541.83 509.75 424.05
SWIS 4.94 4.16 9.21 12.87 20.87 15% 19% 9% 6% 4% 121.44 196.92 186.75 208.22 359.36
TPCC 6.45 7.40 7.60 12.72 11.36 8% 9% 7% 7% 6% 279.04 281.26 342.25 209.20 308.18
NMB 6.11 5.92 5.75 9.78 6.35 5% 6% 6% 0% 3% 107.96 143.68 194.80 267.81 546.36
DCB 2.86 6.36 12.53 5.09 12.21 17% 8% 8% 5% 4% 97.74 100.70 49.50 96.27 55.69
CRDB 5.17 9.99 4.05 7.22 9.10 7% 5% 8% 5% 3% 22.22 17.33 37.01 38.77 43.94
TTP - (5.86) - (5.79) (3.05) 0% 0% 0% 0% 0% 0.83 (45.19) 25.42 (112.34) (212.89)
TOL - - 10.17 11.56 17.54 0% 0% 0% 0% 0% (50.05) 3.22 25.58 26.81 36.20
EABL 16.05 9.98 7.56 19.96 37.82 7% 7% 8% 8% 1% 124.58 200.32 264.59 264.59 165.25
KA 8.78 14.92 (10.14) - (3.48) 2% 2% 0% 0% 0% 136.73 68.36 (97.64) (97.64) (43.05)
JHL 7.96 7.96 8.27 7.45 11.43 1% 2% 2% 2% 2% 736.42 736.41 708.45 708.45 1,003.80
KCB 9.71 6.59 5.64 9.51 10.14 4% 5% 7% 5% 3% 45.30 66.73 78.05 91.51 112.41
DsE MarKET sTaTisTiCs FOr THE PEriOD OF OCTOBEr 2014 TO sEPTEMBEr 2015
Oct ‘14 nov ‘14 Dec ‘14 Jan ‘15 Feb ‘15 Mar ‘15 apr ‘15 May ‘15 June ‘15 Jul ‘15 aug ‘15 sept “15
Turnover (TZS’ Mil) 67,815.88 30,775.80 45,044.55 109,769.67 144,494.68 23,052.51 55,963.82 118,544.83 98,281.00 36,866.63 63,142.28 119,951.59
Volume of shares 28,226,630 15,527,524 7,681,892 13,565,136 16,921,103 33,000,569 11,183,807 41,894,062 17,435,640 25,739,154 17,161,993 22,179,235
Deals 2,561 1,618 1,321 1,577 1,745 1,363 1,218 1,127 1,359 1,337 1,608 1,322
Trading Sessions 20 20 22 21 20 22 19 20 20 23 21 22
Market cap (TZS bil) 23,094.60 22,841.34 22,090.39 23,431.71 23,663.62 22,743.30 23,638.10 23,749.40 23,865.34 22,324.37 21,635.06 22,166.42
Exchange Rate 1,683.39 1,727.89 1,725.78 1,760.78 1,781.46 1,788.07 2,699.61 1,997.15 2,020.35 2,086.44 2,133.76 2,149.03
DSE All Share Index 2,632.05 2,606.72 2,519.64 2,671.89 2,701.28 2,596.26 1,829.00 2,715.23 2,726.77 2,551.38 2,470.53 2,531.08 ACA 5,660 6,530 6,810 7,310 7,420 6,925 8,210 9,180 9,600 7,970 7,830 8,160
CRDB 500 495 430 460 425 400 415 430 400 395 400 365
DCB 595 665 720 965 885 850 720 700 680 640 620 585
EABL 5,310 5,810 5,580 5,970 6,020 5,420 6,190 6,130 6,250 5,920 5,550 5,920
JHL 8,520 8,810 8,510 8,780 10,620 10,660 11,570 11,730 11,470 11,440 11,100 10,290
KA 170 160 160 210 200 160 140 150 150 120 120 110
KCB 1,020 1,110 1,080 1,120 1,160 1,180 1,200 1,150 1,140 1,040 900 960
MBP 600 600 600 600 600 600 600 600 600 600 600 600
MKCB - - 1,500 1,500 1,300 1,250 1,200 1,200 1,100 1,100 1,050 1,000
NMB 4,610 3,910 3,400 4,300 4,290 3,500 3,610 3,530 3,470 2,870 2,810 2,830
NMG 5,560 5,650 4,950 5,300 5,100 4,890 4,370 4,010 3,690 3,680 3,390 2,960
PAL 470 470 470 470 470 470 470 470 470 470 470 470
SWALA 1,650 1,270 700 650 600 545 550 550 555 550 555 500
SWIS 5,060 5,000 5,010 5,240 5,410 6,590 5,500 5,710 7,500 7,350 7,510 7,400
TATEPA 650 650 650 600 650 650 650 650 650 650 650 650
TBL 16,980 14,490 14,090 14,050 14,290 15,000 14,500 14,500 14,500 14,950 15,100 15,100
TCC 16,190 16,300 16,740 16,500 17,100 17,010 16,500 16,500 16,500 16,400 16,330 16,300
TCCL 5,630 4,290 4,500 5,000 4,420 4,300 3,800 3,810 3,810 3,780 3,810 3,700
TOL 575 500 550 580 550 580 585 585 635 675 750 770
TPCC 4,500 4,010 4,000 3,990 3,890 3,980 3,800 3,500 3,500 3,410 3,800 3,390
USL 160 170 190 250 210 210 200 220 180 140 180 210
THE DAR ES SALAAM STOCK EXCHANGE PLC - QUARTERLY UPDATE THE DAR ES SALAAM STOCK EXCHANGE PLC - QUARTERLY UPDATE 7
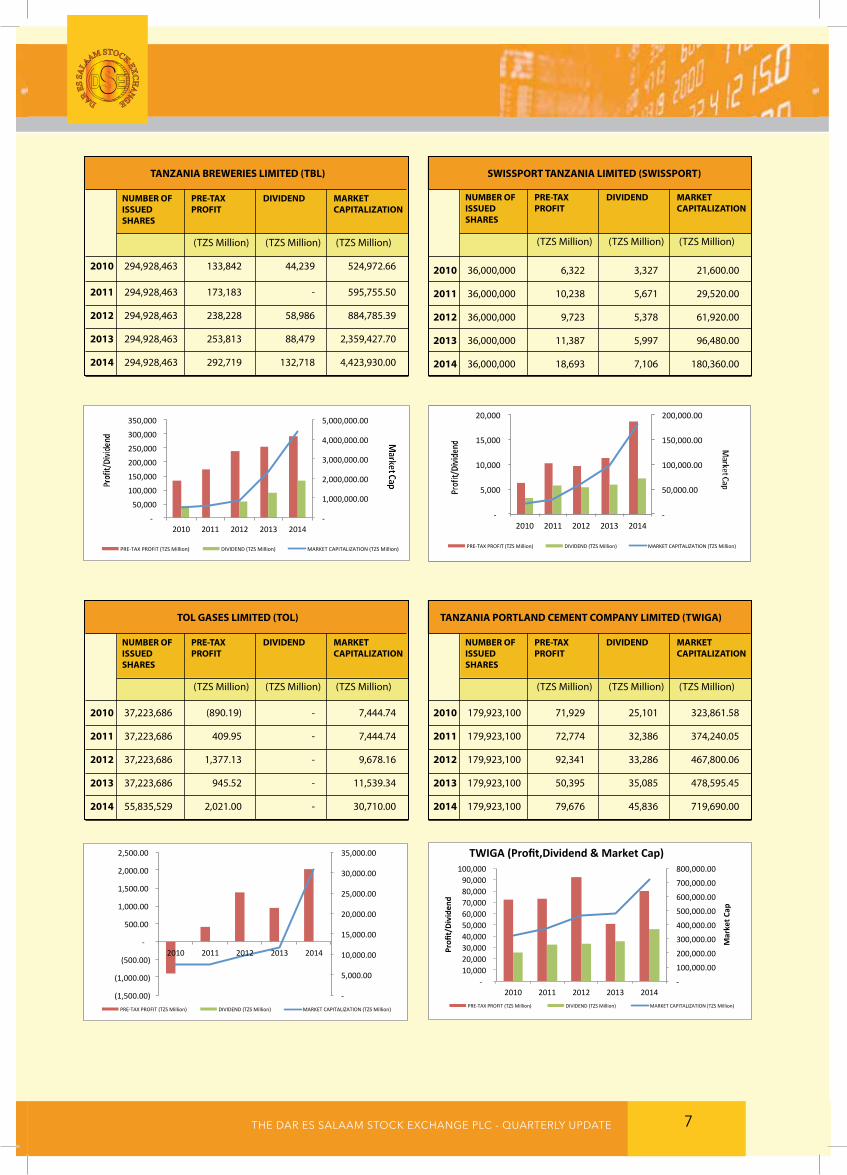
TanZania BrEwEriEs LiMiTED (TBL) nUMBEr OF PrE-TaX DiviDEnD MarKET issUED PrOFiT CaPiTaLiZaTiOn sHarEs
(TZS Million) (TZS Million) (TZS Million)
2010 294,928,463 133,842 44,239 524,972.66
2011 294,928,463 173,183 - 595,755.50
2012 294,928,463 238,228 58,986 884,785.39
2013 294,928,463 253,813 88,479 2,359,427.70
2014 294,928,463 292,719 132,718 4,423,930.00
TOL gasEs LiMiTED (TOL) nUMBEr OF PrE-TaX DiviDEnD MarKET issUED PrOFiT CaPiTaLiZaTiOn sHarEs
(TZS Million) (TZS Million) (TZS Million)
2010 37,223,686 (890.19) - 7,444.74
2011 37,223,686 409.95 - 7,444.74
2012 37,223,686 1,377.13 - 9,678.16
2013 37,223,686 945.52 - 11,539.34
2014 55,835,529 2,021.00 - 30,710.00
swissPOrT TanZania LiMiTED (swissPOrT) nUMBEr OF PrE-TaX DiviDEnD MarKET issUED PrOFiT CaPiTaLiZaTiOn sHarEs
(TZS Million) (TZS Million) (TZS Million)
2010 36,000,000 6,322 3,327 21,600.00
2011 36,000,000 10,238 5,671 29,520.00
2012 36,000,000 9,723 5,378 61,920.00
2013 36,000,000 11,387 5,997 96,480.00
2014 36,000,000 18,693 7,106 180,360.00
TanZania POrTLanD CEMEnT COMPanY LiMiTED (Twiga) nUMBEr OF PrE-TaX DiviDEnD MarKET issUED PrOFiT CaPiTaLiZaTiOn sHarEs
(TZS Million) (TZS Million) (TZS Million)
2010 179,923,100 71,929 25,101 323,861.58
2011 179,923,100 72,774 32,386 374,240.05
2012 179,923,100 92,341 33,286 467,800.06
2013 179,923,100 50,395 35,085 478,595.45
2014 179,923,100 79,676 45,836 719,690.00
-‐
1,000,000.00
2,000,000.00
3,000,000.00
4,000,000.00
5,000,000.00
-‐
50,000
100,000
150,000
200,000
250,000
300,000
350,000
2010 2011 2012 2013 2014
PRE-‐TAX PROFIT (TZS Million) DIVIDEND (TZS Million) MARKET CAPITALIZATION (TZS Million)
-‐
50,000.00
100,000.00
150,000.00
200,000.00
-‐
5,000
10,000
15,000
20,000
2010 2011 2012 2013 2014
PRE-‐TAX PROFIT (TZS Million) DIVIDEND (TZS Million) MARKET CAPITALIZATION (TZS Million)
-‐
5,000.00
10,000.00
15,000.00
20,000.00
25,000.00
30,000.00
35,000.00
(1,500.00)
(1,000.00)
(500.00)
-‐
500.00
1,000.00
1,500.00
2,000.00
2,500.00
2010 2011 2012 2013 2014
PRE-‐TAX PROFIT (TZS Million) DIVIDEND (TZS Million) MARKET CAPITALIZATION (TZS Million)
-‐
100,000.00
200,000.00
300,000.00
400,000.00
500,000.00
600,000.00
700,000.00
800,000.00
-‐ 10,000 20,000 30,000 40,000 50,000 60,000 70,000 80,000 90,000
100,000
2010 2011 2012 2013 2014
Market C
ap
Profi
t/Divide
nd
TWIGA (Profit,Dividend & Market Cap)
PRE-‐TAX PROFIT (TZS Million) DIVIDEND (TZS Million) MARKET CAPITALIZATION (TZS Million)
THE DAR ES SALAAM STOCK EXCHANGE PLC - QUARTERLY UPDATE THE DAR ES SALAAM STOCK EXCHANGE PLC - QUARTERLY UPDATE8
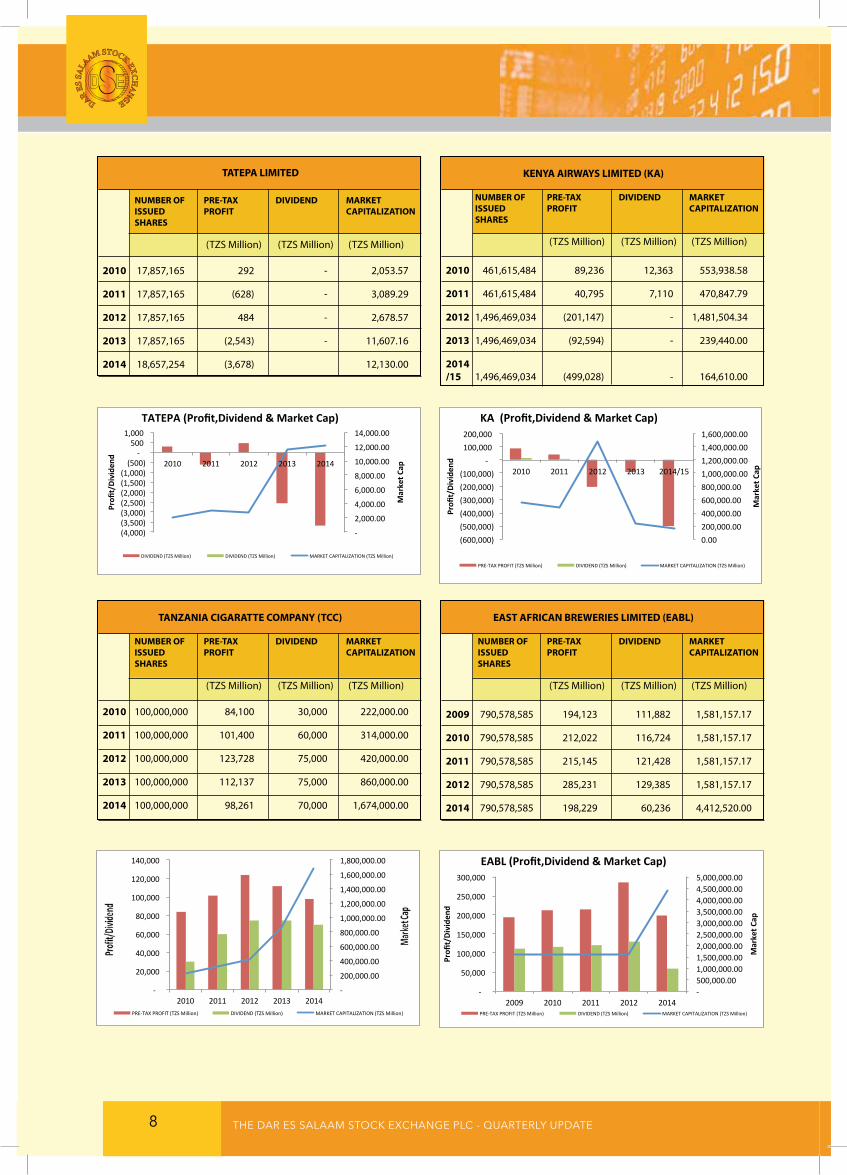
TaTEPa LiMiTED nUMBEr OF PrE-TaX DiviDEnD MarKET issUED PrOFiT CaPiTaLiZaTiOn sHarEs
(TZS Million) (TZS Million) (TZS Million)
2010 17,857,165 292 - 2,053.57
2011 17,857,165 (628) - 3,089.29
2012 17,857,165 484 - 2,678.57
2013 17,857,165 (2,543) - 11,607.16
2014 18,657,254 (3,678) 12,130.00
TanZania CigaraTTE COMPanY (TCC) nUMBEr OF PrE-TaX DiviDEnD MarKET issUED PrOFiT CaPiTaLiZaTiOn sHarEs
(TZS Million) (TZS Million) (TZS Million)
2010 100,000,000 84,100 30,000 222,000.00
2011 100,000,000 101,400 60,000 314,000.00
2012 100,000,000 123,728 75,000 420,000.00
2013 100,000,000 112,137 75,000 860,000.00
2014 100,000,000 98,261 70,000 1,674,000.00
KEnYa airwaYs LiMiTED (Ka) nUMBEr OF PrE-TaX DiviDEnD MarKET issUED PrOFiT CaPiTaLiZaTiOn sHarEs
(TZS Million) (TZS Million) (TZS Million)
2010 461,615,484 89,236 12,363 553,938.58
2011 461,615,484 40,795 7,110 470,847.79
2012 1,496,469,034 (201,147) - 1,481,504.34
2013 1,496,469,034 (92,594) - 239,440.00
2014 /15 1,496,469,034 (499,028) - 164,610.00
EasT aFriCan BrEwEriEs LiMiTED (EaBL) nUMBEr OF PrE-TaX DiviDEnD MarKET issUED PrOFiT CaPiTaLiZaTiOn sHarEs
(TZS Million) (TZS Million) (TZS Million)
2009 790,578,585 194,123 111,882 1,581,157.17
2010 790,578,585 212,022 116,724 1,581,157.17
2011 790,578,585 215,145 121,428 1,581,157.17
2012 790,578,585 285,231 129,385 1,581,157.17
2014 790,578,585 198,229 60,236 4,412,520.00
-‐
2,000.00
4,000.00
6,000.00
8,000.00
10,000.00
12,000.00
14,000.00
(4,000) (3,500) (3,000) (2,500) (2,000) (1,500) (1,000) (500)
-‐ 500
1,000
2010 2011 2012 2013 2014
Market C
ap
Profi
t/Divide
nd
TATEPA (Profit,Dividend & Market Cap)
DIVIDEND (TZS Million) DIVIDEND (TZS Million) MARKET CAPITALIZATION (TZS Million)
0.00 200,000.00 400,000.00 600,000.00 800,000.00 1,000,000.00 1,200,000.00 1,400,000.00 1,600,000.00
(600,000) (500,000) (400,000) (300,000) (200,000) (100,000)
-‐ 100,000 200,000
2010 2011 2012 2013 2014/15
Market C
ap
Profi
t/Divide
nd
KA (Profit,Dividend & Market Cap)
PRE-‐TAX PROFIT (TZS Million) DIVIDEND (TZS Million) MARKET CAPITALIZATION (TZS Million)
-‐
200,000.00
400,000.00
600,000.00
800,000.00
1,000,000.00
1,200,000.00
1,400,000.00
1,600,000.00
1,800,000.00
-‐
20,000
40,000
60,000
80,000
100,000
120,000
140,000
2010 2011 2012 2013 2014 PRE-‐TAX PROFIT (TZS Million) DIVIDEND (TZS Million) MARKET CAPITALIZATION (TZS Million)
-‐ 500,000.00 1,000,000.00 1,500,000.00 2,000,000.00 2,500,000.00 3,000,000.00 3,500,000.00 4,000,000.00 4,500,000.00 5,000,000.00
-‐
50,000
100,000
150,000
200,000
250,000
300,000
2009 2010 2011 2012 2014
Market C
ap
Profi
t/Divide
nd
EABL (Profit,Dividend & Market Cap)
PRE-‐TAX PROFIT (TZS Million) DIVIDEND (TZS Million) MARKET CAPITALIZATION (TZS Million)
THE DAR ES SALAAM STOCK EXCHANGE PLC - QUARTERLY UPDATE THE DAR ES SALAAM STOCK EXCHANGE PLC - QUARTERLY UPDATE 9
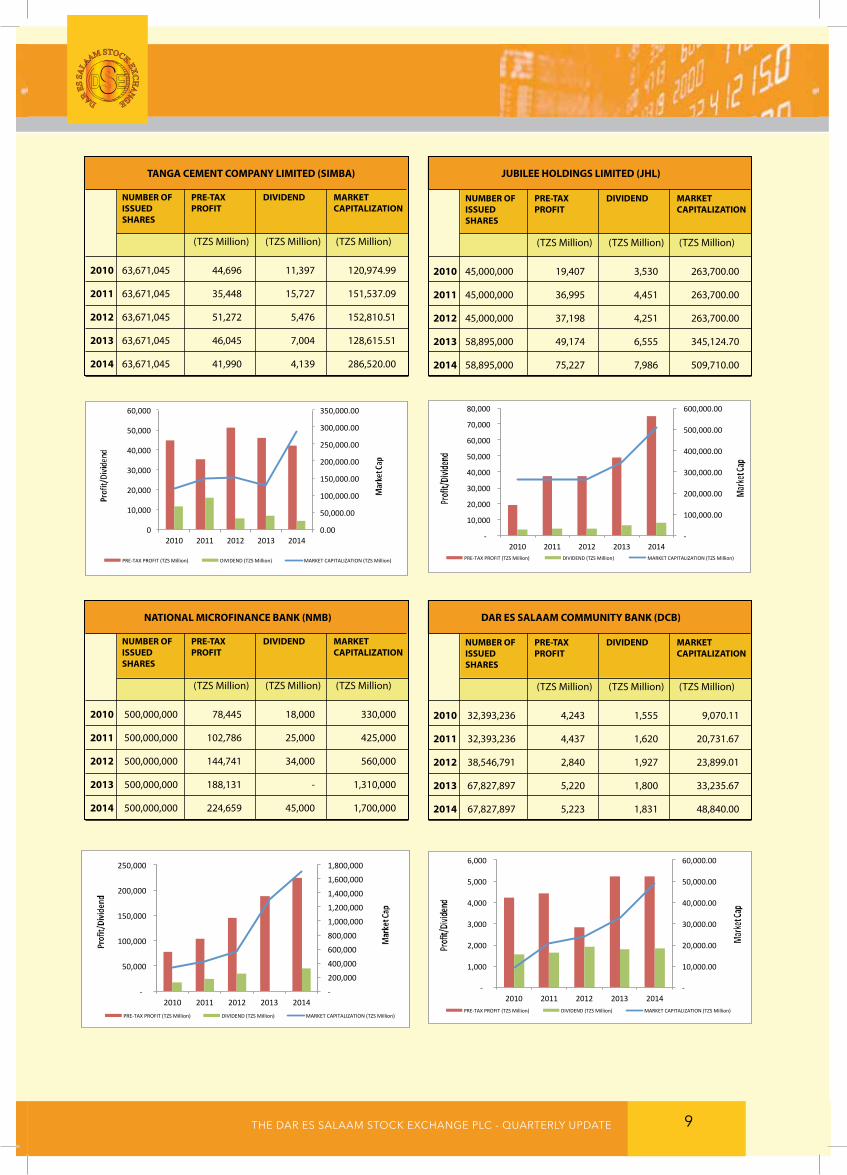
Tanga CEMEnT COMPanY LiMiTED (siMBa) nUMBEr OF PrE-TaX DiviDEnD MarKET issUED PrOFiT CaPiTaLiZaTiOn sHarEs
(TZS Million) (TZS Million) (TZS Million)
2010 63,671,045 44,696 11,397 120,974.99
2011 63,671,045 35,448 15,727 151,537.09
2012 63,671,045 51,272 5,476 152,810.51
2013 63,671,045 46,045 7,004 128,615.51
2014 63,671,045 41,990 4,139 286,520.00
naTiOnaL MiCrOFinanCE BanK (nMB) nUMBEr OF PrE-TaX DiviDEnD MarKET issUED PrOFiT CaPiTaLiZaTiOn sHarEs
(TZS Million) (TZS Million) (TZS Million)
2010 500,000,000 78,445 18,000 330,000
2011 500,000,000 102,786 25,000 425,000
2012 500,000,000 144,741 34,000 560,000
2013 500,000,000 188,131 - 1,310,000
2014 500,000,000 224,659 45,000 1,700,000
JUBiLEE HOLDings LiMiTED (JHL) nUMBEr OF PrE-TaX DiviDEnD MarKET issUED PrOFiT CaPiTaLiZaTiOn sHarEs
(TZS Million) (TZS Million) (TZS Million)
2010 45,000,000 19,407 3,530 263,700.00
2011 45,000,000 36,995 4,451 263,700.00
2012 45,000,000 37,198 4,251 263,700.00
2013 58,895,000 49,174 6,555 345,124.70
2014 58,895,000 75,227 7,986 509,710.00
Dar Es saLaaM COMMUniTY BanK (DCB) nUMBEr OF PrE-TaX DiviDEnD MarKET issUED PrOFiT CaPiTaLiZaTiOn sHarEs
(TZS Million) (TZS Million) (TZS Million)
2010 32,393,236 4,243 1,555 9,070.11
2011 32,393,236 4,437 1,620 20,731.67
2012 38,546,791 2,840 1,927 23,899.01
2013 67,827,897 5,220 1,800 33,235.67
2014 67,827,897 5,223 1,831 48,840.00
0.00
50,000.00
100,000.00
150,000.00
200,000.00
250,000.00
300,000.00
350,000.00
0
10,000
20,000
30,000
40,000
50,000
60,000
2010 2011 2012 2013 2014
PRE-‐TAX PROFIT (TZS Million) DIVIDEND (TZS Million) MARKET CAPITALIZATION (TZS Million)
-‐
100,000.00
200,000.00
300,000.00
400,000.00
500,000.00
600,000.00
-‐
10,000
20,000
30,000
40,000
50,000
60,000
70,000
80,000
2010 2011 2012 2013 2014 PRE-‐TAX PROFIT (TZS Million) DIVIDEND (TZS Million) MARKET CAPITALIZATION (TZS Million)
-‐
200,000
400,000
600,000
800,000
1,000,000
1,200,000
1,400,000
1,600,000
1,800,000
-‐
50,000
100,000
150,000
200,000
250,000
2010 2011 2012 2013 2014 PRE-‐TAX PROFIT (TZS Million) DIVIDEND (TZS Million) MARKET CAPITALIZATION (TZS Million)
-‐
10,000.00
20,000.00
30,000.00
40,000.00
50,000.00
60,000.00
-‐
1,000
2,000
3,000
4,000
5,000
6,000
2010 2011 2012 2013 2014 PRE-‐TAX PROFIT (TZS Million) DIVIDEND (TZS Million) MARKET CAPITALIZATION (TZS Million)
THE DAR ES SALAAM STOCK EXCHANGE PLC - QUARTERLY UPDATE THE DAR ES SALAAM STOCK EXCHANGE PLC - QUARTERLY UPDATE10
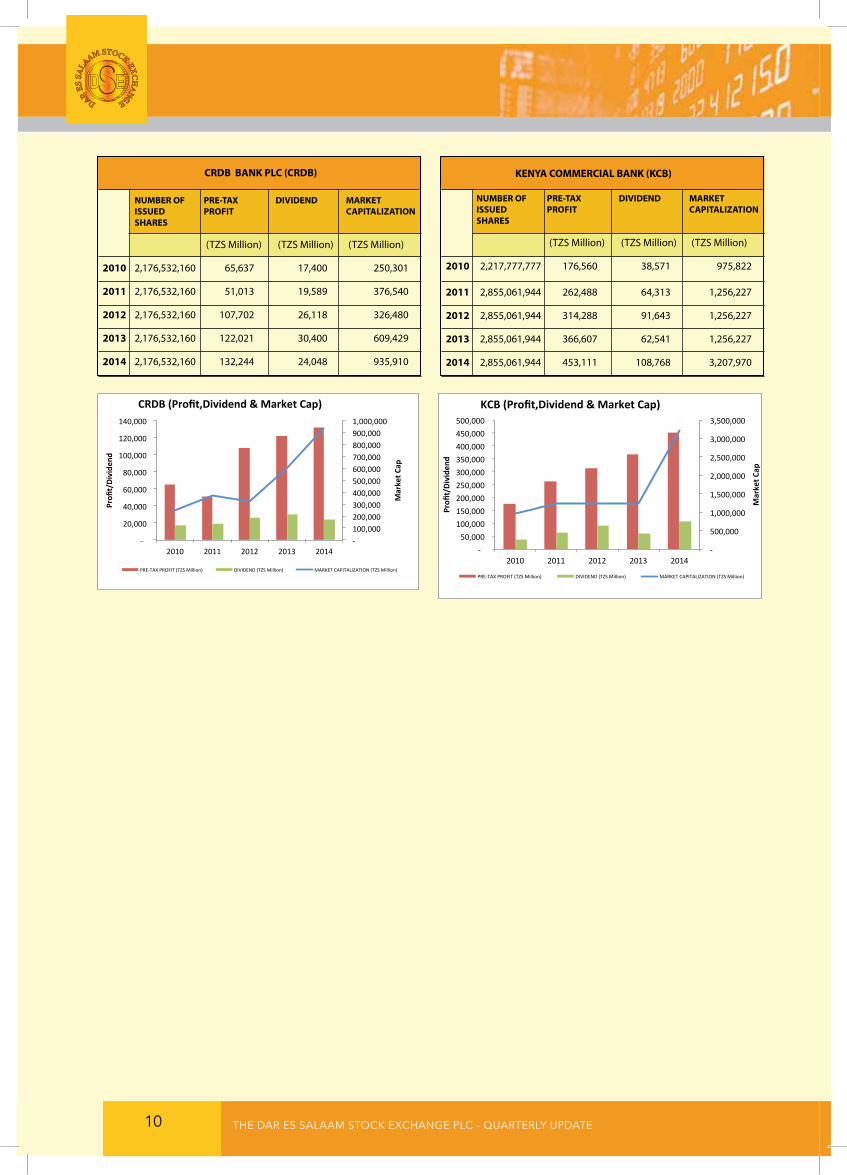
CrDB BanK PLC (CrDB) nUMBEr OF PrE-TaX DiviDEnD MarKET issUED PrOFiT CaPiTaLiZaTiOn sHarEs
(TZS Million) (TZS Million) (TZS Million)
2010 2,176,532,160 65,637 17,400 250,301
2011 2,176,532,160 51,013 19,589 376,540
2012 2,176,532,160 107,702 26,118 326,480
2013 2,176,532,160 122,021 30,400 609,429
2014 2,176,532,160 132,244 24,048 935,910
KEnYa COMMErCiaL BanK (KCB) nUMBEr OF PrE-TaX DiviDEnD MarKET issUED PrOFiT CaPiTaLiZaTiOn sHarEs
(TZS Million) (TZS Million) (TZS Million)
2010 2,217,777,777 176,560 38,571 975,822
2011 2,855,061,944 262,488 64,313 1,256,227
2012 2,855,061,944 314,288 91,643 1,256,227
2013 2,855,061,944 366,607 62,541 1,256,227
2014 2,855,061,944 453,111 108,768 3,207,970
-‐ 100,000 200,000 300,000 400,000 500,000 600,000 700,000 800,000 900,000 1,000,000
-‐
20,000
40,000
60,000
80,000
100,000
120,000
140,000
2010 2011 2012 2013 2014
Market C
ap
Profi
t/Divide
nd
CRDB (Profit,Dividend & Market Cap)
PRE-‐TAX PROFIT (TZS Million) DIVIDEND (TZS Million) MARKET CAPITALIZATION (TZS Million)
-‐
500,000
1,000,000
1,500,000
2,000,000
2,500,000
3,000,000
3,500,000
-‐ 50,000
100,000 150,000 200,000 250,000 300,000 350,000 400,000 450,000 500,000
2010 2011 2012 2013 2014
Market C
ap
Profi
t/Divide
nd
KCB (Profit,Dividend & Market Cap)
PRE-‐TAX PROFIT (TZS Million) DIVIDEND (TZS Million) MARKET CAPITALIZATION (TZS Million)
THE DAR ES SALAAM STOCK EXCHANGE PLC - QUARTERLY UPDATE THE DAR ES SALAAM STOCK EXCHANGE PLC - QUARTERLY UPDATE 11
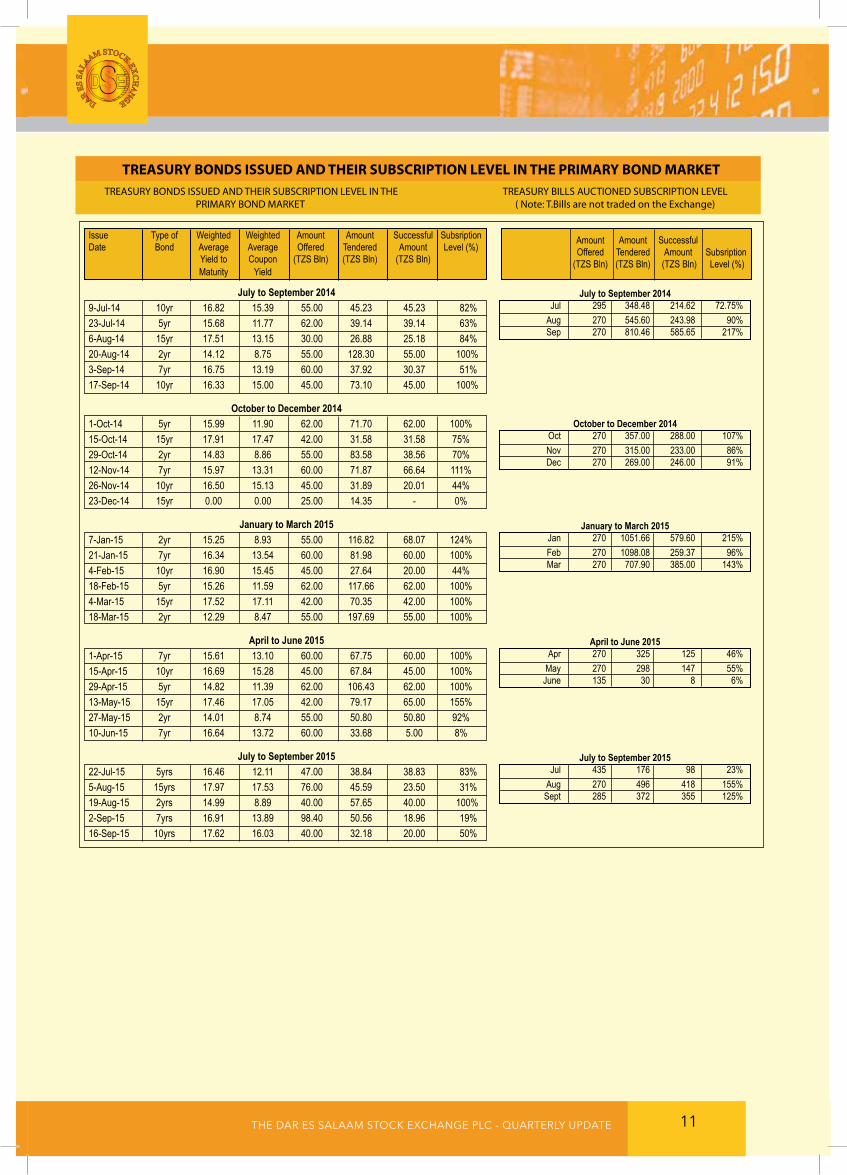
TrEasUrY BOnDs issUED anD THEir sUBsCriPTiOn LEvEL in THE PriMarY BOnD MarKET TREASURY BONDS ISSUED AND THEIR SUBSCRIPTION LEVEL IN THE
PRIMARY BOND MARKETTREASURY BILLS AUCTIONED SUBSCRIPTION LEVEL
( Note: T.Bills are not traded on the Exchange)
Issue Type of Weighted Weighted Amount Amount Successful Subsription Date Bond Average Average Offered Tendered Amount Level (%) Yield to Coupon (TZS Bln) (TZS Bln) (TZS Bln) Maturity Yield
July to September 20149-Jul-14 10yr 16.82 15.39 55.00 45.23 45.23 82%23-Jul-14 5yr 15.68 11.77 62.00 39.14 39.14 63%6-Aug-14 15yr 17.51 13.15 30.00 26.88 25.18 84%20-Aug-14 2yr 14.12 8.75 55.00 128.30 55.00 100%3-Sep-14 7yr 16.75 13.19 60.00 37.92 30.37 51%17-Sep-14 10yr 16.33 15.00 45.00 73.10 45.00 100%
October to December 20141-Oct-14 5yr 15.99 11.90 62.00 71.70 62.00 100%15-Oct-14 15yr 17.91 17.47 42.00 31.58 31.58 75%29-Oct-14 2yr 14.83 8.86 55.00 83.58 38.56 70%12-Nov-14 7yr 15.97 13.31 60.00 71.87 66.64 111%26-Nov-14 10yr 16.50 15.13 45.00 31.89 20.01 44%23-Dec-14 15yr 0.00 0.00 25.00 14.35 - 0%
January to March 20157-Jan-15 2yr 15.25 8.93 55.00 116.82 68.07 124%21-Jan-15 7yr 16.34 13.54 60.00 81.98 60.00 100%4-Feb-15 10yr 16.90 15.45 45.00 27.64 20.00 44%18-Feb-15 5yr 15.26 11.59 62.00 117.66 62.00 100%4-Mar-15 15yr 17.52 17.11 42.00 70.35 42.00 100%18-Mar-15 2yr 12.29 8.47 55.00 197.69 55.00 100%
April to June 20151-Apr-15 7yr 15.61 13.10 60.00 67.75 60.00 100%15-Apr-15 10yr 16.69 15.28 45.00 67.84 45.00 100%29-Apr-15 5yr 14.82 11.39 62.00 106.43 62.00 100%13-May-15 15yr 17.46 17.05 42.00 79.17 65.00 155%27-May-15 2yr 14.01 8.74 55.00 50.80 50.80 92%10-Jun-15 7yr 16.64 13.72 60.00 33.68 5.00 8%
July to September 201522-Jul-15 5yrs 16.46 12.11 47.00 38.84 38.83 83%5-Aug-15 15yrs 17.97 17.53 76.00 45.59 23.50 31%19-Aug-15 2yrs 14.99 8.89 40.00 57.65 40.00 100%2-Sep-15 7yrs 16.91 13.89 98.40 50.56 18.96 19%16-Sep-15 10yrs 17.62 16.03 40.00 32.18 20.00 50%
Amount Amount Successful Offered Tendered Amount Subsription (TZS Bln) (TZS Bln) (TZS Bln) Level (%)
July to September 2014 Jul 295 348.48 214.62 72.75% Aug 270 545.60 243.98 90% Sep 270 810.46 585.65 217%
October to December 2014 Oct 270 357.00 288.00 107% Nov 270 315.00 233.00 86% Dec 270 269.00 246.00 91%
January to March 2015 Jan 270 1051.66 579.60 215% Feb 270 1098.08 259.37 96% Mar 270 707.90 385.00 143%
April to June 2015 Apr 270 325 125 46% May 270 298 147 55% June 135 30 8 6%
July to September 2015 Jul 435 176 98 23% Aug 270 496 418 155% Sept 285 372 355 125%
THE DAR ES SALAAM STOCK EXCHANGE PLC - QUARTERLY UPDATE12
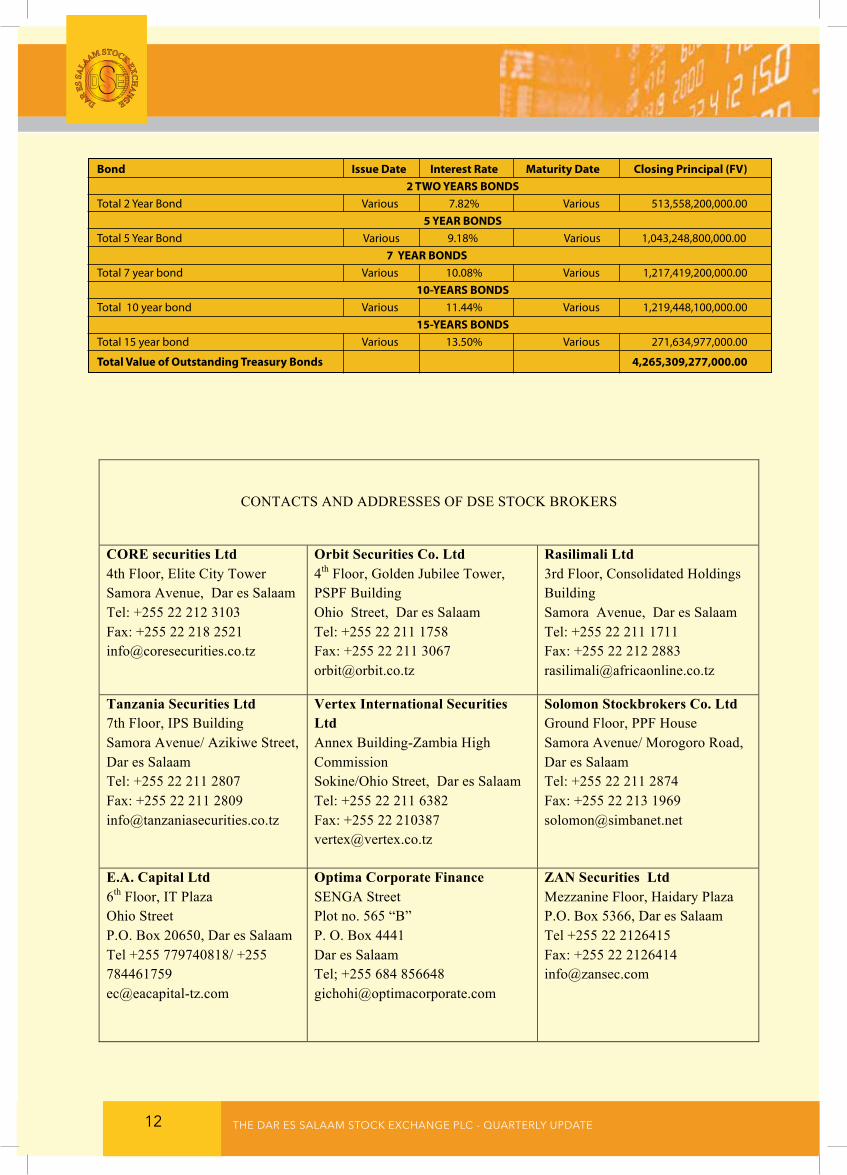
Bond issue Date interest rate Maturity Date Closing Principal (Fv)
2 TwO YEars BOnDs Total 2 Year Bond Various 7.82% Various 513,558,200,000.00 5 YEar BOnDs Total 5 Year Bond Various 9.18% Various 1,043,248,800,000.00
7 YEar BOnDs
Total 7 year bond Various 10.08% Various 1,217,419,200,000.00 10-YEars BOnDs Total 10 year bond Various 11.44% Various 1,219,448,100,000.00 15-YEars BOnDs Total 15 year bond Various 13.50% Various 271,634,977,000.00
Total value of Outstanding Treasury Bonds 4,265,309,277,000.00
8
CONTACTS AND ADDRESSES OF DSE STOCK BROKERS
CORE securities Ltd 4th Floor, Elite City Tower Samora Avenue, Dar es Salaam Tel: +255 22 212 3103 Fax: +255 22 218 2521 [email protected]
Orbit Securities Co. Ltd 4th Floor, Golden Jubilee Tower, PSPF Building Ohio Street, Dar es Salaam Tel: +255 22 211 1758 Fax: +255 22 211 3067 [email protected]
Rasilimali Ltd 3rd Floor, Consolidated Holdings Building Samora Avenue, Dar es Salaam Tel: +255 22 211 1711 Fax: +255 22 212 2883 [email protected]
Tanzania Securities Ltd 7th Floor, IPS Building Samora Avenue/ Azikiwe Street, Dar es Salaam Tel: +255 22 211 2807 Fax: +255 22 211 2809 [email protected]
Vertex International Securities Ltd Annex Building-Zambia High Commission Sokine/Ohio Street, Dar es Salaam Tel: +255 22 211 6382 Fax: +255 22 210387 [email protected]
Solomon Stockbrokers Co. Ltd Ground Floor, PPF House Samora Avenue/ Morogoro Road, Dar es Salaam Tel: +255 22 211 2874 Fax: +255 22 213 1969 [email protected]
E.A. Capital Ltd 6th Floor, IT Plaza Ohio Street P.O. Box 20650, Dar es Salaam Tel +255 779740818/ +255 784461759 [email protected]
Optima Corporate Finance SENGA Street Plot no. 565 “B” P. O. Box 4441 Dar es Salaam Tel; +255 684 856648 [email protected]
ZAN Securities Ltd Mezzanine Floor, Haidary Plaza P.O. Box 5366, Dar es Salaam Tel +255 22 2126415 Fax: +255 22 2126414 [email protected]