Embed Size (px)
DESCRIPTION
The Danish Wood Pellet Survey By Peter Dal, DEA. Third meeting in the Oslo Group on energy statistics Vienna, 4-6 February 2008. Background. After a “moderate” increase in the consumption of wood pellets from 1990 to late 90’ies the increase became explosive - PowerPoint PPT Presentation
Citation preview
The Danish Wood Pellet Survey By Peter Dal, DEA
Third meeting in the Oslo Group on energy statistics
Vienna, 4-6 February 2008
2
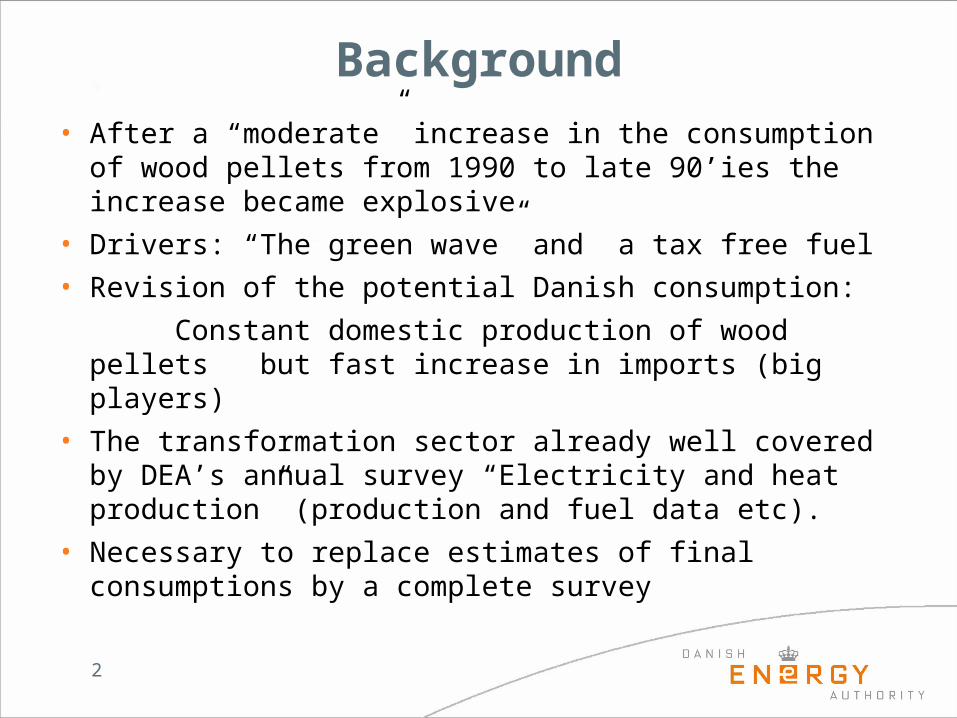
Background• After a “moderate” increase in the consumption
of wood pellets from 1990 to late 90’ies the increase became explosive
• Drivers: “The green wave” and a tax free fuel
• Revision of the potential Danish consumption:
Constant domestic production of wood pellets but fast increase in imports (big players)
• The transformation sector already well covered by DEA’s annual survey “Electricity and heat production” (production and fuel data etc).
• Necessary to replace estimates of final consumptions by a complete survey
3
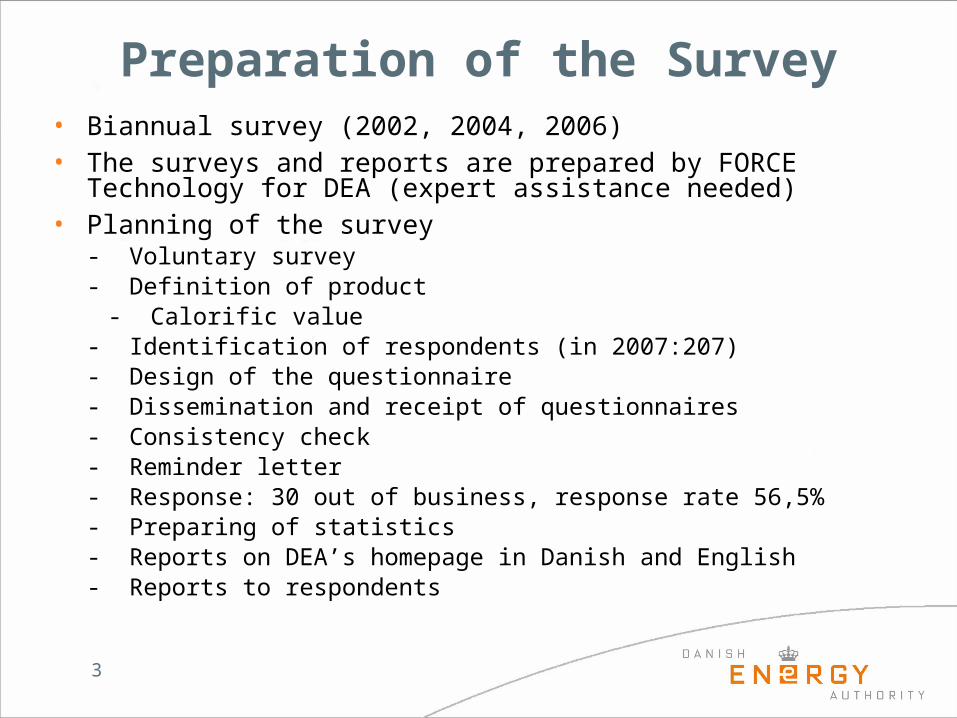
Preparation of the Survey• Biannual survey (2002, 2004, 2006)• The surveys and reports are prepared by FORCE
Technology for DEA (expert assistance needed)• Planning of the survey - Voluntary survey
- Definition of product - Calorific value
- Identification of respondents (in 2007:207) - Design of the questionnaire
- Dissemination and receipt of questionnaires- Consistency check- Reminder letter- Response: 30 out of business, response rate 56,5%- Preparing of statistics - Reports on DEA’s homepage in Danish and English- Reports to respondents
4
Definition of Wood Pellets
Pellets made from shavings, sawdust etc. from production of wooden products. Size 8-10 mm diameter. The wood fibres are uncontaminated; a national Danish regulation determines the distinction between uncontaminated wood fuels and waste.
Pellets made from waste e.g. MSW in not included in the definition. However, as it is difficult to determine the origin of a specific supply of pellets, it is possible that some data-sources might include smaller fractions of pellets made from other materials than uncontaminated wood fibres (straw, MSW etc.) in figures and estimates.
5
Calorific Value – Heating Value
The lower heating value (LHV) of wood pellets is based on an average LHV for wood of 19.0 GJ/ton dry matter. This figure is based on a number of laboratory determinations of heating values for uncontaminated wood samples.
The water content of the pellets is determined in different studies to be between 6 % and 8 %.
Thus a heating value of 17.5 GJ/tons based on 7 % water content has been calculated using the formula:19.0 • 0.93 – 2.45 • 0.07 = 17.5 GJ/ton
This figure 17.5 GJ/ton wood pellets covers the markets average in terms of water content and dry matter heating value. The figure has been used continuously in the energy statistics since 1986.
6
The Wood Pellet Questionnaire 2006
• Stocks of wood pelletsOpening stocks ……….. tonsClosing stocks ……….. tons
• Supply of wood pelletsOwn production ……….. tonsDomestic purchase ……….. tonsImports (+ by country) ……….. tons
• Sales of wood pelletsExports (+ by country) ……….. tonsSales to other inland sales company ……….. tonsSales to final consumer
Electricity and heat plants ……….. tonsIndustry ……….. tonsPublic sector ……….. tonsHouseholds ……….. tons
• Own consumption of wood pellets ……….. tons
7
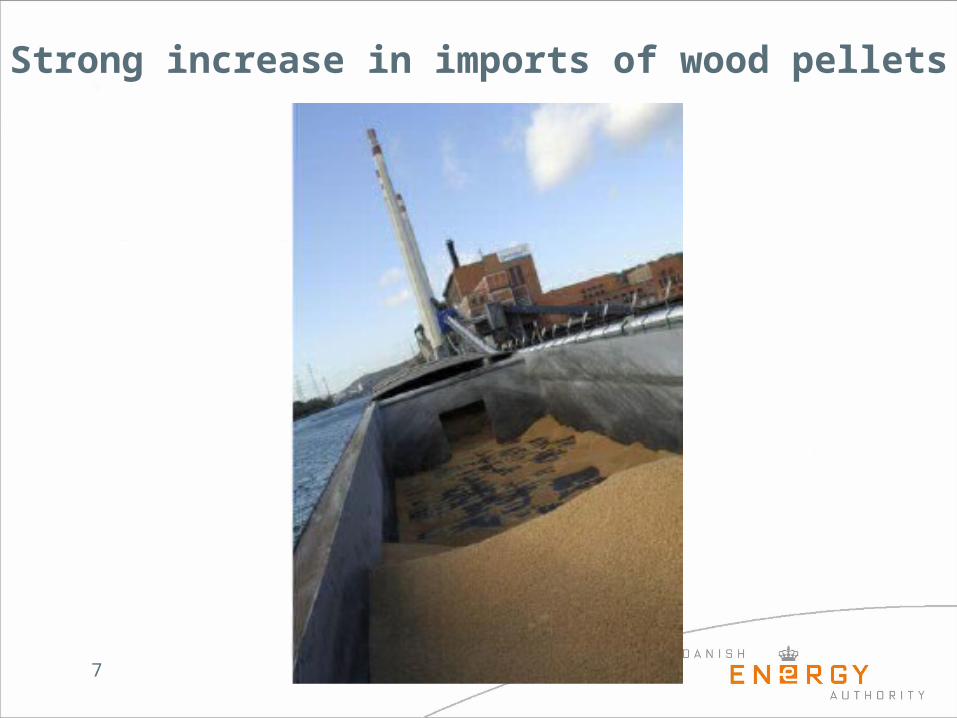
Strong increase in imports of wood pellets
8
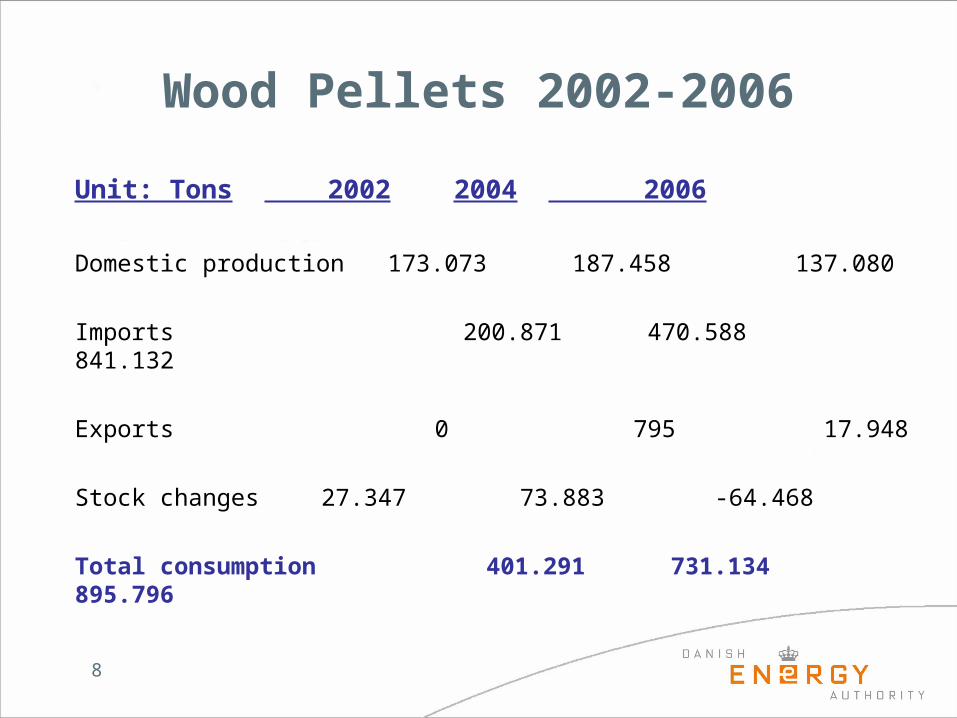
Wood Pellets 2002-2006
Unit: Tons 2002 2004 2006
Domestic production 173.073 187.458 137.080
Imports 200.871 470.588 841.132
Exports 0 795 17.948
Stock changes 27.347 73.883 -64.468
Total consumption 401.291 731.134 895.796
9
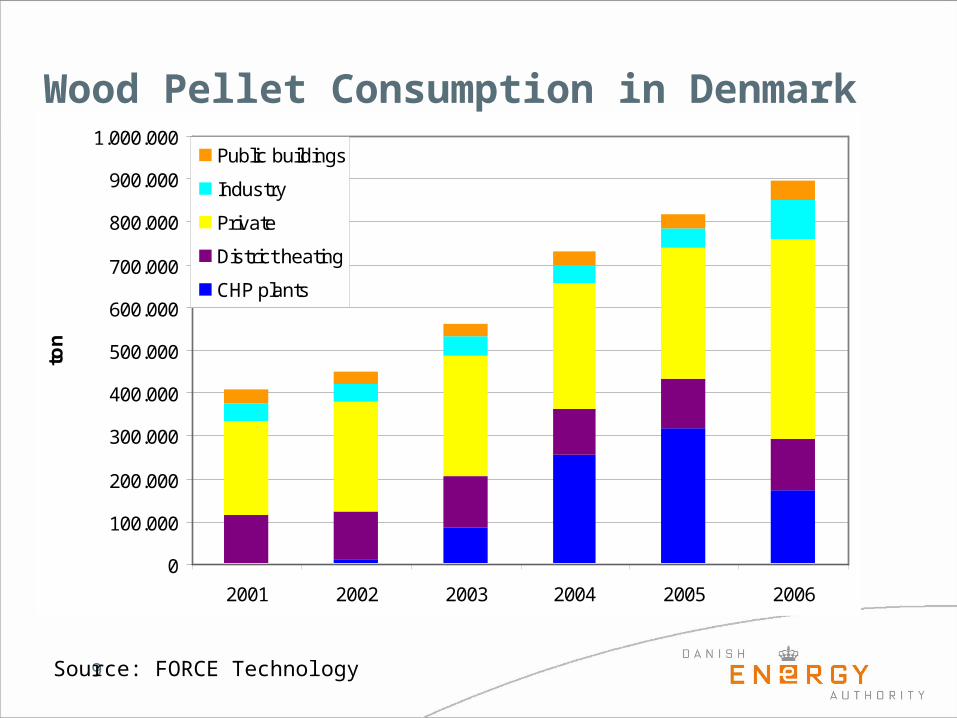
Wood Pellet Consumption in Denmark
0
100.000
200.000
300.000
400.000
500.000
600.000
700.000
800.000
900.000
1.000.000
2001 2002 2003 2004 2005 2006
ton
Public buildings
Industry
Private
District heating
CHP plants
Source: FORCE Technology
10
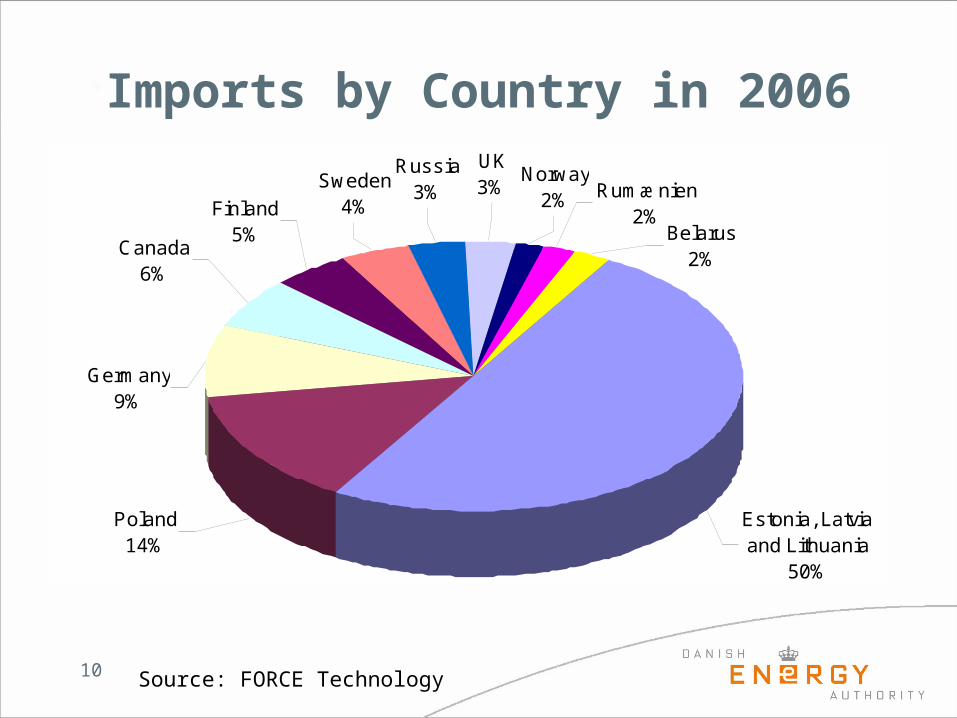
Imports by Country in 2006
Source: FORCE Technology
Belarus2%
Rumænien2%
Norway2%
Russia3%
UK3%Sweden
4%Finland5%
Canada6%
Germany9%
Estonia, Latvia and Lithuania
50%
Poland14%
11
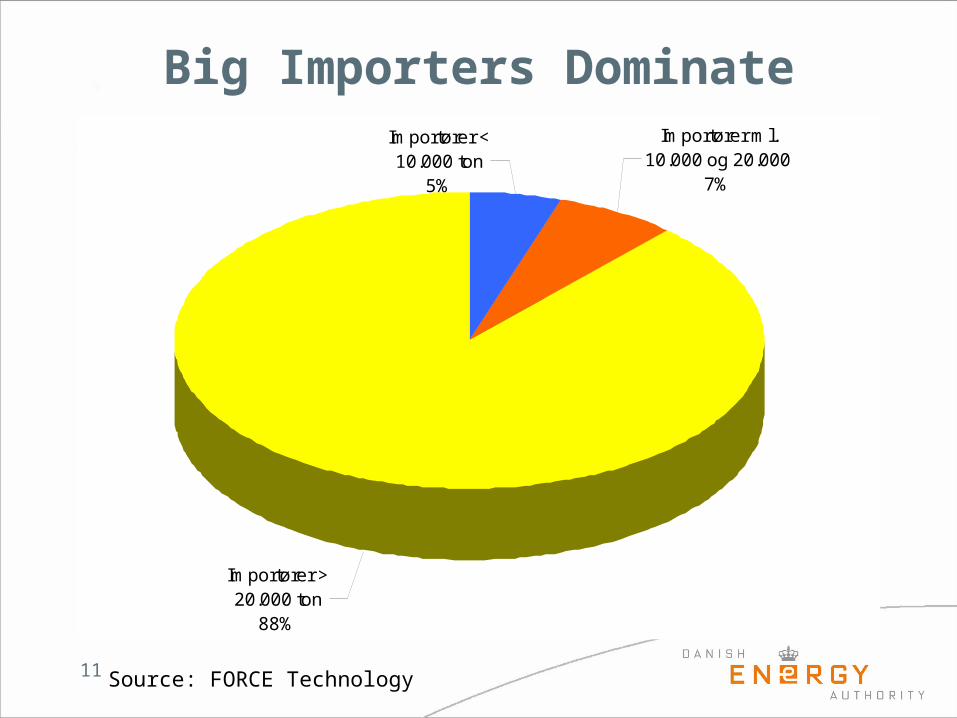
Big Importers DominateImportører < 10.000 ton
5%
Importører ml. 10.000 og 20.000
7%
Importører > 20.000 ton
88%
Source: FORCE Technology
12
Report 2006 on Wood Pelletshttp://www.ens.dk/sw20916.asp?lsearchdataid=90962
Methods on Biomass• Wood pellets• Wood chips• Firewood• Wood waste• Straw http://www.ens.dk/sw48948.asp
13
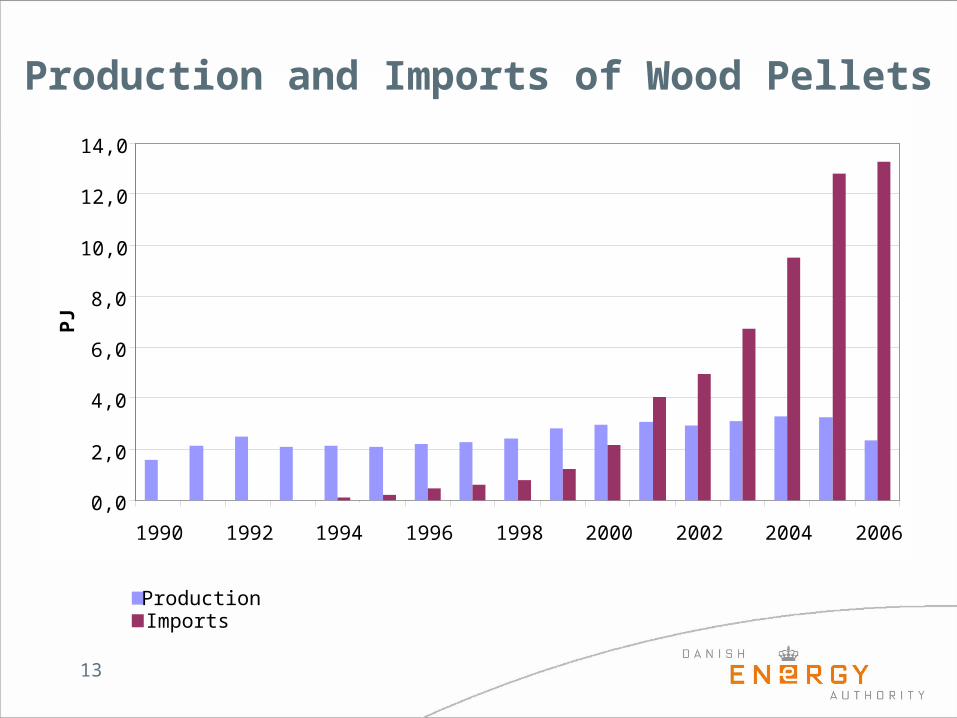
Production and Imports of Wood Pellets
0,0
2,0
4,0
6,0
8,0
10,0
12,0
14,0
1990 1992 1994 1996 1998 2000 2002 2004 2006
PJ
ProductionImports
14
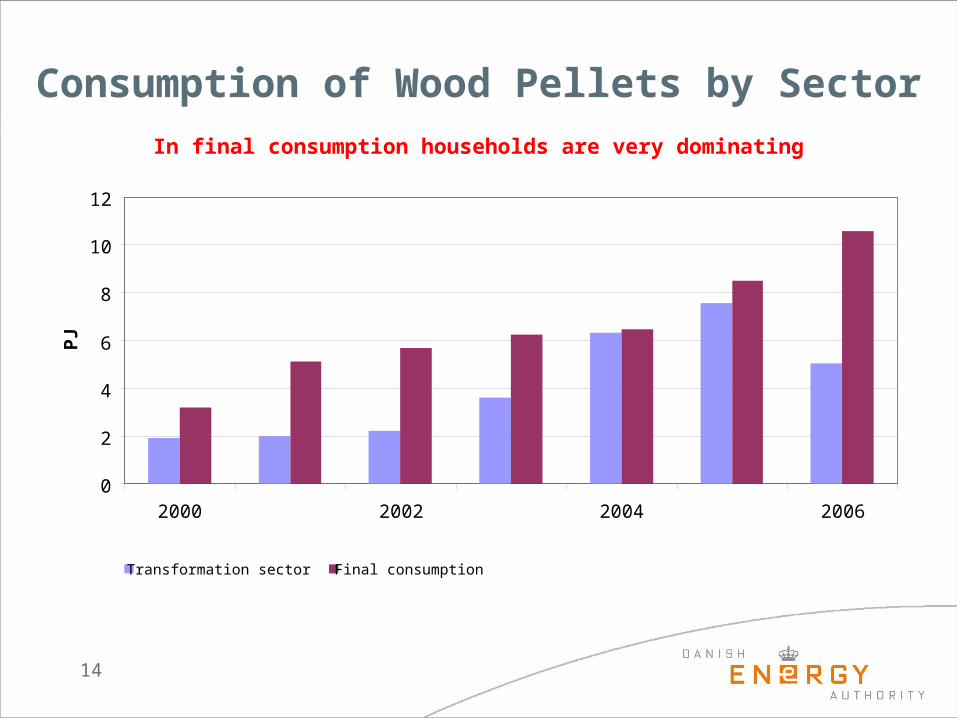
Consumption of Wood Pellets by SectorIn final consumption households are very dominating
0
2
4
6
8
10
12
2000 2002 2004 2006
PJ
Transformation sector Final consumption
15
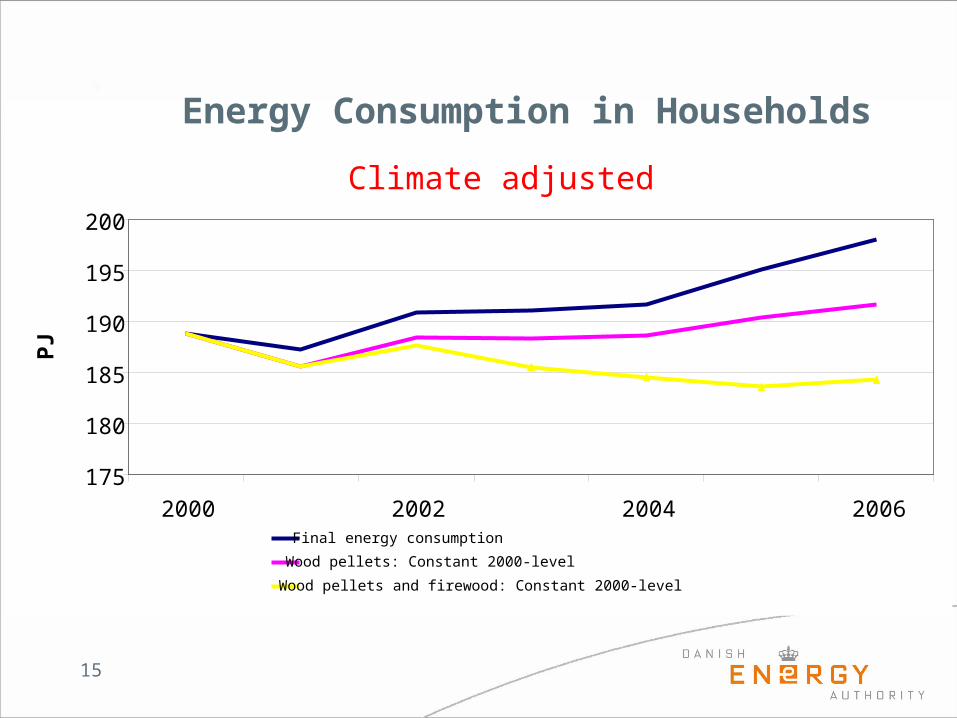
Energy Consumption in Households
Climate adjusted
175
180
185
190
195
200
2000 2002 2004 2006
PJ
Final energy consumption
Wood pellets: Constant 2000-level
Wood pellets and firewood: Constant 2000-level
16
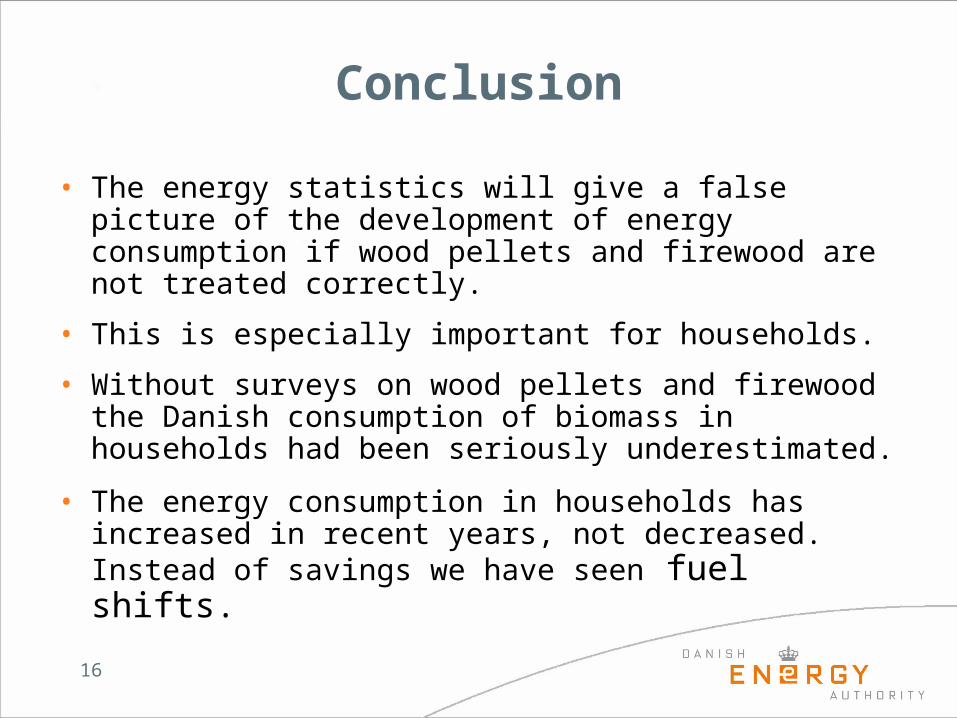
Conclusion
• The energy statistics will give a false picture of the development of energy consumption if wood pellets and firewood are not treated correctly.
• This is especially important for households.
• Without surveys on wood pellets and firewood the Danish consumption of biomass in households had been seriously underestimated.
• The energy consumption in households has increased in recent years, not decreased. Instead of savings we have seen fuel shifts.
17
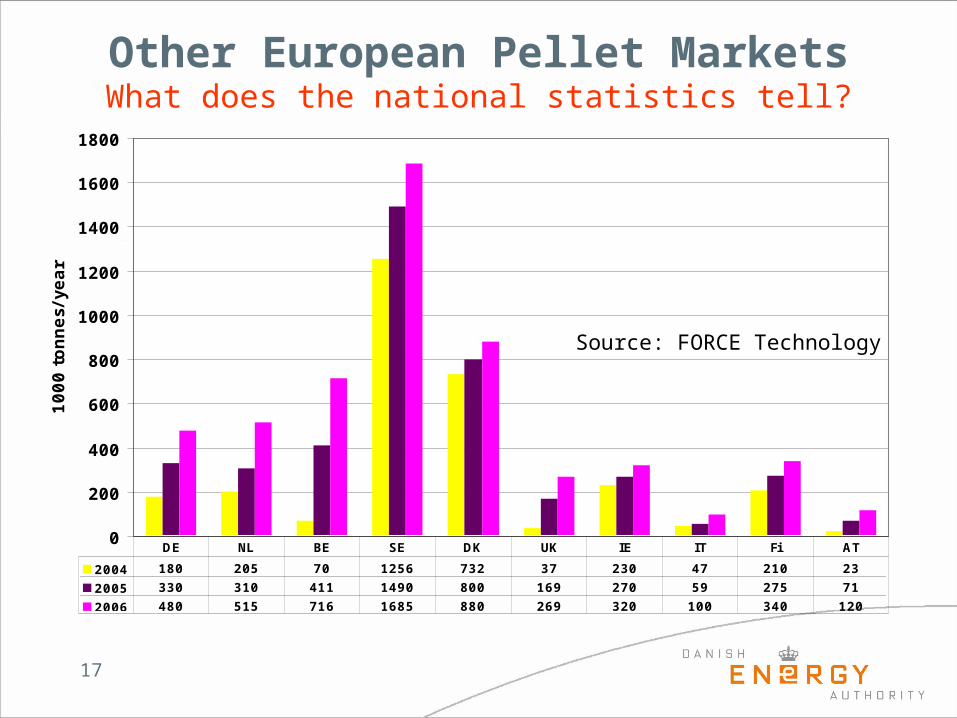
Other European Pellet MarketsWhat does the national statistics tell?
0
200
400
600
800
1000
1200
1400
1600
1800
1000 t
onnes/
year
2004 180 205 70 1256 732 37 230 47 210 23
2005 330 310 411 1490 800 169 270 59 275 71
2006 480 515 716 1685 880 269 320 100 340 120
DE NL BE SE DK UK IE IT Fi AT
Source: FORCE Technology