Embed Size (px)
Citation preview
The current status of fisheries stock assessment
Mark MaunderInter-American Tropical Tuna Commission (IATTC)
Center for the Advancement of Population Assessment Methodology (CAPAM)
Outline
• The World Conference on Stock Assessment Methods
• Current uncertainties• Modeling temporal variation in catch
composition data
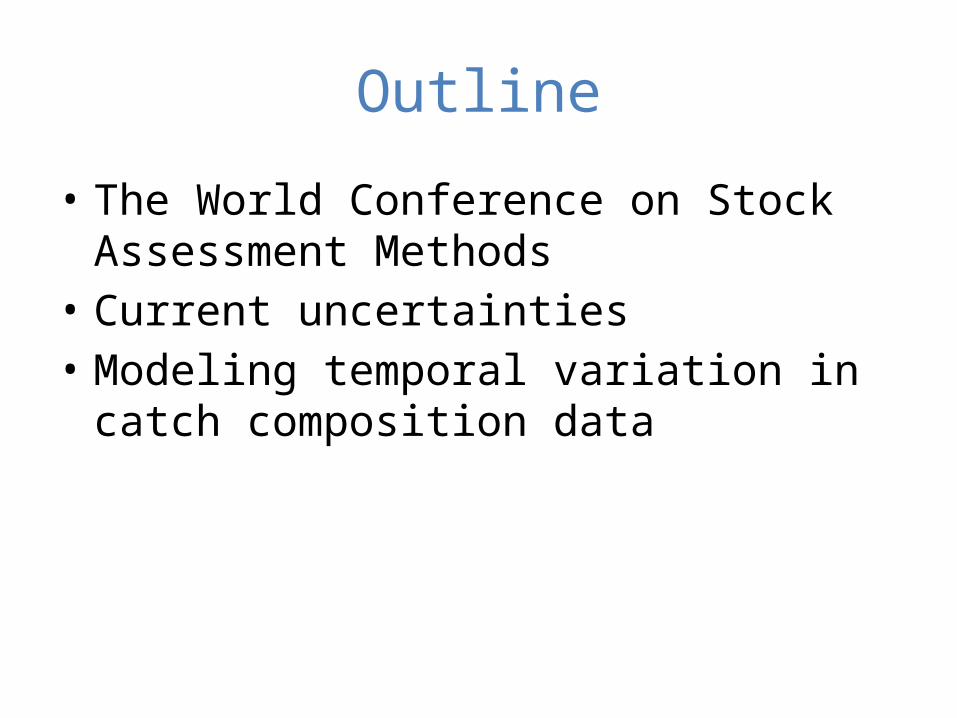
The World Conference on Stock Assessment Methods
• Workshop (15th-16th July 2013) – Different models fit to real and simulated data
• Conference (17th-19th July 2013)– Key Challenges for Single Species Assessments – Assessing Ecosystem Dynamics & Structure – Spatial Complexity and Temporal Change– Data Poor Approaches
• Abstracts and presentations on line– http://www.ices.dk/news-and-events/symposia/
WCSAM-2013
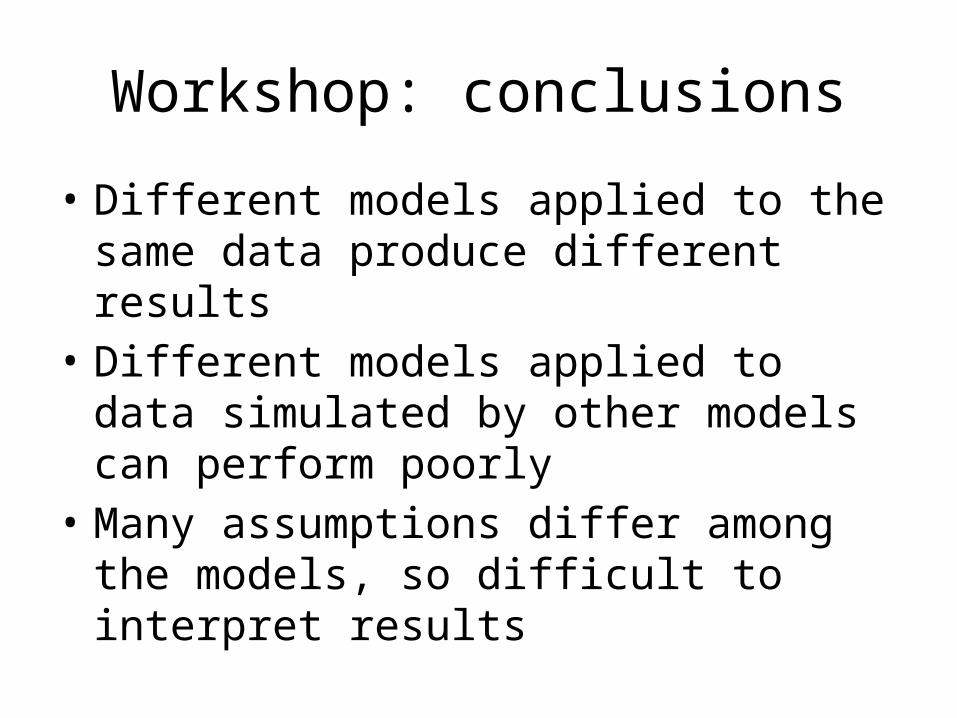
Workshop: conclusions
• Different models applied to the same data produce different results
• Different models applied to data simulated by other models can perform poorly
• Many assumptions differ among the models, so difficult to interpret results
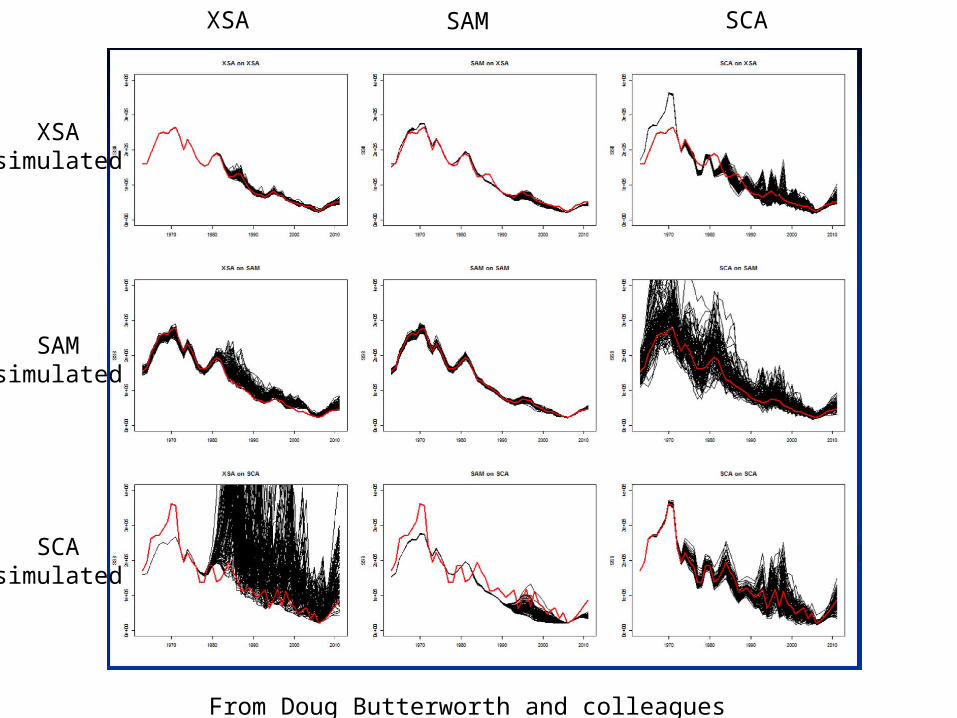
From Doug Butterworth and colleagues
XSAsimulated
SAMsimulated
SCAsimulated
XSA SAM SCA
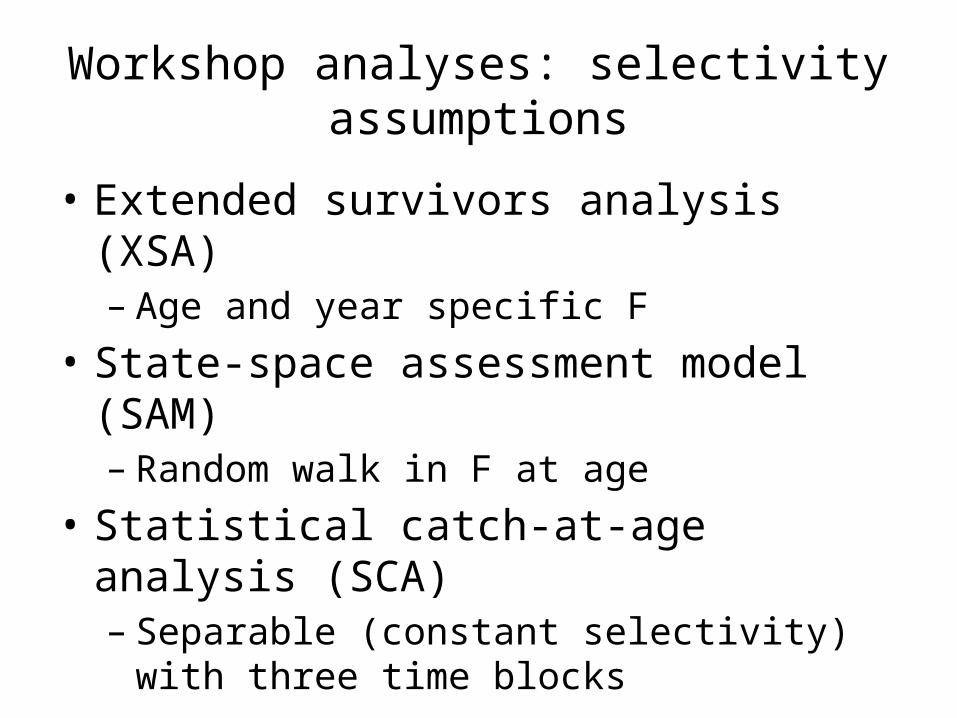
Workshop analyses: selectivity assumptions
• Extended survivors analysis (XSA)– Age and year specific F
• State-space assessment model (SAM)– Random walk in F at age
• Statistical catch-at-age analysis (SCA)– Separable (constant selectivity) with three time
blocks
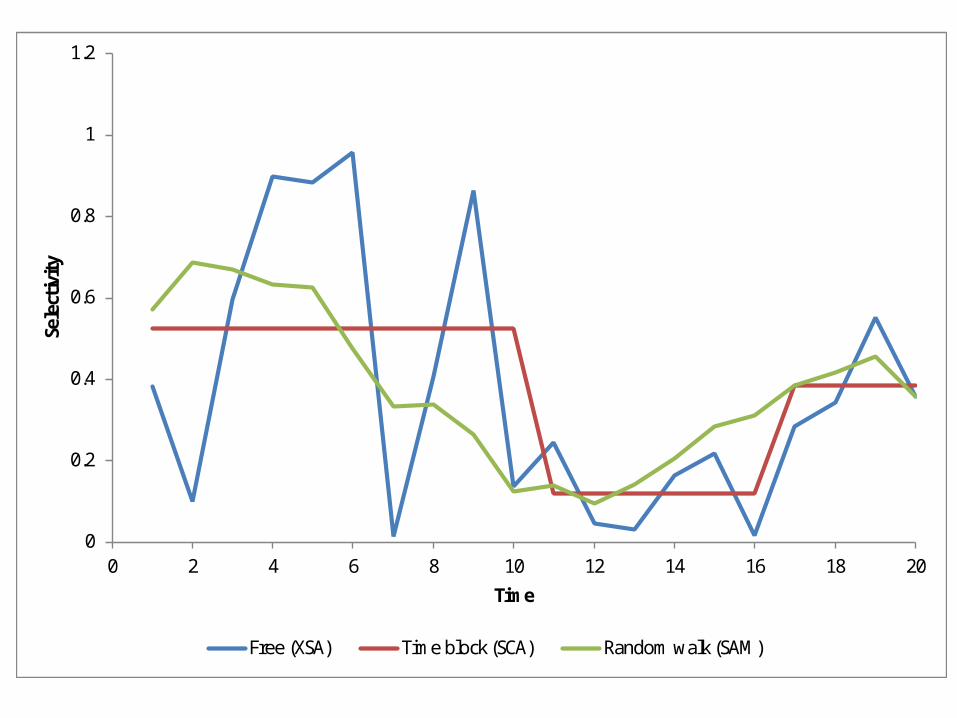
0
0.2
0.4
0.6
0.8
1
1.2
0 2 4 6 8 10 12 14 16 18 20
Sele
ctivi
ty
Time
Free (XSA) Time block (SCA) Random walk (SAM)
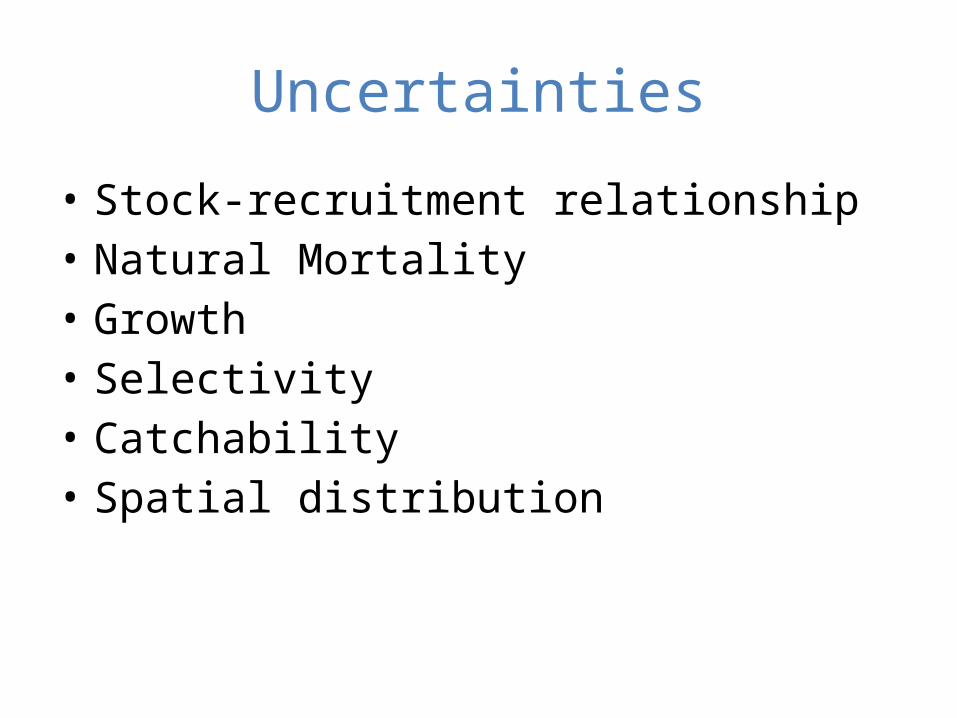
Uncertainties
• Stock-recruitment relationship• Natural Mortality• Growth• Selectivity• Catchability• Spatial distribution
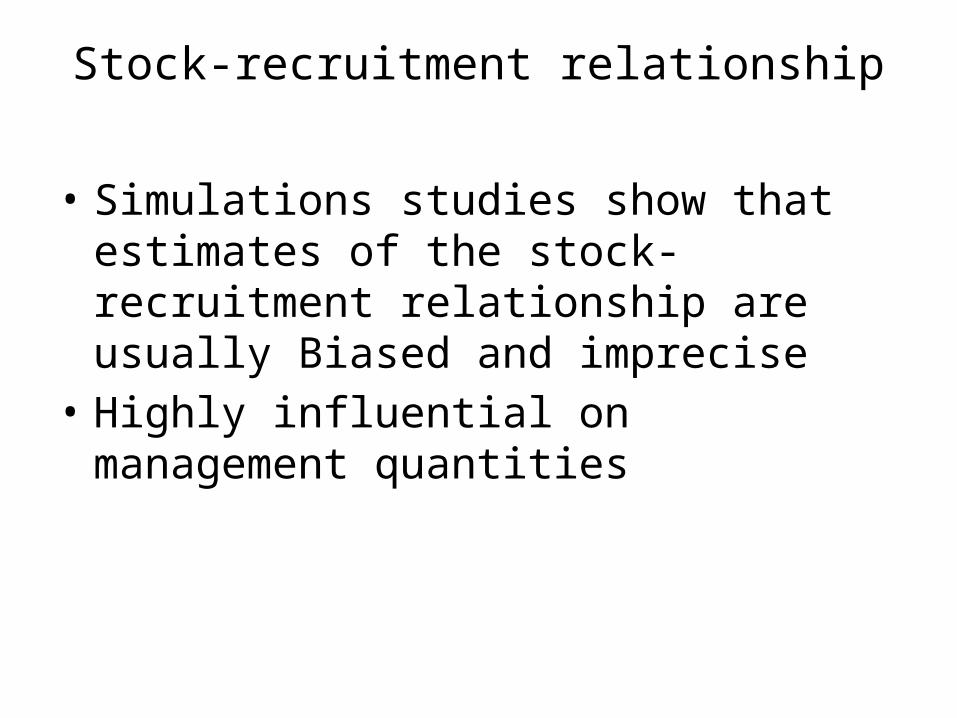
Stock-recruitment relationship
• Simulations studies show that estimates of the stock-recruitment relationship are usually Biased and imprecise
• Highly influential on management quantities
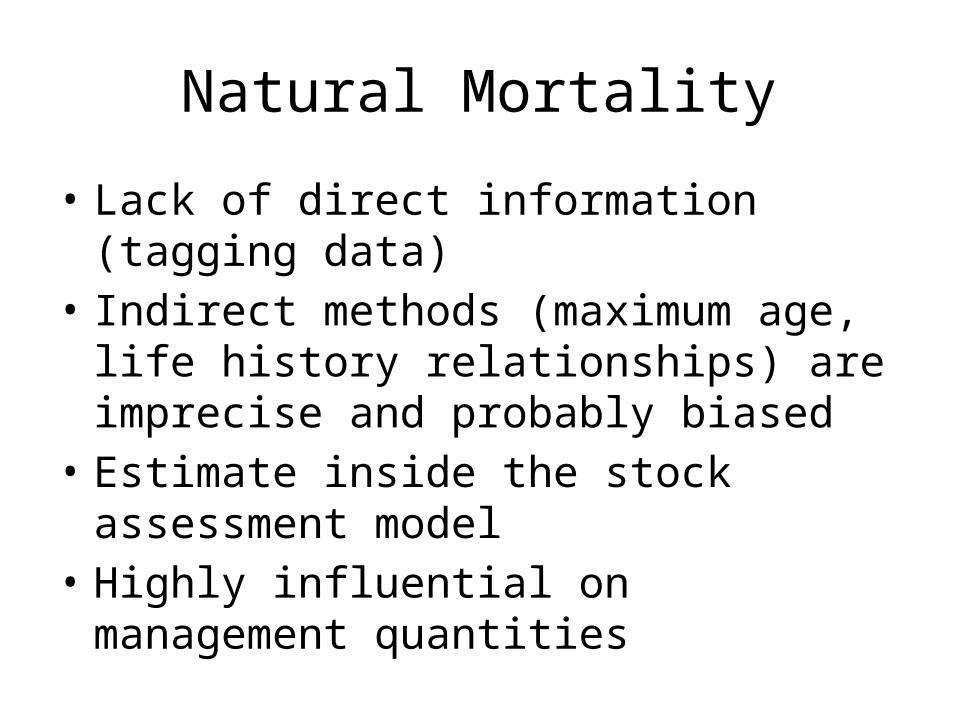
Natural Mortality
• Lack of direct information (tagging data)• Indirect methods (maximum age, life history
relationships) are imprecise and probably biased
• Estimate inside the stock assessment model • Highly influential on management quantities
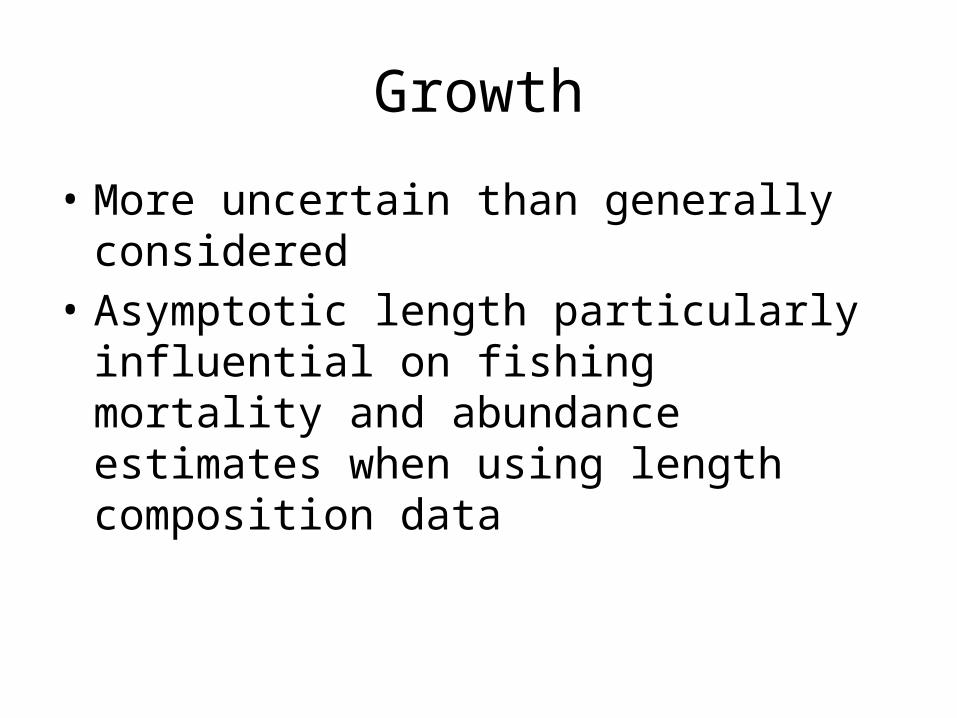
Growth
• More uncertain than generally considered• Asymptotic length particularly influential on
fishing mortality and abundance estimates when using length composition data

Selectivity
• Misspecification can cause biased estimates of management quantities– Inflexible functional forms – Time varying selectivity
• Allowing flexible selectivity reduces information content of composition data
Catchability
• Scales an index of abundance to absolute abundance
• Usually unknown or more uncertainty than assumed
Spatial distribution
• Temporal variation in fishery or stock spatial distribution can cause biases
Modeling temporal variation in catch composition data
• Most stock assessments use catch-at-age or catch-at-length data
• Composition data have too much influence on the results of integrated assessments
Why does composition data vary from year to year
• Recruitment strength• Fishing mortality history• Sampling error• Temporal variability in selectivity• Other process variation• Spatial distribution of fleet and stock
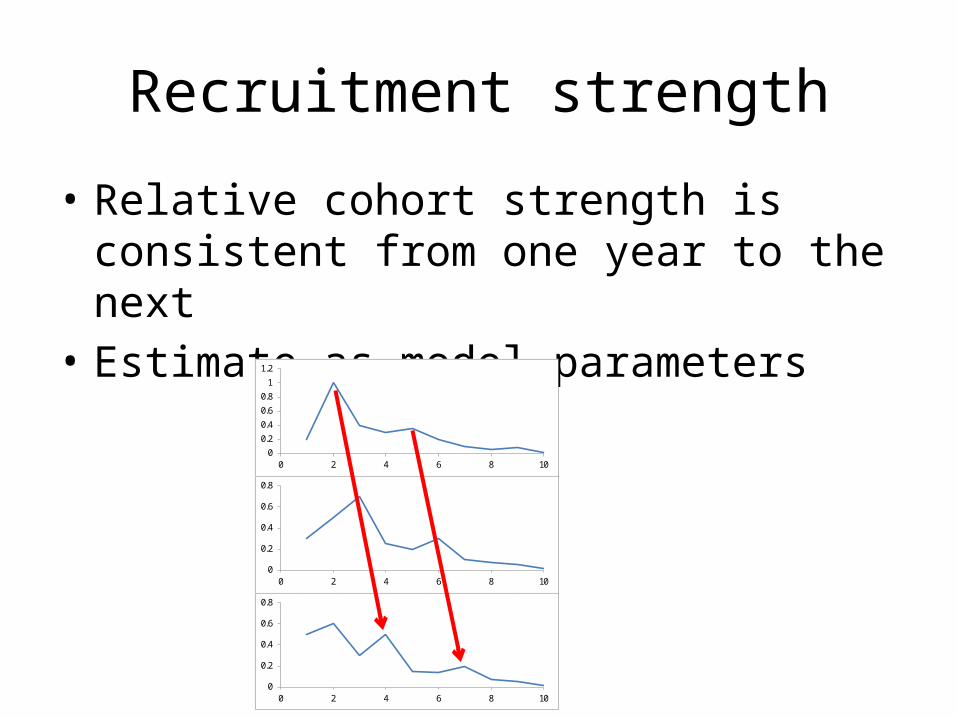
Recruitment strength
• Relative cohort strength is consistent from one year to the next
• Estimate as model parameters
0
0.2
0.4
0.6
0.8
1
1.2
0 2 4 6 8 10
0
0.2
0.4
0.6
0.8
0 2 4 6 8 10
0
0.2
0.4
0.6
0.8
0 2 4 6 8 10
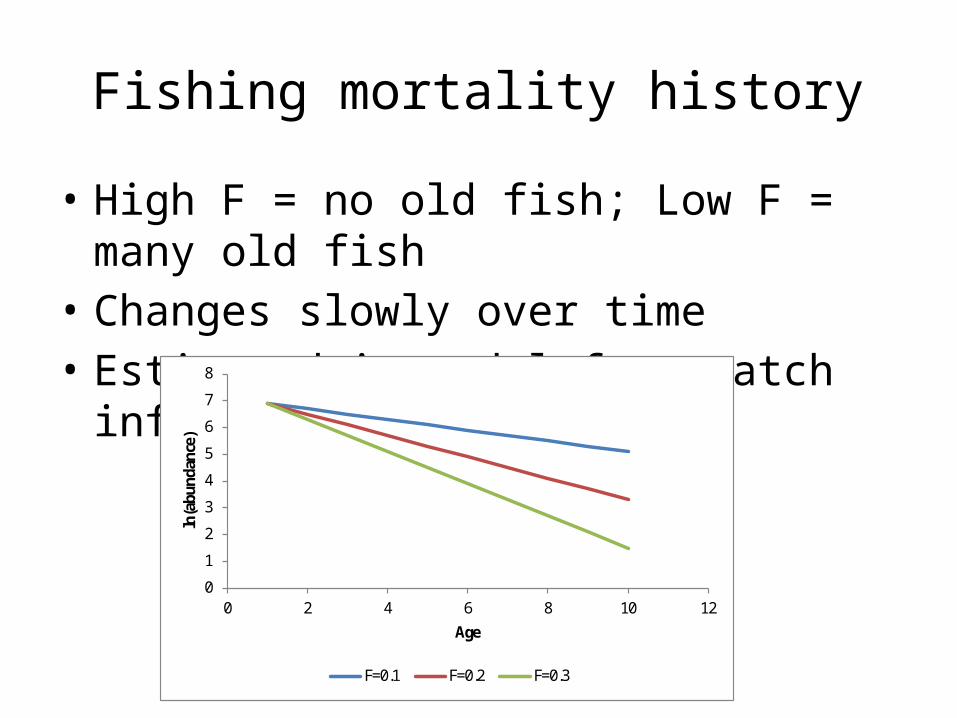
Fishing mortality history
• High F = no old fish; Low F = many old fish• Changes slowly over time• Estimated in model from catch information
0
1
2
3
4
5
6
7
8
0 2 4 6 8 10 12
ln(a
bund
ance
)
Age
F=0.1 F=0.2 F=0.3
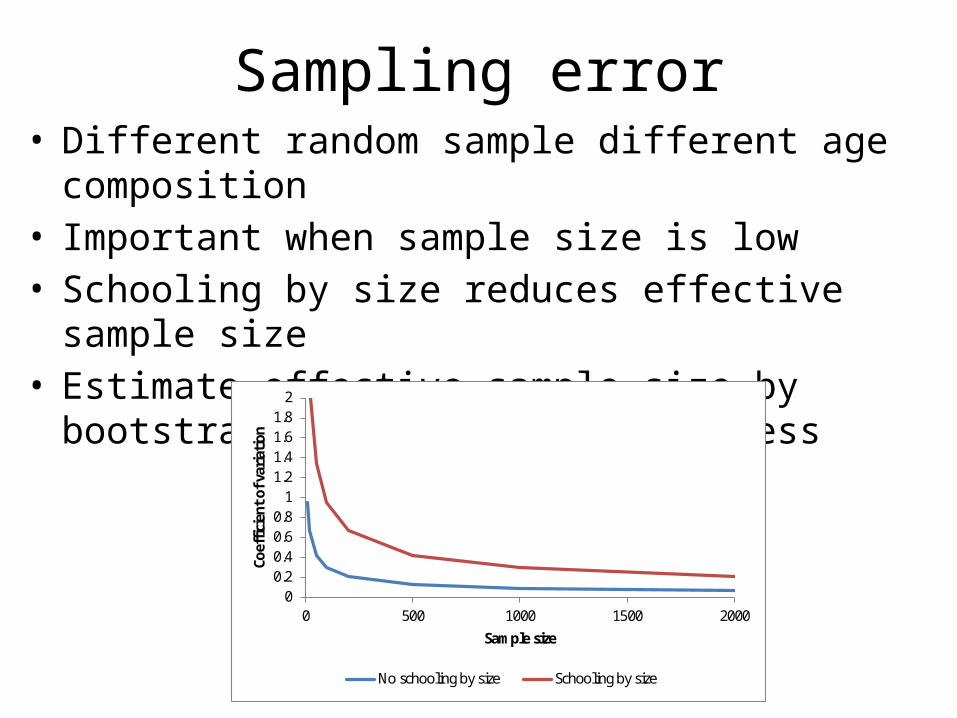
Sampling error• Different random sample different age composition• Important when sample size is low• Schooling by size reduces effective sample size• Estimate effective sample size by bootstrapping the
sampling process
00.20.40.60.8
11.21.41.61.8
2
0 500 1000 1500 2000
Coeffi
cien
t of v
aria
tion
Sample size
No schooling by size Schooling by size
Temporal variability in selectivity
• Gear changes– Use selectivity time blocks when gear changes
• Combining fisheries and changes in fishing effort among fisheries (e.g. VPA)– Don’t combine fisheries or alternatively use time
varying selectivity• Cohort targeting– Model time varying or cohort specific selectivity
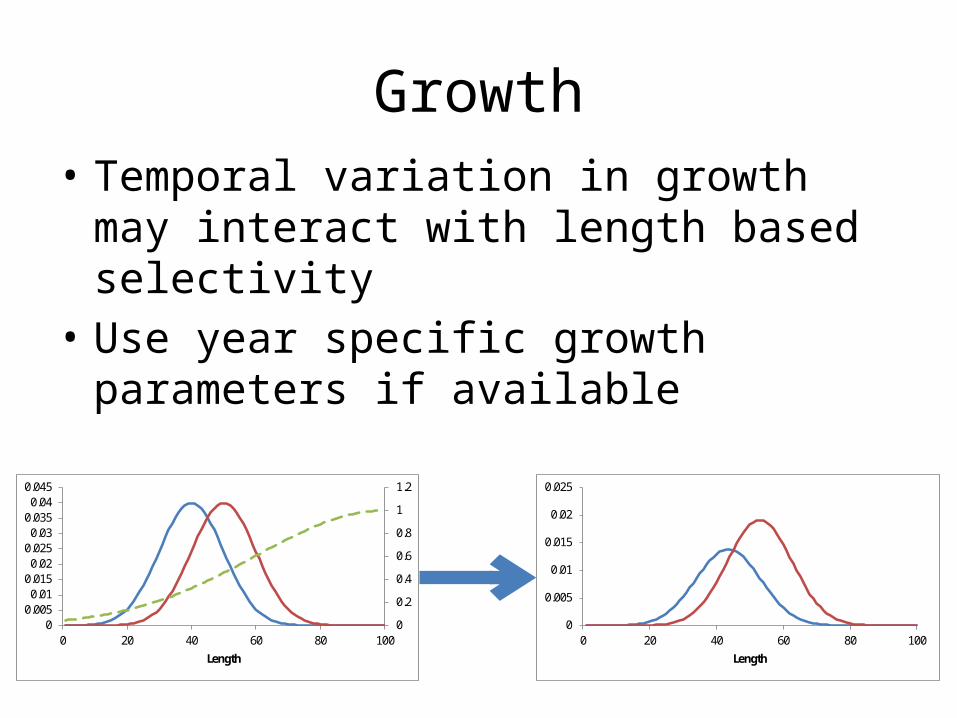
Growth• Temporal variation in growth may interact
with length based selectivity• Use year specific growth parameters if
available
0
0.2
0.4
0.6
0.8
1
1.2
00.005
0.010.015
0.020.025
0.030.035
0.040.045
0 20 40 60 80 100Length
0
0.005
0.01
0.015
0.02
0.025
0 20 40 60 80 100Length
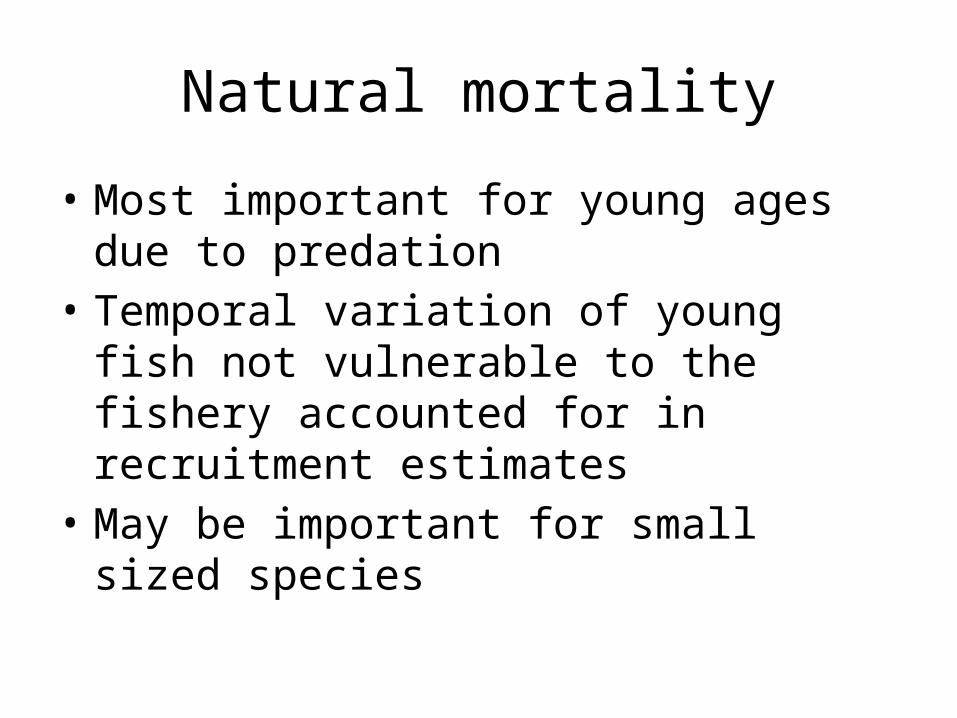
Natural mortality
• Most important for young ages due to predation
• Temporal variation of young fish not vulnerable to the fishery accounted for in recruitment estimates
• May be important for small sized species
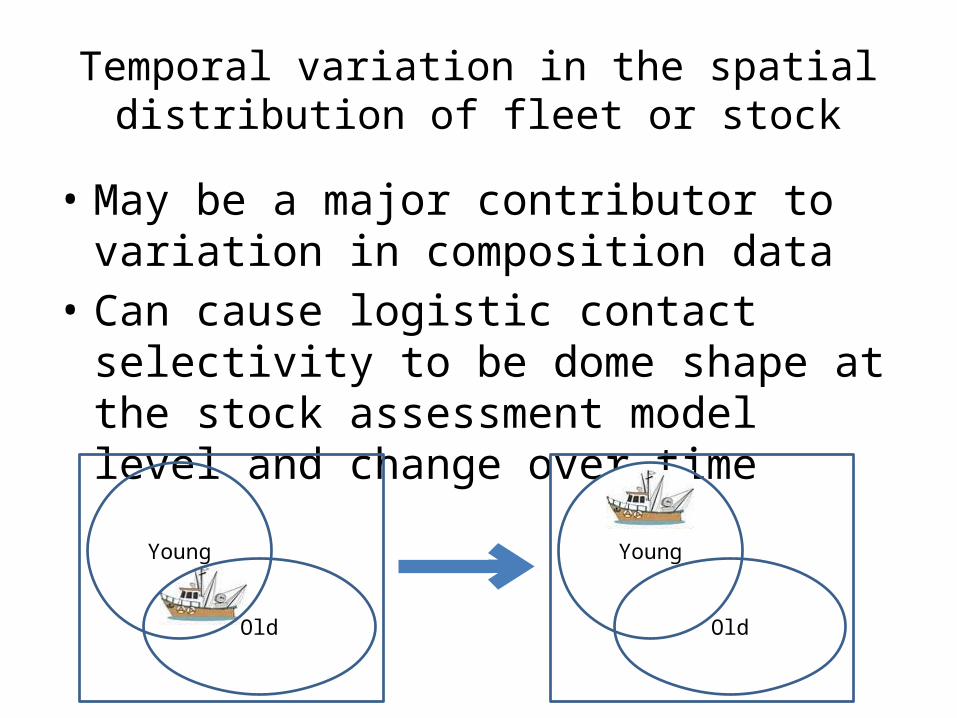
Temporal variation in the spatial distribution of fleet or stock
• May be a major contributor to variation in composition data
• Can cause logistic contact selectivity to be dome shape at the stock assessment model level and change over time
Young
Old
Young
Old
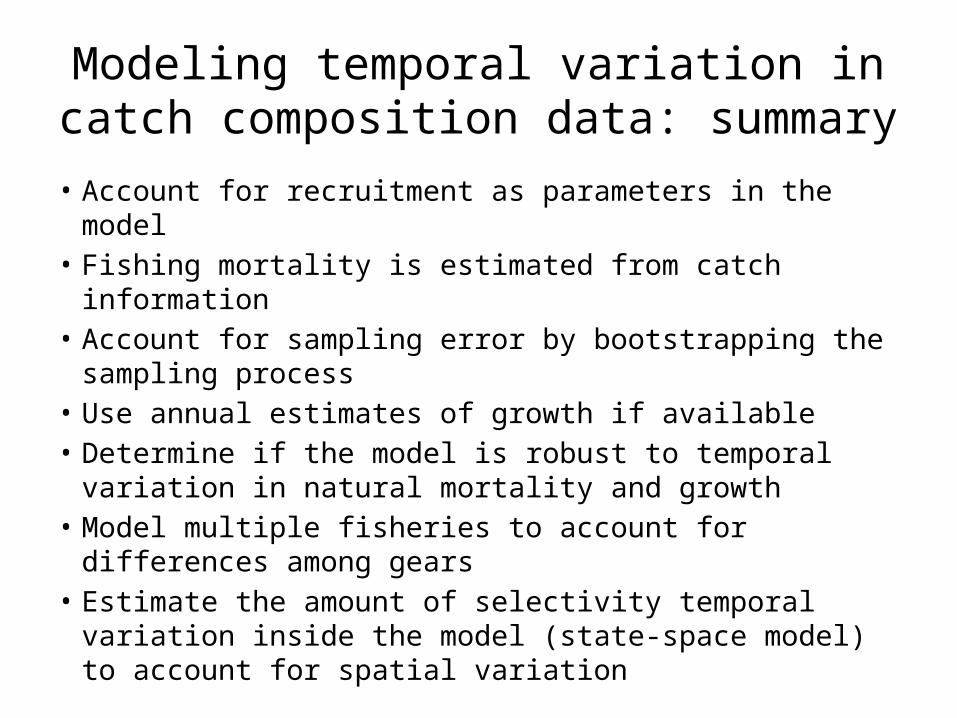
Modeling temporal variation in catch composition data: summary
• Account for recruitment as parameters in the model• Fishing mortality is estimated from catch information • Account for sampling error by bootstrapping the sampling
process• Use annual estimates of growth if available• Determine if the model is robust to temporal variation in
natural mortality and growth• Model multiple fisheries to account for differences among
gears• Estimate the amount of selectivity temporal variation
inside the model (state-space model) to account for spatial variation
Presentation summary
• Different model assumptions (e.g. selectivity) can give different results
• There is a lot of uncertainty about most population dynamics and fishing processes
• Models need to account for temporal variability in selectivity
ConclusionWe either need to put a lot more focused effort
into resolving the uncertainties
Or
Develop management strategies that are robust to the uncertainty