Embed Size (px)
Citation preview
Career Services Office 1
The Current Status of Career Services
at Colleges and Universities: Technical Report No. 52
By
Bonita M. Vinson
LeTourneau University
Robert C. Reardon
Florida State University
Sara C. Bertoch
Florida State University
Center for the Study of Technology in Counseling and Career Development
100 S. Woodward Ave., Tallahassee, FL 32306-4162
March 17, 2011
Bonita M. Vinson, Ph.D., is Director, Dallas Educational Center, LeTourneau University; Robert
C. Reardon is Professor Emeritus in the Career Center at Florida State University, Tallahassee,
FL 32306-4162, where he is joined by Sara C. Bertoch, a doctoral student and research assistant.
Correspondence regarding this article can be addressed to the first author at LeTourneau
University, 7920 Belt Line Rd, Suite 1100, Dallas, TX 75254, phone 1-800-688-5327, fax 214-
932-1101, e-mail: [email protected].
Career Services Office 2
The Current Status of Career Services
at Colleges and Universities
ABSTRACT
This study examines career planning programs and career services offices at colleges and
universities in the United States as viewed by chief student affairs officers. Findings from an
earlier study of career services offices (CSOs) in 1979 were compared to the current findings.
Additionally, new areas of research were examined in order to provide benchmark data for future
studies. Several affirming findings emerge from the study informing higher education, student
affairs and career services professionals about the effectiveness and value of college and
university career services offices.
Career Services Office 3
When the vocational guidance movement in the United States emerged in the early
1900s, the development of career centers was one of its most tangible and lasting
accomplishments. The roots of the movement sprang from the social reform and humanitarian
activities in urban areas in the Midwestern and Eastern United States. Career centers were often
located in settlement houses, which provided a variety of social services including vocational
guidance to immigrants and others. Career counseling and an array of other career interventions
now present in colleges and universities developed in the context of these offices. A
distinguishing feature was, and remains, the provision of resources and information about
occupations, jobs, training, financial resources, employability, and career planning. In this
article, we will briefly review some of the characteristics of career centers in the early 1900s,
those existing in colleges or universities in the 1970s (Reardon, Zunker, & Dyal, 1979), and the
results of a recent survey of current career services offices and programs.
EARLY DEVELOPMENT OF CAREER CENTERS
Frank Parsons is generally regarded as the father of vocational guidance and created one
of the first career centers, the Vocations Bureau. This career center was located in the Civic
Service House, a Boston settlement house that provided a variety of social and civic services to
citizens, especially Italian immigrants. Parsons formulated a technique for providing career
counseling in this context, which was described in Choosing a Vocation (Parsons, 1909).
With the passage of time, career centers moved from community settings such as
settlement houses and into colleges, universities, and high schools, and less often into business
organizations, governmental, and social service agencies. The Vocations Bureau, for example,
found a new home at Harvard University (Maverick, 1926). In educational settings, career

Career Services Office 4
centers were typically housed in either a counseling center or a career planning and/or placement
center. More recently, career centers are likely to be located in a specialized office (e.g., career
services office or CSO) and provide the resources used by staff and clients to solve career
problems and make career decisions.
Most contemporary career centers are unique on college campuses because they integrate
the academic and the corporate worlds (Herr, Raymond, & Garis, 1993). These centers have
moved from narrow job placement offices to those providing comprehensive services reflective
of the career development process. The books by Herr et al. and Niles and Harris-Bowlsbey
(2005) are two of the most comprehensive sources of information on career centers, in our
opinion.
CONTEMPORARY CAREER SERVICES OFFICES (CSOS)
A contemporary career center may be described as a physical facility providing for the
location of materials, resources, and personnel delivering an array of career services to
individuals and groups. A career center is typically located in a separate office, or a counseling
center, human resources office, library, or training and development unit of an organization. It is
an administrative unit of an organization, e.g., school, business, agency, that employs staff who
deliver a variety of career programs and services. In postsecondary settings, comprehensive
career centers provide career counseling and assessments, experiential career opportunities such
as internships and cooperative education, educational and career information, job hunting
assistance, and employment information (Vernick, Garis, & Reardon, 2000). They may also
provide services to employers seeking to fill their hiring needs. Less comprehensive career
centers may provide only some of these services. A career center would almost always include a

Career Services Office 5
career library or information room. In this article, we use the term “Career Services Office”
(CSO) to designate a generic administrative unit providing career assistance.
The resources in a contemporary career services office can include inventories and tests,
card sorts, books, descriptions of occupations or educational and training institutions, CDs and
DVDs, pamphlets, clippings, web pages, instructional modules, multimedia resources, training
materials, magazines, take-away (free handouts) materials, and procedures for locating
information or preparing for a job search campaign, e.g., resume writing and interviewing.
Career counseling or advising is another resource that might be available in a career services
office, and professional career counselors or career paraprofessionals (sometimes called career
development facilitators) could provide the service. The intended outcome of using career
resources, including career counseling, is client or customer learning and a change in career-
related behavior.
Reardon et al. (1979) surveyed a 20% sample (N = 458) of chief student affairs officers in
higher education institutions in the 50 states and territories drawn from The Education Directory,
1975-1976 (1976). They reported responses from 302 responding institutions (66% response
rate) with 152 (51%) reporting a separately budgeted office called a career center that had been
created in the past three years (N = 67). Respondents indicated existence of a centralized
program of services (83%), typically under the placement office (34%) or dean of student affairs
(21%), but other reporting lines (45%) included the counseling center, academic deans, or
registrar. Career centers in smaller schools were most often under a dean of academic or student
affairs and in middle-sized and larger schools it was the placement office or counseling center.
Other data revealed the pattern of career programs and services, staffing patterns, and faculty
perceptions of career center activities. Regarding the creation of a separately budgeted career

Career Services Office 6
center, 54% of the respondents supported this and 46% did not; 33% indicated some group or
committee was presently studying the scope and function of career education at their institution.
National surveys of career center programs and activities have been infrequently reported
in the literature. The National Association of Colleges and Employers (NACE), an association of
postsecondary institutions and the recruiting and human resource offices of organizations, has
reported periodic benchmarking surveys of the state-of-the-art in colleges and universities which
are highlighted below.Some findings from these surveys are relevant to the study reported by
Reardon et al. (1979) and the current study.
In 1998, a survey was mailed to all NACE (1999) college members and 578 (34%)
useable responses were obtained. Respondents were equally representative of public and private
institutions and 58% were from schools with 2,500 or fewer students. On average, career
services offices (CSOs) received 90% of their budget from the institution, and 59% reported
receiving 100%. The survey provided additional details on staffing patterns and the range of
student services provided. For example, NACE reported staffing numbers for 12 full- and part-
time positions in the CSO, e.g., associate director and assistant directors; career counselor; career
librarian; information technologist; coordinators for internship/cooperative education, job
development, placement, and recruitment; graduate assistant; student worker; and secretary or
clerical.
Nagel and Bohovich (2000) examined CSO office structure, range of services, and
technology applications in a survey of 1,747 NACE members and obtained 927 (53%) useable
responses. Most respondents (90%) reported a centralized service, i.e., they were the sole
provider of career services at their institution, and 10 % were in decentralized offices. They
indicated that 65% were in student affairs, 14% in academic affairs, 5% under the president’s
Career Services Office 7
office, and 3% under enrollment management. The largest percentage of respondents (39%)
indicated that their office was known as “career services,” while “career development” was the
second most common name. Nagel and Bohovich (2000) summarized survey results from 1975,
1981, 1987, 1991, 1993, 1997, and 2000 regarding 20 of the most common career center services
offered.
A later NACE survey (Nagle, 2001) examined facilities, financing, and staffing in a
mailed survey to 1,734 members which produced 654 (38%) usable responses. As in earlier
surveys, 44% rated their location as “very accessible,” and 90% of the operating budget was
provided by their institution. Respondents indicated that the biggest challenges included
engaging students before their senior year and dealing with dwindling resources.
The most recent survey, 2009-10 Career Services Benchmarking Survey for Four-Year
Colleges and Universities (NACE, 2010), was sent to 1,389 member schools and 557 (40%)
useable responses were obtained. Almost 88% had primarily centralized offices with little
difference according to institution size. About 63% were in student affairs while 22% were in
academic affairs and 15% were in other administrative arrangements. About 45% had the name
“career services,” slightly more than in 2000, while 17% used “career center” and 13% used
“career development.”
The NACE respondents indicated that career counseling by appointment had declined in
the past year, but drop-in services had increased by 25%. Smaller schools were more likely to
provide academic counseling through career services than larger schools, but larger schools were
more likely to provide a for-credit career course. Results showed that 55% of schools with
20,000+ students offered such courses, but schools with fewer than 10,000 rarely did. Overall,
32% of respondents offered a credit career course. In summary, the benchmarking survey of
Career Services Office 8
NACE schools revealed an increased demand for services to students and alumni, but this work
was accomplished with fewer resources. The largest decreases in resources occurred in large
public sector schools such as state land grant colleges.
The purpose of the present study was to replicate the earlier survey by Reardon et al.
(1979) in order to learn more about changes in career services in colleges and universities in the
past 30 years as viewed by chief student affairs officers (CSAOs). We anticipated that our
findings would reveal changes in the delivery of career services over time and we wanted to
explore several new topics not examined in the 1979 study or the NACE surveys.
METHODS
In this section we describe the sample used in this study, the operational definitions, the
survey instrument, and the procedures for data collection and analysis.
Sample
We used Choices®
Planner (Bridges Transitions, 2005), a computer-based career
information delivery system (CIDS), to identify higher education institutions in the U.S. because
the Education Directory used earlier by Reardon et al. (1979) is no longer published. The
schools databases in Choices®
Planner contain information on over 7,000 post-secondary
institutions in the United States. This information comes from the college and university
database of Peterson’s, a Nelnet company (http://www.petersons.com/). Choices®
school reports
feature a variety of contact information, including links to websites, phone numbers, and mailing
addresses that persons can use to obtain more information about postsecondary institutions.
Peterson’s conducts an annual survey to ensure that the information about undergraduate
colleges and universities is current and accurate. The survey findings are published annually as
Peterson’s Four Year Colleges, 2008 (Oram, 2007). These data are also used in Choices®
Career Services Office 9
Planner. In addition, state versions of Choices® contain educational data obtained directly from
state agencies. This information is processed, analyzed and reorganized by the Bridges staff and
included in Choices®.
The population for this study was determined by selecting all U.S. institutions offering
bachelor’s degrees using the Choices®
Planner database, www.bridges.com. A total of 2,482
colleges and universities were listed, and a sample size of approximately 14% (N = 353) was
identified using a generated table of random numbers from the website
www.graphpad.com/quickcalcs. Every other number in the listing was used to generate a random
sample of 353 institutions for the study. Duplicates were eliminated and replaced using more
numbers from the table. As in the earlier study (Reardon et al., 1979), schools based outside the
United States and seminaries were removed from the list, reducing the sample to 315. Once the
final sample was determined, the names and e-mail addresses of the chief of student affairs
officers (CSAOs) for each institution were obtained.
Operational Definitions
We created the following operational definitions regarding institutional size: (a) very
small institutions, 1-2,500 students; (b) small institutions, 2,501-5,000 students; (c) medium
institutions, 5,001-10,000 students; (d) large institutions, 10,001-20,000 students; and (e) very
large institutions, more than 20,000 students.
Survey Instrument
The questionnaire used in the current study was a modified version of the 1979 survey
mailed by Reardon et al. (1979). We discussed the changes in campus career services over the
past 30 years, amended the survey questions as needed, and then sent the survey instrument to 10
career services professionals for their comments about the clarity of the items. The final survey
Career Services Office 10
consisted of 22 questions including items addressing the size of the career services office (CSO),
centralized versus decentralized office, SWOT analyses of the CSO, and services provided by
the CSO. Except for six questions with open-ended responses, all questions were in the format of
categorical responses.
Procedure
In early 2008, surveys were administered to the 315 sample participants using the online
survey system, Survey Monkey©
(http://www.surveymonkey.com/). Participants received an e-
mail including a brief cover letter describing the study and a hyper link to the online survey.
Readers were informed in the cover letter that by entering the survey they were consenting to
participate in the study. There were no responses from 238 recipients. A variety of problems
were encountered in this phase of the study, including staff changes at institutions, incorrect e-
mail addresses, and instruments that were screened out by e-mail security systems. Furthermore,
eight opted out of the survey, and 41 e-mails bounced back. Three follow-up e-mails were sent to
participants, but after six months we had received only 77 responses (10 partial and 67 complete)
from survey recipients. Follow-up messages were sent to the 10 respondents submitting partial
responses to complete the survey.
Given these disappointing returns with the electronic survey, and in order to increase the
number of respondents, we mailed a paper survey in the fall of 2008 with a self-addressed return
envelope to 223 chief student affairs officers who had not responded electronically. As a result,
we obtained 21 mail-in surveys which were manually entered into the Survey Monkey©
system.
The results are based on this final total of 98 completed survey responses, a response rate of
31%.
RESULTS AND DISCUSSION

Career Services Office 11
Size of Institution
Institutional size varied among the respondents to the survey. Nearly half (49%) of
respondents described their institutional student population as up to 2,500 (very small). Another
19% reported 2,501 to 5,000 students (small) at their campus. Notably, most respondents to the
1998 NACE survey (58%) were also from very small institutions. The number of respondents
from institutions with 5,001 to 10,000 students (medium) and 10,001 to 20,000 students (large)
were equal at 10% each. Finally, 12% of respondents were from institutions larger than 20,000
students (very large).
The current study and the 1998 NACE study differed from the original 1979 study with
respect to institutional size in that a different scale for the size of institutions was used. However,
the greatest percentages (about 50%) of respondents were from institutions considered to be the
smallest across the three studies.
Separately Budgeted Office
When CSAO respondents were asked whether their campus had a career services office
(CSO) that could be described as a separately budgeted office within the university structure, the
overwhelming responses (84%) were in the affirmative. In comparison, Reardon et al. (1979)
reported only 51% of institutions operated such a CSO and NACE (1998) reported 59%. These
data suggest that over the course of 30 years, institutions have become even more aware of the
value of the CSO and the percentage with fiscal oversight has increased by 35% in the past
twenty years. Additional data from the current study revealed respondents from very small
institutions compared to other institutions were 2 to 3 times more likely to report the existence of
a budgeted CSO; however, respondents reporting no separately budgeted CSO were also most
likely to be from very small institutions.
Career Services Office 12
Centralized vs. Decentralized CSO
Survey respondents were asked about the organizational structure for the operation of the
CSO at their institution. Respondents could rate their institution as a centralized (main center on
campus), decentralized (more than one location), or both centralized and decentralized (a
combination of the two) operations. The overwhelming majority of respondents (86%) reported
one centralized CSO. None of the respondents reported decentralization of CSO services and
14% reported a combination of CSO services offered at their campuses. Aggregated by student
population, the results were generally consistent across groups except that very large institutions
reported similar percentages in both centralized CSO (56%) and combination of CSO services
(44%). Two written comments by respondents from large institutions indicated one CSO
reported to student affairs and the other reported to the college of business.
----------------------------------------------------------
Insert Table 1 CSO management structure about here
----------------------------------------------------------
Table 1 shows a comparison of the reported management structure of CSOs by study
year. In 1979, most (83%) of respondents reported their campus having a centralized CSO
operation. Similarly, in 2000, a slight increase was noted (90%) and slight decreases by 2010
(87% and 86%). Overall, studies over the 30 year span indicate nearly the same number of
institutions described their CSO operation as centralized. From 1979 to 2010, the percentage of
respondents reporting a decentralized CSO declined sharply from 12% in 1979 to zero by 2010.
-----------------------------------------
Insert Table 2 CSO admin. control by year about here
---------------------------------------------
Career Services Office 13
Administrative oversight of CSOs has changed over time as the role and function of
college and university departments and divisions has changed. This may have also been affected
by the perceptions of host institutions and stakeholders’ role of CSOs. Table 2 shows a
comparison of administrative control of CSOs by study year. The 1979 study revealed 34% of
respondents’ CSOs reported to the placement office. Interestingly, no data for this administrative
unit was captured in the NACE 2000 or 2010 studies, but one percent of respondents in the
current study reported oversight by a placement office. A steady increase—now more than two-
thirds—in respondents (21% in 1979, 65% in 2000, 63% and 71%, respectively in 2010)
reported administrative control by student affairs. While 13% of respondent CSOs reported to the
counseling center in 1979, no respondents in the current study indicated this; and, the 2000 and
2010 NACE studies did not report this information. The 1979 study did not indicate that CSOs
reported to an academic dean; however, the 2000 and 2010 NACE studies, as well as the current
study, reported administrative control of CSOs by an academic dean (14% in 2000; 22% and
11% in 2010 respectively). Table 2 shows that a number of respondents indicated a variety of
reporting lines for CSOs that did not fit into the categories provided. It should be noted that 15%
of respondents to the 2010 NACE study did not indicate any particular administrative control.
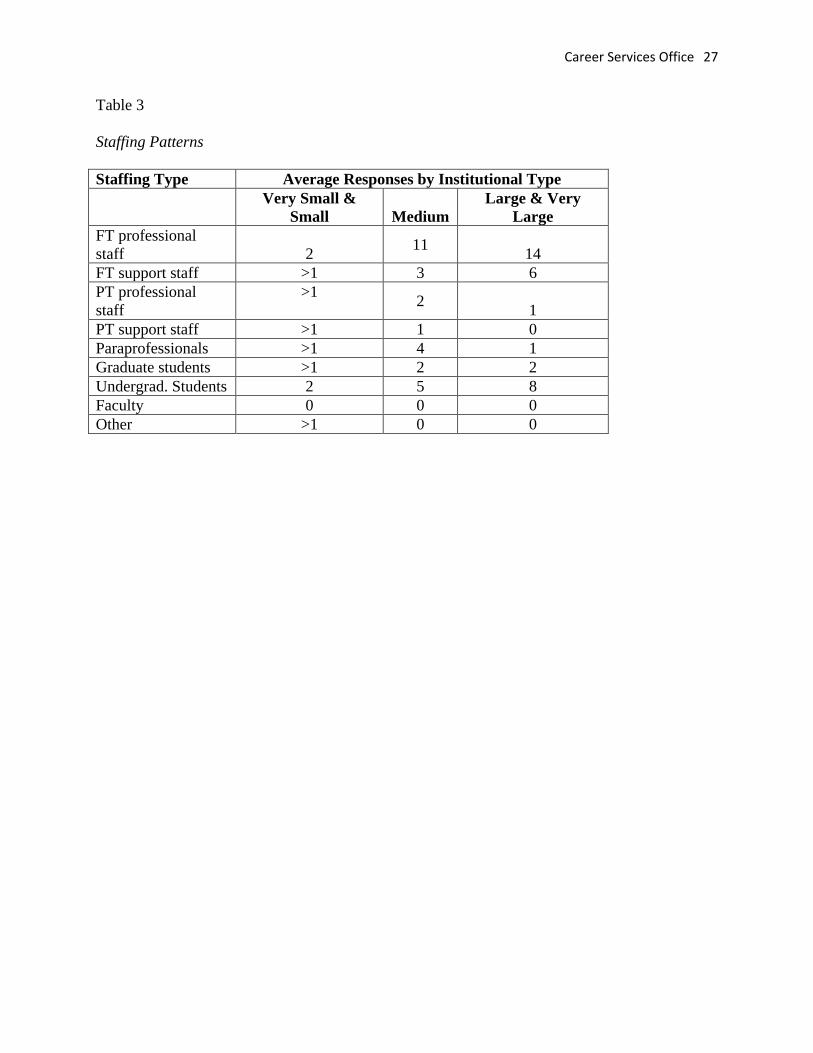
Staffing Patterns
Table 3 provides an analysis of CSO staffing patterns as reported by CSAO survey
respondents. Shown in the table are types or categories of staffing which may be found in any
college or university administrative unit. For the purpose of this study, we deemed it necessary to
separate full- and part-time staff as well as professional, support, paraprofessional, students,
faculty, and other types of staff. Respondents were asked to note the number of staff for each
category found in their CSO, and the average number of responses by institutional type was
Career Services Office 14
obtained for each category. In order to simplify the analysis, very small and small institutions
were averaged together as were large and very large institutions. Medium-sized institutions were
not combined with any other institutional type.
The data in Table 3 showed increases in staffing at larger institutions among full-time
professional and support staff, as well as among graduate and undergraduate students. These
increases were expected. In fact, we expected minimal increases in all staffing categories, but
that did not occur. No schools reported faculty as staff.
Data by Reardon et al. (1979) on staffing patterns was reported differently than in Table
3. Reardon et al. simply identified the percentage of institutions reporting staff in the following
categories: full-time professional staff (78%), part-time professional staff (25%),
paraprofessional staff (18%), graduate students (28%), undergraduate students (29%), faculty
(15%), and volunteers (13%). Differences in data collection and analysis between the two studies
make comparisons difficult. However, Reardon et al. indicated that a large percentage (78%) of
institutions employed full-time professional staff which is similar to the current study insomuch
as the larger institutions employed the highest average number of staff (14) from this category.
Reardon et al. also reported that large schools made extensive use of paraprofessionals and
graduate students, but data from the current study suggest CSOs no longer use these categories of
staff “extensively” as in 1979.
------------------------------------------------------
Insert Table 3 staffing patterns about here
-------------------------------------------------------
Endowed/Named CSO

Career Services Office 15
The current study revealed a very limited existence of endowed or named CSOs with
only five chief student affairs officers (6%) reporting such an arrangement. Three of the five
reported their CSO was privately endowed, while one reported a corporately endowed CSO, and
one additional respondent reported a CSO that was jointly endowed with at least one other office
or service on campus. Respondents were asked if they, as chief student affairs officers, favored
the creation of an endowed or named CSO at their institution. Reardon et al. (1979) reported that
54% of respondents approved of this while 46% did not favor the idea of an endowed or named
CSO. Comparatively, 56% of respondents in the current study indicated they would approve of
such a CSO, while 44% of respondents indicated they would not be in favor of such a CSO.
Respondents from larger institutions were more likely to favor funding designated for a named
CSO while respondents from the smallest institutions did not. Specifically, respondents from
very large institutions were in favor (78%) while those from very small institutions were not
(38%). In fact, respondents from very small institutions were the only group who were
overwhelmingly not in favor of the creation of endowed or named CSO operation at their
institution. Respondents from the other categories of institutional groups were overwhelmingly
in favor of the creation of an endowed or named CSO at their institution.
Study of Need/Scope/Function of CSO
We asked CSAOs if a group or committee at their institution was currently studying the
need, scope, or function of career services. We found the majority of respondents (64%) were not
aware of a group or committee at their institutions studying this matter. These findings were
consistent across institutions of all sizes. In 1979, Reardon et al. reported 66% of respondents
were not aware of a group or committee studying the need, scope, or function of their CSO,
which is consistent with the current findings.
Career Services Office 16
Respondents at institutions where such a group existed were given the opportunity to
share the “name” of the group. While there was no consistency in the titles of the groups, terms
such as “committee,” “assessment,” “career services,” “team,” “student success,” and “student
development” were reported most often in the 33 written responses. Nearly one-half (45%) of the
usable written responses were provided by respondents from very small institutions, with an
additional 24% of the usable written responses provided by respondents from small institutions.
In addition, respondents were invited to share the purpose or charge of the group studying
career services. While there was no consistent statement about this, terms such as “review,”
“assist,” “develop,” “advise,” and “recommend,” were used most often in the 23 written
responses. As before, most (61%) of the usable written responses were provided by respondents
from very small institutions, and 34% were provided by respondents from small institutions.
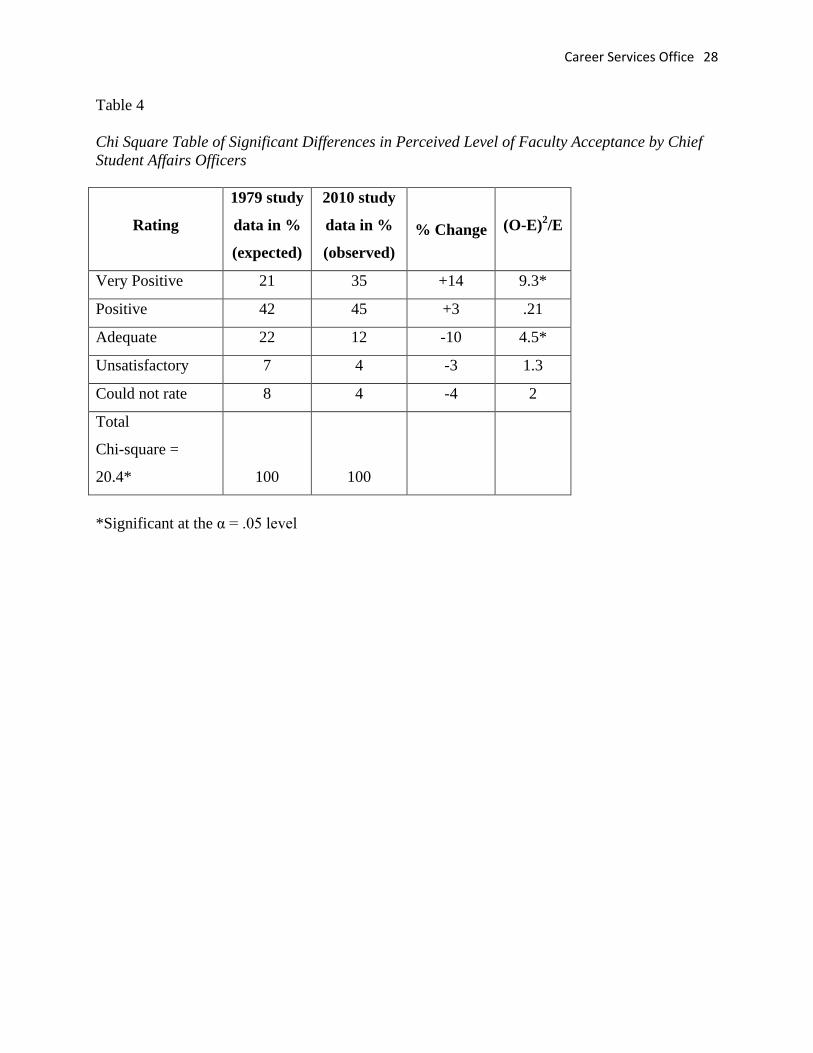
Perceived Level of Faculty Acceptance
Respondents were asked their perception of the level of faculty acceptance of the CSO on
their campuses. Table 4 shows that 80% reported faculty acceptance was very positive or
positive, whereas only 63% reported this in 1979. Further inspection of this table shows other
differences in levels of faculty support from 1979 to the current study. Table 4 revealed
significant differences over time in the perceived level of faculty acceptance of CSOs by chief
student affairs officers (CSAO). The significant shift of perceived faculty acceptance of CSOs
from adequate to very positive could indicate more positive faculty interaction with the functions
of CSOs over time and/or increased CSAO awareness of such interaction over the 30 year
period.
--------------------------------------------------
Insert Table 4 differences in levels of acceptance about here

Career Services Office 17
----------------------------------------------------
Perception of CSO Effectiveness
CSAO respondents were asked to rate their CSO with respect to services it provided
students. Overall, respondents rated their CSO services to students as very satisfactory (50%),
satisfactory (36%), adequate (9%), not satisfactory (4%). Differences in these ratings varied with
respect to institutional size. Respondents from medium and very large institutions fully agreed
(100%) that their respective CSO services to students were satisfactory or very satisfactory. In
contrast, only about 70% of very small and small institutions gave their respective CSOs ratings
of satisfactory and very satisfactory. The previous studies did not report this information.
SWOT Analysis of CSO Services by Respondents
Survey respondents were asked their opinion of the strengths, weaknesses, opportunities,
and threats (SWOTs) of their CSO. Narrative responses were gathered and naturalistic inquiry
methods of data analyses were employed to determine if themes emerged from the data.
Current survey respondents were united in their observations of CSO staff and several
themes emerged. The strongest theme in the responses to CSO “strengths” suggested CSO staff
were dedicated, showed a high degree of professionalism and care for students, and that
emphasis in their work was focused on student development and needs. While strong, dedicated
staff was considered a CSO strength, one major “weakness” emerged from the data—lack of
adequate staff to meet student needs. Staffing, needs along with dwindling resources to
administer an effective CSO, emerged as the two greatest weaknesses by respondents.
Respondents suggested “opportunities” for CSOs to increase collaboration and outreach
with a variety of constituents, especially faculty, campus staff, and students, and employers.
Finally, aligned with themes that emerged in response to “weaknesses,” respondents identified
Career Services Office 18
several “threats” to successful administration of CSOs including university budget cuts, national
economic conditions, disengaged students, and lack of faculty support.
Emerging themes in the SWOT analysis suggest CSOs would operate at their fullest
potential with outstanding, dedicated personnel if resources were at the optimal level. Maximum
fiscal and human resources would, in turn, allow for increased outreach, collaboration, and
service to students, faculty, staff, and employers.
Frequency of Career Planning and Services in Relation to School Size
------------------------------------------------------
Insert Table 5 frequency of service programs about here
-----------------------------------------------------
A listing of 40 programs and services that might be offered in a CSO was compiled by
the researchers. Respondents were asked to note any and all programs and services their CSO
offered from the list provided. Table 5 shows the list of selected programs and services provided
by CSOs. Of the 40 programs and services, just over half (N = 22) were offered by at least 25%
but no more than 75% of CSOs. One asterisk (*) in the table designates the eight programs and
services which are provided by fewer than 25% of the institutions. Academic advising,
assertiveness training, faculty training, high school visitation, job simulation, mini career course,
and study skills are programs that could have either moved to another office in the school, been
removed from the CSO, or (3) never provided.
Two asterisks (**) in Table 5 designate 10 programs and services provided by CSOs at
most (75% or more) institutions. Programs and services such as career counseling/advising,
career testing/assessment, classroom presentations, individual career information, interview
preparation, job fairs, mock interviews, online job bank, on-campus recruiting, and resume
Career Services Office 19
preparation were reported as offered by CSOs. Notably, we expected this grouping of programs
and services to be provided by CSOs at 100% of institutions. It is possible that the CSAO
respondents were unaware of all of the programs and services provided by their institution’s
CSO.
Graduate Follow-Up
When CSAO respondents in the current study were asked if they conducted graduating
student or exit surveys, 82% responded affirmatively. Of the respondents who collected
graduating student data, 39% were from very small institutions, 25% were from small
institutions, 15% were from medium institutions, 11% were from large institutions, and 10%
from very large institutions. These data indicate that larger institutions are less likely to collect
graduating student data than smaller institutions. It could also be that respondents from larger
institutions were not aware of these data being collected by other offices on the campus, e.g.,
follow-up studies of graduates by academic departments. Open-ended responses varied and
indicated that the question on the current study survey form may have been unclear given the
variety of responses obtained. Responses indicated that institutions used a variety of survey
methods including online, paper/mail, in-person, video, and telephone to collect follow-up data.
In addition, administrative oversight for collecting the data involved several different areas, e.g.,
institutional research, career services, registrar/records office, and university system office.
Data from graduating student surveys were used by respondents’ institutions in various
ways. The most popular use was for evaluation and/or improvement of services and for future
planning of academic and student services programs. Marketing and publications/reports to a
wider community of constituents were less frequent uses.
Peer Reviewed Activity
Career Services Office 20
CSAO respondents were asked if CSO staff had participated in peer reviewed research
and/or workshop presentations in the past three years, and 80% reported that the staff had not.
These findings may indicate that CSO personnel are not required or funded to participate in
professional research or workshop activity, but it may also reveal that such activity should be
increased for professional and/or paraprofessional positions in order to enhance the development
and reputation of CSO staff and their activities.
IMPLICATIONS AND CONCLUSIONS
This study examined some of the changes in CSO delivery systems as reported by chief
student affairs officers (CSAOs) and compared them to findings benchmarked in other studies,
especially a study by Reardon et al. (1979). The current study also identified several new areas of
CSO administration that had not been researched previously.
Limitations to the present study included the low response rate and the time extended
process of data collection. Difficulties in the use of Survey Monkey©
were unexpected. However,
there is some indication that the average online response rate of 30% is consistent with our rate
of 31% (Division of Instructional Innovation & Assessment, March 8, 2010). Moreover, the
NACE studies of CSO directors reported relatively low response rates of 40% (NACE, 2010);
38% (Nagle, 2001); 53% (Nagel & Bohovich, 2000); and 34% (NACE, 1999).
Twelve categories of data were surveyed, analyzed, and reported in this study. Size of
institution was a variable used throughout the data analysis. The institutional representation of
the current study was very similar to the 1979 study in that most respondents represented smaller
institutions. Survey results in 1979, 1998, and the present study reveal that separately budgeted
career services offices have increased from 51% to 59% to 84%.
Career Services Office 21
With respect to the management structure of college and university CSOs, the number of
institutions offering a centralized operation has remained about the same since 1979, but those
offering decentralized CSOs has dropped to zero and those offering both
centralized/decentralized operations are now 14% (no previous comparison is available for the
combined category). The most notable changes in CSO administrative control involved a shift
away from reporting to a placement office (34% in 1979 to 1% in the current study). Similarly,
there has been an increase in “student affairs” administrative control from 21% in 1979 to 71%
in the current study.
Several new topics were examined in the current study. First, an overwhelming majority
(86%) of CSOs are seen as very satisfactory or satisfactory in providing services to students.
Second, the current study conducted a SWOT analysis which revealed inadequate fiscal and
human resources as major hurdles to CSO effectiveness. An analysis of 40 programs and
services that could be provided by CSOs revealed that more than half were provided by the
majority of CSOs and that most CSOs are in alignment with each other in terms of offerings.
This suggests that a core cluster of services exists for CSOs. The vast majority of institutions
reported that CSO staff was not participating in professional or peer reviewed activity.
Several findings emerged from this study. Some of the findings were anticipated while
others were not. The most important findings include the following:
Career services have become established functions in the student affairs division of the
institution and the percentages of them is increasing,
Centralized CSO operations increased while decentralized operations decreased,
CSO reporting lines directly to student affairs divisions has increased,
The larger the institution, the more likely upper management is to favor endowed CSOs,

Career Services Office 22
Agreement seemed to emerge on the number and nature of core services that characterize
a college or university career services office,
Faculty are increasingly supportive of career services on the campus,
Institutional size is likely to dictate, to some degree, the level and kind of services CSOs
offer, and
Resource allocation, or the lack thereof, effects CSO service operation and delivery.
A century of development in career services offices at colleges and universities across the
United States has seen the move from a vocations bureau and job placement center to a more
comprehensive career center offering varied programs and staffed by professionals. In order for
career services offices and universities to continue to provide effective and efficient career
resources and services, colleges and universities must continue to see CSOs as valuable
administrative units to students and the institution as a whole. Future research is needed to
further investigate the effectiveness and efficiency of CSOs across the nation so that CSO
usefulness and value to institutions of higher education can be maintained or increased.
Career Services Office 23
REFERENCES
Bridges Transitions Co. (2005). Choices® Planner [computer software]. Oroville, WA: Author.
Division of Instructional Innovation & Assessment. (March 8, 2010). Assess teaching-response
rates. Retrieved July 21, 2010 from
http://www.utexas.edu/academic/diia/assessment/iar/teaching/gather/method/survey-
Response.php
Herr, E. L., Rayman, J. R., & Garis, J. W. (1993). Handbook for the college and university
career center. Westport, CT: Greenwood Press.
Maverick, L. A. (1926). The vocational guidance of college students. Cambridge, MA: Harvard
University Press.
Nagle, R. (2001, summer). Facilities, finances, and staffing: Key findings from NACE’s 2001
career services survey. NACE Journal, pp. 21-26.
Nagle, R., & Bohovich, J. (2000, Summer). Career services in the year 2000. NACE Journal, pp.
41-447.
National Association of Colleges and Employers (NACE, January, 2010). 2009-10 career
services benchmarking survey for four-year colleges and universities. Bethlehem, PA:
Author.
National Association of Colleges and Employers (NACE). (1999, Spring). The 1998 NACE
career services benchmark survey: A report from the field on facilities, finances, and
staffing. NACE Journal, pp. 41-44, 58-63.
Niles, S. G., & Harris-Bowlsbey, J. (2005). Career development interventions in the 21st century
(2nd ed.). Upper Saddle River, NJ: Pearson.
Career Services Office 24
Oram, F. A. (Ed.). (2007). Peterson’s Four Year Colleges, 2008. Lawrenceville, NJ: Peterson’s,
a Nelnet company.
Parsons, F. (1909). Choosing a vocation. Tulsa, OK: National Career Development Association.
Reardon, R., Zunker, V., & Dyal, M. (1979). The status of career planning programs and career
centers in colleges and universities. Vocational Guidance Quarterly, 28, 154-159.
The Education Directory, 1975-1976: Colleges and Universities (1976). Washington, D.C.: U.S.
Government Printing Office.
Vernick, S., Garis, J., & Reardon, R. (2000). Integrating service, teaching, and research in a
comprehensive university career center. Career Planning & Adult Development Journal,
16, 7-24.

Career Services Office 25
Table 1
Comparison of CSO Management Structure by Study Year (Nearest Percent)
Management
of CSO
1979
Study
2000
NACE Study
2010
NACE Study
2010
Current Study
Centralized 83 90 87 86
Decentralized 12 10 n/a***
0
Other/Both 5* n/a
*** n/a
*** 14
**
*Percentage of respondents who did not respond to the item; a category of “both” was not offered
in this study **
Percentage of respondents with both centralized and decentralized ***
No data reported

Career Services Office 26
Table 2
Comparison of Administrative Control of CSO by Study Year (Nearest Percent)
CSO
Administrative
Location
1979
Study
2000
NACE
Study
2010
NACE
Study
2010
Current
Study
Under placement office 34 n/a n/a 1
Under student affairs 21 65 63 71
Under counseling center 13 n/a n/a 0
Under academic dean n/a 14 22 11
Under other 32* 8
** 15
*** 25
****
*Academic, activities, alumni, and advising
**Academic, president, enrollment
***No designation of administrative office
****Development, 1%; advancement, 1%; activities, 1%; other, 22%
Career Services Office 27
Table 3
Staffing Patterns
Staffing Type Average Responses by Institutional Type
Very Small &
Small Medium
Large & Very
Large
FT professional
staff 2 11
14
FT support staff >1 3 6
PT professional
staff
>1 2
1
PT support staff >1 1 0
Paraprofessionals >1 4 1
Graduate students >1 2 2
Undergrad. Students 2 5 8
Faculty 0 0 0
Other >1 0 0
Career Services Office 28
Table 4
Chi Square Table of Significant Differences in Perceived Level of Faculty Acceptance by Chief
Student Affairs Officers
Rating
1979 study
data in %
(expected)
2010 study
data in %
(observed)
% Change (O-E)2/E
Very Positive 21 35 +14 9.3*
Positive 42 45 +3
.21
Adequate 22 12 -10 4.5*
Unsatisfactory 7 4 -3 1.3
Could not rate 8 4 -4 2
Total
Chi-square =
20.4* 100 100
*Significant at the α = .05 level

Career Services Office 29
Table 5
Frequency of Career Service Office Programs and Services
Programs and Services Mean
Least Often Provided
Assertiveness training* 9.5%
Job simulation* 10.8%
Academic advising* 10.8%
H.S. visitation programs* 13.5%
Study skills* 14.9%
Other* 14.9%
Faculty training* 18.9%
Mini career courses* 20.3%
Most Often Provided
Online job bank** 75.7%
On-campus recruiting** 77.0%
Career Testing/Assessment** 77.0%
Resume preparation** 86.5%
Classroom presentations** 86.5%
Individual career
information** 87.8%
Mock Interviews** 87.8%
Interview preparation** 89.2%
Job Fairs** 90.5%
Career counseling/advising** 91.9%