Embed Size (px)
Citation preview
See discussions, stats, and author profiles for this publication at: https://www.researchgate.net/publication/4869973
The culture of market oriented organisations
Article · January 2005
Source: RePEc
CITATIONS
9READS
392
1 author:
Some of the authors of this publication are also working on these related projects:
Consumer behaviour of older consumers View project
market orientation and firm's performance View project
Hans Kasper
Silverbrains bv
39 PUBLICATIONS 1,901 CITATIONS
SEE PROFILE
All content following this page was uploaded by Hans Kasper on 01 June 2014.
The user has requested enhancement of the downloaded file.
1
The culture of market oriented organisations
Hans Kasper
Professor of Services and Retail Management
Maastricht University, and
Director of Etil bv, Maastricht, the Netherlands
December 6, 2005
Special thanks to Sheelagh Matear (Lincoln University, New Zealand) and Rob Aitken
(University of Otago, New Zealand) who gave me valuable suggestions to improve this paper
during my stay as visiting professor at the University of Otago.
2
The culture of market oriented organisations
Abstract
This paper investigates the relationship between corporate culture and market orientation
using a different methodology to those usually found done in empirical studies on this topic.1
Conventionally, one or two key informants provide information on the firm’s marketing
practices in large scale quantitative cross-sectional studies; these few respondents provide
their opinion on the firm’s actual marketing practices which are then considered as a reliable
representation of both the (whole) firm’s culture and its market orientation.
We have taken a different approach. Firstly, we chose to do multiple case studies in stead of
cross sectional research. These case studies were small scale and qualitative; next a large(r)
scale quantitative study was done within those organisations. Secondly, all employees in an
organisation were invited to participate in the study: only then is it possible to measure
culture as the shared beliefs in the company. Corporate culture itself as well as the marketing
practices have been investigated as two separate constructs in our case studies. Both are
measured via employee perceptions. Thirdly, we are looking at the possible configuration of
market orientation and corporate culture.
Almost all of the propositions generated are supported. The degree of openness appeared to
be crucial to an organisation’s market orientation. Moreover, such a culture is also results-
oriented, employee-oriented and professional. It also has a balanced position on the two other
dimensions: pragmatic/normative and loose/tight control. From the marketing perspective,
the essential building blocks of a market oriented culture include: the internal cooperation,
internal communication, drive to be the best, lack of pursuing self interest, learning from
mistakes and from experiences in the market place, clarity about customer needs and better
relative quality than competitors’.
Because market orientation and corporate culture were measured as two distinct constructs,
this study offers new insights in both domains as to what organisations should change to
be(come) market oriented.
1 We will use the terms corporate culture and organisational culture as synonyms in this paper. In the empirical
part of this study profit as well as not for profit organisations have been investigated.
3
The culture of market oriented organisations
Introduction
Research and thinking in the domain of market orientation started in the 1980s of the last
century.2 Much work in this area has been inspired by the popular writings of Peters and
Waterman (1982) and Deal and Kennedy (1982). These authors emphasise the importance of
a customer orientation or customer oriented culture. Moreover, they hold that such a culture
to the company’s strategy should be properly matched. Quite a few scholars have pinpointed
the general notion of a proper fit between corporate strategy and corporate culture (e.g.
Tichy, 1982; Fombrun, 1983; Fombrun, 1984).
So, we may conclude there should be a proper match between corporate culture, market
orientation, corporate strategy and marketing strategy. However, until today, it is not
completely clear what culture, what market orientation and what strategy fit or not. Some
insights into this relationship do exist. However, a full and detailed understanding is still
lacking. This paper will provide more insight in that topic.
In this paper, we will elaborate on some of the possible links between corporate culture and
market orientation to investigate which configurations between market orientation and
corporate culture exist. The goal of our research is to find, in an exploratory way, what links
exist between the cultural variables and the marketing variables specific to market oriented
organisations. In fact it is aimed at finding relationships between the variables which
encourage or block the market oriented culture of an organisation.3
Generic strategies and market orientation
After the popular writings, the fundamental work on market orientation started with the
publications by Narver and Slater (1990) and Kohli and Jaworski (1990). They developed the
concepts that have been very influential in this area of research. There are a few results from
empirical studies that shed some light on the relationship between strategy and market
orientation. Narver and Slater (1990) showed that the correlation between market orientation
and a differentiation strategy was much higher than the correlation between market
orientation and a low cost strategy in their empirical study in a US manufacturing company.
Alternatively, these results imply that market orientation is better suited to a generic strategy
of differentiation (which closely resembles the marketing concept) than a low cost strategy
(which relates very much to high volumes, large batches of one type of product); on the other
hand, they imply that market orientation is not an exclusive feature of one of the two generic
strategies. Day (1990) integrated Michael Porter’s three generic strategies and his own view
on market orientation. He holds that market orientation is a combination of a customer
orientation (which typically comes to the fore in a differentiation or focus strategy) and a
competitor orientation (which typically comes to the fore in a low cost orientation i.e. being
cheaper and providing better value for money). In other words, it would be typical for a
market oriented firm to define a specific market segment, target group of customers or even
2 It first started with issues about customer orientation, later on it was broadened to market orientation. At first
the concept has been called customer orientation or customer driven. Later on, terms like market orientation,
market driven and market driving have been introduced (see e.g. Kumar, Scheer and Kotler, 2000). We will not
go into the debate about the – possible - differences between the latter three and use the term market orientation
generically (see also Day, 1999). 3 The issue of what kinds of strategies organisations follow has been left out of our study. In the qualitative
studies preceding the actual field work, we encountered many organisations having difficulties in clearly
indicating what kind of strategy they follow once they have to choose between the strategies belonging to the
well-known typology of generic strategies as developed by Porter, the four strategies being part of the Miles and
Snow typology or the four marketing strategies as developed by Kotler. Since it was our aim to investigate
market orientation and corporate culture, we did not want to develop a new questionnaire to measure corporate
or marketing strategy. Moreover, we were concerned to assume that the questionnaire should not be too long.
4
one customer and respond to their needs with the lowest cost possible; to be cheaper, better,
faster, providing more value than a competitor. This way of reasoning thus combines two
approaches, namely responding to well known customer needs and keeping cost as low as
possible. Matsuno and Mentzer (2000) found some effects of the strategy type a firm has
chosen in answering the question “what strategy type will benefit the most from becoming
more market oriented?” They applied the Miles and Snow typology of the prospectors,
analysers, defenders and reactors to this relationship. Their study among manufacturers in the
US reveals differences in this effect for prospectors (usually characterised as innovators in
markets and products), defenders (are supposed to excel in efficiency and have narrow
product market domains) and analysers (who aspire to be the best in all performance
dimensions as a combination of the strengths of defenders and prospectors). It appeared that
“Prospectors would benefit the greatest gain, over both analyzers and defenders, in market
share, sales growth, and percentage of new product sales by increasing market orientation
level.” but also that “… there is no direct path from the strategy type to a market orientation.”
(Matsuno and Mentzer, 2000, pp. 10 - 11) However, this does not mean that there could be no
mediating factor in the relationship between strategy type and market orientation. “For
example, strategy type may determine a type of corporate culture, which in turn may
influence the level of market orientation. More research on the relationships among these
three related but distinct constructs and establishment of the relevant culture dimensions to
the scale are warranted.”(Matsuno and Mentzer, 2000). In sum, there is no clear proof yet on
the relationship between market orientation and generic strategies.
Innovation, learning organisation and market orientation
Since the early nineties, more attention has been paid to the relationship between (product)
innovation and market orientation. Typically, the concept of organisational learning has also
been introduced in those studies.4 In that respect, Slater (2001) concluded that until now
market orientation has been focussing more on incremental learning than on break through
learning.
Deshpandé, Farley and Webster (1993, p. 31) report on their Japanese study that customer-
oriented and innovative firms do perform better. The authors speculate that the leaders are
firms that are first to market their products and services and are also at the cutting edge of
technological innovation. Hurley and Hult (1996) provide a valuable overview of the findings
in studies on the relationships between market orientation and innovation. They state,
amongst others, that (p.45) “A market- and learning oriented culture, along with other factors,
promotes a receptivity to new ideas and innovation as part of an organization’s culture
(innovativeness). Innovativeness in an organization’s culture, when adequate resources are
present, facilitates the implementation of innovations (innovative capacity).” Their empirical
study was conducted in a large agency of the US Federal government. Therefore, hardly any
attention has been paid to market orientation in that part of the study. One of their final
conclusions is that higher levels of innovativeness are associated with cultures that emphasize
learning, development, and participative decision making. Han, Kim and Srivastava (1998)
conducted a study to investigate to what extent organisational innovativeness affects the
market orientation – corporate performance relationship. The study was done in the US
banking industry. Organisational innovations consist of technical innovations and
administrative innovations in this study. The Narver and Slater approach to market
orientation (customer orientation, competitor orientation and interfunctional coordination)
has been used. In general, the results suggest that “…market orientation facilitates an
organization’s innovativeness, which, in turn, positively influences its business
performance.” and “…all three components of market orientation are conducive to
facilitating both technical and administrative innovations when the level of technological
turbulence in the business environment is relatively high.”(p. 40) So, a market oriented
4 There are also a few studies on market orientation and organisational learning in general; see for instance
Slater and Narver, 1995; and Baker and Sinkula, 1999.
5
culture will facilitate organisational innovativeness. In line with this conclusion, Baker and
Sinkula (1999, p. 411) showed “… that a firm’s learning orientation is likely to indirectly
affect organizational performance by improving the quality of its market-oriented behaviors
and directly influence organizational performance by facilitating the type of generative
learning that leads to innovations in products, procedures, and systems.” Lukas and Ferrell
(2000) also used the Narver and Slater three component scale of market orientation to
investigate the relationship between three kinds of product innovation: line extensions, me-
too products, and, new-to-the-world products. The study was developed on the basis of a
sample of US manufacturing companies. They concluded “… that product innovation varies
with market orientation. Specifically, (1) customer orientation increases the introduction of
new-to-the-world products and reduces the launching of me-too products, (2) competitor
orientation increases the introduction of me-too products and reduces the launching of line
extensions and new-to-the-world products, and (3) interfunctional coordination increases the
launching of line extensions and reduces the introduction of me-too products (Lukas and
Ferrell, 2000).”
It has been discussed whether innovation is a mediator or has a mediating effect in the market
orientation – performance relationship.5 Matear et al. (2002, p. 1070) conclude that “ …
market orientation both has a direct contribution to performance and also contributes through
innovation, with innovation mediating the contribution.” and conclude that their results “ …
support a contributory relationship between market orientation and innovation.” It became
also clear that market orientation is not the only source of competitive advantage.
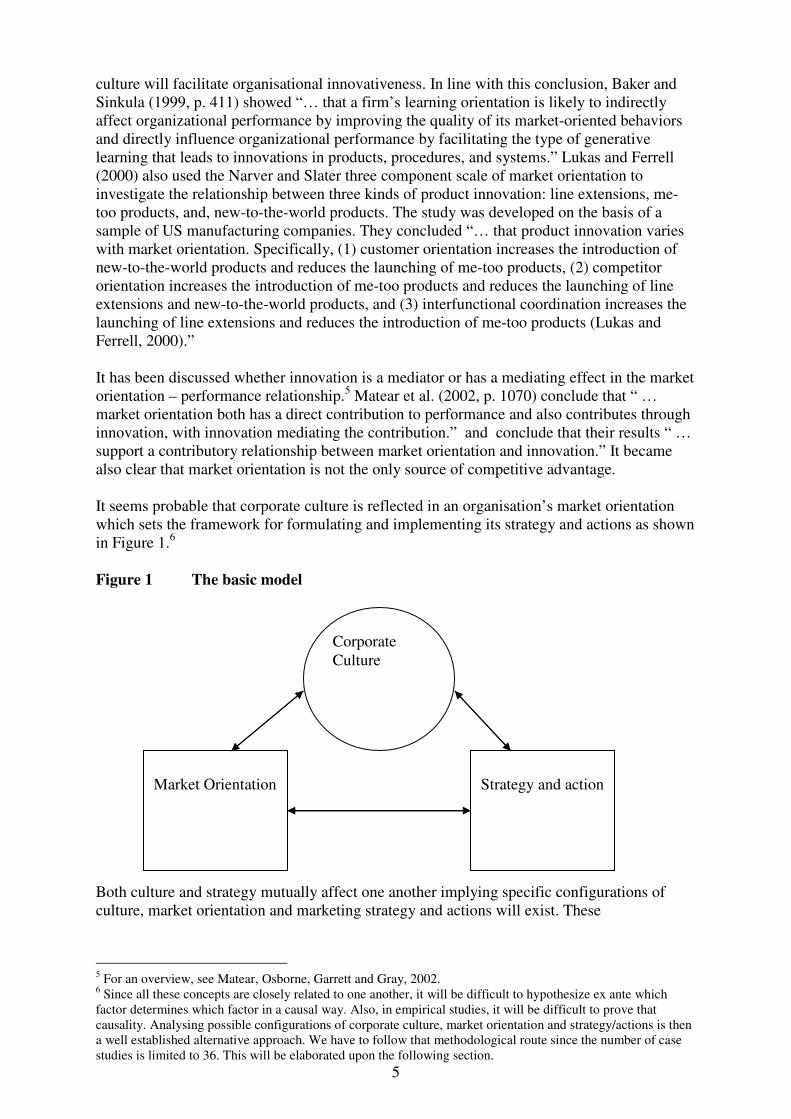
It seems probable that corporate culture is reflected in an organisation’s market orientation
which sets the framework for formulating and implementing its strategy and actions as shown
in Figure 1.6
Figure 1 The basic model
Both culture and strategy mutually affect one another implying specific configurations of
culture, market orientation and marketing strategy and actions will exist. These
5 For an overview, see Matear, Osborne, Garrett and Gray, 2002.
6 Since all these concepts are closely related to one another, it will be difficult to hypothesize ex ante which
factor determines which factor in a causal way. Also, in empirical studies, it will be difficult to prove that
causality. Analysing possible configurations of corporate culture, market orientation and strategy/actions is then
a well established alternative approach. We have to follow that methodological route since the number of case
studies is limited to 36. This will be elaborated upon the following section.
Corporate
Culture
Market Orientation
Strategy and action
6
configurations may – in turn – be determined by specific contingencies (Miller and
Mintzberg 1983; Miller 1986; Day, 1999).7
In sum, the exact configuration of market orientation, strategy and culture has not yet been
found. If such insight can be found, it will become clearer what organisations should do to
transform from a sales or production orientation to a market orientation, and consequently
improve performance. That information will support the change management processes that
will have to take place.
Therefore, we will focus on the cultural perspective on market orientation as it is the
fundamental, underlying factor determining how the organisation looks at the market and
determines how it wants to act and position itself in the market.8
Our perspective on market orientation
Much has been said in the past twenty years about the need to be market oriented. But why?
The basic premise is that market oriented firms perform better than firms that are not (or less)
market oriented (see also Hooley, Saunders and Piercy, 1998). Or, as Day has pointed out
(1999, p. ix): “Our answer is that in an era of increasing market turbulence and intensifying
competition, a robust market orientation has become a strategic necessity. Only with superior
skills in understanding, attracting and keeping customers can firms devise strategies that will
deliver superior customer value and keep this strategy aligned with changing market
requirements.”
The basic premises just formulated have been confirmed in many empirical studies.9 In their
meta-analysis of the many articles investigating the relationship between market orientation
and business performance, Rodriguez Cano, Carillat and Jaramillo (2004) concluded that this
relationship is positive and consistent worldwide. Stronger relationships were found for not
for profit organisations than for profit firms as well as for service providers than
manufacturers.
The cultural perspective of market orientation will determine the approach that has been
taken in this paper. That cultural perspective will also be regarded as the starting point for the
managerial implications of being or becoming market oriented. An organisation takes a
particular position on a scale ranging from being truly market oriented to not being market
oriented at all. So, it is not a matter of being market oriented or not, but the degree of market
orientation that is crucial. Our definition of market orientation is:
“the degree to which an organisation in all its thinking and acting (internally as well as
externally) is guided by and committed to the factors determining the market behaviour of the
organisation itself and its customers”.10
7 The existing literature on market orientation has already revealed that many factors may moderate or mediate
the relationship between market orientation and performance. Market turbulence, technological change,
innovation, customer power, market growth or competitor hostility have been mentioned in that respect. The
most relevant ones for our research have been discussed in this paper. 8 So we will not focus on one of the other four perspectives on market orientation that Lafferty and Hult (2001)
mention in their overview article: the decision-making perspective, the market intelligence perspective, the
strategic perspective and the customer perspective. We focus on the fifth perspective they mention: the
culturally based behavioural perspective. 9 Although some studies do not confirm this relationship (e.g. Han, Kim and Srivastava, 1998; Sargeant and
Mohamad, 1999; Caruana, Pitt and Berthon, 1998), the vast majority of the studies do. Hart and
Diamantoploulos (1993) found a weak positive relationship, whereas Greenley (1995) found no association at
all. 10
This definition, and its operationalisation, is not only based on the work done by Narver and Slater (1990)
and Kohli and Jaworski (1990) on market orientation or the popular writings on it by Deal and Kennedy (1982)
or Peters and Waterman (1982). It has a broader background since market orientation relates to the basics of the
firm and how the many stakeholders of the firm perceive them (see the section on methodology).
7
Market orientation as a source of competitive advantage
Being market oriented is one of the internal strengths that is hard to imitate, difficult to
sustain, not transparent nor transferable (see also Grant 1991). Market orientation can be
regarded as one of the resources giving the firm a competitive advantage (Hunt and Morgan,
1995; Hunt and Morgan 1996; Hunt, 2001). Day (1994, 1999) mentions in this respect the
capabilities of market driven organisations: market sensing, market relating and strategic
thinking.
Sensing that the market required an open mind to new information about trends in the market,
Day (1999) suggested a number of devices that can be used to accomplish this:
• creating a spirit of open-mind inquiry;
• carefully analyzing rivals’ actions;
• listening to staff on the front lines;
• seeking out latent needs;
• active scanning of the periphery of the market;
• encouraging continuous experimentation” (to get better insight in market trends).
The market driven organisation has increased capability for creating and maintaining
relationships with customers: the market relating capability. Such a relationship orientation
pervades all parts of the organisation’s mind set, values and norms. It sets the standard for all
interactions with the customer during the process of buying, using and disposing of the
product. So, the environmental impact of the product or service can also be taken into
account. Information technology eases the creation of the knowledge base necessary to
implement the relationship orientation. HRM plays a crucial role here as well, since it is
important to keep employees on board who know the customer. Employee loyalty and
customer loyalty go hand in hand according to the concept of the Service Profit Chain
(Heskett, Sasser and Schlesinger, 1997).
The capability of strategic thinking implies that all “… functions and attributes are aligned
around a clear-cut value proposition that does not try to be all things to all people.” (Day,
1999, p. 223).11
Further, the “… most successful market-driven change initiatives were
designed to meet six conditions:
• demonstrate leadership commitment;
• understand the need for change;
• mobilize commitment at all levels;
• shape the vision;
• align structures, systems and incentives; and
• sustain the change.” (Day, 1999, p. 225.)
Harris and Ogbonna (2001) investigated the relationship between leadership style and market
orientation empirically. They started this study because they hold (p. 748) “… that existing
studies overlook or ignore the potential impact of leadership style on market orientation.”
Leadership styles may block or encourage the development and implementation of a
company’s market orientation. Harris and Ogbonna (2001) used the Narver and Slater three
component model of market orientation and three types of leadership: participative,
supportive and instrumental. The empirical study consisted of a multi-industry sample
including private and public limited UK companies. The styles of participative and
supportive leadership are all positively associated with the overall market orientation and
with its three components: customer orientation, competitor orientation and interfunctional
coordination. Contrary to these results, instrumental leadership is negatively associated with
overall market orientation and with each of the three components. They also found (p.756)
that “… over 27% of the variation of the measure of overall market orientation around its
mean can be attributed to varying leadership styles, indicating that leadership style is a key
11
This statement about ‘not being everything to all people’ is also the underlying notion for Treacy and
Wiersema (1995) to develop their three value disciplines: customer intimacy, product quality and operational
excellence.
8
antecedent to market orientation.” MacKenzie et al. (2001, p. 115) have shown, in a case
study of a US insurance company in the US, that not only “… transformational leadership
influences salespeople to perform ‘above and beyond the call of duty’ but also that
transformational leader behaviors actually have stronger direct and indirect relationships with
sales performance and organizational citizenship behavior than transactional leader
behaviors.” So, transformational styles of leadership are to be preferred in market oriented
organisations to instrumental styles.
Hooley, Greenley, Fahy and Cadogan (2001) distinguish between the marketing assets (=
resource endowments the firm has acquired or built over time and that can be deployed to
advantage in the market place) and the marketing capabilities (= the glue that binds the assets
together and facilitates their effective deployment in the market place). Marketing assets can
be
• customer based (e.g. company name and reputation, branding, market knowledge,
customer relationships, customer data bases);
• distribution or supply chain based (e.g. distribution network, relationships with
key suppliers);
• internal based (e.g. cost advantages, information systems, technological skills,
legal patents and copyrights, licences and franchises); and
• alliance based (e.g. alliances giving access to new markets, new technologies or
new managerial resources).
Marketing capabilities may be
• outside-in capabilities (e.g. Day’s market sensing, market research, market
bonding, for instance via customer relationship management programs);
• inside-out capabilities (e.g. financial management, cost control, technology
development and integrated logistics);
• spanning capabilities integrating the inside-out and outside-in capabilities (e.g.
customer order fulfilment, pricing, purchasing, customer service delivery and new
product development or new service development); and
• networking capabilities (e.g. managing relationships with suppliers, pooling
expertise with strategic partners, sharing mutual trust and commitment with
strategic partners).12
All these resources, assets, capabilities, leadership styles and conditions are clearly linked to
the underlying values of the company: its culture. They can be considered as issues stemming
from the openness of the company’s culture like the external orientation toward the market,
the clarity in vision, strategy and structure, the relevance of the leader’s role model, the
rewarding policies for employees and good information systems.
The basics: market orientation and organisational values
Since the research on market orientation started, many scholars have developed the
knowledge base further. Some comprehensive overview articles have been published (see for
instance Cadogan and Diamantopoulos, 1995; Bisp, 1999; Laffarty and Hult, 2001;
Rodriguez Cano et al., 2004; Kirca et al. 2005). Diamantopoulos and his co-authors
successfully integrated the original Narver and Slater way of defining market orientation
(emphasis on customer orientation, competitor orientation and interfunctional coordination)
with the approach of Kohli and Jaworski (intelligence generation, intelligence dissemination
and responsiveness).
Laffarty and Hult (2001) elaborate on the relationship between the managerial focus and the
cultural focus taken in studies on market orientation. These authors hold that the cultural
12
For a further description of these four assets and four capabilities see Hooley et al. (2001) or Hooley,
Saunders and Piercy (book, 1998 or 2003).
9
focus goes beyond the specific structures and formal and informal processes within an
organisation. It relates to the fundamental values determining the actual practices in an
organisation: the way people behave or the way they do things in that organisation. This
cultural perspective also comes to the fore when the approach of a learning organisation has
been taken in studies on market orientation (see for instance Slater and Narver, 1995; Baker
and Sinkula, 1999). Slater (2001, p. 230) expressed this notion explicitly when stating “A
market orientation is the aspect of business culture that motivates employees throughout the
organization to place the highest priority on the profitable creation and maintenance of
superior customer value. As such, it establishes norms for behavior regarding the
organization-wide development of and responsiveness to information about customers and
competitors, both current and potential.” Slater distinguishes between the traditional and
new approach to market orientation. “Market –oriented businesses have traditionally focused
on understanding the expressed needs of the customers in their served markets and on
developing products and services that satisfy those needs”(p. 230) In this way, market
orientation is focusing on current products and services, incremental rather than breakthrough
learning and the short term. Slater (2001, p. 231) continues by stating that the, “Second
generation market-oriented businesses are committed to understanding both the expressed
and unexpressed needs of their customers, and the capabilities and plans of their competitors
through the processes of acquiring and evaluating market information in a systematic and
anticipatory manner.” Now, the focus is more on the long-term and on breakthrough learning.
Again, we see the concept of market orientation relates to the values of any organisation: its
culture.
Based on these notions we hold that as long as customer expectations are managed well and
the competitive position has been taken into account, the organisation can always be market
oriented.13
This is not exclusive to any generic strategy. Basically, it hinges upon meeting the
values customers deem relevant. As Treacy and Wiersema (1995, p. 20) have pointed out,
some customers view performance or uniqueness as the pivotal component of values, others
most value personalised service and advice, and a third group looks largely for the lowest
total cost. So, in our terminology, customers have different values that need to be satisfied by
firms having a particular notion of their own market orientation. Based on this ‘customer-
value notion’, Treacy and Wiersma (1995) developed their three value disciplines: product
leadership, customer intimacy and operational excellence. Customer intimacy probably fits
best to firms offering tailor made products and services, while operational excellence fits best
to producing low cost standard products and services. In other words, some firms may be
market oriented when they produce low cost products while others are market oriented when
they produce high quality innovative products.14
The cultural perspective on market orientation
Several research projects on market orientation and its relationship with corporate culture
have been carried out (e.g. Dunn, Norburn and Birley 1985; Mühlbacher, Vyslozil and Ritter
1987; Piercy and Peattie, 1988; Deshpandé and Webster 1989; Day 1990; Kohli and Jaworski
1990; Narver and Slater 1990; Ruekert 1992; Selness and Wesenberg 1992; Deshpandé,
Farley and Webster, 1993; Dreher 1993; Diamantopoulos and Hart 1993; Day 1994;
Greenley, 1995; Pelham and Wilson, 1996; Avlonitis and Gounaris, 1997; Piercy, 1997;
Hurley and Hult, 1998; Narver and Slater, 1998; Baker and Sinkula, 1999; Day, 1999,
Hooley et al. 2001). Cadogan and Diamantopoulos (1995) developed the concept of market
13
In this way we have reformulated George Day’s definition of market orientation presented earlier. 14
An other argument for this way of reasoning, claiming that different strategies or cultures may be associated
with the term market orientation, is given by George Day (2000). He provides examples of firms in one area of
economic activities (retailing) having different strategies and market positioning while they are also perceived
as highly market oriented. For, highly market oriented retailers like Walmart or Nordstrom follow very different
strategies: a discounter and an upscale retailer.
10
orientation further in an international context. In most of these studies, opinions have been
given on the marketing practices in the respondent’s firms which are then considered as the
marketing culture in these firms. We question whether that is a valid and reliable approach
given the one or two respondents per firm and the fact that the ‘real culture’ of the firm has
not been measured.
Two articles about corporate culture have been very influential in the field of market
orientation: Deshpandé and Webster (1989) and Deshpandé, Farley and Webster (1993).15
They define organisational culture as “the pattern of shared values and beliefs that help
individuals understand organizational functioning and thus provide them with the norms for
behavior in the organization.” (1989, p.4; 1993, p. 24) In their research they have used the
organisational cognition paradigm. This perspective allows for focussing on the information
processing approach to market orientation.16
They applied the cultural typology as developed
by Quinn (1988). Four types of organisational culture emerge from the combination of two
key dimensions. One key dimension ranges from organic to mechanistic processes. This
refers to whether the organisation puts more emphasis on flexibility, spontaneity and
individuality or on control, stability and order. The second key dimension relates to internal
maintenance or external positioning. This relates to the emphasis on smoothing activities and
integration versus the emphasis on competition and environmental differentiation. Then four
types of cultures can be defined:
• clan: organic and internal maintenance;
• hierarchy: mechanistic and internal maintenance;
• adhocracy: organic and external positioning;
• market: mechanistic and external positioning.
Their empirical study consisted of 200 personal interviews in 50 firms: two executives per
firm and two of their customers. The study was done in Japan. It revealed market cultures are
associated with the best performance followed by adhocracy, clan and hierarchical cultures.
In another study in five countries (Japan, United States, France, Germany and England) they
found again that market cultures exhibited the highest performance. However, now clans
performed the worse. Innovativeness mattered the most in explaining differences in
performance, closely followed by organisational culture and climate (Deshpandé, Farley and
Webster, 1997).
In contrast with this view, Day (1999, p. 54 – 55) states “An adhocracy is most congruent
with a market orientation because it values flexibility and adaptability while maintaining a
primary focus on the external environment. Companies like General Electric, British Airways
and Citibank seem to fit this profile. A market type of culture emphasizes competitiveness
and goal achievement as well as productivity and market mechanisms. The aggressive style
of PepsiCo. in both the beverage and Frito-Lay Snack Division fits this culture type.”
In evaluating the results of the studies mentioned it appears that they do not lead to a
common conclusion. It is not clear what type of culture leads to the best performance.
However, it should be taken into account that the studies have been done in various countries
each having its own national culture. This may affect the way companies deal with customers
and hence their corporate cultures and market orientation. Moreover, quite a broad measure
has been used to measure corporate culture. For instance, the market culture type is
characterised by the existence of
• dominant attributes as competitiveness and goal achievement;
• leadership style emphasising decisiveness and achievement-orientation;
• bonding to the organisation via goal orientation, production and competition; and
15
Also these two studies are subject to our criticism 16
This information processing approach of market orientation is present in the definition provided by Kohli and
Jaworski which focuses highly on ‘intelligence’ as well as in Narver and Slater’s dimension of interfunctional
coordination.
11
• strategic emphasis on competitive advantage and market superiority.
So, the cultural aspect has been researched not deeply and detailed enough. It remains too
superficial. The real values or dominant attributes of each of the four cultural types do not
really come to the fore.
Our approach to measuring corporate culture
A more detailed measure of corporate culture has been developed conceptually by Hofstede
(1991). He defines (p.180) corporate culture as “the collective programming of the mind
which distinguishes the members of one organization from another”. Moreover, he states
(p.182 – 183), “shared perceptions of daily practices should be the core of an organisation’s
culture”. Especially these practices should be researched when one wants to investigate
corporate culture empirically. Corporate specific norms and values will be expressed and
reflected in those practices.
Many other authors have published on corporate culture (e.g. Schein 1985, Trice and Beyer,
1993). Quite a few topics have been pinpointed as topics that are open for debate in this
domain of organisational culture, like single cultures or multiple cultures, consensus versus
dissensus, distinctive versus universal elements, or rigid versus malleable cultures (see e.g.
Trice and Beyer, 1993, for an overview of the existing views on these topics). We hold that
organisational cultures can be changed to a certain extent, especially by changing some of the
practices that are considered to be the expression of the culture. In line with this ‘practises
approach to culture’, we prefer to apply the Hofstede approach since it appears to be not only
a validated instrument to measure such practices, but also because it appears to be very
relevant and clear to managers. One of Hofstede’s statements to measure corporate culture is
phrased in terms of meeting customer needs. In that way, such a measurement instrument is
already closely linked to our subject of market orientation. Applying the Hofstede scale also
offers the opportunity to fine tune that measurement instrument with respect to an
organisation’s market orientation.
Hofstede has developed a number of questions to operationalise organisational culture in
order to measure it empirically (Hofstede 1991, pp. 187 – 192). This measurement instrument
has been validated in several case studies and will be used here. The scale consists of
nineteen items (see table 1). These items can be grouped into six dimensions (within brackets
the specific questions are mentioned):
1. process oriented versus results oriented (C3, C8, C18);
2. employee oriented versus job oriented (C2, C10, C11);
3. parochial versus professional (C5, C9, C16);
4. open system versus closed system (C6, C12, C14);
5. loose control versus tight control (C4, C7, C13); and
6. normative versus pragmatic (C1, C15, C17, C19).
From the description of the nineteen items in table 1, it becomes clear that an organisation’s
(degree of) market orientation will come to the fore especially in the items upon which
dimension six is built. Based on the content of this dimension, a market oriented organisation
will be pragmatic in its culture: meeting customer needs has top priority, results are more
important than following the correct procedures, the organisation is largely aware of the
competition. This conclusion is more or less in line with a conclusion to be drawn from Deal
and Kennedy’s work indicating a higher degree of market orientation probably will be
associated with a greater willingness to take (high) risks and a faster feed back on the results
accomplished in the market place. So, in terms of the Hofstede dimensions, market
orientation will be reflected also in the dimension of results orientation: accepting risks is
considered to be normal practice in daily organisational life, people do their utmost best, each
day brings new challenges. This is also the characteristic of professional firms. George Day
(1999) holds that market oriented organisations have an externally oriented culture (p.6). In
other words, this culture is an open and participative one (p. 7) and one in which people learn
from failures or mistakes (p. 50). This refers to Hofstede’s dimension of openness: market
12
oriented organisations are open minded, accept almost everyone as a colleague, new
employees feel at home very quickly. The participative element of culture might be reflected
in loose control systems (dimension 5) and an interest in people (dimension 2). Such
organisations will be managed professionally (dimension 3). So, we formulate the following
propositions about the cultural features of market oriented organisations:
Proposition 1: The more market oriented organisations are, the more their culture
will be characterised by a results orientation rather than a process orientation.
Proposition 2: The more market oriented organisations are, the more their culture
will be characterised by an employee orientation rather than a job orientation.
Proposition3: The more market oriented organisations are, the more their culture
will be characterised by a professional orientation rather than a parochial orientation.
Proposition 4: The more market oriented organisations are, the more open their
culture will be rather than closed.
Proposition 5: The more market oriented organisations are, the more their culture
will be characterised by a loose control system rather than a tight control system.
Proposition 6: The more market oriented organisations are, the more their culture
will be characterised as pragmatic rather than normative.
Our approach to measuring market orientation
The studies on market orientation that have emphasized the cultural perspective investigate
all kind of marketing practices that are supposed to reveal the market oriented culture of the
organisation. As stated, we hold that is too simple as the only way of measuring the market
oriented culture of an organisation. In this approach the culture as such is not measured, only
the way it is reflected in some marketing practices. This is relevant of course, but only a
partial approach to really identifying the way in which corporate culture and market
orientation are linked together. To us, both the underlying culture of the company as well as
the way in which it is reflected in the marketing domain should be measured. That is another
reason why we discussed the Hofstede approach to measuring corporate culture. It offers the
opportunity to measure these underlying factors. In our approach we intend to measure some
practices reflecting the organisational culture in general and some marketing practices to
measure the unique marketing practices belonging to a certain degree of market orientation.
By measuring both kinds of practices we will be able to measure the culture of market
oriented organisations. So, now we first have to look at what marketing practices could be
relevant.17
Then we can combine the cultural characteristics as mentioned in the previous
section with the marketing topics mentioned in this section.
The set of marketing variables taken into account, has not only been based upon the variables
included in the Narver and Slater (1990) and Kohli and Jaworski (1990) studies. We also
included issues related to the ‘long term horizon’ and ‘profit emphasis’ that were originally
omitted from the 1990 Narver and Slater scale as well as topics from the studies performed
by Ruekert (1992), Kohli, Jaworski and Kumar (1993), Hart and Diamantopoulos (1993),
Cadogan and Diamantopoulos (1995), Greenley (1995a, 1995b), Siguaw and Diamantopoulos
(1995), Gray, Matear, Boshoff and Matheson (1998), and Langerak (2001).18
Moreover, we
included topics from studies on marketers’ and consumers’ attitudes and opinions about
17
These practices can be regarded as the result of the implementation of the marketing strategy chosen. 18
Langerak introduced the difference between upstream market orientation and down stream market orientation,
depending on the position a company has in the distribution channel.
13
particular topics in the domain of marketing and consumerism (Barksdale and Darden, 1972;
Barksdale et al., 1982; Interview-IPM, 1974 and 1981; Gaski and Etzel, 1986). Finally, we
included many issues from the PIMS studies by Buzzell and Gale (1987) and insights
reported by Deal and Kennedy (1982) and Peters and Waterman (1982). We started our
research in the late eighties and added new topics to the questionnaire that have proven to be
relevant according to the research published on market orientation and our discussions with
managers. So, the measurement instrument is quite dynamic and unique. The results of our
studies over the past ten years may contribute to further fine tuning of the scale to measure
the extent to which an organisation is market oriented.
The measurement instrument on market orientation has been developed as follows. First a list
of all the marketing items from the above mentioned studies was made. This list of more than
200 statements was carefully checked for overlapping statements by the author and some
colleagues. This led to a reduction of about 50%. The remaining statements were used in the
first smaller case studies. Analysing the correlations between the statements and correcting
for the high correlations led to a shorter questionnaire of about 70 marketing statements. This
one was applied in the first larger scale case study (the computer services company) in which
135 respondents participated. Such a case number of respondents offers the possibility to
further reduce the dataset via factor analysis. The questionnaire that resulted after this
procedure has been used in the case studies. Based on new insights in recent literature, some
new statements have been added to the questionnaire.19
The marketing and management variables taken into account refer to eight categories of
subjects. The items belonging to each category are mentioned in table 2 and are shown here
within brackets. These eight categories are:
1. general issues about the efforts the organisation takes to be(come) market
oriented and some underlying basic issues (M4, M9, M17, M25, M28, M30);
2. learning organisation (M16, M29);
3. customers (M1, M11, M12, M26);
4. competitors (M2, M3, M13);
5. employees (M15, M20, M22, M27);
6. commitment to marketing in the organisation (M10, M14);
7. coordination and dissemination of (marketing) information (M8, M18, M19,
M21); and
8. new product/service development (M5, M6, M7, M23, M24).
Proposition 7: The more market oriented organisations are, the more they will be
characterised by the basic features of marketing.
Proposition 8: The more market oriented organisations are, the more they will be
characterised as learning organisations.
Proposition 9: The more market oriented organisations are, the better they know their
present and future customers to meet their preferences.
Proposition 10: The more market oriented organisations are, the better they know their
present and future competitors and provide better quality/value.
Proposition 11: The more market oriented organisations are, the more dedicated
employees knowing what market orientation means (and acting accordingly) they will have.
19
These newest items are not included in this paper, since there are not enough companies yet that have
responded on these items.
14
Proposition 12: The more market oriented organisations are, the greater their
commitment to marketing at all levels in the organisation.
Proposition 13: The more market oriented organisations are, the more they will have a
well coordinated process of collecting and disseminating marketing information throughout
the organisation.
Proposition 14: The more market oriented organisations are, the closer they are to the
market with respect to developing and launching successful new products and services.
Now that these propositions have been developed we can give a first indication of the
proposed configuration of corporate culture and market orientation. That overview sets the
general framework for the more detailed propositions that will be developed later.
The corporate culture – market orientation configuration in organisations
When the six propositions on corporate culture are combined with the eight propositions on
market orientation we may tentatively propose that:
• the more market oriented organisations are;
• the more results oriented, employee oriented, professional, open, loosely
controlled, and pragmatic organisations they are; and
• the more they will be characterised by the basic features of marketing, the more
they will be characterised as a learning organisation, the more they will be
committed to marketing, the more they will know about their markets (customers
and competitors), the more they will know about market orientation and act on it,
the better their relative quality will be, the better their process of collecting and
disseminating market information will be, and the more successful they will be in
launching new products and services.
Or stated in the reverse way, a process oriented, job oriented, parochial, close, strictly
controlled and normative culture will be characterised by an absence of the basics of
marketing and hence all the other features of marketing and market orientation as mentioned
before. Consequently, such a culture is blocking a market oriented culture.
In order to measure the propositions 1 till 14 empirically, we had to operationalise the
concepts as indicated before and shown in the Appendices 1 and 2. It would go too far to
mention all the possible detailed hypotheses here. Therefore, we will focus on the correlation
matrix in which the Pearson correlations between the average scores on each of the marketing
statements and the culture statements for each of the cases have been provided (table 5). The
cultural statements used are the ones stemming from the validated Hofstede studies on
corporate culture. It hinges upon 19 items. One dimension is represented by four statements
(the one on pragmatic and normative) while each of the other five dimensions is built up of
three statements. Data on all 19 items are available for all cases. The list of marketing
statements used in this analysis consists of 30 items. More statements have been used in the
various case studies because all the questionnaires were customised or extended over time.
The 30 items we report here are the items that belong to ten or more of the cases in the data
base as used in this paper. Missing data have been substituted by the mean score of the
existing data.20
20
This research program started at the end of the eighties and is based on the literature that existed at that time
and our own insights. As the research went on, the new insights from the literature were added whenever
possible. Therefore, the questionnaire has developed over time. Nevertheless, when comparing all the studies
carried out, a number of items are incorporated in all studies. Those items will be used in this paper.
15
Research design
In our study we have chosen to do multiple case studies to get further insight into these
propositions. Next to the conceptual work, most of the academic research on market
orientation hinges upon testing hypotheses in cross sections in many or a few industries. Most
of the time, one or a few respondents per company complete the questionnaires or are
interviewed. Since culture relates to the shared beliefs, we hold it is necessary to invite all the
employees of an organisation to participate in the study. Moreover, we experienced in our
pilot studies that managers have a different representation of reality in their company than
employees on the shop floor. Therefore, we decided to do our research on corporate culture
and market orientation on the basis of case studies.
In each company we ideally interviewed 10 to 15 randomly selected employees 21
. Then a
questionnaire was mailed to all the employees. It always consisted of 19 items on corporate
culture. Usually 35 statements on marketing practices were provided (this number may differ
for it was tailored to the specific company in the case study) and finally 5 questions about the
respondent’s demographics. A pre-paid envelope was included to return the completed
questionnaire to the researcher.
A wide variety of organisations have participated in our case studies thus far: both
manufactures and service providers (see table 3). They were selected randomly. The first case
studies were done in the late eighties; the last one to be reported here was completed in 2001.
The response per organisation was quite representative for the whole organisation. Table 3
contains some basic information about our 26 cases.
The results of the qualitative part appeared to be in line with the results of the quantitative
part. Moreover, presenting the results to the organisations investigated not only made the
management teams say that they had face validity but also made them conclude that it was an
appropriate reflection of what they were experiencing in their company. However, some
unexpected findings were reported. Discussing these unexpected findings most of the time
offered new insights to the companies as to why some actions or procedures were not
working that well or why their perceptions differed from all employees. We concluded that
the results of our studies were reliable and valid results, not only making sense but also
reflecting the true situation in the company.
The mean scores for each organisation as to how the employees perceive their company’s
culture and market orientation have been used to do the analysis. However, using mean
scores could lead to wonderful, though artificially high correlations, merely due to the fact
that there is a tendency to the mean. Then the real value of the correlations is not depicted.
Therefore, we have chosen to slightly modify our data base. Fortunately, some case studies
had that many respondents that we could apply hierarchical cluster analysis to detect several
clusters of market orientation within those companies.22
We have chosen to use the average
scores per cluster within a particular company whenever it was possible to perform such an
analysis instead of the overall mean scores for that large company. This could be done in four
cases. In three of those four cases, four clusters could be detected. In one case, the results
could be split in two clusters. The other 22 cases were too small to search for independent
21
This number may be less when small organisations are investigated. 22
The clustering has been based on all cultural and marketing statements in that particular company. Once these
clusters were found, it was possible to see whether the respondents within one cluster belonged to the same age
group, gender, department, etc. It appeared that some respondents were overrepresented in some clusters.
However, it could not be concluded that it was always the case that for instance 100% of all employees in the
sales or marketing department were in one cluster. In one of the insurance companies it even appeared that each
of the four members of the Board of Directors was present in one of the four clusters found. This made them
conclude: ‘now we understand why we have so much discussion on our way of marketing the company and
cannot come to an agreement; we all have different perspectives of the market and our company within the
market’.
16
clusters or groups within the company. So, in fact we now have created a new dataset of 36
“cases / respondents” (=22 smaller cases plus 3*4 clusters plus 1*2 clusters). This set has
been used for our analysis. It consists of 12 manufacturers and 24 service providers
(originally these numbers were 12 manufacturers and 14 service providers).23
Findings
The average item scores for all of the 36 cases are presented in table 4. Six statements show
very clear opinions for the whole group of organisations.24
With respect to the culture
statements this table reveals the respondents hold that employees always do their best in their
jobs (C8; mean score 3,84), that the company has high standards with respect to ethics and
fairness in doing business, even if it would damage short time results (C17; mean score 3,73)
and that the people are well aware of competition (C19; mean score 2,17). With respect to the
marketing statements the mean scores indicate that the respondents feel their own work is
important for accomplishing the company’s customer friendliness and service (M22; mean
score 2,00), the company has many competitors in its industry (M3; mean score 2,07) and top
management stress again and again that the focus should be on the customer (M10; mean
score 2,25).25
This implies that, on average in this group, the organisations do not have strong
opinions on their culture or marketing practices.
After this general overview it is important to have a closer look at the relationships between
the variables representing corporate culture and those representing the market orientation. We
will describe our results in terms of descending order of the correlations. We simply
calculated the Pearson correlation coefficient.
Table 5 reveals that the culture statements with the highest number of significant correlations
(top 3) deal with openness and transparency of the organisation (C6), the daily challenges
(C18), and top priority is in meeting customer needs (C1).26
These statements represent topics
from three different cultural dimensions, namely the open mindedness, the results orientation
respectively the pragmatic side of the culture.
On the other hand, the top 5 of the marketing statements consists of the relative quality (M2),
the company doing its utmost best (M17), the existence of clearly formulated marketing goals
(M9), knowledge about the customers (M11), and encouraging feed back from the market
place (M16). These items refer to issues from four different dimensions within the market
orientation scale: general issues (utmost best, clear marketing goals), learning organisation
(feed back from the market), customers (knowledge on them) and competitors (relative
quality).
This is a first indication of the items that probably will be relevant in the corporate culture
market orientation configuration. At the same time it appeared that three cultural statements
did not have any significant correlations with the marketing statements: the impact of the
organisation’s norms at work and at home; all people fit in the organisation or only special
ones; and, awareness of competition. These three belong to three different cultural
23
Only the statements that were used in ten or more case studies are involved in our data analysis, otherwise the
minimum number of ‘respondents’ per item would be too small. The missing data have been substituted by the
mean scores of the existing data. Correlations found here are very much in line with the correlations found in
each case study; consequently, this procedure of dealing with missing values is not creating artificial results. 24
Here we applied the rule of thumb indicating that scores smaller or equal to 2.30 and scores equal to or larger
than 3.70 give clear opinions on the statements (on these 5 point – Likert and cultural - scales) 25
It may be that the answer to the issue of one’s own work’s importance to accomplishing customer friendliness
and service is based on some kind of social desired answering. However, if respondents said their work would
be of no importance to that, it would be a disaster. 26
A further look at the data reveals these three culture items are quite correlated to one another: giving top
priority to meeting customer needs and openness and each day is challenging. Their Pearson correlation
coefficients are between .70 and .75; these are significant at the .01 level.
17
dimensions. It also appeared that five marketing statements did not correlate significantly to
any cultural statement. Two of them are part of the general topics (delivery times, clearly
formulated company goals); the others belong to different topics, like competitors (many
competitors), employees (doing more for the customer than agreed upon) and new
product/service development (risky). So, these are also not concentrated in one particular
topic. Consequently, the significant correlations hinge upon a wide variety of topics from all
cultural and marketing topics in our questionnaire.
Analysing the sizes of the many significant Pearson correlation coefficients reveals sixteen of
them are equal to or greater than +.75 or equal to or smaller than -.75. 27
These can be
considered as the most important ones determining the configuration of market orientation
and organisational culture. They are:
• an open culture is positively correlated to clarity about the things that have to be
done for the customer (C6xM26: .86);
• not having high ethical standards is positively correlated to looking after the self
interest of departments (C17xM28: .85);
• each day is pretty much the same is negatively correlated to the clear
communication about new plans and changes affecting someone’s own work
(C18xM19: -.84);
• an open culture is positively correlated to our company does its utmost best to be
the best (C6xM17: .82);
• an open culture is positively correlated to learning from each others’ mistakes
(C6xM29: .82);
• meeting customer needs as top priority is negatively correlated to departments
looking after their own interest (C1xM28: -.82);
• an open culture is negatively correlated to a poor cooperation between
departments (C6xM18: -.81);
• each day is pretty much the same is correlated negatively to a good internal
communication about new plans on operating in the market (C18xM21: -78);
• an open culture is positively correlated to a good internal communication about
new plans and changes affecting one’s own work (C6xM19: .78);
• an open culture is positively correlated to a good internal communication about
new plans on operating in the market (C6xM21: .78);
• each day is pretty much the same is positively correlated to a poor cooperation
between departments (C18xM18: .77);
• an open culture is positively correlated to a relative better quality of products and
services offered (C6xM2: .77);
• meeting customer needs has top priority is positively correlated to encouraging
feed back from the market (complaints and compliments) (C1xM16: .76);
• the organisation is only interested in the work delivered is negatively correlated to
a relative better quality of products and services offered (C10xM2: -.75)
• an open culture is positively correlated to encouraging feed back from the market
(complaints and compliments) (C6xM16: .75); and
• new employees need only a few days to feel at home is positively correlated to it
is always clear what the customer wants and what job has to be done when we
start that job (C14xM26: .75).
This overview reveals again the critical position of an organisation’s open culture dimension
with respect to market orientation: nine of these sixteen highest correlations deal with the
openness feature of the organisation’s culture. The openness is positively correlated to
27
If we mentioned all the statistically significant correlations, this overview would be too long to be useful.
Table 5 contains all the information.
18
• a general marketing feature (the drive to be the best);
• two features of a learning organisation (encouraging feed back from the market
place and learning from each other’s mistakes);
• a feature of the customer part of the market orientation (clarity about the work to
be done for the customer);
• a feature from the competitive part of market orientation (better relative quality)
and
• three features from the coordination and dissemination of market intelligence
(excellent cooperation between departments within the organisation and two items
on excellent internal communication).
Three other high correlations refer to the process part of the process/results dimension in an
organisation’s culture: daily stability is correlated positively to poor cooperation between
departments and is correlated negatively to excellent internal communications. In other
words, a challenging environment (belonging to a results orientation) is positively correlated
to excellent cooperation and internal communication.
Three other high correlations are to be found in the normative/pragmative dimension of
corporate culture. Meeting customer needs as top priority has been correlated negatively to
pursuing self interest (which in turn is correlated positively to the cultural item of ‘the end
justifies the means’) and positively to encouraging feed back from the market. So a pragmatic
part of the culture would correlate positively to a lack of pursuing self interest and the feed
back from the market; the normative part reflects the ethics and fairness in doing business
even it could damage the company’s results in the short run.
One statement from the employee/job orientation in the culture (the organisation is only
interested in the work to be done) is correlated negatively to the relative better quality of the
product and services offered. In other words, interest in people (employee orientation) is
positively correlated to a relative better quality.
Finally, analysing the results for both the parochial-professional dimension as well as the
loose – tight control dimension does not reveal many very high correlations. As a general
comment we may deduce from these results that market orientation and a long time
perspective (professional) go hand in hand. It seems to be the case that if control is strict (e.g.
the marketing philosophy is clearly visible, clear marketing goals exist) on one hand, it is
loose on the other hand (employees may organise their work based on guidelines from their
bosses). Obviously, the framework has been set in which the empowered people may work on
the basis of a balanced control system. Also the correlations between the issues about new
product/service development and the cultural items are not that high. Generally it is thought
that the employees developing new products and services have close contact with the market
and indicate that people always do their utmost on challenging days.
Conclusion and discussion
In comparing the findings with our propositions we conclude that most of the propositions
have been supported. Table 5 reveals significant correlations between the issues relating to
each of the six cultural dimensions and each of the eight marketing dimensions. However,
some modifications have to be made. As proposed the results indicate that the corporate
culture of market oriented organisations is indeed open, results oriented, employee oriented
and professional (long term perspective) but is also balanced on the dimensions of
pragmative/normative and tight/loose control. Contrary to these last findings, it was proposed
– however - that the culture would be pragmative and have a loose control system. So, these
two propositions are not supported.
Table 5 reveals a large number of correlations. Based on the highest correlations, it can be
concluded that the most important building blocks of the market oriented corporate culture
are:
• from the cultural side:
- its openness;
19
- its results orientation;
- its balanced pragmatic (customer needs) and normative (high ethics)
culture; and
- its employee orientation;
and, from the marketing side:
- its internal cooperation and internal communication (as issues on the
coordination and dissemination of information throughout the
organisation);
- its drive to be the best, lack of pursuing self-interest (as examples of
general issues);
- its learning from mistakes and encouraging feed back from the market (as
issues on the learning organisation);
- its clarity about the work to be done for the customer (as an issue from the
customer orientation); and
- its better relative quality of products and services offered than competitors’
(as an issue from the competitor orientation).
Presumably, these are the most significant and important issues in the market orientation
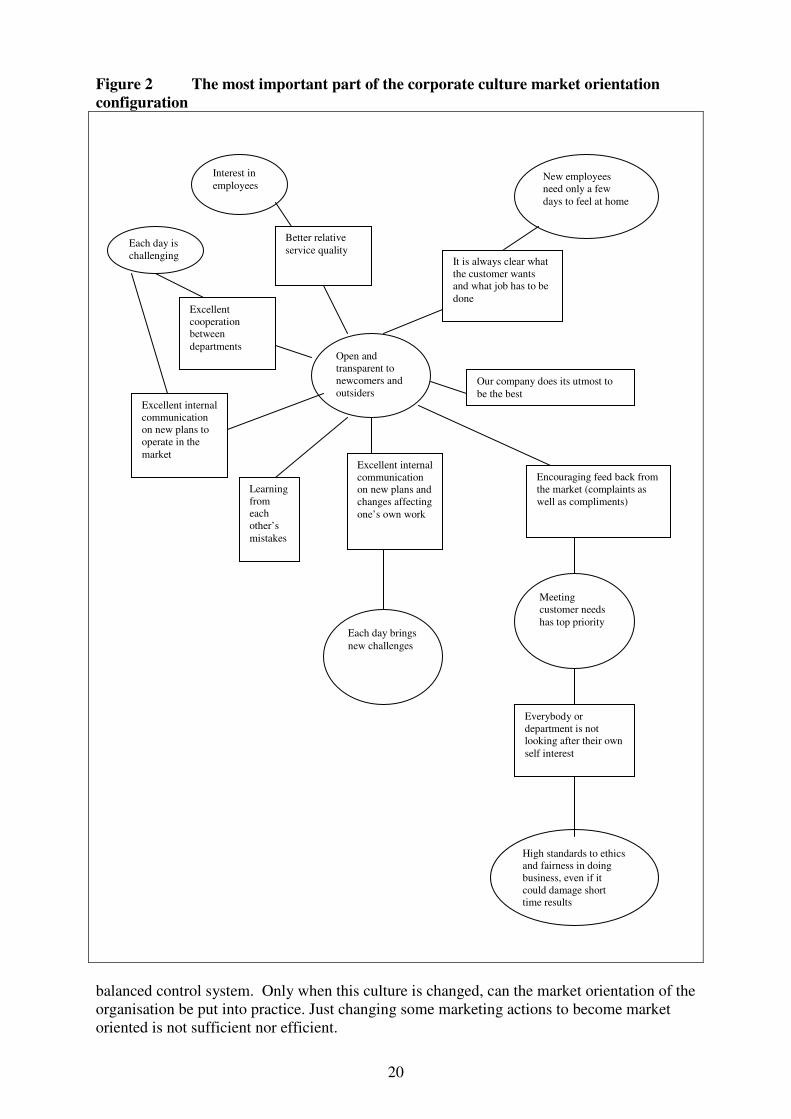
corporate culture configuration. When we combine these findings into one picture, figure 2
emerges. This figure should be read as follows. The rectangles represent marketing issues
while the circles represent cultural issues. The figure has been made to represent positive
relationships between topics. In fact, based on the most prominent correlations found, a
configuration of many different interrelated issues is shown revealing the corporate culture
market orientation configuration.
Consequently, when an organisation intends to change its market orientation, its strategy or
its culture, this figure shows which features are the most important ones managers should
change in order to accomplish their goals. So, managers will see what cultural issues and
marketing issues have to be changed in order to be in line with one another as suggested by
the corporate culture market orientation configuration.28
For instance, encouraging feed back
from the market or improving the internal communication will contribute to creating a more
open culture. Or, in other words, when every employee or department is pursuing its own
interest, it is not likely that customer needs will get top priority and that feed back from the
market is encouraged; the organisation will stay closed to a large extent, cooperation between
departments will be poor and internal communication will be inefficient. So, Figure 2
provides the information on the issues that should be subject to change management in order
to become really market oriented. In fact, figure 2 hinges partly upon the outside –in
capabilities of market oriented organisations in turbulent environments, but also the other
capabilities mentioned are represented. Having many competitors as such is not an issue here;
it is important to have a better relative quality than the others by doing its utmost and
knowing exactly what customers want.
Broadly speaking, the results of these case studies are in line with the results from the cross-
sectional studies on market orientation referred to at the beginning of this paper. However,
here we have measured corporate culture itself. Now the fundamental underpinning upon
which the marketing actions are based, has been made explicit. Although openness has been
mentioned before as a characteristic of market oriented firms (Day, 1999) as well as the
importance of the HRM factor (Heskett, Sasser and Schlesinger, 1997), this research shows
that even more cultural features are at stake, namely the professional orientation, the results
orientation, the balance between a pragmatic and normative culture and – finally - the
28
With this graph we can also avoid the discussion on ‘whether it is possible to change any culture’. For, it is
now possible to work – very pragmatic – on changing some of the marketing actions which in turn might induce
the changes in the culture.
20
Figure 2 The most important part of the corporate culture market orientation
configuration
balanced control system. Only when this culture is changed, can the market orientation of the
organisation be put into practice. Just changing some marketing actions to become market
oriented is not sufficient nor efficient.
Interest in
employees
Each day is
challenging Better
rebetterl
ative
Open and
transparent to
newcomers and
outsiders
Each day brings
new challenges
New employees
need only a few
days to feel at home
Meeting
customer needs
has top priority
High standards to ethics
and fairness in doing
business, even if it
could damage short
time results
Better relative
service quality
Excellent
cooperation
between
departments
Excellent internal
communication
on new plans to
operate in the
market
Learning
from
each
other’s
mistakes
It is always clear what
the customer wants
and what job has to be
done
Our company does its utmost to
be the best
Excellent internal
communication
on new plans and
changes affecting
one’s own work
Encouraging feed back from
the market (complaints as
well as compliments)
Everybody or
department is not
looking after their own
self interest
21
Given the findings about the relevance of interests in employees and customers, organisations
showing a great care in (these) people do have the conditions set to accomplish a better
relative quality. The combination of knowledge about competitors and customers is said to be
the combination to have a market driven strategy. Care for people is also reflected in setting
and communicating clear targets. Then the employees know the framework in which they are
working, in which they can exercise their responsibility and empowerment. If this reasoning
holds, that might explain partly why the relationship between market orientation and
performance is stronger for service organisations than in manufacturing (Rodriguez Cano et
al. 2004).
Limitations and further research This study has taken a different methodological approach to existing ones that focus on large
scale cross sectional analysis. This new case study approach has proven to be promising and
revealing more in depth insights than the others on measuring corporate culture as the shared
beliefs and the accompanying market orientation. The number of cases available is a
limitation of this study. Also, the majority of the case studies have been undertaken in The
Netherlands (with one in the UK). It may be that the findings are culturally bound in the
sense that the findings are typical for the Dutch national culture. Mavondo (1999), for
instance, found that the psychometric properties of the Narver and Slater market orientation
scale differed across countries (in his case Australia and Zimbabwe). Therefore, more case
studies should be done in other countries representing different national cultures in order to
investigate the culturally boundedness of market orientation.
In general, more case studies should be done to enlarge the data base. A larger data base
allows for more sophisticated statistical analysis than performed here. Especially when more
cases are similar on the same statements measured (and the missing values have not to be
substituted by the means of the existing scores), factor analysis could be used to eventually
further reduce the dataset (and avoid the complicated pictures that are required to represent
all the significant correlations as in figure 2). In this paper we have refrained from in depth
analysis of the correlations between the marketing items themselves as well as the cultural
items themselves. This topic should be taken into account in further research.
These case studies have not focused on the financial and non financial performance of the
organizations investigated. This topic should be added in future case studies.
The same holds for the leadership styles appropriate to a market oriented culture. For
example, Day (1999) contended that an aggressive style would fit, while Harris and Ogbonna
(2001) and MacKenzie (2001) indicate that a transformational leadership would fit very well.
It might even be that a combination of instrumental and transformational leadership is needed
in market oriented cultures (just as it is the case in the combination of the two generic
strategies to be market oriented: low cost strategies and differentiation Day, 1990; Mavondo,
1999). Leaders set the tone for the organisation’s culture and its values. Therefore, more
research on leadership style, corporate culture and market orientation should be carried out in
the near future. The management literature contains a lot of leadership styles that have been
developed and validated in many studies (see for instance Blanchard, 1985; Quinn, 1988;
Goleman, 1998; Dessler, 2002; Robbins and Coulter, 2002). Those concepts could be applied
easily in this kind of studies. Leaders are supposed to have six characteristics distinguishing
them from non-leaders:
• drive: high effort level, high desire for achievement, ambitious;
• desire to lead: strong desire to influence and lead others;
• honesty and integrity: they build trusting relationships between themselves and
followers;
• self-confidence: that is the way to convince followers;
• intelligence: in order to cope with a lot of information and to create visions, solve
problems, and make correct decisions;
22
• job-relevant knowledge: they have in-depth knowledge about the company, its
products and services, industry, etc. to make well-informed decisions.
Many of these issues also come to the fore in the characteristics of market oriented firms as
we have seen. But, all of them can be exercised in a particular way. Whichever styles that
exist can determine the specific type of leadership in a market oriented organisation that will
motivate the employees to serve the customer to the best of their ability and certainly better
than their competitors. .
23
REFERENCES:
Avlonitis, George J. and Spiros P. Gounaris (1997), “Marketing Orientation and Company
Performance: Industrial vs. Consumer Goods Companies”, Industrial Marketing
Management, Vol. 26, issue 5, pp. 385-402.
Baker, William E. and James M. Sinkula (1999), “The synergistic effect of market orientation
and learning orientation on organizational performance”, Journal of the Academy of
Marketing Science, Vol. 27, No. 4, pp. 411-427.
Barksdale, Hiram C. and Bill Darden (1972), “Marketers’ Attitudes Toward the Marketing
Concept,” Journal of Marketing, 35 (October), 29-36.
Barksdale, Hiram C., William D. Perreault jr., Johan Arndt, J.A. Barnhill, W.A. French, M.
Halliday and J. Zif (1982), “A Cross-National Survey of Consumer Attitudes toward
Marketing Practices,” Columbia Journal of World Business, 71-86.
Bisp, Sören (1999), Barriers to Increased Market-Oriented Activity: What the Literature
Suggests, Journal of Market-Focused Management, 77-92.
Blanchard, K.H. Zigarmi, P. and D. Zigarmi (1985), Leadership and the One-Minute Manager:
Increasing Effectiveness through Situational Leadership, William Morrow and Company,
New York, NY.
Buzzell, Robert D. and Gale, Bradley T. (1987), “The PIMS Principles: linking strategy to
performance,” New York: The Free Press
Cadogan, John W. and Adamantios Diamantopoulos(1995), “Narver and Slater, Kohli and
Jaworski and the Market Orientation Construct: Integration and Internationalization,
“Journal of Strategic Marketing, Vol. 3, Issue 1.
Caruana, A., Pitt, L. and Pierre R. Berthon (1996), “Market Orientation and Business
Performance: Some European Evidence,” International Marketing Review, Vol.13, Issue
1.
Day, George S. (1990), Market-Driven Strategy; Processes for Creating Value, New York:
The Free Press.
Day, George S. (1994), “The Capabilities of Market-Driven Organizations,” Journal of
Marketing, 58 (October), 37-52.
Day, George S. (1999), The Market Driven Organization: Understanding, Attracting, and
Keeping Valuable Customer, New York: The Free Press.
Deal, Terrence E. and Allan A. Kennedy (1982), Corporate Cultures: The Rites and Rituals
of Corporate Life, Reading Ma: Addison-Wesley.
Deshpandé, R., Farley, J. and Frederick E. Webster, Jr. (1993), “Corporate Culture Customer
Orientation and Innovativeness in Japanese Firms: A Quadrad Analysis,” Journal of
Marketing, Vol.57, Issue 1.
Deshpande, Rohit, and Frederick E. Webster, Jr. (1989), “Organizational Culture and
Marketing: Defining the Research Agenda,” Journal of Marketing, 53 (January), 3-15.
24
Dessler, D. (2002) “Democracy, Liberalism and War,” American Political Science Review,
Vol. 96, Issue 3.
Diamantopoulos, Adamantios and Susan Hart (1993), “Linking Market Orientation and
Company Performance: Preliminary Evidence on Kohli and Jaworski’s Framework,”
Journal of Strategic Marketing, 1, 93-121.
Dreher, Angelika (1993), “Marketing Orientation: How to Grasp the Phenomenon,” in
Marketing for the New Europe: Dealing with Complexity, Proceeding XXII EMAC
Conference, Joseph Chias and Joan Sureda, eds. Barcelona, 375-393.
Dunn, Mark G., David Norburn, and Sue Birley (1985), “Corporate Culture, a Positive
Correlate with Marketing Effectiveness,” International Journal of Advertising, 4, 65-
73.
Fombrun, Charles J. (1983) “Corporate Culture, Environment and Strategy,” Human
Resource Management, Vol.22, Issue ½.
Fombrun, Charles J. (1984) “Structures of Organizational Governance,” Human Relations,
Vol.37, Issue 3, pp.207-223.
Gaski, J.F. and H.J. Etzel (1986), “The Index of Consumer Sentiment toward Marketing,”
Journal of Marketing, 50, 71-81.
Goleman, D. (1998), “Leader?” Harvard Business Review, Vol.76, Issue 6.
Grant, Robert M. (1991), "The Resource-Based Theory of Competitive Advantage:
Implications for Strategy Formulation,” California Management Review (Spring),
114-35.
Gray, B., Matear, S., Boshoff and Matheson (1998), “Developing a Better Measure of Market
Orientation,” European Journal of Marketing, Vol.32, issue 9/10.
Greenley, G.E. (1995a), “Market Orientation and Company Performance: Empirical
Evidence from U.K. Companies,” British Journal of Management, Vol.6, Issue 1.
Greenley, G.E. (1995b), “Forms of Market Orientation in UK Companies,” Journal of
Management Studies, Vol.32, Issue 1.
Han, J., Kim N. and Rajendra K. Srivastava (1998), “Market orientation and Organizational
Performance: is Innovation a Missing Link?” Journal of Marketing, Vol.62, Issue 4.
Harris, Loyd C. and Ogbonna, E. (2001), Leadership Style and Market Orientation: An
Empirical Study,” European Journal of Marketing, Vol.35, Issue 5/6.
Hart, S. and Diamantopoulos, A. (1993), “Linking Market Orientation and Company
Performance: Preliminary Evidence on Kohli and Jaworski’s Framework,” Journal of
Strategic Marketing, Vol.1, Issue 2.
Heskett, James L., Sasser Jr, W.E. and Leonard A. Schlesinger (1997), “What is Strategy?”
Harvard Business Review, Vol.75, Issue 2.
25
Hofstede, Geert (1991), Cultures and Organizations: Software of the Mind, London:
McGraw-Hill Book Company.
Hooley, G., Greenley, G., Fahy J. and Cadogan, J. (2001),”Market-focused Resources,
Competitive Positioning and Firm Performance,” Journal of Marketing Management,
Vol.17, Issue 5/6.
Hooley, Graham J., Saunders, John A. and Piercy, Nigel F.(1998), “Marketing Strategy and
Competitive Positioning,” London: Prentice Hall Europe.
Hunt, Shelby D. (2001), “Commentary: A General theory of Competition: Issues, Answers
and an invitation”, European Journal of Marketing, Vol. 35, nr. 5/6, pp. 524-48.
Hunt, Shelby. D. and Robert M. Morgan (1995), “The Comparative Advantage Theory of
Competition”, Journal of Marketing, Vol. 59, April, pp. 1-15.
Hunt, Shelby. D and Robert M. Morgan (1996), “The Resource-advantage theory of
competition: dynamics, path dependencies, and evolutionary dimensions”, Journal of
Marketing, vol. 60, October, pp. 107-14.
Hurley, Robert F. and Hult, G. (1998), “Innovation, Market Orientation and Organizational
Learning: An Integration and Empirical Examination,” Journal of Marketing, Vol.62,
Issue 3.
Interview-IPM (1974 and 1981), Consumentisme, een Onderzoek naar de Consument in een
Veranderende Samenleving, Amsterdam/Schiedam.
Kirca, Ahmet H., Jayachandran, Satish and William O. Bearden (2005), Market Orientation:
a Meta-Analytic Review and Assessment of Its Antecedents and Impact on Performance,
Journal of Marketing, April, vol. 69, Issue 2, 24-41.
Kohli, Ajay K. and Bernard Jaworski (1990), “Market Orientation; The Construct, Research
Propositions, and Managerial Implications,” Journal of Marketing, 54, (April), 1-18.
Kohli, Ajay K., Bernard Jaworski and Kumar (1993), “MARKOR: A Measure of Market
orientation,” Journal of Marketing Research, Vol.30, Issue 4.
Lafferty, Barbara A. and G. Tomas M. Hult (2001), “A synthesis of contemporary market
orientation perspectives”, European Journal of Marketing, vol. 35, no. 1/2, pp. 92-109.
Langerak, F. (2001), “Effects of Market orientation on the Behaviors of Salespersons and
Purchasers, Channel Relationships and Performance Manufacturers,” International
Journal of Research in Marketing, Vol.18, Issue 3.
Lukas, Bryan A. and Ferrell, O.C. (2000), “The Effect of Market Orientation on Product
Innovation,” Journal of the Academy of Marketing Science, Vol.28, Issue 2.
MacKenzie, S.B., Podsakoff, P.M and G.,A. Rich (2001), Transformational Leadership and
Salesperson Performance, Journal of the Academy of Marketing Science, Vol. 29, Issue 2,
115-135.
26
Matear, Sheelagh, Osborne, Phil, Garrett, Tony and Brendan J. Gray (2002), “How Does
Market Orientation Contribute to Service Firm Performance? An Examination of
Alternative Mechanisms”, European Journal of Marketing, vol. 36, nr. 9/10, pp. 1058-
1075.
Matsuno, Ken and John T. Mentzer (2000), “The Effects of Strategy Type on the Market
Orientation-Performance Relationship”, Journal of Marketing, vol. 64, nr. 4, pp. 1-16.
Mavondo, Felix T. (1999), “Market Orientation: Scale Invariance and Relationship to
Generic Strategies Across Two Countries”, Journal of Market Focused Management,
vol. 4, pp. 125-142.
Miller, Danny (1986), “Configurations of Strategy and Structure: Towards a Synthesis,”
Strategies Management Journal, 7, 233-50.
Miller, Danny and Henry Mintzberg (1983), “The Case for Configuration.” in Gareth Morgan
(ed.), Beyond Method: Strategies for Social Research, Sage Publications.
Mühlbacher, Hans, Wilfried Vyslozil and Angelika Ritter (1987), “Strategic Marketing and
Corporate Culture – an Analysis of Fit,” in Contemporary Research in Marketing,
Proceedings XVI EMAC Conference, Peter S.H. Leeflang and Marshall Rice, eds.
Toronto, WB32-46.
Narver, John C. and Stanley F. Slater (1990), “The Effect of a Marketing Orientation on
Business Profitability,” Journal of Marketing 54 (October), 20-35.
Narver, John C. and Stanley F. Slater (1998), “Customer-Led and Market-Oriented: Let’s Not
Confuse the Two,” Strategic Management Journal, Vol.19, Issue 10.
Pelham, Alfred M. and David T. Wilson (1996), A Longitudinal Study of the Impact of
Market Structure, Firm Structure, Strategy, and Market Orientation Culture on
Dimensions of Small-Firm Performance,” Journal of the Academy of Marketing
Science, Vol.24, Issue 1.
Peters, Thomas J. and Richard H. Waterman (1982), In Search of Excellence: Lessons from
America’s Best-Run Companies, New York: Harper and Row.
Piercy, Nigel and Kenneth J. Peattie (1988), “Matching Marketing Strategies to Corporate
Culture: The Parcel and The Wall,” Journal of General Management, Vol.13, Issue 4.
Quinn, R.E. (1988), “Beyond Rational Management,” Jossey-Bass, San Francisco, CA
Robbins, S.P. and M. Coulter (2002), Management, Prentice-Hall, Upper Saddle River, NJ.
Rodiguez Cano, Cynthia, Carrillat, Francois A. and Fernando Jaramillo (2004), “A Meta-
Analysis of the Relationship Between Market Orientation and Business Performance:
Evidence from Five Continents”, International Journal of Research in Marketing, vol
21, pp. 179-200.
Ruekert, Robert W. (1992), “Developing a Market Orientation: An Organization Strategy
Perspective,” International Journal of Research in Marketing, 9, 225-45.
27
Sargeant, A. and Mohamad, M. (1999), “Business Performance in the UK Hotel Sector: Does
it pay to be Market Driven?” Service Industries Journal, Vol.19, Issue 3.
Schein, Virginia E. (1985),”Organizational Realities: The Politics of Change,” Training &
Development Journal, Vol. 39, Issue 2.
Selnes, Fred and Peter Wesenberg (1992), Organizational Processes in Becoming More
Market Oriented, Sandvika: Norwegian Institute for Research in Marketing, Working
Paper 92-09.
Siguaw, Judy A. and Adamantios Diamantopoulos (1995), “Measuring Market Orientation:
Some Evidence on Narver and Slater’s Three-component Scale,” Journal of Strategic
Marketing, Vol.3, Issue 2.
Slater, Stanley F. (2001), “Market orientation at the beginning of a new millennium”,
Managing Service Quality, Vol. 11, nr. 4, pp. 230-232.
Slater, Stanley and John C. Narver (1995), “Market orientation and the learning
organization”, Journal of Marketing, Vol. 59, July, pp. 63-74.
Tichy, Noel M. (1982),” Managing Change Strategically: The Technical, Political, and
Cultural Keys,” Organizational Dynamics, Vol. 1, Issue 2, p59-80.
Treacy, Michael and Fred Wiersema (1995), “The Discipline of Retail Market Leaders,”
Chain Store Age Executive with Shopping Center Age, Vol. 71, Issue 4
Trice, Harrison M. and Janice M. Beyer (1993), “The Cultures of Work Organizations,”
Englewood Cliffs, New York: Prentice Hall.
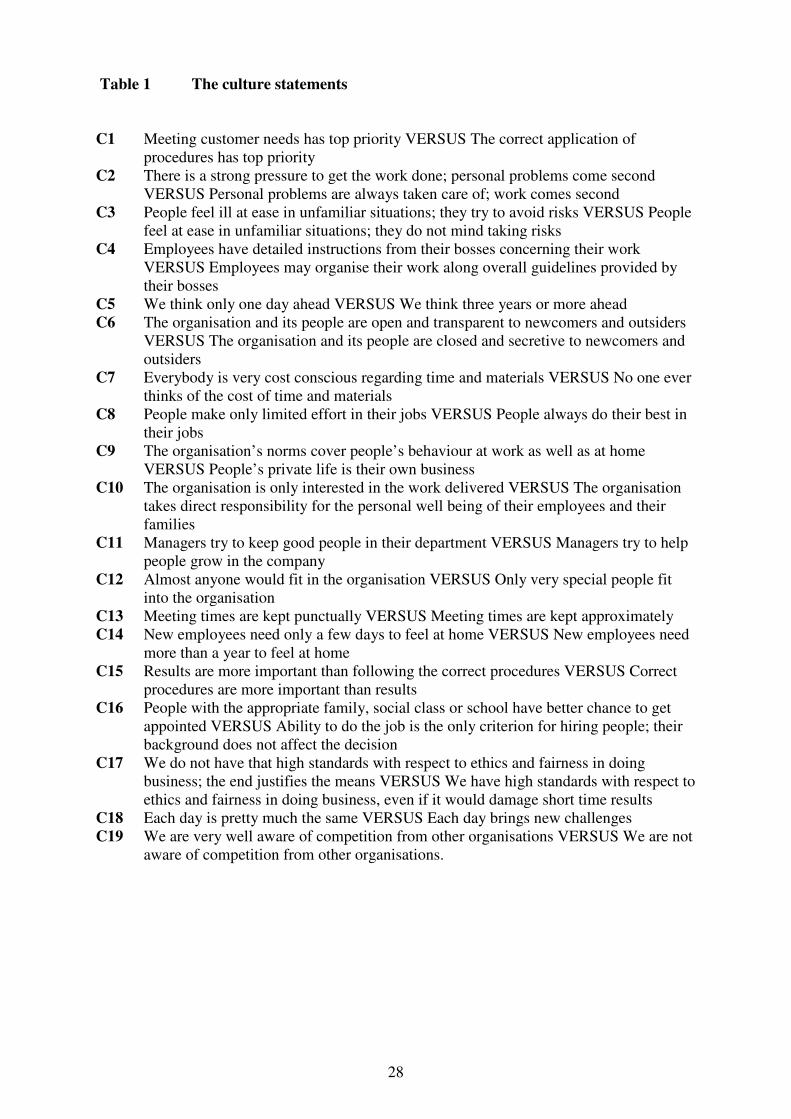
28
Table 1 The culture statements
C1 Meeting customer needs has top priority VERSUS The correct application of
procedures has top priority
C2 There is a strong pressure to get the work done; personal problems come second
VERSUS Personal problems are always taken care of; work comes second
C3 People feel ill at ease in unfamiliar situations; they try to avoid risks VERSUS People
feel at ease in unfamiliar situations; they do not mind taking risks
C4 Employees have detailed instructions from their bosses concerning their work
VERSUS Employees may organise their work along overall guidelines provided by
their bosses
C5 We think only one day ahead VERSUS We think three years or more ahead
C6 The organisation and its people are open and transparent to newcomers and outsiders
VERSUS The organisation and its people are closed and secretive to newcomers and
outsiders
C7 Everybody is very cost conscious regarding time and materials VERSUS No one ever
thinks of the cost of time and materials
C8 People make only limited effort in their jobs VERSUS People always do their best in
their jobs
C9 The organisation’s norms cover people’s behaviour at work as well as at home
VERSUS People’s private life is their own business
C10 The organisation is only interested in the work delivered VERSUS The organisation
takes direct responsibility for the personal well being of their employees and their
families
C11 Managers try to keep good people in their department VERSUS Managers try to help
people grow in the company
C12 Almost anyone would fit in the organisation VERSUS Only very special people fit
into the organisation
C13 Meeting times are kept punctually VERSUS Meeting times are kept approximately
C14 New employees need only a few days to feel at home VERSUS New employees need
more than a year to feel at home
C15 Results are more important than following the correct procedures VERSUS Correct
procedures are more important than results
C16 People with the appropriate family, social class or school have better chance to get
appointed VERSUS Ability to do the job is the only criterion for hiring people; their
background does not affect the decision
C17 We do not have that high standards with respect to ethics and fairness in doing
business; the end justifies the means VERSUS We have high standards with respect to
ethics and fairness in doing business, even if it would damage short time results
C18 Each day is pretty much the same VERSUS Each day brings new challenges
C19 We are very well aware of competition from other organisations VERSUS We are not
aware of competition from other organisations.
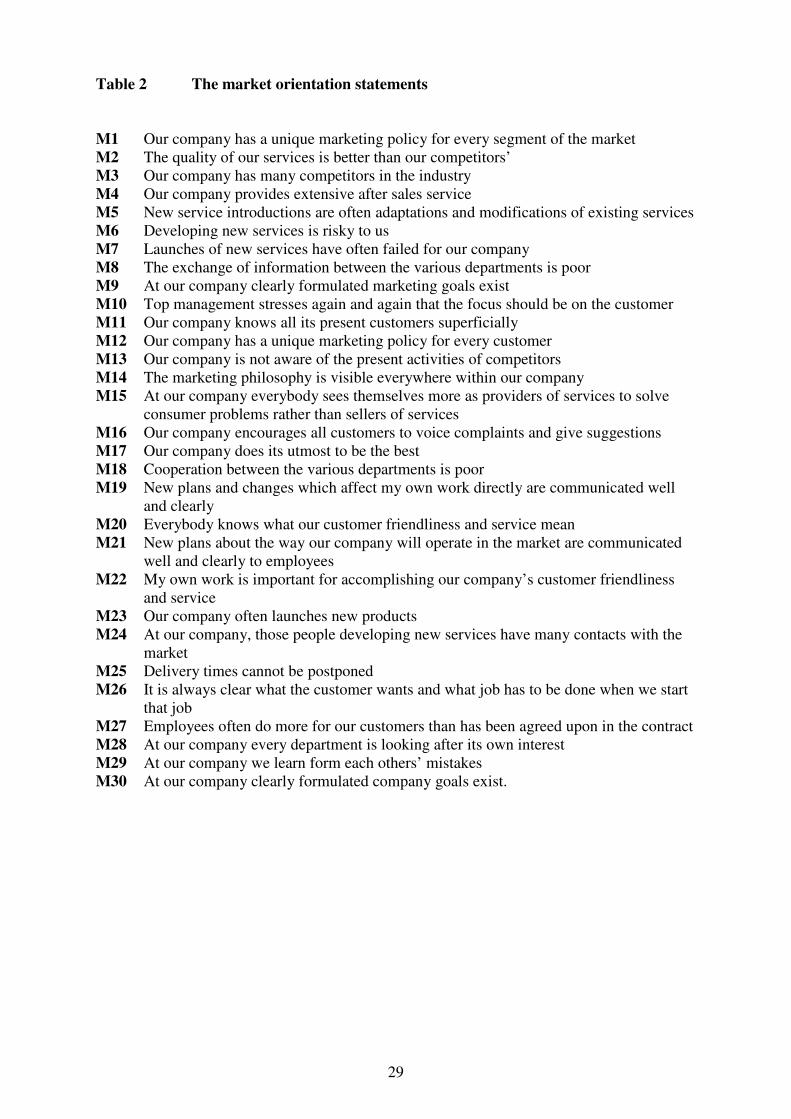
29
Table 2 The market orientation statements
M1 Our company has a unique marketing policy for every segment of the market
M2 The quality of our services is better than our competitors’
M3 Our company has many competitors in the industry
M4 Our company provides extensive after sales service
M5 New service introductions are often adaptations and modifications of existing services
M6 Developing new services is risky to us
M7 Launches of new services have often failed for our company
M8 The exchange of information between the various departments is poor
M9 At our company clearly formulated marketing goals exist
M10 Top management stresses again and again that the focus should be on the customer
M11 Our company knows all its present customers superficially
M12 Our company has a unique marketing policy for every customer
M13 Our company is not aware of the present activities of competitors
M14 The marketing philosophy is visible everywhere within our company
M15 At our company everybody sees themselves more as providers of services to solve
consumer problems rather than sellers of services
M16 Our company encourages all customers to voice complaints and give suggestions
M17 Our company does its utmost to be the best
M18 Cooperation between the various departments is poor
M19 New plans and changes which affect my own work directly are communicated well
and clearly
M20 Everybody knows what our customer friendliness and service mean
M21 New plans about the way our company will operate in the market are communicated
well and clearly to employees
M22 My own work is important for accomplishing our company’s customer friendliness
and service
M23 Our company often launches new products
M24 At our company, those people developing new services have many contacts with the
market
M25 Delivery times cannot be postponed
M26 It is always clear what the customer wants and what job has to be done when we start
that job
M27 Employees often do more for our customers than has been agreed upon in the contract
M28 At our company every department is looking after its own interest
M29 At our company we learn form each others’ mistakes
M30 At our company clearly formulated company goals exist.
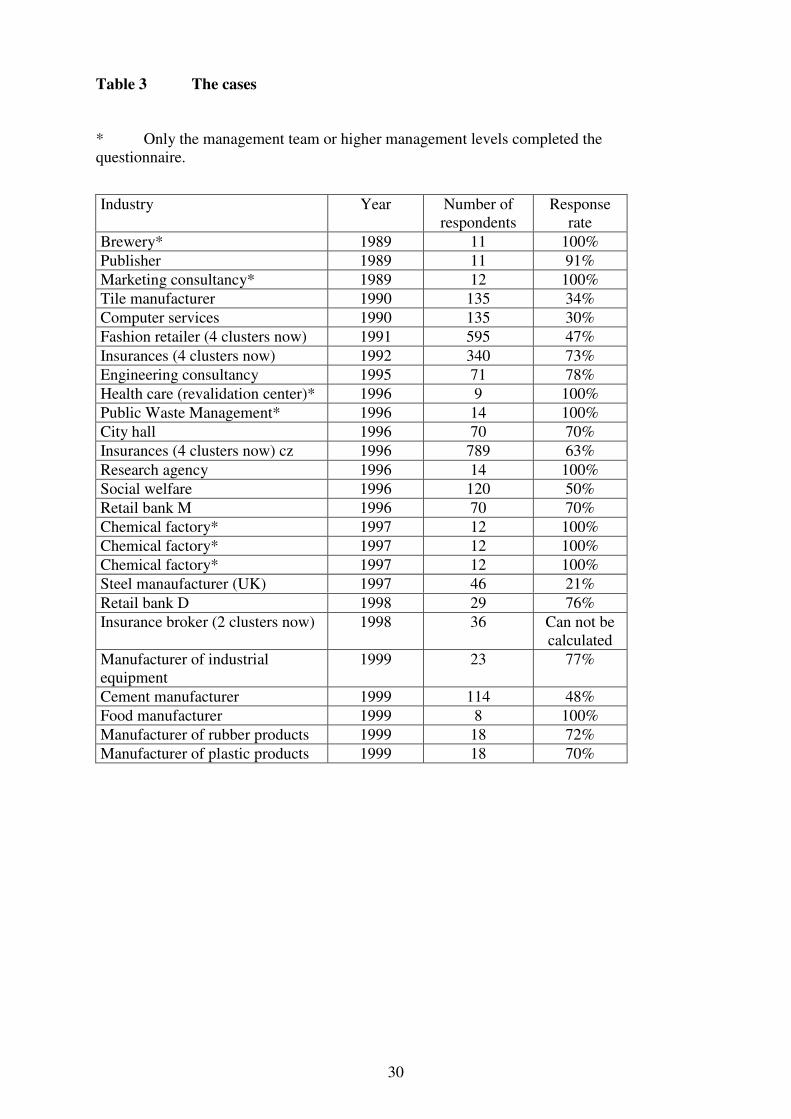
30
Table 3 The cases
* Only the management team or higher management levels completed the
questionnaire.
Industry Year Number of
respondents
Response
rate
Brewery* 1989 11 100%
Publisher 1989 11 91%
Marketing consultancy* 1989 12 100%
Tile manufacturer 1990 135 34%
Computer services 1990 135 30%
Fashion retailer (4 clusters now) 1991 595 47%
Insurances (4 clusters now) 1992 340 73%
Engineering consultancy 1995 71 78%
Health care (revalidation center)* 1996 9 100%
Public Waste Management* 1996 14 100%
City hall 1996 70 70%
Insurances (4 clusters now) cz 1996 789 63%
Research agency 1996 14 100%
Social welfare 1996 120 50%
Retail bank M 1996 70 70%
Chemical factory* 1997 12 100%
Chemical factory* 1997 12 100%
Chemical factory* 1997 12 100%
Steel manaufacturer (UK) 1997 46 21%
Retail bank D 1998 29 76%
Insurance broker (2 clusters now) 1998 36 Can not be
calculated
Manufacturer of industrial
equipment
1999 23 77%
Cement manufacturer 1999 114 48%
Food manufacturer 1999 8 100%
Manufacturer of rubber products 1999 18 72%
Manufacturer of plastic products 1999 18 70%
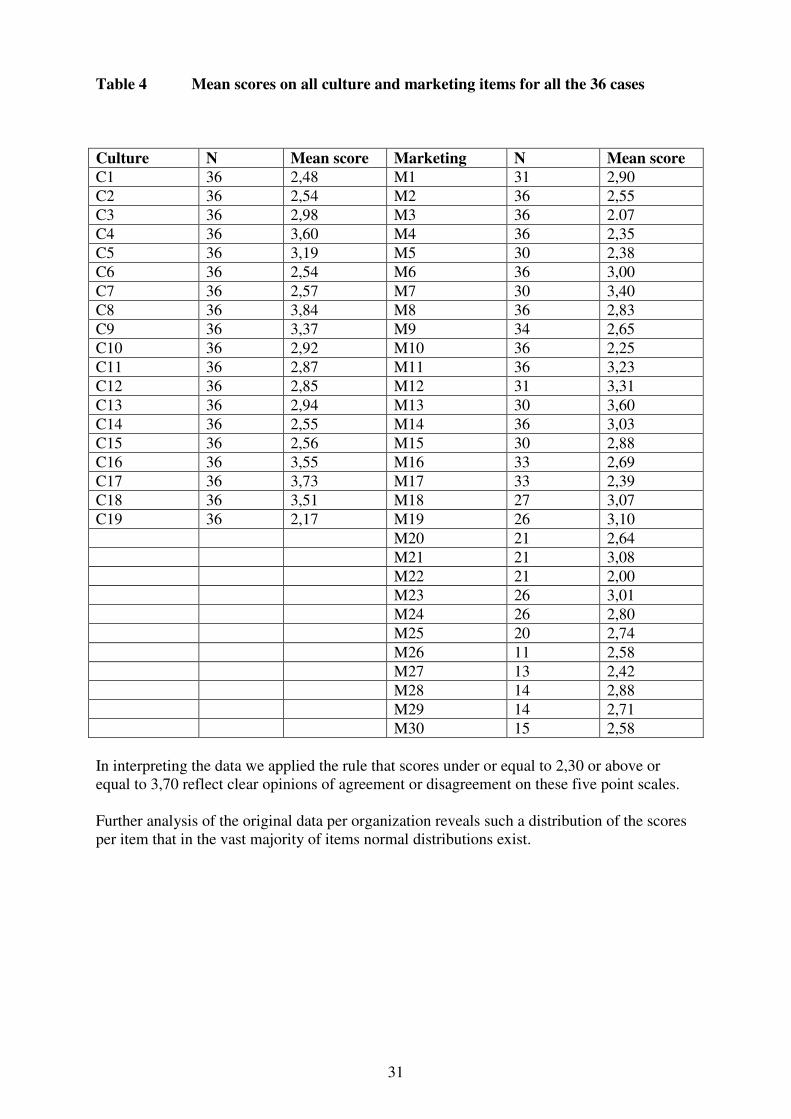
31
Table 4 Mean scores on all culture and marketing items for all the 36 cases
Culture N Mean score Marketing N Mean score
C1 36 2,48 M1 31 2,90
C2 36 2,54 M2 36 2,55
C3 36 2,98 M3 36 2.07
C4 36 3,60 M4 36 2,35
C5 36 3,19 M5 30 2,38
C6 36 2,54 M6 36 3,00
C7 36 2,57 M7 30 3,40
C8 36 3,84 M8 36 2,83
C9 36 3,37 M9 34 2,65
C10 36 2,92 M10 36 2,25
C11 36 2,87 M11 36 3,23
C12 36 2,85 M12 31 3,31
C13 36 2,94 M13 30 3,60
C14 36 2,55 M14 36 3,03
C15 36 2,56 M15 30 2,88
C16 36 3,55 M16 33 2,69
C17 36 3,73 M17 33 2,39
C18 36 3,51 M18 27 3,07
C19 36 2,17 M19 26 3,10
M20 21 2,64
M21 21 3,08
M22 21 2,00
M23 26 3,01
M24 26 2,80
M25 20 2,74
M26 11 2,58
M27 13 2,42
M28 14 2,88
M29 14 2,71
M30 15 2,58
In interpreting the data we applied the rule that scores under or equal to 2,30 or above or
equal to 3,70 reflect clear opinions of agreement or disagreement on these five point scales.
Further analysis of the original data per organization reveals such a distribution of the scores
per item that in the vast majority of items normal distributions exist.
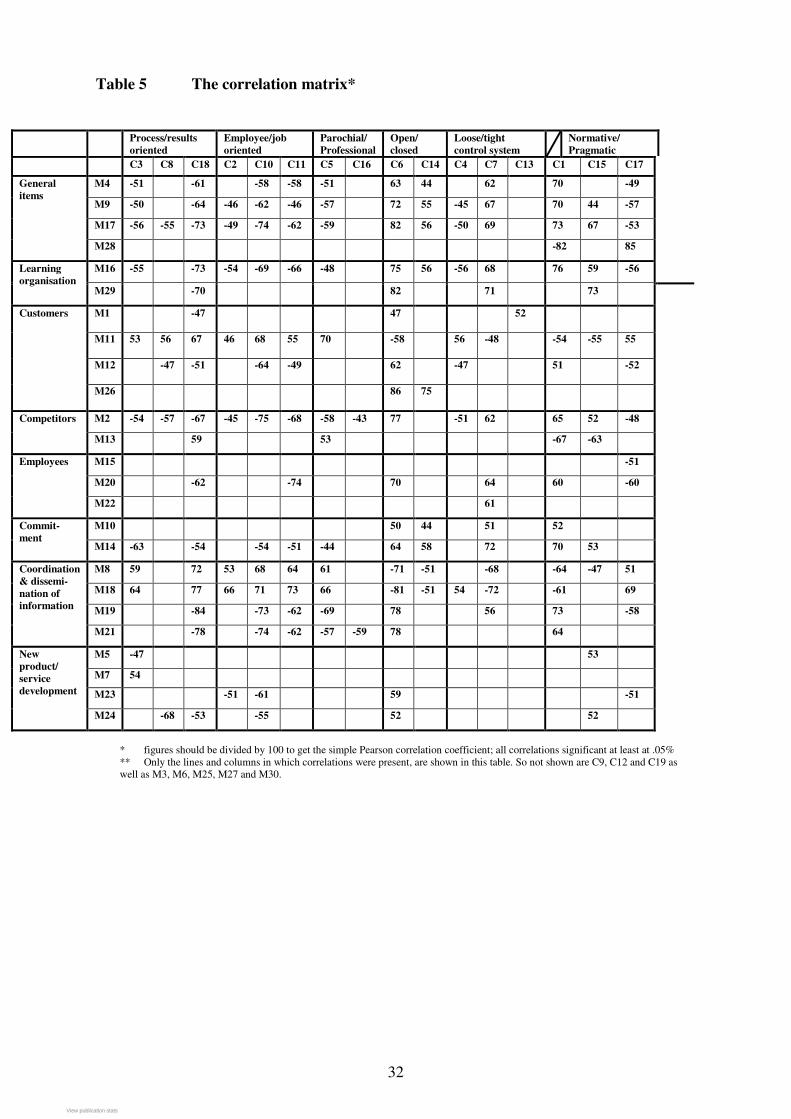
32
Table 5 The correlation matrix*
Process/results
oriented
Employee/job
oriented
Parochial/
Professional
Open/
closed
Loose/tight
control system
Normative/
Pragmatic
C3 C8 C18 C2 C10 C11 C5 C16 C6 C14 C4 C7 C13 C1 C15 C17
M4 -51 -61 -58 -58 -51 63 44 62 70 -49
M9 -50 -64 -46 -62 -46 -57 72 55 -45 67 70 44 -57
M17 -56 -55 -73 -49 -74 -62 -59 82 56 -50 69 73 67 -53
General
items
M28 -82 85
M16 -55 -73 -54 -69 -66 -48 75 56 -56 68 76 59 -56 Learning
organisation M29 -70 82 71 73
M1 -47 47 52
M11 53 56 67 46 68 55 70 -58 56 -48 -54 -55 55
M12 -47 -51 -64 -49 62 -47 51 -52
Customers
M26 86 75
M2 -54 -57 -67 -45 -75 -68 -58 -43 77 -51 62 65 52 -48 Competitors
M13 59 53 -67 -63
M15 -51
M20 -62 -74 70 64 60 -60
Employees
M22 61
M10 50 44 51 52 Commit-
ment M14 -63 -54 -54 -51 -44 64 58 72 70 53
M8 59 72 53 68 64 61 -71 -51 -68 -64 -47 51
M18 64 77 66 71 73 66 -81 -51 54 -72 -61 69
M19 -84 -73 -62 -69 78 56 73 -58
Coordination
& dissemi-
nation of
information
M21 -78 -74 -62 -57 -59 78 64
M5 -47 53
M7 54
M23 -51 -61 59 -51
New
product/
service
development
M24 -68 -53 -55 52 52
* figures should be divided by 100 to get the simple Pearson correlation coefficient; all correlations significant at least at .05%
** Only the lines and columns in which correlations were present, are shown in this table. So not shown are C9, C12 and C19 as
well as M3, M6, M25, M27 and M30.
View publication statsView publication stats